Crew of the Thomas J. Brown pulling in slack line from a barge. © Carolina Salguero SUPPORT THE WORKING WATERFRONT 42

Welcome message from author
This document is posted to help you gain knowledge. Please leave a comment to let me know what you think about it! Share it to your friends and learn new things together.
Transcript
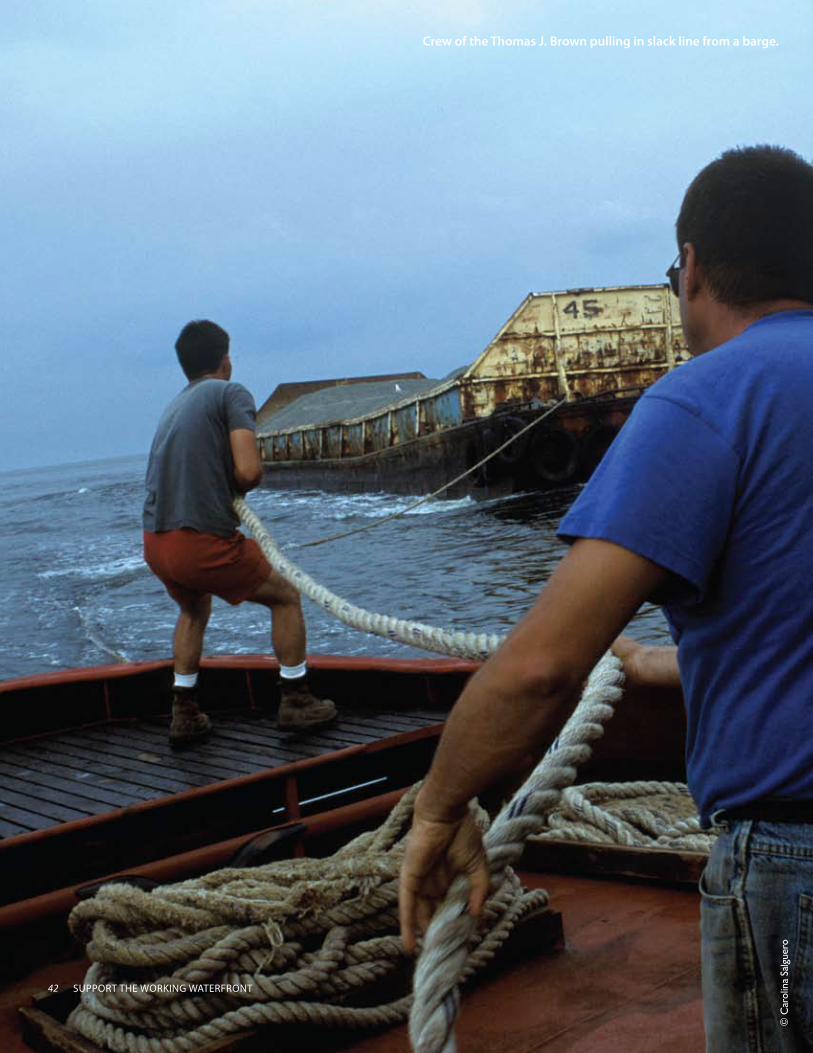
Crew of the Thomas J. Brown pulling in slack line from a barge.
© C
arol
ina
Salg
uero
SUPPORT THE WORKING WATERFRONT42
43VISION 2020: NEW YORK CITY COMPREHENSIVE WATERFRONT PLAN VISION 2020: THE NEW YORK CITY COMPREHENSIVE WATERFRONT PLAN 43
Support economic development activity on the working waterfront.
GOAL 3
VISION 2020: NEW YORK CITY COMPREHENSIVE WATERFRONT PLAN 43
SUPPORT THE WORKING WATERFRONT44
PORT COMMERCE AND SHIPPING
As New York reinvents portions of the waterfront for living, playing, and relaxing, it is critical to invest in the parts of the waterfront devoted to working. The working waterfront is vital to the economy of the city. It is home to the Port of New York and New Jersey—the third biggest port in the country and the premier maritime complex on the East Coast—as well as the many tugboat and barge operators, marinas, and ship-repair outfits that provide maritime support services to the Port. The waterfront is not only the preferable place of business for many firms, it is essential to their daily operations. And workers, in turn, depend on these businesses for their livelihoods.
Over the last half-century, the ports, mari-time support services, and other industries that make up New York’s working waterfront have changed in profound ways, both technological and economic. Although the waterfront no lon-ger teems with stevedores loading and unload-ing ships tied up to docks lining the waterfront, port activities are essential to the movement of goods and materials into the New York met-ropolitan region, the largest consumer market in North America. As a result of advances in shipping technology, primarily the develop-ment of containerized shipping, waterborne freight operations have been consolidated and now occupy a smaller number of facilities, even though the total volume of goods shipped into New York has grown considerably. Volumes are expected to continue to increase, and so will demands on maritime support services. At the same time, changes to global shipping pat-terns that will result from the expansion of the Panama Canal have implications for the Port and the many businesses that sustain it.
The changes in global shipping, together with long-term economic trends, have also af-fected New York City’s industrial businesses. In-dustrial uses, which once occupied much of the shoreline, are no longer a dominant presence on the waterfront, with the industrial sector in decline here as elsewhere in the country, and with many manufacturers today not obligated to locate on the shoreline for export purposes. The City has made important efforts to sup-
port the remaining industries on the waterfront as well as address the legacy of past industry—cleaning up brownfield sites and finding new uses for buildings dating to manufacturing’s hey-day. However, much more needs to be done to support and attract industry on the waterfront.
The City must also contend with maintaining the vast public waterfront infrastructure devel-oped to support maritime businesses—much of it created at a time when New York was still a manufacturing powerhouse with a sizable ex-port trade. This infrastructure includes the pub-licly owned marine terminals such as the Hunts Point Terminal in the Bronx, New York Con-tainer Terminal in Staten Island, Bush Terminal in Brooklyn, and the cruise terminals in Man-hattan and Brooklyn. Many piers, boat tie-ups, and bulkheads are also publicly owned. With less use, much of this small-scale infrastructure is in deteriorating condition, but fishermen, dis-tributors, and other local businesses still depend on it in many locations. Maintenance of these facilities is critical to the efficiency and safety of water-dependent businesses on the working waterfront.
As manufacturing has declined, other sec-tors of the economy have grown, and this has brought increased demands for housing and services. It is important to find ways to maxi-mize investment on the waterfront while inte-grating maritime activity. Other challenges facing the working waterfront today include promot-ing more environmentally sustainable business operations along the shore and providing public access where feasible.
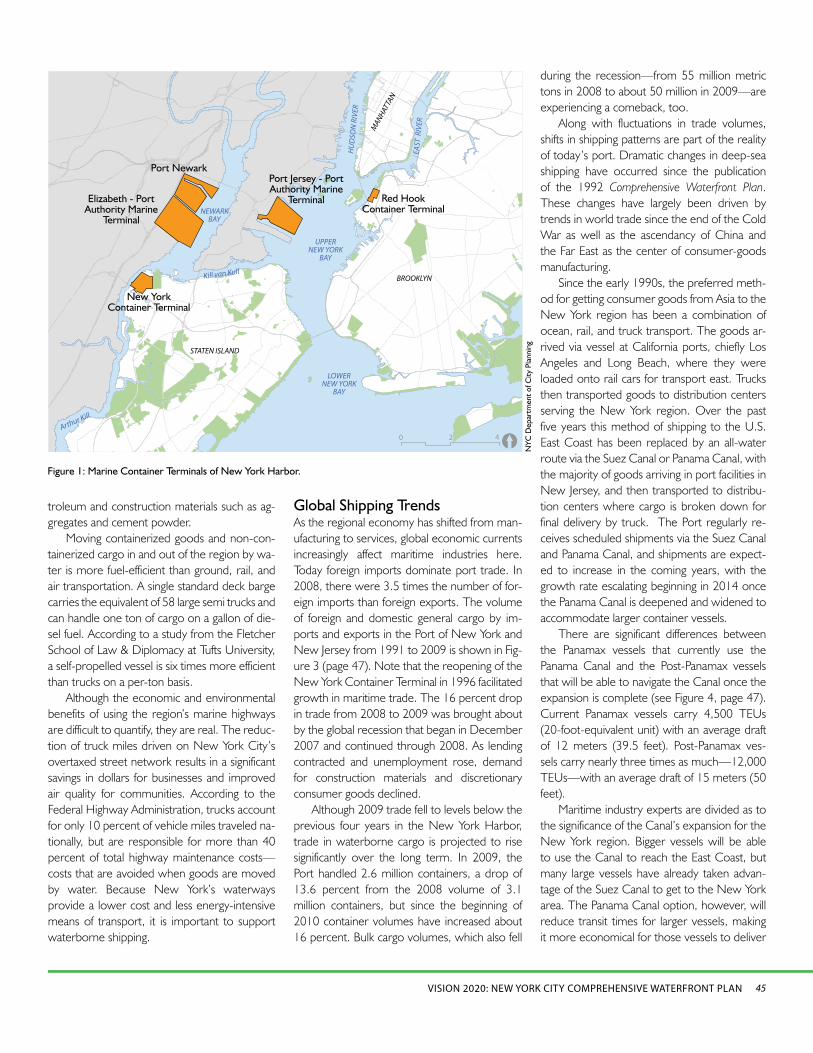
From its founding as a Dutch trading post, New York has always been a port city. Today the Port of New York and New Jersey is a thriving network of public and private marine terminals (see Figure 1, page 45) that together make up the third largest port complex in the continental United States. Most other major ports are on the Gulf of Mexico, as seen in Figure 2 (page 46), which shows the 25 largest ports in the continental U.S. and the 25 U.S. counties with the most jobs in water transportation and mari-time support services. This locale provides a year-round moderate climate that is advanta-geous in ship repair; serves as the gateway to the Mississippi River, the shipping channel for much of America’s agricultural, coal, and petro-leum products; and functions as the base for a large segment of America’s fishing fleet.
Although New York doesn’t have the cli-mate advantages of the Gulf, it remains the larg-est East Coast port. In 2009, the Port of New York and New Jersey received 4,430 calls from vessels of all types, nearly twice as many as the next largest East Coast port, in Norfolk, Vir-ginia. The Port supplies goods to a consumer shed stretching from Canada to Pennsylvania and into the Midwest.
About half of the vessels calling on the Port carry containers filled with goods including chemicals, machinery, food, clothes, shoes, and other consumer products. The Port handles a tremendous volume of non-containerized cargo as well. Bulk cargo volumes include pe-
“You can’t get things done in the Harbor without barges like ours. You need barges to dredge the channels. You need them to build bridges, piers, and bulkheads. You need them to maintain all the rest of the marine infrastructure on which New York depends.”—Bob Hughes, owner of Hughes Bros. Incorporated, a six-generation family business
SUPPORT THE WORKING WATERFRONT GOAL 3
45VISION 2020: NEW YORK CITY COMPREHENSIVE WATERFRONT PLAN
troleum and construction materials such as ag-gregates and cement powder.
Moving containerized goods and non-con-tainerized cargo in and out of the region by wa-ter is more fuel-efficient than ground, rail, and air transportation. A single standard deck barge carries the equivalent of 58 large semi trucks and can handle one ton of cargo on a gallon of die-sel fuel. According to a study from the Fletcher School of Law & Diplomacy at Tufts University, a self-propelled vessel is six times more efficient than trucks on a per-ton basis.
Although the economic and environmental benefits of using the region’s marine highways are difficult to quantify, they are real. The reduc-tion of truck miles driven on New York City’s overtaxed street network results in a significant savings in dollars for businesses and improved air quality for communities. According to the Federal Highway Administration, trucks account for only 10 percent of vehicle miles traveled na-tionally, but are responsible for more than 40 percent of total highway maintenance costs—costs that are avoided when goods are moved by water. Because New York’s waterways provide a lower cost and less energy-intensive means of transport, it is important to support waterborne shipping.
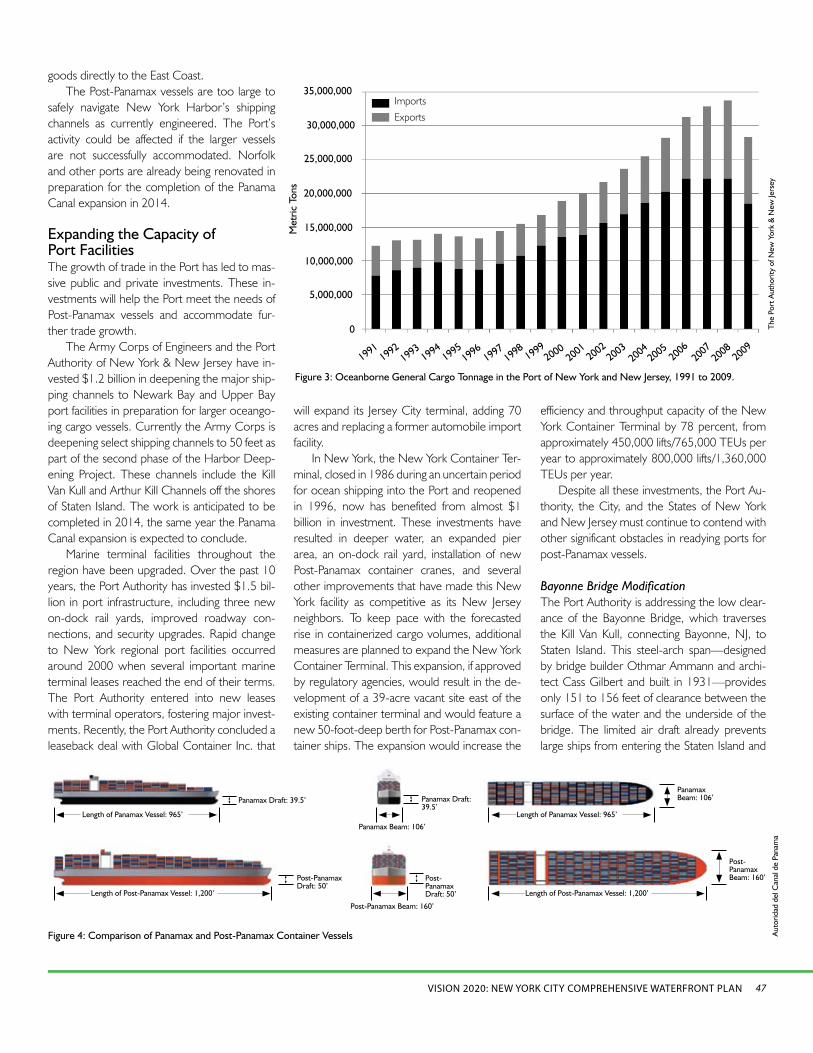
Global Shipping TrendsAs the regional economy has shifted from man-ufacturing to services, global economic currents increasingly affect maritime industries here. Today foreign imports dominate port trade. In 2008, there were 3.5 times the number of for-eign imports than foreign exports. The volume of foreign and domestic general cargo by im-ports and exports in the Port of New York and New Jersey from 1991 to 2009 is shown in Fig-ure 3 (page 47). Note that the reopening of the New York Container Terminal in 1996 facilitated growth in maritime trade. The 16 percent drop in trade from 2008 to 2009 was brought about by the global recession that began in December 2007 and continued through 2008. As lending contracted and unemployment rose, demand for construction materials and discretionary consumer goods declined.
Although 2009 trade fell to levels below the previous four years in the New York Harbor, trade in waterborne cargo is projected to rise significantly over the long term. In 2009, the Port handled 2.6 million containers, a drop of 13.6 percent from the 2008 volume of 3.1 million containers, but since the beginning of 2010 container volumes have increased about 16 percent. Bulk cargo volumes, which also fell
Figure 1: Marine Container Terminals of New York Harbor.
0 1 2 3 40.5Miles
Marine Terminals of New York Harbor
Marine Terminals
[20 4
LOWER NEW YORK
BAY
UPPERNEW YORK
BAY
NEWARKBAY
Kill van Kull
Arthur Kill
BROOKLYN
STATEN ISLAND
New York Container Terminal
Port Jersey - Port Authority Marine
Terminal Red HookContainer Terminal
Port Newark
Elizabeth - Port Authority Marine
Terminal
HU
DSO
N R
IVER
EAST
RIV
ER
MANHAT
TAN
during the recession—from 55 million metric tons in 2008 to about 50 million in 2009—are experiencing a comeback, too.
Along with fluctuations in trade volumes, shifts in shipping patterns are part of the reality of today’s port. Dramatic changes in deep-sea shipping have occurred since the publication of the 1992 Comprehensive Waterfront Plan. These changes have largely been driven by trends in world trade since the end of the Cold War as well as the ascendancy of China and the Far East as the center of consumer-goods manufacturing.
Since the early 1990s, the preferred meth-od for getting consumer goods from Asia to the New York region has been a combination of ocean, rail, and truck transport. The goods ar-rived via vessel at California ports, chiefly Los Angeles and Long Beach, where they were loaded onto rail cars for transport east. Trucks then transported goods to distribution centers serving the New York region. Over the past five years this method of shipping to the U.S. East Coast has been replaced by an all-water route via the Suez Canal or Panama Canal, with the majority of goods arriving in port facilities in New Jersey, and then transported to distribu-tion centers where cargo is broken down for final delivery by truck. The Port regularly re-ceives scheduled shipments via the Suez Canal and Panama Canal, and shipments are expect-ed to increase in the coming years, with the growth rate escalating beginning in 2014 once the Panama Canal is deepened and widened to accommodate larger container vessels.
There are significant differences between the Panamax vessels that currently use the Panama Canal and the Post-Panamax vessels that will be able to navigate the Canal once the expansion is complete (see Figure 4, page 47). Current Panamax vessels carry 4,500 TEUs (20-foot-equivalent unit) with an average draft of 12 meters (39.5 feet). Post-Panamax ves-sels carry nearly three times as much—12,000 TEUs—with an average draft of 15 meters (50 feet).
Maritime industry experts are divided as to the significance of the Canal’s expansion for the New York region. Bigger vessels will be able to use the Canal to reach the East Coast, but many large vessels have already taken advan-tage of the Suez Canal to get to the New York area. The Panama Canal option, however, will reduce transit times for larger vessels, making it more economical for those vessels to deliver
NYC
Dep
artm
ent o
f City
Pla
nnin
g

SUPPORT THE WORKING WATERFRONT46
Figure 2: 25 Largest Ports in the Continental United States
Duluth-Superior, MN and WI
Plaquemines, LA
Plaquemines, LA
Huntington – Tristate
New York, NY and NJ
New York, NY and NJ
Corpus Christi, TX
Corpus Christi, TX
Norfolk, VA
Norfolk, VA
Los Angeles, CA
New Orleans, LA
New Orleans, LA
Long Beach, CA
Pascagoula, MS
Pascagoula, MS
Pittsburgh, PA
Baltimore, MD
Baltimore, MD
Paulsboro, NJ
Paulsboro, NJ
Freeport, TX
Freeport, TX
Savannah, GA
Houston, TX
Houston, TX
Mobile, AL
Mobile, AL
South Louisiana, LA
South Louisiana, LA
Lake Charles, LA
Lake Charles, LA
Philadelphia, PA
Philadelphia, PA
Baton Rouge, LA
Baton Rouge, LA
Port Arthur, TX
Port Arthur, TX
Texas City, TX
Texas City, TX
Beaumont, TX
Beaumont, TX
25 largest ports by tons of traffic25 largest counties by water transportation jobs
Tampa, FL
Cou
nty
Busin
ess
Patt
erns
, Em
ploy
men
t in
Wat
er T
rans
port
atio
n an
d Su
ppor
t Act
iviti
es fo
r W
ater
Tra
nspo
rtat
ion,
200
8; U
nite
d St
ates
Arm
y C
orps
of E
ngin
eers
, Wat
erbo
rne
Com
mer
ce o
f the
Uni
ted
Stat
es, 2
008
47VISION 2020: NEW YORK CITY COMPREHENSIVE WATERFRONT PLAN
Figure 3: Oceanborne General Cargo Tonnage in the Port of New York and New Jersey, 1991 to 2009.
goods directly to the East Coast. The Post-Panamax vessels are too large to
safely navigate New York Harbor’s shipping channels as currently engineered. The Port’s activity could be affected if the larger vessels are not successfully accommodated. Norfolk and other ports are already being renovated in preparation for the completion of the Panama Canal expansion in 2014.
Expanding the Capacity of Port FacilitiesThe growth of trade in the Port has led to mas-sive public and private investments. These in-vestments will help the Port meet the needs of Post-Panamax vessels and accommodate fur-ther trade growth.
The Army Corps of Engineers and the Port Authority of New York & New Jersey have in-vested $1.2 billion in deepening the major ship-ping channels to Newark Bay and Upper Bay port facilities in preparation for larger oceango-ing cargo vessels. Currently the Army Corps is deepening select shipping channels to 50 feet as part of the second phase of the Harbor Deep-ening Project. These channels include the Kill Van Kull and Arthur Kill Channels off the shores of Staten Island. The work is anticipated to be completed in 2014, the same year the Panama Canal expansion is expected to conclude.
Marine terminal facilities throughout the region have been upgraded. Over the past 10 years, the Port Authority has invested $1.5 bil-lion in port infrastructure, including three new on-dock rail yards, improved roadway con-nections, and security upgrades. Rapid change to New York regional port facilities occurred around 2000 when several important marine terminal leases reached the end of their terms. The Port Authority entered into new leases with terminal operators, fostering major invest-ments. Recently, the Port Authority concluded a leaseback deal with Global Container Inc. that
will expand its Jersey City terminal, adding 70 acres and replacing a former automobile import facility.
In New York, the New York Container Ter-minal, closed in 1986 during an uncertain period for ocean shipping into the Port and reopened in 1996, now has benefited from almost $1 billion in investment. These investments have resulted in deeper water, an expanded pier area, an on-dock rail yard, installation of new Post-Panamax container cranes, and several other improvements that have made this New York facility as competitive as its New Jersey neighbors. To keep pace with the forecasted rise in containerized cargo volumes, additional measures are planned to expand the New York Container Terminal. This expansion, if approved by regulatory agencies, would result in the de-velopment of a 39-acre vacant site east of the existing container terminal and would feature a new 50-foot-deep berth for Post-Panamax con-tainer ships. The expansion would increase the
efficiency and throughput capacity of the New York Container Terminal by 78 percent, from approximately 450,000 lifts/765,000 TEUs per year to approximately 800,000 lifts/1,360,000 TEUs per year.
Despite all these investments, the Port Au-thority, the City, and the States of New York and New Jersey must continue to contend with other significant obstacles in readying ports for post-Panamax vessels.
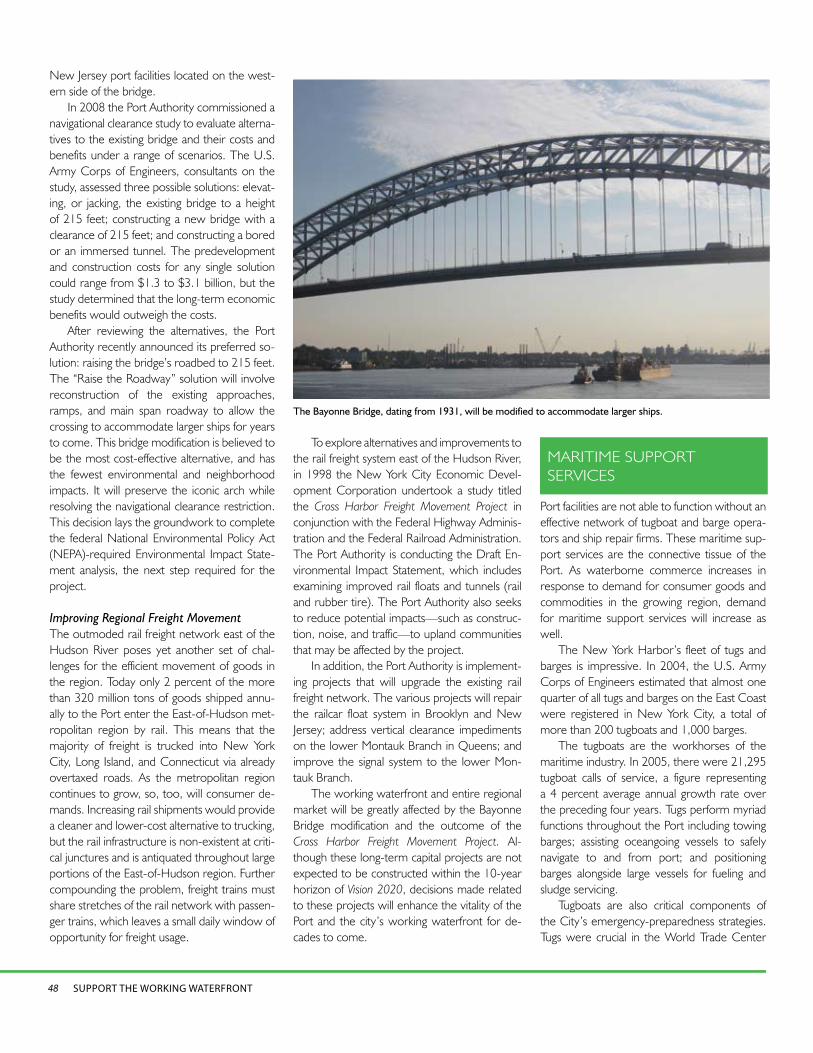
Bayonne Bridge ModificationThe Port Authority is addressing the low clear-ance of the Bayonne Bridge, which traverses the Kill Van Kull, connecting Bayonne, NJ, to Staten Island. This steel-arch span—designed by bridge builder Othmar Ammann and archi-tect Cass Gilbert and built in 1931—provides only 151 to 156 feet of clearance between the surface of the water and the underside of the bridge. The limited air draft already prevents large ships from entering the Staten Island and
Imports
Exports
0
5,000,000
10,000,000
15,000,000
25,000,000
20,000,000
30,000,000
35,000,000
19931992
19941995
19961997
19981999
20002001
20022003
2004
200520
0620
0720
08 2009
1991
The
Por
t Aut
horit
y of
New
Yor
k &
New
Jers
ey
Length of Post-Panamax Vessel: 1,200’ Length of Post-Panamax Vessel: 1,200’
Post-Panamax Beam: 160’
Panamax Beam: 106’
Post-Panamax Draft: 50’
Post-Panamax Beam: 160’
Panamax Beam: 106’
Post-Panamax Draft: 50’
Panamax Draft: 39.5’ Panamax Draft: 39.5’
Length of Panamax Vessel: 965’ Length of Panamax Vessel: 965’
Figure 4: Comparison of Panamax and Post-Panamax Container Vessels Aut
orid
ad d
el C
anal
de
Pana
ma
Met
ric T
ons
SUPPORT THE WORKING WATERFRONT48
New Jersey port facilities located on the west-ern side of the bridge.
In 2008 the Port Authority commissioned a navigational clearance study to evaluate alterna-tives to the existing bridge and their costs and benefits under a range of scenarios. The U.S. Army Corps of Engineers, consultants on the study, assessed three possible solutions: elevat-ing, or jacking, the existing bridge to a height of 215 feet; constructing a new bridge with a clearance of 215 feet; and constructing a bored or an immersed tunnel. The predevelopment and construction costs for any single solution could range from $1.3 to $3.1 billion, but the study determined that the long-term economic benefits would outweigh the costs.
After reviewing the alternatives, the Port Authority recently announced its preferred so-lution: raising the bridge’s roadbed to 215 feet. The “Raise the Roadway” solution will involve reconstruction of the existing approaches, ramps, and main span roadway to allow the crossing to accommodate larger ships for years to come. This bridge modification is believed to be the most cost-effective alternative, and has the fewest environmental and neighborhood impacts. It will preserve the iconic arch while resolving the navigational clearance restriction. This decision lays the groundwork to complete the federal National Environmental Policy Act (NEPA)-required Environmental Impact State-ment analysis, the next step required for the project.
Improving Regional Freight Movement The outmoded rail freight network east of the Hudson River poses yet another set of chal-lenges for the efficient movement of goods in the region. Today only 2 percent of the more than 320 million tons of goods shipped annu-ally to the Port enter the East-of-Hudson met-ropolitan region by rail. This means that the majority of freight is trucked into New York City, Long Island, and Connecticut via already overtaxed roads. As the metropolitan region continues to grow, so, too, will consumer de-mands. Increasing rail shipments would provide a cleaner and lower-cost alternative to trucking, but the rail infrastructure is non-existent at criti-cal junctures and is antiquated throughout large portions of the East-of-Hudson region. Further compounding the problem, freight trains must share stretches of the rail network with passen-ger trains, which leaves a small daily window of opportunity for freight usage.
MARITIME SUPPORT SERVICES
Port facilities are not able to function without an effective network of tugboat and barge opera-tors and ship repair firms. These maritime sup-port services are the connective tissue of the Port. As waterborne commerce increases in response to demand for consumer goods and commodities in the growing region, demand for maritime support services will increase as well.
The New York Harbor’s fleet of tugs and barges is impressive. In 2004, the U.S. Army Corps of Engineers estimated that almost one quarter of all tugs and barges on the East Coast were registered in New York City, a total of more than 200 tugboats and 1,000 barges.
The tugboats are the workhorses of the maritime industry. In 2005, there were 21,295 tugboat calls of service, a figure representing a 4 percent average annual growth rate over the preceding four years. Tugs perform myriad functions throughout the Port including towing barges; assisting oceangoing vessels to safely navigate to and from port; and positioning barges alongside large vessels for fueling and sludge servicing.
Tugboats are also critical components of the City’s emergency-preparedness strategies. Tugs were crucial in the World Trade Center
The Bayonne Bridge, dating from 1931, will be modified to accommodate larger ships.
To explore alternatives and improvements to the rail freight system east of the Hudson River, in 1998 the New York City Economic Devel-opment Corporation undertook a study titled the Cross Harbor Freight Movement Project in conjunction with the Federal Highway Adminis-tration and the Federal Railroad Administration. The Port Authority is conducting the Draft En-vironmental Impact Statement, which includes examining improved rail floats and tunnels (rail and rubber tire). The Port Authority also seeks to reduce potential impacts—such as construc-tion, noise, and traffic—to upland communities that may be affected by the project.
In addition, the Port Authority is implement-ing projects that will upgrade the existing rail freight network. The various projects will repair the railcar float system in Brooklyn and New Jersey; address vertical clearance impediments on the lower Montauk Branch in Queens; and improve the signal system to the lower Mon-tauk Branch.
The working waterfront and entire regional market will be greatly affected by the Bayonne Bridge modification and the outcome of the Cross Harbor Freight Movement Project. Al-though these long-term capital projects are not expected to be constructed within the 10-year horizon of Vision 2020, decisions made related to these projects will enhance the vitality of the Port and the city’s working waterfront for de-cades to come.

49VISION 2020: NEW YORK CITY COMPREHENSIVE WATERFRONT PLAN
With the aid of a tugboat, the Vega Nikolas container ship turns around in the Upper New York Harbor to berth at Pier 10 at the Red Hook Container Terminal, Brooklyn.
New Jersey. Due to limited pier and bulkhead space, boats may tie up alongside other docked vessels and moor at buoys in the open water.
Ship repair facilities are also in short supply in the New York/New Jersey area, particularly after a number of facilities were converted to other uses over the last decade. This has led vessel operators to seek services outside of the region. There are currently 14 ship repair fa-cilities in New York City—three at the Brooklyn Navy Yard and 11 in Staten Island, all construct-ed in the early part of the 20th century. In 2007, according to the MSSLS, New York City had an unmet demand of approximately 35 repair docks (including graving and dry docks), but by 2016 that unmet demand may nearly double.
The study did not examine the economic feasibility of providing these facilities compared with the alternative of obtaining services in oth-er areas on the East Coast. The costs of land acquisition, construction, and labor in New York
City are substantially higher than they are in Baltimore, Maryland, or in Norfolk, Virginia—the closest competing ports—placing New York City at a cost disadvantage in developing new repair facilities. Without subsidy and tech-nical assistance, new ship repair facilities are un-likely to be built. Given the financial hurdles in developing new graving docks and dry docks, the economic viability of existing facilities is cru-cial to the operation of the maritime industry in New York Harbor.
Other Challenges Facing the Maritime IndustryThe maritime industry is directly dependent on the availability of waterfront space and the use of the waterways to do business. These opera-tions often require building structures in water-bodies regulated by state and federal agencies. The viability of maritime industrial businesses in New York City depends on the ability to
Recovery Project and the rescue of passengers from and recovery of the USAirways plane that made an emergency landing in the Hudson River in January 2009. They respond to emer-gency calls from other waterborne vessels on a regular basis.
Barges transport both dry and liquid cargo and provide a multitude of services. They can assist oceangoing vessels, transporting goods over shorter distances and in water too shallow for the larger boats. A dry barge, also known as a scow, can carry the equivalent of 60 truck-loads in cargo. Barges can also form articulated tug barges, multiple barges that are attached and propelled by a tug for enhanced carrying capacity. A tug propelling six barges can remove upwards of 360 trucks from the roads. A tank barge, which transports liquids, is capable of re-moving up to 1,500 trucks from the congested highways in New York City and the region.
The Maritime Support Services Location Study (MSSLS) that was published in 2007 provided updated information about current and future demand for tugs, barges, ship repair, and land-side repair. The study was funded by the New York Department of State and conducted by the State University of New York Maritime College (SUNY Maritime) in conjunction with the New York City Economic Development Corpora-tion and the Brooklyn Navy Yard Development Corporation. As part of the study, a survey was commissioned of all water-dependent business-es located in the Significant Maritime and Indus-trial Areas (SMIAs), the six shoreline areas of the Bronx, Queens, Brooklyn, and Staten Island that were designated in the 1992 Comprehen-sive Waterfront Plan to help preserve and foster working waterfront activities in the city. These areas encompass key maritime-related facilities and infrastructure and industrial businesses that rely on the nearby nexus of maritime activity.
The study estimated that demand for future tugboat services could rise to 33,000 calls for service annually by 2016. This would repre-sent a 57 percent increase over tow demand in 2007.
As demand for additional tugs and barges grows, so will the need for tie-up and moor-ing space. The 2007 study indicated that the demand for tie-up and mooring space in the Harbor exceeded the supply. Approximately 90,000 linear feet is provided within the city’s SMIAs, and vessels also tie up and moor within New York City but outside the SMIAs, such as in Flushing Bay and Westchester Creek, and in
SUPPORT THE WORKING WATERFRONT50
receive the necessary environmental permits to build new facilities and to maintain existing structures. This issue, critical to the maritime industry, is discussed further in the section of Vi-sion 2020 devoted to improving governmental regulation, coordination, and oversight, begin-ning on page 96.
Another challenge is finding qualified work-ers. Though jobs in the maritime industry are typically well paid and offer an important di-versity for the city’s economic base, many jobs within the maritime industry are filled by work-ers from outside the New York metropolitan area. New York City residents are typically un-aware of the opportunities in the field, and few vocational training programs are currently avail-able. The State University of New York Mari-time College in the Bronx and Urban Assembly New York Harbor School, a public high school on Governors Island, offer important opportu-nities for training New York’s students for jobs within the maritime industry.
Yet another challenge facing today’s mari-time industry is finding cost-effective methods for disposing of dredged material. Dredging is needed to maintain many of the berthing facili-ties around the Harbor because of its naturally shallow depths. The current cost of dredging within the Port of New York and New Jersey is prohibitively expensive for small maritime busi-nesses. Some businesses have had to reduce their operations or close entirely because of dredging needs; others have had to respond to shallow draft conditions by making inefficient operational adjustments. This has lead to de-commissioning terminals—as seen along the Harlem and Bronx rivers and Westchester and Eastchester creeks—or rotating larger vessels to deeper draft tie-ups along the Hudson River during low tide.
MarinasCommercial and public marinas are important assets for New York City, providing seasonal employment as well as recreational opportuni-ties. Marinas also add character to the neigh-borhoods where they are clustered. Marina support services offer skilled and unskilled jobs. Marina uses include full-service marinas, acces-sory docks, and single docks for private recre-ational vessels. Marina support activities include boat repair and maintenance, boat storage, fu-eling, waste pumpout, and sail making and re-pair. Marinas and marina support activities tend to cluster in areas with moderately deep wa-
ter protected from currents, strong winds, and wave action, and where conflict with maritime and maritime support vessel activity is minimal.
Marinas are permitted in all commercial and manufacturing zones. Marina support services are permitted in these zones as well, with the exception of certain commercial zones (C1 and C4 – C6) due to frequent noise and odors associated with these businesses. The Zoning Resolution does not permit new marinas to be built in residential zones, though marinas can be built in C3 and C3A districts, where low-density housing is also allowed.
Marinas are reasonably well distributed along the New York City coastline where in-dustrial uses are limited, but notable clusters of marinas and marina support services have formed on City Island, Gerritsen Beach, Ham-ilton Beach, Broad Channel, and around Great Kills Harbor. Approximately 150 marinas and boat launches exist in New York City, accord-ing to data from the U.S. Coast Guard and the New York City Police Department (see map on page 87); this includes full- or limited-service marinas and yacht clubs, many located on park-land. Full-service marinas are land-intensive and generally face financial challenges related to sea-sonal use, regulatory hurdles, dredging costs, and real-estate pressures. Due to these factors, the number of marinas has been dwindling over the decades.
Over the last half-century, industrial uses on the waterfront have declined in New York City, just as they have elsewhere in the country. With fewer businesses requiring piers and facilities for boat tie up, much of the shoreline infrastructure dating from the industrial age is no longer used and is in disrepair. Brownfields are another lega-cy of the industrial era. Historically, many indus-trial businesses were operated with little regard to the contamination of the land and nearby waterways. In addition, many pre-World War II industrial buildings on the waterfront have been rendered obsolete by technological advances in manufacturing processes. Breathing new life into these inactive buildings by adapting them for new uses is an important challenge and op-portunity.
Trends on the Industrial WaterfrontIn 1955, there were more than 1.8 million in-dustrial jobs in New York City, and about half of those jobs were in manufacturing. The indus-trial sectors—manufacturing, wholesale trade, transportation, utilities, and construction—ac-counted for 56 percent of the city’s private em-ployment at that time. Many of the city’s manu-facturers located at the water’s edge because businesses were reliant on shipping goods by
LEGACY ISSUES OF INDUSTRIAL USES
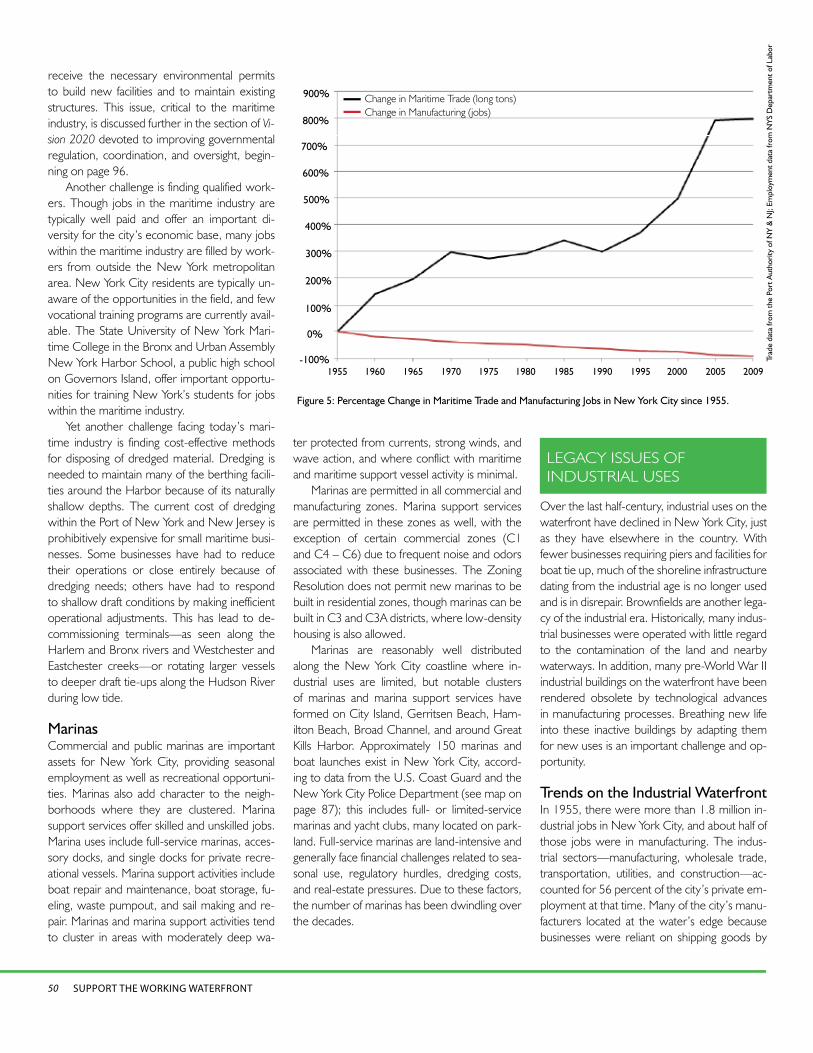
Figure 5: Percentage Change in Maritime Trade and Manufacturing Jobs in New York City since 1955.
Change in Maritime Trade (long tons)Change in Manufacturing (jobs)
-100%
0%
100%
200%
300%
400%
500%
600%
700%
800%
900%
1955 1960 1965 1970 1975 1980 1985 1990 1995 2000 2005 2009
Tra
de d
ata
from
the
Port
Aut
horit
y of
NY
& N
J; Em
ploy
men
t dat
a fr
om N
YS D
epar
tmen
t of L
abor

51VISION 2020: NEW YORK CITY COMPREHENSIVE WATERFRONT PLAN
The former Bethlehem Steel Corporation Shipyard on the North Shore of Staten Island was the site of extensive ship construction from the 1920s through World War II.
facturing jobs in 1955—waterborne trade rose by nearly 900 percent in this period.
Due to the decline of manufacturing, the amount of waterfront land used for manufactur-ing has shrunk considerably. Disinvestment has been widespread, extending from the shoreline into the upland industrial areas.
The 1992 Comprehensive Waterfront Plan noted that along the waterfront, zoning still to a great extent reflected the mid-20th-century predominance of industrial uses. The manufac-turing districts mapped in 1961 were based on land-use patterns of 1955, and in 1992 the zon-ing had remained largely unchanged, with one-third of the waterfront still zoned for industrial uses. Despite the rezoning of several waterfront sites for non-industrial uses in recent decades, approximately the same share of waterfront area in New York City is zoned for industrial uses today.
Recent Strategies to Spur Economic DevelopmentTo bolster the remaining industrial uses, the Bloomberg Administration in 2005 designated 18 areas of the city Industrial Business Zones (IBZs). The Administration created IBZs to stabilize primarily industrial areas in the Bronx, Brooklyn, and Queens. Manufacturers that re-located to IBZs became eligible for a tax benefit, and, in addition, the Administration committed not to support the rezoning of industrial prop-
erty for residential use. The City contracted with nonprofit organizations to facilitate access to government-funded business assistance pro-grams. The organizations also act as liaisons to City agencies to expedite the resolution of problems affecting industrial businesses, such as nuisance complaints and limited loading and parking zones in these areas.
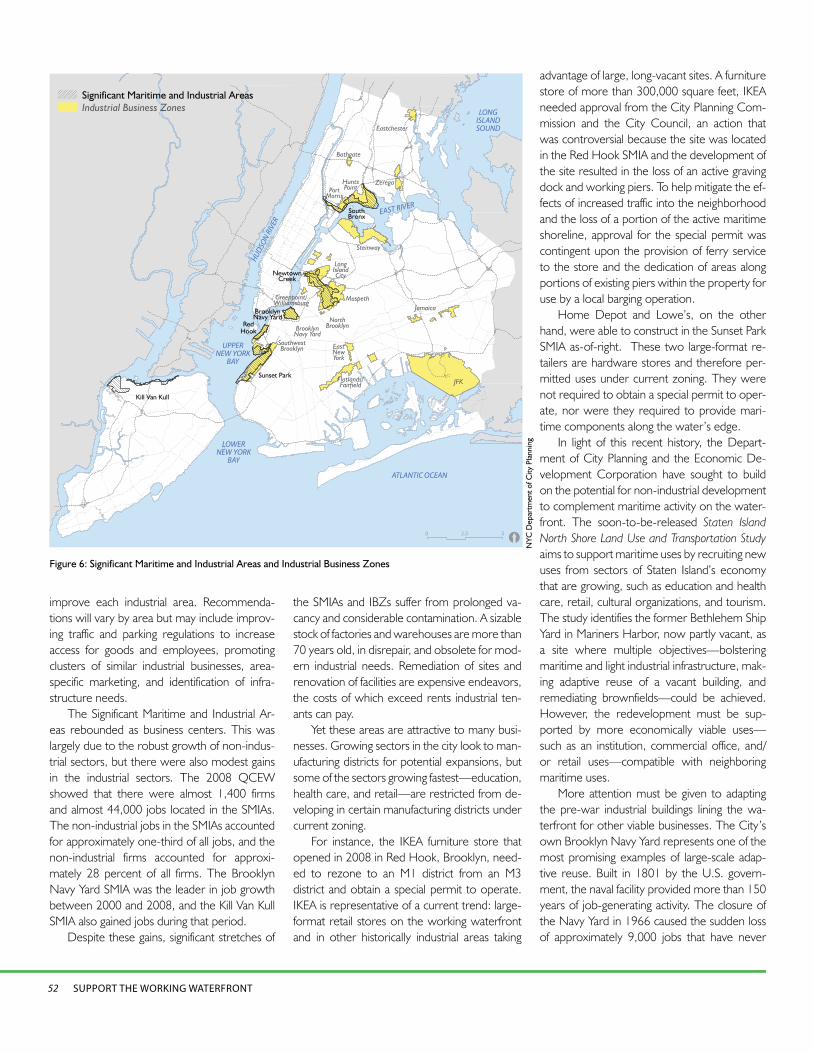
Many IBZs are on the waterfront. The IBZs encompass the Significant Maritime and Indus-trial Areas (SMIAs), with the exception of the Kill Van Kull SMIA in Staten Island (see Figure 6, page 52). The Kill Van Kull SMIA is located in the Staten Island North Shore Ombudsman Area, in which there is funding for a nonprofit service provider. Rather than create an IBZ on the North Shore in 2005, the City determined that further study of the area was necessary. The City will soon issue the Staten Island North Shore Land Use and Transportation Study, which identifies opportunities for industrial retention and growth.
While IBZs are important business centers and the IBZ program has provided benefits to companies in them, these areas have continued to lose industrial jobs. According to the Quarter-ly Census of Employment and Wage (QCEW) data from the New York State Department of Labor, the IBZs in 2008 contained approxi-mately 25 percent of New York City’s industrial jobs and 11 percent of industrial firms. IBZs lost a total of nearly 11,000 industrial jobs between 2000 and 2008, while gaining approximately 12,000 non-industrial jobs. This represents a loss of 10 percent of all industrial jobs and a gain of 32 percent in non-industrial jobs.
However, industrial firms in the IBZs show resilience. According to the QCEW data for 2000 and 2008, a relatively even number of new industrial businesses replaced those that were lost, with new arrivals in construction and warehousing firms and departures in manu-facturing and transportation. Furthermore, 41 percent of the industrial firms located in IBZs in 2000 still existed in 2008, while 35 percent of non-industrial firms were still in place. However, these remaining industrial firms in IBZs tended to become smaller operations compared to their non-industrial neighbors. Industrial firms shrank from an average size of 48 employees in 2000 to an average of 41 employees in 2008 while the non-industrial firms grew from an av-erage of 39 to 51 employees.
The City is currently working on studies of each IBZ to identify issues and opportunities to
water directly to and from their plants. Com-modities were baled and hauled in every man-ner for delivery.
An experiment in the use of standardized cargo containers in shipping and truck trans-portation was conducted in 1956 in the Port of Newark and had reverberations for years after-ward, contributing to the decline of manufac-turing centers in New York City and through-out the Northeast. In 1962, the world’s first containerized port opened in Elizabeth, NJ, not only revolutionizing the system of maritime trade but marking a transformative moment for the interrelated sectors of ground and rail transportation. The development of container-ized transport made convenient access to high-ways a leading factor in where manufacturers decided to locate. With the construction of the Interstate Highway System, manufacturing mi-grated out of New York and other older cities.
The decline in industrial jobs in New York City from 1955 to 2009 was accompanied by a rise in Port trade (see Figure 5, page 50). By 2008, the number of industrial jobs in New York City fell to approximately 543,000, about 18 percent of all private employment, and only 96,000 of those jobs were in manufacturing. In 2009, the latest year for which annualized labor data is available, manufacturing jobs dropped to under 84,000. Although manufacturing is a shadow of what it was in the mid-20th centu-ry—down to less than 10 percent of the manu-
SUPPORT THE WORKING WATERFRONT52
improve each industrial area. Recommenda-tions will vary by area but may include improv-ing traffic and parking regulations to increase access for goods and employees, promoting clusters of similar industrial businesses, area-specific marketing, and identification of infra-structure needs.
The Significant Maritime and Industrial Ar-eas rebounded as business centers. This was largely due to the robust growth of non-indus-trial sectors, but there were also modest gains in the industrial sectors. The 2008 QCEW showed that there were almost 1,400 firms and almost 44,000 jobs located in the SMIAs. The non-industrial jobs in the SMIAs accounted for approximately one-third of all jobs, and the non-industrial firms accounted for approxi-mately 28 percent of all firms. The Brooklyn Navy Yard SMIA was the leader in job growth between 2000 and 2008, and the Kill Van Kull SMIA also gained jobs during that period.
Despite these gains, significant stretches of
the SMIAs and IBZs suffer from prolonged va-cancy and considerable contamination. A sizable stock of factories and warehouses are more than 70 years old, in disrepair, and obsolete for mod-ern industrial needs. Remediation of sites and renovation of facilities are expensive endeavors, the costs of which exceed rents industrial ten-ants can pay.
Yet these areas are attractive to many busi-nesses. Growing sectors in the city look to man-ufacturing districts for potential expansions, but some of the sectors growing fastest—education, health care, and retail—are restricted from de-veloping in certain manufacturing districts under current zoning.
For instance, the IKEA furniture store that opened in 2008 in Red Hook, Brooklyn, need-ed to rezone to an M1 district from an M3 district and obtain a special permit to operate. IKEA is representative of a current trend: large-format retail stores on the working waterfront and in other historically industrial areas taking
advantage of large, long-vacant sites. A furniture store of more than 300,000 square feet, IKEA needed approval from the City Planning Com-mission and the City Council, an action that was controversial because the site was located in the Red Hook SMIA and the development of the site resulted in the loss of an active graving dock and working piers. To help mitigate the ef-fects of increased traffic into the neighborhood and the loss of a portion of the active maritime shoreline, approval for the special permit was contingent upon the provision of ferry service to the store and the dedication of areas along portions of existing piers within the property for use by a local barging operation.
Home Depot and Lowe’s, on the other hand, were able to construct in the Sunset Park SMIA as-of-right. These two large-format re-tailers are hardware stores and therefore per-mitted uses under current zoning. They were not required to obtain a special permit to oper-ate, nor were they required to provide mari-time components along the water’s edge.
In light of this recent history, the Depart-ment of City Planning and the Economic De-velopment Corporation have sought to build on the potential for non-industrial development to complement maritime activity on the water-front. The soon-to-be-released Staten Island North Shore Land Use and Transportation Study aims to support maritime uses by recruiting new uses from sectors of Staten Island’s economy that are growing, such as education and health care, retail, cultural organizations, and tourism. The study identifies the former Bethlehem Ship Yard in Mariners Harbor, now partly vacant, as a site where multiple objectives—bolstering maritime and light industrial infrastructure, mak-ing adaptive reuse of a vacant building, and remediating brownfields—could be achieved. However, the redevelopment must be sup-ported by more economically viable uses—such as an institution, commercial office, and/or retail uses—compatible with neighboring maritime uses.
More attention must be given to adapting the pre-war industrial buildings lining the wa-terfront for other viable businesses. The City’s own Brooklyn Navy Yard represents one of the most promising examples of large-scale adap-tive reuse. Built in 1801 by the U.S. govern-ment, the naval facility provided more than 150 years of job-generating activity. The closure of the Navy Yard in 1966 caused the sudden loss of approximately 9,000 jobs that have never
Figure 6: Significant Maritime and Industrial Areas and Industrial Business Zones
Significant Maritime Industrial Areas
Industrial Business Zones
Significant Maritime Industrial Areas (SMIAs) and Industrial Business Zones (IBZs)
0 5 101 2 3 4Miles
[2.50 5
Kill Van Kull
Sunset Park
Red Hook
Brooklyn Navy Yard
NewtownCreek
South Bronx
SouthwestBrooklyn
BrooklynNavy Yard
North Brooklyn
Maspeth
LongIslandCity
Jamaica
JFKFlatlands/Fairfield
EastNew York
Steinway
PortMorris
HuntsPoint
Bathgate
Zerega
Eastchester
Greenpoint/Williamsburg
Significant Maritime and Industrial AreasIndustrial Business Zones
ATLANTIC OCEAN
LONGISLAND SOUND
EAST RIVER
LOWER NEW YORK
BAY
UPPERNEW YORK
BAY
HUDSON R
IVER
NYC
Dep
artm
ent o
f City
Pla
nnin
g
53VISION 2020: NEW YORK CITY COMPREHENSIVE WATERFRONT PLAN
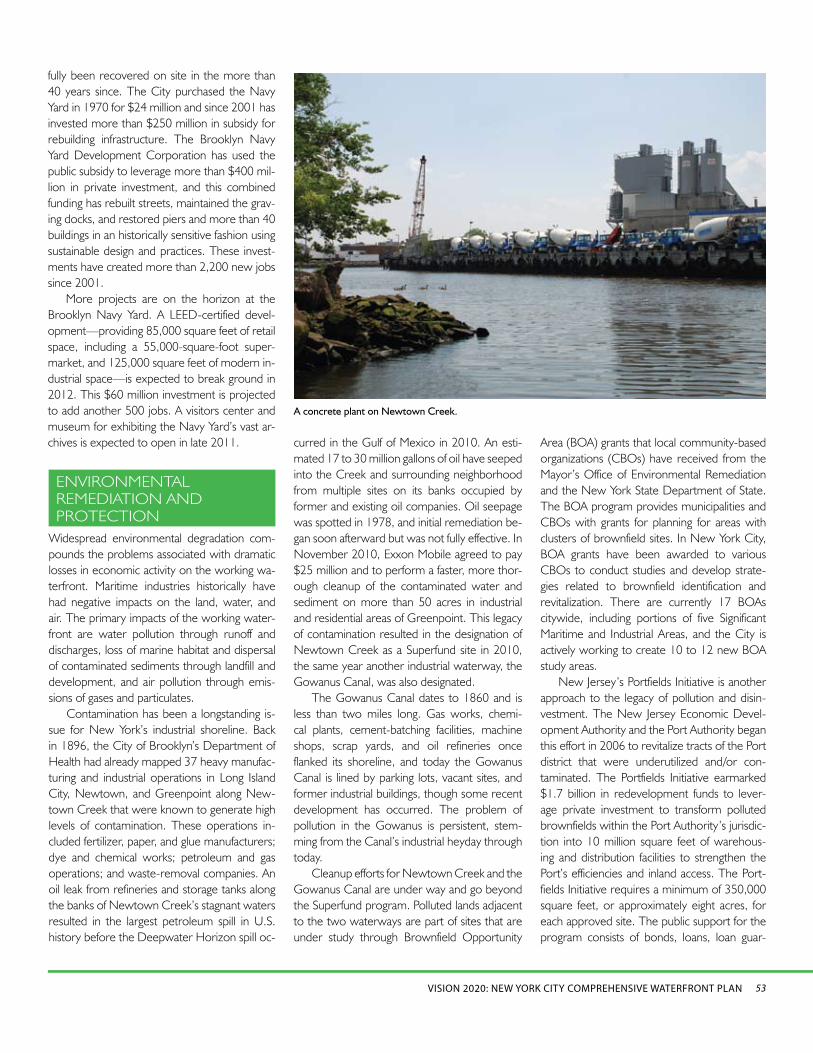
A concrete plant on Newtown Creek.
fully been recovered on site in the more than 40 years since. The City purchased the Navy Yard in 1970 for $24 million and since 2001 has invested more than $250 million in subsidy for rebuilding infrastructure. The Brooklyn Navy Yard Development Corporation has used the public subsidy to leverage more than $400 mil-lion in private investment, and this combined funding has rebuilt streets, maintained the grav-ing docks, and restored piers and more than 40 buildings in an historically sensitive fashion using sustainable design and practices. These invest-ments have created more than 2,200 new jobs since 2001.
More projects are on the horizon at the Brooklyn Navy Yard. A LEED-certified devel-opment—providing 85,000 square feet of retail space, including a 55,000-square-foot super-market, and 125,000 square feet of modern in-dustrial space—is expected to break ground in 2012. This $60 million investment is projected to add another 500 jobs. A visitors center and museum for exhibiting the Navy Yard’s vast ar-chives is expected to open in late 2011.
Widespread environmental degradation com-pounds the problems associated with dramatic losses in economic activity on the working wa-terfront. Maritime industries historically have had negative impacts on the land, water, and air. The primary impacts of the working water-front are water pollution through runoff and discharges, loss of marine habitat and dispersal of contaminated sediments through landfill and development, and air pollution through emis-sions of gases and particulates.
Contamination has been a longstanding is-sue for New York’s industrial shoreline. Back in 1896, the City of Brooklyn’s Department of Health had already mapped 37 heavy manufac-turing and industrial operations in Long Island City, Newtown, and Greenpoint along New-town Creek that were known to generate high levels of contamination. These operations in-cluded fertilizer, paper, and glue manufacturers; dye and chemical works; petroleum and gas operations; and waste-removal companies. An oil leak from refineries and storage tanks along the banks of Newtown Creek’s stagnant waters resulted in the largest petroleum spill in U.S. history before the Deepwater Horizon spill oc-
ENVIRONMENTAL REMEDIATION AND PROTECTION
Area (BOA) grants that local community-based organizations (CBOs) have received from the Mayor’s Office of Environmental Remediation and the New York State Department of State. The BOA program provides municipalities and CBOs with grants for planning for areas with clusters of brownfield sites. In New York City, BOA grants have been awarded to various CBOs to conduct studies and develop strate-gies related to brownfield identification and revitalization. There are currently 17 BOAs citywide, including portions of five Significant Maritime and Industrial Areas, and the City is actively working to create 10 to 12 new BOA study areas.
New Jersey’s Portfields Initiative is another approach to the legacy of pollution and disin-vestment. The New Jersey Economic Devel-opment Authority and the Port Authority began this effort in 2006 to revitalize tracts of the Port district that were underutilized and/or con-taminated. The Portfields Initiative earmarked $1.7 billion in redevelopment funds to lever-age private investment to transform polluted brownfields within the Port Authority’s jurisdic-tion into 10 million square feet of warehous-ing and distribution facilities to strengthen the Port’s efficiencies and inland access. The Port-fields Initiative requires a minimum of 350,000 square feet, or approximately eight acres, for each approved site. The public support for the program consists of bonds, loans, loan guar-
curred in the Gulf of Mexico in 2010. An esti-mated 17 to 30 million gallons of oil have seeped into the Creek and surrounding neighborhood from multiple sites on its banks occupied by former and existing oil companies. Oil seepage was spotted in 1978, and initial remediation be-gan soon afterward but was not fully effective. In November 2010, Exxon Mobile agreed to pay $25 million and to perform a faster, more thor-ough cleanup of the contaminated water and sediment on more than 50 acres in industrial and residential areas of Greenpoint. This legacy of contamination resulted in the designation of Newtown Creek as a Superfund site in 2010, the same year another industrial waterway, the Gowanus Canal, was also designated.
The Gowanus Canal dates to 1860 and is less than two miles long. Gas works, chemi-cal plants, cement-batching facilities, machine shops, scrap yards, and oil refineries once flanked its shoreline, and today the Gowanus Canal is lined by parking lots, vacant sites, and former industrial buildings, though some recent development has occurred. The problem of pollution in the Gowanus is persistent, stem-ming from the Canal’s industrial heyday through today.
Cleanup efforts for Newtown Creek and the Gowanus Canal are under way and go beyond the Superfund program. Polluted lands adjacent to the two waterways are part of sites that are under study through Brownfield Opportunity

SUPPORT THE WORKING WATERFRONT54
antees, and environmental assistance grants for planning, pre-development, site selection, and remediation; infrastructure improvements; and capital costs. In addition, by partnering with Public Service Electric and Gas, a publicly owned utility, applicants will receive technical assistance, and facilities will be constructed with energy-efficiency measures.
In New York City, the Mayor’s Office of Environmental Remediation has already laid the groundwork for a similar initiative. OER has launched the first municipally run brownfield cleanup program in the U.S., a $9 million grant program to encourage private investment in in-vestigation and cleanup. It has also developed an environmental database with pertinent his-toric land-use information on more than 3,000 properties, enabling the public to identify va-cant sites and possible brownfields. New York City has few sites on the scale of the Portfields sites in New Jersey, but they do exist, espe-cially on Staten Island’s West Shore and along the shoreline of the South Bronx and Northern Brooklyn.
Protecting Harbor Water from ContaminationWhile increased regulation of chemical disposal, wastewater, and other sources of water pollu-tion have greatly improved water quality within New York Harbor and its tributaries, pollutants remain as a result of historic activities, occa-sional accidents, and some ongoing practices. The federal laws of the 1970s improved New York waterways, but were not entirely effective in reversing earlier damage done. If additional steps are not taken, water pollution could in-crease with climate change. For instance, a rise in sea level and more frequent, intense storms could possibly cause more spills on sites with open industrial uses. Water pollution from industrial waterfront areas is still a prevalent problem and one that can be better addressed through a combination of tighter controls regu-lating sources of pollution and remediating con-tamination where it has already occurred.
There are several ways maritime industrial activities introduce pollutants into the city’s wa-terways, including disposal of chemicals, storm-water runoff, and vessel discharges. Current sources of water contamination include barging of scrap metals, construction aggregate, demo-lition debris, and petroleum products. Pollution also stems from oil leakage, sewage overflow, and unabated releases of contaminants. Pollut-
ants include heavy metals, cadmium, mercury, solvents, and pesticides, and these pollutants limit the ability of the waters to support biodi-versity and safe recreation.
Utilizing stormwater best management practices known as BMPs—such as bioswales, pervious pavement, and basins that detain and retain stormwater—can improve water quality by capturing and filtering contaminated storm-water. Regulation and enforcement of vessel greywater discharge standards and chemical disposal are other important means of address-ing water pollution.
Contaminated SedimentMaintaining New York’s shipping channels and waterways presents a range of environmen-tal considerations. As in any estuary, sediment transported via harbor tributaries accretes throughout New York Harbor. The Port and its estuaries are naturally shallow, with the historic depths of the channels averaging approximately 19 feet. To keep shipping channels and water-ways navigable, excavation of bottom sediment, or dredging, is necessary.
Dredging requires environmental oversight. It can dislodge chemicals that have accumulated
in the silt and sediment and release them into the water column where they can enter the food chain. In addition, excavation can lead to habitat loss, as the floor of the ocean, harbor, and rivers is reshaped. There are many prac-tices that can minimize environmental impacts of dredging, such as dredging during certain times of the year, limiting the speed of dredg-ing, and requiring environmental buckets that remain closed during dredging. Disposal of contaminated dredged material is the most ex-pensive part of the dredging process because of requirements for the management of environ-mental risks. Remediating and reusing dredged material instead of disposing of it can greatly re-duce the negative impacts of dredging. Benefi-cially using dredged materials could reduce the overall cost of a project while offering a useful source of material for other projects.
From the mid-1800s until the mid-1990s, dredged material from New York City was dumped offshore at what came to be known as the “Mud Dump Site,” located about three miles into the ocean off Sandy Hook, NJ. This area was used to dispose of dredged materi-als containing sand, silt, clay, and stone, as well as many contaminants. In 1997, the site was
Cargo-handling equipment on Pier 10 at the Red Hook Container Terminal, Brooklyn.
© C
arol
ina
Salg
uero
55VISION 2020: NEW YORK CITY COMPREHENSIVE WATERFRONT PLAN
closed as a disposal site and reclassified as a remediation site. Now referred to as the “His-toric Area Remediation Site” (HARS), this area is being remediated through the use of dredged material that meets criteria for acceptable levels of contamination.
However, the majority of the material that is dredged in New York Harbor does not meet those standards. While not hazardous in its un-treated form, it needs to be treated so that it can be beneficially used. To allow for beneficial use, dredged sediment can be processed to reduce, separate, immobilize, or detoxify contaminants. Effective techniques vary greatly, depending on the nature and amount of contaminants.
Once processed, there are a variety of ben-eficial uses for dredged material. Freshkills Park on Staten Island, which will open to the public in phases beginning in 2011, used approximately 1 million cubic yards of dredged material mixed with cement for fill and contouring. A similar process is being used at the Brookfield Landfill on Staten Island, which also will be parkland in the future. In addition to capping landfills and brownfield sites, processed dredged material can be beneficially used as topsoil, storm barri-ers, and other construction material.
It is important to address the environmental concerns related to dredging, and find produc-tive beneficial use for the dredged materials, as the need for dredging will likely increase. Over the next 60 years, it is estimated that nearly 200 million cubic yards (mcy) of dredged material must be managed, according to the Dredged Material Management Plan, produced in 2008 by a partnership of city, state, and federal agen-cies. Currently select shipping channels, includ-ing the Kill Van Kull and Arthur Kill Channels off the shores of Staten Island, are being deepened to up to 50 feet as part of the second phase of the Harbor Deepening Project. This project, combined with regular maintenance dredging of the navigational channels, may produce as much as 2.4 mcy of dredged material annually. Fur-thermore, an estimated 1 mcy of sediment an-nually is generated in the private berths of small maritime businesses—including marinas, ship-yards, and tug and barge companies—which need to be dredged. Finding environmentally responsible and cost-effective methods for dis-posal is important for continuing to maintain op-erations that support both Port commerce and recreational activities.
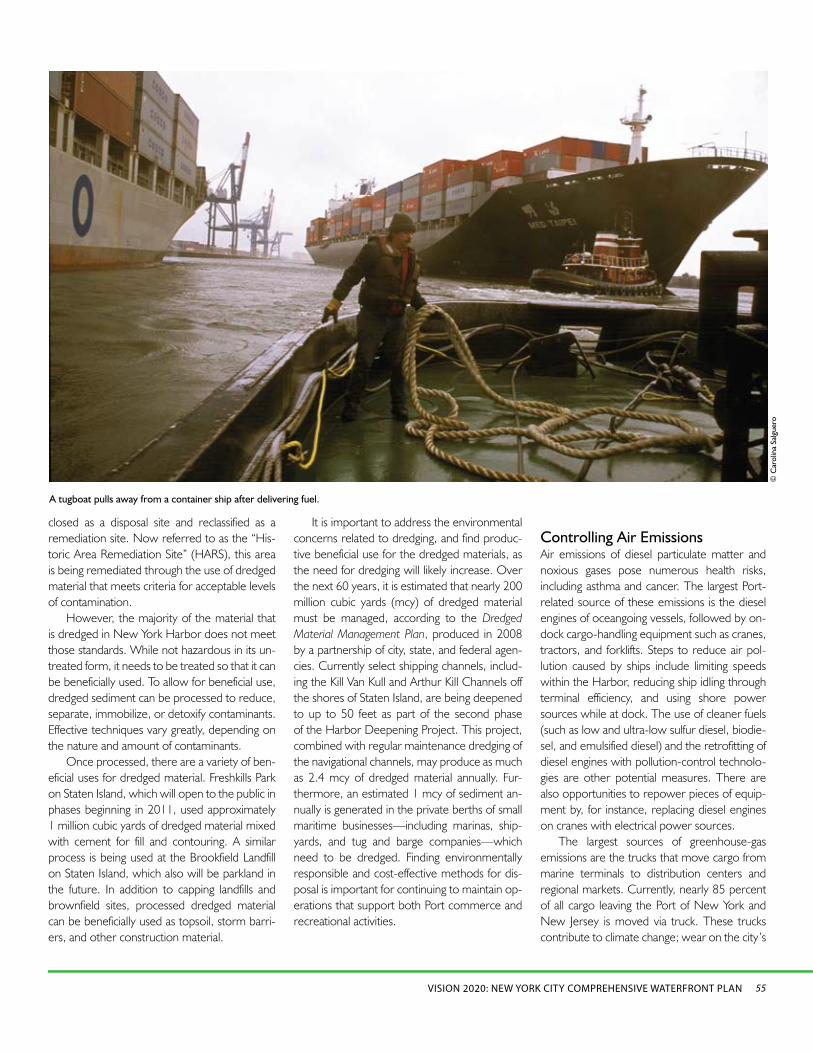
Controlling Air EmissionsAir emissions of diesel particulate matter and noxious gases pose numerous health risks, including asthma and cancer. The largest Port-related source of these emissions is the diesel engines of oceangoing vessels, followed by on-dock cargo-handling equipment such as cranes, tractors, and forklifts. Steps to reduce air pol-lution caused by ships include limiting speeds within the Harbor, reducing ship idling through terminal efficiency, and using shore power sources while at dock. The use of cleaner fuels (such as low and ultra-low sulfur diesel, biodie-sel, and emulsified diesel) and the retrofitting of diesel engines with pollution-control technolo-gies are other potential measures. There are also opportunities to repower pieces of equip-ment by, for instance, replacing diesel engines on cranes with electrical power sources.
The largest sources of greenhouse-gas emissions are the trucks that move cargo from marine terminals to distribution centers and regional markets. Currently, nearly 85 percent of all cargo leaving the Port of New York and New Jersey is moved via truck. These trucks contribute to climate change; wear on the city’s
A tugboat pulls away from a container ship after delivering fuel.
© C
arol
ina
Salg
uero

SUPPORT THE WORKING WATERFRONT56
roads; and create noise, traffic, and dust harmful to residential areas. Through a greater reliance on domestic oceanborne commerce, known as short-sea shipping, and rail transport, these im-pacts could be dramatically reduced. However, truck transport is more expedient and more cost-effective, except for when high-weight, low-value goods are being transported. There are strategies employed in New York and else-where to lessen the impacts of trucks, such as reducing idling time through optimizing terminal layout for efficiency and reduced congestion.
The Port Authority’s 2009 Clean Air Strat-egy aims to achieve an annual 3 percent net decrease of criteria pollutants (air pollutants
particularly from diesel engines with nega-tive effects on human health) and an annual 5 percent net decrease of greenhouse-gas emis-sions. The Clean Air Strategy includes a variety of programs that offer incentives to cargo ves-sel operators, trucking companies, and terminal operators to reduce greenhouse-gas and diesel emissions, and it also entails actions taken by the Port Authority itself. For instance, the Ocean Going Vessel Low Sulfur Program provides ves-sel operators with reimbursements for half the additional cost of low-sulfur fuels while ships are in the Harbor or at a terminal. The Clean Trucks program encourages the use of newer trucks that release fewer emissions by offering finan-
cial incentives and financing opportunities to replace older trucks. (The Port Authority plans to expand the Clean Trucks program by devel-oping near-port truck parking areas with plug-in electrification technology to reduce idling emis-sions.) In addition, ultra-low sulfur diesel fuel and pollution-control technologies are used in all cargo-handling equipment at Port Author-ity terminals, including electrifying cranes; and other technologies are being explored, such as hydraulic and electric hybrid equipment and wind turbines to provide power.
The Port Authority and New York City Eco-nomic Development Corporation also plan to provide shore-based electrical power (a practice
The Queen Mary 2 cruise ship, as seen from the rooftops of Red Hook, Brooklyn.
© C
arol
ina
Salg
uero
57VISION 2020: NEW YORK CITY COMPREHENSIVE WATERFRONT PLAN
known as “cold-ironing”) at the Brooklyn Cruise Terminal to eliminate emissions from idling en-gines. For wider application of this technology at other cruise and commercial marine terminals, new rate structures and off-the-grid options are being investigated.
While New York City has demonstrated that it is a leader in developing sustainable port practices, it is also worthwhile to look to ports throughout the country as potential sources of new ideas. The port in Long Beach, California, has worked with BP to install shore-side electri-cal power in one berth for use by BP oil tankers when in port. This project, which cost $23.7 million, was the first oil tanker terminal with shore power in the world. The port plans to upgrade 10 more berths with such cold-ironing accommodations, which would result in a 70 percent reduction in emissions by oil tankers while at dock. In 2004, the Port of Los Ange-les opened the world’s first container terminal utilizing alternative maritime power. Allowing container ships to plug in to shore electrical power eliminated the use of auxiliary engines while ships are docked, resulting in a 95 percent reduction of emissions of ships at dock.
Habitat Loss on Industrial ShoresThe interface between land and water is valu-able to maritime industries. However, these landscapes are productive from an ecological standpoint as well. The development of wet-lands and marshes for industrial uses can lead to the loss of biologically diverse areas. There are also potential indirect impacts on surround-ing habitat areas such as changes to currents, air emissions, noise generation, increased turbidity of water, and sediment erosion or accretion.
In addition, ship hulls and ballast water are potential sources of aquatic invasive species, which can disrupt food chains and upset other systems. For instance, zebra mussels, which were most likely introduced to the United States via ballast water, have caused billions of dollars in damage to water-intake systems. Currently, ballast water exchange—where ballast water is replaced with water from the open water—is the only effective means to reduce the risk of introducing invasive species. However, the abil-ity to conduct an exchange is highly dependent on weather and sea surface conditions, and the practice is only partially effective, with a residual amount of organisms remaining in tanks follow-ing exchange. Interest is growing in ballast wa-ter treatment, but this practice is still only in the research phase.
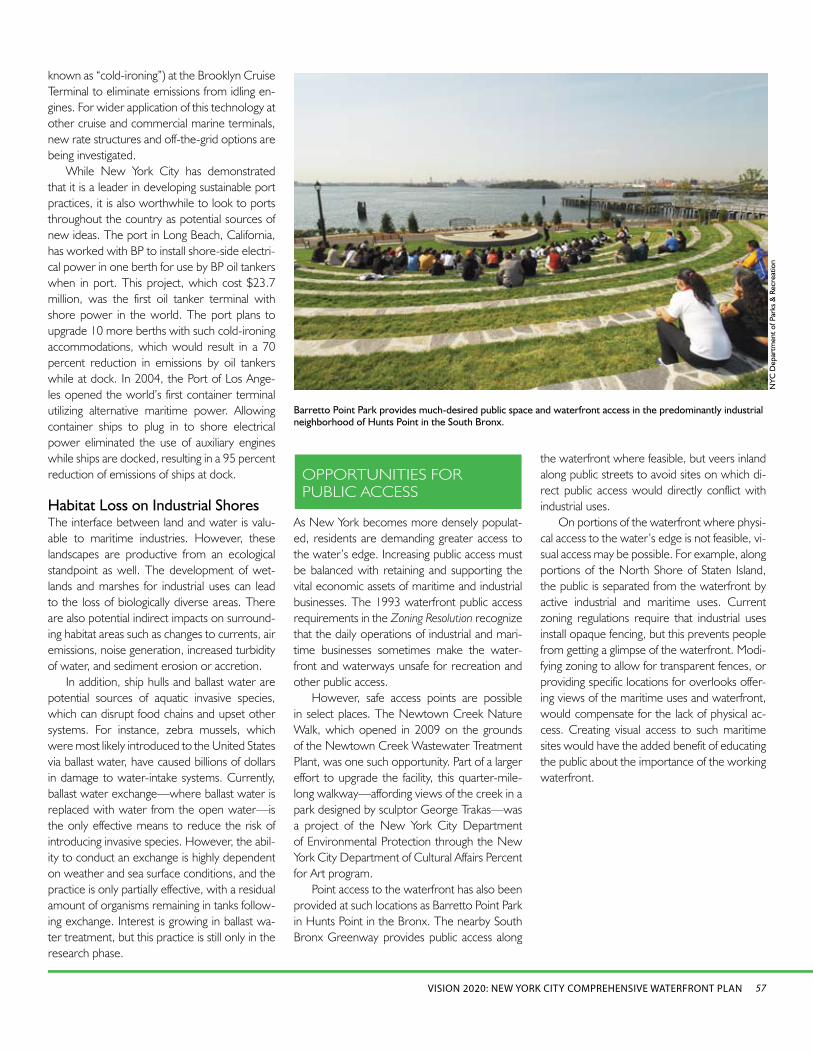
Barretto Point Park provides much-desired public space and waterfront access in the predominantly industrial neighborhood of Hunts Point in the South Bronx.
NYC
Dep
artm
ent o
f Par
ks &
Rec
reat
ion
As New York becomes more densely populat-ed, residents are demanding greater access to the water’s edge. Increasing public access must be balanced with retaining and supporting the vital economic assets of maritime and industrial businesses. The 1993 waterfront public access requirements in the Zoning Resolution recognize that the daily operations of industrial and mari-time businesses sometimes make the water-front and waterways unsafe for recreation and other public access.
However, safe access points are possible in select places. The Newtown Creek Nature Walk, which opened in 2009 on the grounds of the Newtown Creek Wastewater Treatment Plant, was one such opportunity. Part of a larger effort to upgrade the facility, this quarter-mile-long walkway—affording views of the creek in a park designed by sculptor George Trakas—was a project of the New York City Department of Environmental Protection through the New York City Department of Cultural Affairs Percent for Art program.
Point access to the waterfront has also been provided at such locations as Barretto Point Park in Hunts Point in the Bronx. The nearby South Bronx Greenway provides public access along
the waterfront where feasible, but veers inland along public streets to avoid sites on which di-rect public access would directly conflict with industrial uses.
On portions of the waterfront where physi-cal access to the water’s edge is not feasible, vi-sual access may be possible. For example, along portions of the North Shore of Staten Island, the public is separated from the waterfront by active industrial and maritime uses. Current zoning regulations require that industrial uses install opaque fencing, but this prevents people from getting a glimpse of the waterfront. Modi-fying zoning to allow for transparent fences, or providing specific locations for overlooks offer-ing views of the maritime uses and waterfront, would compensate for the lack of physical ac-cess. Creating visual access to such maritime sites would have the added benefit of educating the public about the importance of the working waterfront.
OPPORTUNITIES FORPUBLIC ACCESS

SUPPORT THE WORKING WATERFRONT58
Support expansion of container shipping within the Port of New York and New Jersey.•Support expansion of non-containerized shipping including break bulk (fruit), liquid bulk •(fuel, food), dry bulk (aggregates, cement), and neo-bulk (vehicles) within the Port of New York and New Jersey. Support the completion of the Final Environmental Impact Statement (FEIS) related to the •Cross Harbor Freight Movement Project, assessing the costs and benefits of different alterna-tives for improving rail freight in the East-of-Hudson region. This can include expansion of new landing areas, larger-capacity barges, and upland rail improvements to increase rail’s modal share of freight shipments within the city.Support the Port Authority’s efforts to improve navigation for large container vessels, •including addressing air draft restrictions at the Bayonne Bridge as well as completing the 50-foot deepening of the region’s main federal shipping channels.In coordination with NYC Department of Transportation and NYS Department of Trans-•portation, determine the feasibility of creating dedicated truck routes for servicing marine terminals that avoid residential areas and provide direct, efficient access to the national highway network.Examine opportunities to expand Foreign Trade Zones designations to existing interna-•tional marine gateways.
New York Container Terminal, Staten •Island: Complete environmental review for expanding container-handling capacity, which will create approximately 300 jobs upon completion. (EDC, 2012)
65th Street Rail Yard, Brooklyn: Improve •rail infrastructure to increase the use of the cross harbor rail freight system by leveraging public and private investments. (EDC, 2013)
Replace and lower Anchorage Channel tap •water siphons to facilitate deepening of the shipping channel. (EDC/DEP, 2011)
Red Hook, Brooklyn: Market the •container terminal as a distribution hub for containerized cargo destined for East-of-Hudson businesses. (EDC, 2011)
Sunset Park, Brooklyn: Coordinate with •the Port Authority on its Cross Harbor Freight Movement Project Environmental Impact Statement to ensure that transportation improvement alternatives fully account for expansion of container shipping. (EDC, 2012)
VISION 2020 STRATEGIES ACTION AGENDA PROJECTS
Maintain the robust activity in the Port of New York and New Jersey and at the Brooklyn and 1. Staten Island marine terminal facilities.
Support the Working Waterfront: Strategies and ProjectsThis plan envisions a waterfront in 2020 that is a thriving home for maritime and industrial busi-nesses, a healthy workplace for New York City residents, and a valuable resource for nearby communities.
To realize this goal, the City will pursue the following set of strategies over the next 10 years. In partnership with regional stakehold-ers, the City will promote the expansion of Port operations and the growth of maritime support services. And through educational programs,
the City will better connect new jobs with New York City residents. The City will address the waterfront’s legacy of disinvestment and con-tamination through targeted policies that pro-mote adaptive reuse and cleanup and incentivize investment in shoreline infrastructure. In addi-tion, the City will improve waterfront industrial areas through stronger environmental standards and better practices.
Vision 2020’s 10-year strategies are comple-mented by the New York City Waterfront Action
Agenda, a set of projects chosen for their ability to catalyze investment in waterfront enhance-ment. The City commits to initiating these projects over the next three years and will be tracking progress on an ongoing basis. For each project, the lead agency and implementation year are noted.
Together, these strategies and projects lay out a comprehensive vision for the waterfront and waterways and a plan of action to achieve that vision.

59VISION 2020: NEW YORK CITY COMPREHENSIVE WATERFRONT PLAN
VISION 2020 STRATEGIES ACTION AGENDA PROJECTS
Establish task force on marine highways. •(EDC, 2011)
Collaborate with partners in the NY-NJ-CT region to seek and leverage federal funding op-•portunities.Identify funding resources to develop necessary infrastructure and facilities. •Consider using vessels that are capable of handling both freight and passengers.•Analyze opportunities to make operations more cost-competitive with other freight modes. •Support the goals of the • Solid Waste Management Plan to move solid waste via waterways. Explore opportunities to move express-air cargo by water, potentially coupled with airport •passenger ferry service.Strengthen waterborne freight services and intermodal connections to provide shippers with •expanded service choices.Develop strategies to increase and enhance distribution centers within the city and explore •opportunities to strategically locate these facilities in a manner that will increase transporta-tion and energy efficiencies. Explore opportunities to increase waterborne freight deliveries to major waterfront retail •centers.Study opportunities to provide sites for the waterborne deliveries of large items, such as •construction materials, and evaluate feasibility of creating oversized landing zones with heavy lift equipment.
Promote the region’s marine highways to move domestic and international goods within the city 2. and throughout the region.
Pursue a long-term dredged material management strategy to make New York City’s waterways 3. navigable for all forms of transport.
Clarify role of various agencies in managing dredged material and establish project •coordination.
Work with state regulators to reclassify dredge as non-hazardous material, based on chemical •analysis.
Ensure New York Harbor receives fair share of federal funding for dredging projects.•Develop the means to reduce the cost of dredging to NYC maritime firms and government •agencies.
Support bi-state partnership with New Jersey to bundle dredging projects of maritime firms •to make dredging more cost-effective.
Prioritize dredging projects to support industrial uses in navigable and formerly navigable •channels.
Develop a long-term strategy for placement of significant volumes of dredged material •generated from public and private navigation projects. This could include expanding New York’s placement capacity and identifying new sites to beneficially place non-HARS suitable material.
VISION 2020 STRATEGIES ACTION AGENDA PROJECTSEstablish task force on dredged material •management. (EDC, 2011)

SUPPORT THE WORKING WATERFRONT60
VISION 2020 STRATEGIES ACTION AGENDA PROJECTS
Brooklyn Navy Yard, Brooklyn: Complete •replacement of bulkheads and pier and complete dredging to ensure long-term viability of maritime uses. (BNYDC, 2013)
Red Hook, Brooklyn: Provide additional •berthing locations to commercial vessels along the north side of Atlantic Basin. (EDC, 2011)
Sunset Park, Brooklyn: Complete •rehabilitation of South Brooklyn Marine Terminal to receive ships and barges, creating 400 new jobs. (EDC, 2012)
Develop maritime skills apprentice •program in partnership with SUNY Maritime College (EDC/SBS, 2011)
Assist the Urban Assembly New York •Harbor School’s efforts to have its Career and Technical Education program formally designated by the New York State Board of Regents, which will secure ongoing fund-ing for training the city’s future maritime workforce. (DOE, 2011)
Work with Brownfield Opportunity Area •grant recipients, local communities, and elected officials in Significant Maritime and Industrial Areas (SMIAs) to examine existing conditions and strategies for remediation, redevelopment, and reuse. (DCP/OER, 2013)
Establish task force to focus on mooring •tie-ups, vessel repair capacity, and in-kind bulkhead replacement policies. (EDC, 2011)
Revise zoning to encourage redevelop-•ment and reuse of waterfront indus-trial sites by allowing greater flexibility to achieve certain goals, such as brownfield clean-up, adaptive reuse of outmoded buildings, expansion of maritime uses, and provision of in-water infrastructure. (DCP, 2013)
Evaluate the feasibility of the expansion of waterborne freight movement on City-owned •property and promote its use where appropriate. Some potential locations are the Ross-ville site on the West Shore of Staten Island and Pier 6 at Bush Terminal in Brooklyn.
Consider establishing maritime easements for the sale or long-term lease of public prop-•erty where and when appropriate.
Explore opportunities for providing additional bulkhead or pier frontage for tie-up space, •including incorporating workboat tie-up space in non-industrial developments.
Assess the possibility of maritime “hubs” to support workboat operations in geographically •strategic areas. These hubs could consolidate maritime support activities and amenities such as repair, pump-out stations, restocking supplies, and refreshment.
Explore measures to maximize operational efficiency and utilization of all existing repair •facilities.
Review Significant Maritime and Industrial Areas individually to determine the best ap-•proach to promoting and enhancing maritime businesses through land use, zoning, busi-ness incentive programs, and other policies.
Work proactively with maritime businesses to identify financial assistance programs and •workforce development programs.
Explore options to support academic institutions that train residents for careers in the omaritime industry (SUNY Maritime College, Kingsborough Community College, the Urban Assembly New York Harbor School, and Seaman’s Institute).
Promote vocational training to increase the labor pool of city residents who are oable to work in the maritime trades, particularly for skills that are in demand such as welding, machining, carpentry, cargo handling, truck and heavy equipment operating (Commercial Driving Licenses), and forklift operating.
Link local residents with new jobs in the maritime industry through City employment oprograms and coordination with local development corporations.
Pursue changes to the existing NY State fuel tax structure that results in regionally cost-•competitive fueling opportunities while also remaining revenue-neutral. (Currently New York City has no fueling facilities for workboats. New York State assesses taxes on diesel to the equivalent of 28 cents per gallon, while New Jersey assesses 17 cents per gallon.)
Assist maritime businesses in navigating the environmental permitting processes to reduce •uncertainty.
Analyze and promote policies to strengthen maritime support services and spur reinvestment in 4. waterfront industrial areas.

61VISION 2020: NEW YORK CITY COMPREHENSIVE WATERFRONT PLAN
Examine measures to better balance the needs of businesses and residents along the working •waterfront, including:
Examine options to enact legal notice requirements for new residential developments onear SMIAs to protect maritime businesses from unwarranted lawsuits.
Establish building and urban design guidelines for new developments near SMIAs to ominimize impacts, such as noise, dust, and fumes, from nearby industrial activities.
Coordinate efforts among public agencies, nongovernmental organizations, and com- omunity groups to develop appropriate public access in working waterfront areas in a manner that does not compromise safety or operations Such access can provide viewing and educational opportunities for the public, advertise job opportunities, and promote the importance of maritime industry.
Work with the Coast Guard and the Harbor Safety, Navigation, and Operations Com- omittee to establish and enforce appropriate buffers adjacent to significant waterfront infrastructure for security and safety.
Undertake study of alternatives to current opaque fence zoning requirements in omanufacturing districts.
Establish a collaborative framework to identify contamination along the working waterfront •and devise policies to improve environmental conditions in industrial areas and create cleaner maritime and industrial operations.
Work with public and private partners at the regional, state, and local level to assist omaritime businesses in complying with regulation prohibiting direct discharge of grey-water, including finding locations for discharge, and investing in additional pump-out capacity.
Conduct study of existing zoning performance standards and enclosure regulations oin manufacturing zones to establish regulations for open industrial uses, including the storage of chemicals and potentially hazardous materials, that are more protec-tive of the environment and limit off-site impacts. This study should also examine performance standards and other measures to provide greater protections to nearby residential uses, recognizing the potential economic impact of such measures.
Create inventory and mapping of potentially hazardous materials based on available odatasets and registries of particular industrial uses and storage of hazardous materials.
Work with state and federal partners to support and advance the Port Authority of NY o& NJ’s Clean Air Strategy.
Encourage the use of shore-based power sources for ships at dock—an operation oknown as “cold-ironing”—to reduce pollution from idling of diesel engines.
Seek federal funding to assist in the financing of port and infrastructure development oprojects that encourage environmentally sustainable operations.
Pursue incentives for wider use of cleaner fuels. Align these programs with Environmental •Protection Agency Emission Control Area regulations.
Study zoning and other regulations •regarding open industrial uses to better control environmental impacts, particularly the discharge of pollutants into the city’s waterways, odor, and airborne dust and debris. (DCP, 2013)
Revise Waterfront Revitalization Program •to clarify SMIA purpose and intent, review procedures, and strengthen water-dependent uses. (DCP, 2012)
Establish task force on grey-water •discharge prohibition. (EDC, 2011)
Promote environmentally sustainable practices, which will enhance not only waterfront industrial 5. businesses but adjacent residential communities as well.
VISION 2020 STRATEGIES ACTION AGENDA PROJECTS
Related Documents