Go With The Flow- From Charge Nurse to Patient Flow Coordinator Donna Ojanen Thomas, RN, MSN Cynthia J. Royall, RN, BSN

Welcome message from author
This document is posted to help you gain knowledge. Please leave a comment to let me know what you think about it! Share it to your friends and learn new things together.
Transcript

Go With The Flow- From
Charge Nurse to Patient
Flow Coordinator
Donna Ojanen Thomas, RN, MSN
Cynthia J. Royall, RN, BSN

Primary Children’s Medical Center

About PCMC
• Not for profit hospital, part of
Intermountain Health Care
• Only children’s hospital in Utah
• Designated Level I trauma center
• 233 licensed beds

About PCMC ED
• Staffed with board certified pediatric emergency physicians, fellows, NPs, pediatric residents, nurses and ED techs
• 23 beds, including 2 bed trauma bay and 2 bed resuscitation area
• Fast track – opened in September 2003
• RTU – 18 bed short stay area adjacent to ED
• 39,764 visits in 2004

PCMC Yearly Volumes
0
5000
10000
15000
20000
25000
30000
35000
40000
45000
1994 1995 1996 11997 1998 1999 2000 2001 2002 2003 2004

Why We Needed to Change
• Increased volumes and complexity
• Increased LWOTS
• Decreased patient satisfaction
• Decreased staff satisfaction
• Ineffective communication between
caregivers

Triage
Registration
Imag
ing
Mo
nit
or
Entran
ce
Entrance
Ex
it
Entran
ce
Exit
Ready For D/C
Instructions
(Overflow rack)
Resident, Fellow,
NP, Attending To
See Patient
Waiting Area
Ex
am
Ro
om
s
Ex
am
Ro
om
s
Trauma Rooms
Lab Collection slips
Tub
e Statio
n
Chart Started
Ready for
Registration
RN Chart Rack:
Patients To Be
Taken to Exam
Room
Orders Taken Off
By Unit Clerk RN Orders To Be
Completed
1
Waiting For Results Or
Treatment In Progress
5
4
3
2
7
6
8
Attending
Dictation
9
10
Chart
Assembled
and Copied
After D/C
1 = Medical Chart Flow. Does Not Include
Providers Carrying Chart to Exam Rooms
or Other Locations

The Beginning of Change:
2000
• ED doctors present a report to
administration
• Recommended in-room registration
• Identified need to change nursing practice
• Identified problems OUTSIDE the ED
• Did not identify true bottleneck
• Did identify important role of the ED
charge nurse

April, 2002
• ED was assigned reengineering consultant
• Hospital goals:
– Decrease wait times
– Decrease LWOTs
– Improve resource utilization
– Improve patient and family satisfaction

Data Analysis
• Triage not the problem
• Triage to registration only a small part
• Door to doctor time a big cause for delay
• No plan for handling large volumes
• No real set process

Recommendations 2002
• Adapt the charge nurse role to that of a
patient flow coordinator (PFC)
• Standardize triage and discharge process
• Better use of patient tracking system
• Improve coordination of ancillary services

From Charge Nurse to PFC
• Posting the position
• Interviewing
• Hiring staff
• Implementing the role

Patient Flow Coordinator
Responsibilities • Patient room assignment
• RN patient assignment
• Point person for RN, Tech, MD communication
• Directs and Assists care providers with prioritization
• Provides indirect clinical consultation
• Keeps Logicare current
• Receives printed lab results, places on chart, notifies providers
• Checks on delays in Lab, Imaging, Rx, Consults
• Admission Arrangements
• Referral calls
• EMS calls
• Staffing
• Narcotics and Keys
• Assigns students
• Checks/changes EMS tapes
• Orders floor stock meds
• Reassigns trauma RN
patients
• Arranges transfers
• Attends bed control
• Finds help during crises
• Management representative

How Is The PFC Role Different?
• Charge nurse was the clinical expert and
resource
• Charge nurse was not responsible for flow
in the department
• Charge nurse did not assign rooms or
nurses

The New PFC Role
• PFC expected to take more responsibility
in directing care of doctors, nurses and
techs
• PFC would be held accountable for LOS

Why Didn’t This Work?
• Too many variables in flow
• Not enough by-off by the MDs initially
• PFCs found it hard to stay at the desk and
to assign patients
• We needed another clinical expert
• We had made no other improvements

Some Good Came of Our First
Attempts
• PFC role became more standardized –
stronger than old charge nurse role.
• Confirmed benefit of PFC.
• We developed self-scheduling so the PFC
was scheduled 24/7.
• PFC received a pay increase.

Triage
Registration
Imag
ing
Mo
nit
or
Entran
ce
Entrance
Ex
it
Entran
ce
Exit
Waiting Area
Ex
am
Ro
om
s
Ex
am
Ro
om
s
Trauma Rooms
Lab Collection slips
Tub
e Statio
n
Chart Started
Ready for
Registration
Overflow Chart
Rack
Orders Taken Off
By Unit Clerk
1
Home Base
4
3
2
3
5
Attending
Dictation
6
Chart
Assembled
and Copied
After D/C
1 = Medical Chart Flow. Does Not Include
Providers Carrying Chart to Exam Rooms
or Other Locations

Second Attempts: The Little
Red Headed Guy (Spring 2003)

A New Perspective…..
• What is the true bottleneck?
• Is our process designed to maximize the
use of the bottleneck?
• Do our previous ideas really save time?
• Does the organization of the ED promote
the use of the bottleneck?
• Do we just need more staff?

….And Some New Ideas
• Use of Rapid Cycle Testing to try new
things
• Thinking like a systems analyst
• Involving the physicians in the process
• Solving simple flow problems
• Creating change

Some Changes in the PFC Role
• New responsibilities in ED flow
• Mentor relationship
• Leadership responsibilities
• Hospital wide responsibilities

Creating ED Teams
• Layout issues
• Staffing issues
• Experiments
• Waiting room issues: Is it better to put
patients in rooms or leave them in the
waiting room?

Two Team Experiments
• East Team - Education Team
• West Team – Crank Team

Other Changes
• Use only one chart rack
• ED clerk puts patients in rooms
• Chart tags and room numbers
• Okay for doctor to see patient before
nurse
• Zones

Chart Tags to Identify Room

East Team

West Team

Challenges With the Teams
• Staffing to keep teams even
• Assigning patients to the teams
• Helping staff to act like a team
• Creating a team leader

Measuring Success: LWOT
Rates 2003-2004
LWOT RATE
0.00%
1.00%
2.00%
3.00%
4.00%
5.00%
6.00%
7.00%
OCT
NOV
DEC
JAN
FEB
MAR
APR
MAY
JUN
JUL
AUG
SEP
Oct 2002- Sep 2003
Oct 2003- Sep 2004
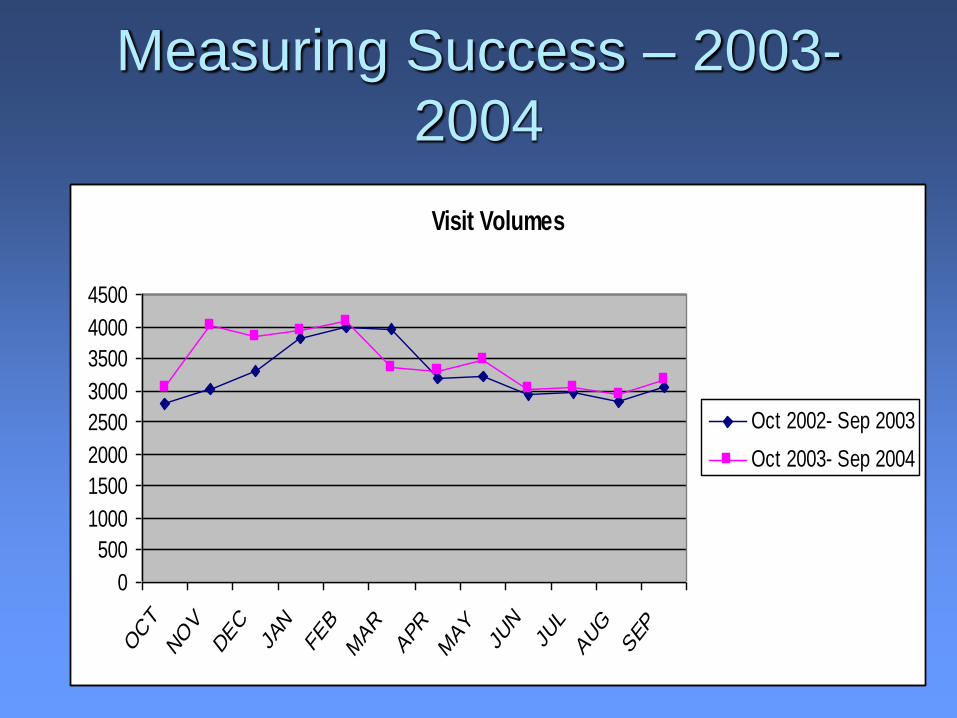
Measuring Success – 2003-
2004
Visit Volumes
0
500
1000
1500
2000
2500
3000
3500
4000
4500
OCT
NOV
DEC
JAN
FEB
MAR
APR
MAY
JUN
JUL
AUG
SEP
Oct 2002- Sep 2003
Oct 2003- Sep 2004

Comparison of Door to Doc Times
Average Door to Doc Wait Time (Minutes)
0
20
40
60
80
100
120
OCT
NOV
DEC
JAN
FEB
MAR
APR
MAY
JUN
JUL
AUG
SEP
Oct 2002- Sep 2003
Oct 2003- Sep 2004

Comparison of LOS
Average ED Length of Stay (Minutes)
0
50
100
150
200
250
OCT
NO
VDEC
JAN
FEB
MAR
APR
MAY
JUN
JUL
AUG
SEP
Oct 2002- Sep 2003
Oct 2003- Sep 2004

Volumes Vs Wait Times
Scatterplot: Volume vs. Wait Time
Before and After Changes
0
20
40
60
80
100
120
140
160
180
0 50 100 150 200
Daily Visit Volume
Daily A
vg
Do
or
to D
oc W
ait
Tim
e (
Min
ute
s)
Oct 2002 thru Sep 2003
Oct 2003 thru Sep 2004

Other Improvements
• Fax report pilot
• Tube orders to pharmacy
• Improved patient satisfaction
• PRN nurses from adult hospital
• Increased staff satisfaction, including float
nurses

Things We Still Need to Do
• Improve triage process – use of NP
• Revisit in-room registration
• Improve discharge and admission process
• Change the culture
• Involve overall hospital in ED
overcrowding

What We Learned
• Variations in volumes need to be planned
for
• Need to look at the types of patient and
the workload, not just numbers
• Need to constantly reinforce and reward
the change and hold people accountable

What is Necessary for
Improvement?
• Administrative support
• A “little red headed guy”
• Clean up your own house first
• Experiments rather than making a big
change
• Staff involvement
• Realize you are never done

Summary

Related Documents