GNSS MARKET REPORT ISSUE 1 October 2010 GSA GNSS Market Report – Issue 1

Welcome message from author
This document is posted to help you gain knowledge. Please leave a comment to let me know what you think about it! Share it to your friends and learn new things together.
Transcript

GNSS MARKET REPORTISSUE 1
October 2010 GSA GNSS Market Report – Issue 1

TABLE OF CONTENTS2
EXECUTIVE SUMMARY 4
INTRODUCTION 5
GNSS MARKET 6
GLOBAL MARKET OVERVIEW 6
ROAD 8
LOCATIONBASED SERVICES LBS 14
AVIATION 20
AGRICULTURE 26
ANNEXES 32
ACRONYMS 32
ABOUT THE EUROPEAN GNSS PROGRAMMES 33

3PREFACE
Methodology and sources of information
This market report has been produced using the GSA’s* market monitoring and forecasting process. The underlying forecasting model is based on advanced econometric techniques.
An extensive set of variables is used to model scenarios based on key assumptions. These assumptions are cross-checked through an iterative process involving renowned experts in
key areas of each market segment. In adddition, a consistency check is performed for each segment by comparing the model’s results with the most recent market research reports
from independent sources. Nevertheless, due to the inherent uncertainties in long term forecasting, a margin of error is unavoidable.
The model makes use of publicly available information including the following sources: Eurostat, US National Transportation Statistics, International Road Assessment Programme
(iRAP), United Nations public information, International Telecommunication Union (ITU), Nations Online, Boeing, Airbus, Federal Aviation Administration, Flight Insight, and the Food
and Agriculture Organisation (FAO).
Feedback and further information
We are looking forward to receive any comments and feedback. If you have any questions regarding this report, please contact GSA market development at: [email protected]
Disclaimer
The information provided in this report is based on the GSA’s best estimates and forecasts at the time of publication**. Although the GSA has taken the utmost care in checking
the reasonableness of assumptions and results with the support of industry experts, the GSA cannot guarantee the accuracy of the information presented and hence does not
take any responsibility in the further use made of the content of this report.
* About the GSA: The European GNSS Agency (GSA) is an agency of the European Union. One of its missions is to support the European Commission in promoting the market exploitation of Galileo and EGNOS, keeping Europe at the forefront of the satellite navigation sector.
** Previous reports: In the past GSA has communicated various market forecasts through diff erent channels including GSA’s own website and conference presentations. The current publication is based on the latest and most comprehensive analyses and takes into account the most recent trends and the most recent information with respect to the Galileo deployment. In addition the period analysed has been extended until 2030 and market defi nition has been clarifi ed.

2020201820162014201220102008
41
124
58
133
87
167
104
198
125
218
148
234
165
244
Core GNSS market, accounting only parts of the retail price that are directly attributable to GNSS (e.g. chipset, maps, navigation software) in LBS sector
Enabled GNSS market, accounting e.g. full price of GNSS mobile phones in LBS sector
+11% p.a.
4 EXECUTIVE SUMMARY
The market for GNSS will grow signifi cantly over the next decade
Global GNSS market size (€ bln) Global core GNSS market by segment (cumulated revenues 2010-2020)
0.6%
56.4%
42.8%
0.2%
Total ~ €1260 bln
Agriculture
Road
Aviation
LBS
The worldwide GNSS market is growing fast and revenues are expected to increase
at a 11% CAGR over the next decade.
The total enabled GNSS market size in 2020 is estimated at €244 bln, the core global
GNSS market is estimated at €165 bln.
LBS and Road will be the market sectors with the highest revenue generation.

5INTRODUCTION
Four market segments covered
The following segments have been selected as they represent the largest volume of users
and/or public benefi ts.
Road: including PND and in-vehicle systems
LBS: including GNSS-enabled mobile phones and services
Agriculture: including low and high technology
Aviation: including GNSS devices for commercial and general aviation
Global geographic coverage
European Union (EU-27)
North America
China*
Japan*
Rest of the world**
GNSS market
The GNSS market is the market of products and services using GNSS based positioning
and navigation as a signifi cant enabler.
When assessing the size of the market for multi-purpose products like mobile phones,
a correction factor is taken into account to refl ect only the (retail) value of the parts
related to positioning and navigation, for example:
PND: 100% of retail value as GNSS is the key enabler;
GNSS-enabled phone: For the core market, only the value of chipsets, maps
and navigation software is counted. For the enabled market, the full retail value
of the phone is counted;
Subscription to a GNSS-enabled location based service such as local search:
100% of retail value;
Precision agriculture system: only the retail value of the GNSS receivers,
the maps and the navigation software is counted.
GNSS core market vs. enabled market
The core market include only the parts of the retail value
of the product and services that are attributable to GNSS,
e.g. chipset, maps, navigation software.
The enabled market includes the full retail value of
the GNSS-enabled platform, e.g. in LBS full price of the
mobile phone.
Market defi nitions
* not included in all exhibits
** includes non-EU European countries
GNSS enabled market
GNSS core market
€41 bln
€83 bln
€124 bln
2008
Global GNSS market size

European Union North America Rest of the World
202020182016201420122010
437
673
857964
1 0381 089
+10% p.a.
202020182016201420122010
58
133
87
167
104
198
125
218
148
234
165
244+11% p.a.
Core GNSS market, accounting only parts of the retail price that are directly attributable to GNSS (e.g. chipset, maps, navigation software) in LBS sector
Enabled GNSS market, accounting e.g. full price of GNSS mobile phones in LBS sector
6 GNSS MARKET GLOBAL MARKET OVERVIEW
Global: Core GNSS market to reach €165 bln in 10 years
Core GNSS market by segment (cumulated revenues 2010-2020)
GNSS market share by companies’ origin (2009)*
0.6%
56.4%
42.8%
0.2%
Total ~ €1260 blnAgriculture
Road
Aviation
LBS
15%
30%20%
35%
US
JapanOthers
EU
Shipments of GNSS devices worldwide (mln units)
Global GNSS market size (€ bln)
GNSS device shipments will grow on average 10% per year over the next decade
reaching 1.1 bln shipments by 2020.
Despite signifi cant growth since 2006, signifi cant untapped potential remains. The overall
worldwide GNSS revenues for civil applications are expected to grow on average by 11% per
year reaching €165 bln in 2020 (core market), of which €32 bln is generated in the EU.
LBS and Road will be the market sectors with the highest revenue generation.
* This analysis is based on the turnover of the top 15 of companies involved in GNSS.

7GLOBAL MARKET OVERVIEW GNSS MARKET
EU: 200 mln GNSS devices shipped every year by 2016
EU shipments (mln units) and EU penetration (%) of GNSS devices
Aviation
Agriculture
Road
LBS
Aviation
Agriculture
Road
LBS
0
50
100
150
200
250
202020182016201420122010
Pe
ne
tratio
n (%
)
Sh
ipm
en
ts (
mln
un
its)
+18% p
.a.
0% p.a.
GNSS shipments GNSS penetration
0%
20%
40%
60%
80%
100% GNSS-enabled device sales in the EU will continue to increase over
the next 6 years at a CAGR of 18% and will plateau at about 200 mln
annual shipments in 2016.
LBS handset sales make up the majority of GNSS device sales, about
174 mln in 2020 up from 38 mln in 2010. Over the same period,
penetration will increase from below 20% to nearly 100%.
Road GNSS shipments are expected to peak at 65 mln in 2014 after
which shipments start to decline, cannibalised by smartphones used
as navigation devices. Penetration will grow from 34% to almost 90%.
In aviation and agriculture, unit shipments are much lower due to a
much smaller addressable market. In the aviation sector an increase in
GNSS penetration from 36% in 2010 to 97% in 2020 is expected while
GNSS penetration in agriculture is expected to reach 33% in 2020, up
from 16% in 2010.

GNSSS adoopteed /deciisioonn taaakenn
GNSSS under eevaluattionn
GNSS MARKET ROAD CURRENT MARKET8
Road: more than navigation
Car navigation
Car navigation is currently the main application of GNSS. GNSS data combined with
electronic maps allow positioning and guidance of the road user. PND sales have enjoyed
fast growth over the last 4 years: 76% per year worldwide, 55% in the EU.
PNDs are especially popular in the
EU, while Japanese and US consumers
favour in-vehicle systems and consumers
in emerging markets like China often
favour mobile phone-based navigation
systems.
Fleet management and logistics
GNSS-based fl eet management systems are used to locate vehicles
(e.g. trucks, buses, police cars, taxis) in order to optimise resource
management, reduce travel time, increase security and reduce fuel
consumption.
In 2009 the number of vehicles equipped with fl eet management and vehicle tracking
systems was 6 mln in North America and roughly 5 mln in the EU. Beyond vehicles,
containers are increasingly being equipped with GNSS-enabled devices.
Road User Charging
GNSS-based toll collection systems allow
more effi cient use of the road infrastructure,
reducing both traffi c and environmental
eff ects.
In 2009, 3 EU countries have
already decided to use GNSS
for toll collection in the future
and 9 are evaluating it.
Emergency call
In-vehicle emergency call systems allow the emergency services to remotely locate
vehicles in a diffi cult situation, resulting from a collision, etc.
The European “eCall” programme foresees that all new
cars manufactured in the EU in the next few years will be
equipped with an emergency call system. In 2009, 15 EU
Member States have signed the eCall Memorandum of
Understanding.
200920072005
3
15
19+55% p.a.
EU PND shipments (mln units)
Adoption of GNSS based toll collection systems in the EU
ROAD CURRENT MARKET GNSS MARKET 9
* PND has been chosen as an example. Value chain for in-vehicle devices or applications like Road User Charging follows a diff erent pattern.** includes traffi c, weather, point of interest information
Chipset manufacturers
Other content providers**
Map data providers
Device vendors
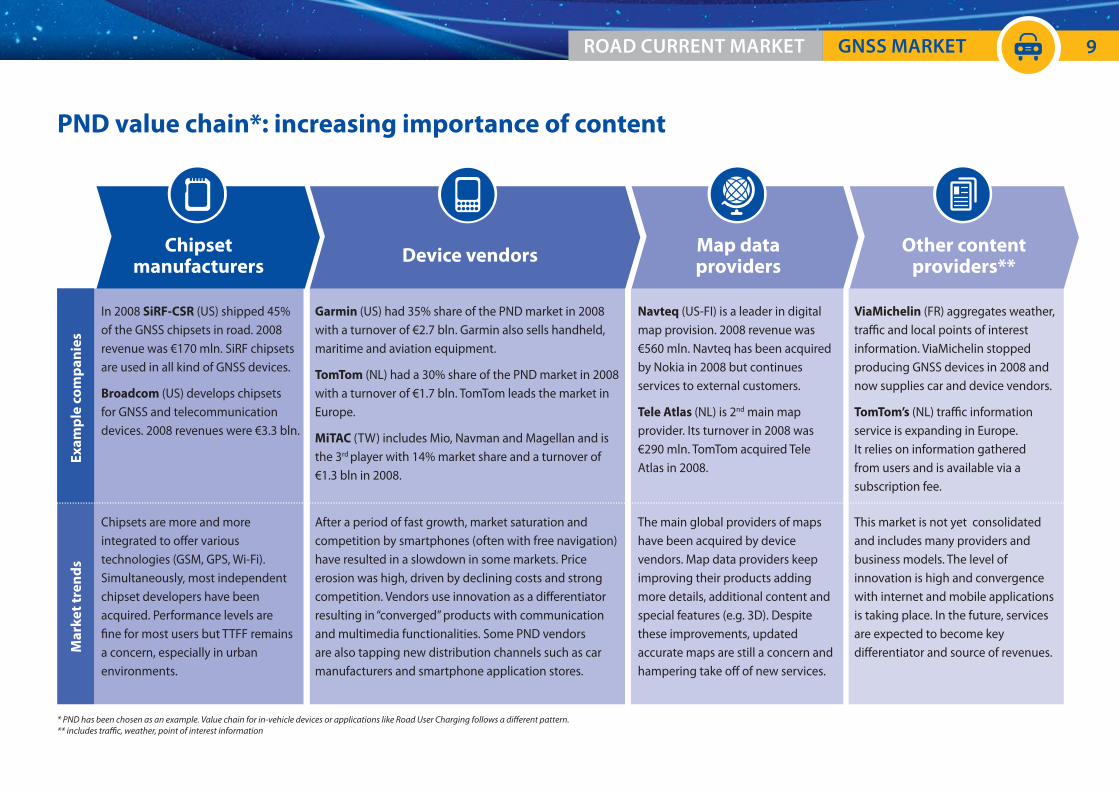
PND value chain*: increasing importance of content
Ex
am
ple
co
mp
an
ies
In 2008 SiRF-CSR (US) shipped 45% of the GNSS chipsets in road. 2008 revenue was €170 mln. SiRF chipsets are used in all kind of GNSS devices.
Broadcom (US) develops chipsets for GNSS and telecommunication devices. 2008 revenues were €3.3 bln.
Garmin (US) had 35% share of the PND market in 2008 with a turnover of €2.7 bln. Garmin also sells handheld, maritime and aviation equipment.
TomTom (NL) had a 30% share of the PND market in 2008 with a turnover of €1.7 bln. TomTom leads the market in Europe.
MiTAC (TW) includes Mio, Navman and Magellan and is the 3rd player with 14% market share and a turnover of €1.3 bln in 2008.
Navteq (US-FI) is a leader in digital map provision. 2008 revenue was €560 mln. Navteq has been acquired by Nokia in 2008 but continues services to external customers.
Tele Atlas (NL) is 2nd main map provider. Its turnover in 2008 was €290 mln. TomTom acquired Tele Atlas in 2008.
ViaMichelin (FR) aggregates weather, traffi c and local points of interest information. ViaMichelin stopped producing GNSS devices in 2008 and now supplies car and device vendors.
TomTom’s (NL) traffi c information service is expanding in Europe. It relies on information gathered from users and is available via a subscription fee.
Ma
rke
t tr
en
ds
Chipsets are more and more integrated to off er various technologies (GSM, GPS, Wi-Fi). Simultaneously, most independent chipset developers have been acquired. Performance levels are fi ne for most users but TTFF remains a concern, especially in urban environments.
After a period of fast growth, market saturation and competition by smartphones (often with free navigation) have resulted in a slowdown in some markets. Price erosion was high, driven by declining costs and strong competition. Vendors use innovation as a diff erentiator resulting in “converged” products with communication and multimedia functionalities. Some PND vendors are also tapping new distribution channels such as car manufacturers and smartphone application stores.
The main global providers of maps have been acquired by device vendors. Map data providers keep improving their products adding more details, additional content and special features (e.g. 3D). Despite these improvements, updated accurate maps are still a concern and hampering take off of new services.
This market is not yet consolidated and includes many providers and business models. The level of innovation is high and convergence with internet and mobile applications is taking place. In the future, services are expected to become key diff erentiator and source of revenues.

20092008200720062005
12
21
48
61
84
European Union North America Rest of the World
GNSS penetration in vehicles*
+63% p.a.
4% 7% 12% 17% 22%
%
GNSS MARKET ROAD CURRENT MARKET10
Explosive market growth and strong price erosion
* The penetration represents the percentage of vehicles in use which have a GNSS device.
Worldwide shipments of GNSS devices in road sector (mln units) Average price per device (€)
Analysis of the market evolution
GNSS consumer market for road applications has exploded in the past 5 years adding over 63% per year in terms of shipments.
As a result, in 2009 almost 30% of road vehicles in the EU have a GNSS device on board, 22% worldwide. This high penetration resulting from navigation systems can represent an
opportunity for other applications (e.g. road tolling, Advanced Driver Assistance Systems).
Simultaneously signifi cant price erosion has taken place, especially for PND where the average price per device declined from over €600 to under €200 in 5 years.
PND average price In-vehicle system average price
0
500
1 000
1 500
2 000
20092008200720062005

PND In-vehicle devices Smartphones used as PND*
Pe
ne
tratio
n (%
)
Sh
ipm
en
ts (
mln
un
its)
GNSS penetration in vehicles**
0
100
200
300
400
500
2020201820162014201220100%
20%
40%
60%
80%
100%
11ROAD FORECAST & TRENDS GNSS MARKET
* Smartphones used as PND are a subset of GNNS equipped smartphones in LBS market segment and counted only once in the global market size.** The penetration represents the percentage of vehicles in use which have a GNSS device.
Worldwide shipments (mln units) and penetration (%) of installed base of GNSS devices in road sector
By 2020, the majority of vehicles will be equipped with a navigation device
Driver Assumption
Stock of vehicles Global CAGR of 4.7%
GNSS device penetration S-Curve based on the past mobile phone market evolution
Substitution of dedicated devices by smartphones
24% by 201548% by 2020
Combined GNSS penetration worldwide (including smartphones used as PND) will reach 87% by 2020 from 28% today while shipments will exceed 400 mln.
PND sales have substantially grown in recent years and are expected to peak in 2013. After this peak, shipments of PND are expected to decline while shipments of factory-
installed in-vehicle navigation systems and the adoption of GNSS-enabled mobiles for turn-by-turn navigation will continue to increase.

Av
era
ge
price
pe
r de
vice
(€)
Re
ve
nu
es
fro
m d
ev
ice
s (€
bln
)
PND In-vehicle devices Smartphones used as PND*
PND average price In-vehicle average price
0
20
40
60
80
100
120
2020201820162014201220100
200
400
600
800
1,000
1,200
12 GNSS MARKET ROAD FORECAST & TRENDS
* Smartphones used as PND are a subset of GNSS equipped smartphones in LBS market segment and counted only once in the global market size.
Global GNSS market size (€ bln) and device prices (€) in road sector
GNSS revenues from devices to consolidate from 2014
Driver Assumption
PND price 7% annual price decrease
In-vehicle device price 6% annual price decrease
GNSS penetration High penetration of GNSS limits growth area in pure device sales
Prices for PND are expected to decrease from €150 in 2010 to €70 in 2020 (-7% CAGR). Prices of in-vehicle systems (in-car platform for cooperative systems and advanced
services) will decrease from €1070 in 2010 to €600 in 2020 (-6% CAGR).
Total GNSS road segment revenues will increase rapidly from €49 bln in 2010 to €74 bln in 2014 driven by the increase in device sales. From 2014 onwards, the eff ect of
decreasing prices will cause revenue growth to slow. In 2020 estimated global device revenues in the road sector are €87 bln.
Services based on cooperative systems such as advanced services for safety, assistance to the driver and active traffi c management — as well as new and innovative information
and entertainment services — will provide an important additional source of growth (not modelled in the scope of this report).

European Union Japan
North America China
0%
20%
40%
60%
80%
100%
202020182016201420122010 202020182016201420122010
European Union North America Rest of the World
+14% p.a.
36
43
36
66
77
53
84
62
75
123
76
65
187
95
65
231
120
69
13ROAD FORECAST & TRENDS GNSS MARKET
Fastest growth observed in RoW, EU penetration to saturate by 2018
GNSS penetration in road sector (%) Shipments of GNSS devices in road sector* (mln units)
GNSS penetration in road sector by region
Penetration of GNSS in road sector will exceed 50% in the European Union already in
2012 and will continue to grow up to 87% in 2020. The Japanese and North American
markets will reach almost 100% penetration from 2015 and 2018 respectively.
GNSS devices shipments in road sector by region
Shipments of GNSS devices in the road sector are expected to grow in all regions with
an average of 14% to reach 69 mln units in the EU (CAGR 7%), 120 mln in North America
(CAGR 11%) and 231 mln in the rest of the world (CAGR 20%).
* includes the subset of smartphones used as PND, however these devices are counted only once in the global market size.

14 GNSS MARKET LBS CURRENT MARKET
Increasing consumer and developer awareness
All major mobile phone operating system vendors provide API with
location functions.
In the UK, France and Germany 5 out of 10 best selling iPhone’s
applications in 2009 are related to navigation or are location based
applications.
30% of Android developer’s contest winners used location in their
application.
Nokia experienced 7 mln downloads of its map software in the 3 months
after off ering free navigation.
Improvement in navigation performance
Leading smartphones display a host of technologies to improve position performance:
Assisted-GPS to reduce Time To First Fix
Magnetic compass
Highly sensitive GNSS chipset
Wi-Fi, cellular and hybrid positioning as back-up
Motion sensors and gyroscopes for tilt
Map matching for road use
* Similar concepts by Google, Nokia, RIM.
Mobile LBS are taking off as progress is being made in diff erent areas
Application stores provide a viable business model
More and more mobile phones with GNSS inside
iPhones sold (million)
Apps available (000’)
200920082007
1.4
12
21
100
100
Apple example*
>200,000 apps
>5 bln downloads
$1.4 bln revenues
Driving iPhone sales
Increasing mobile traffi c
Similar concepts developped
by competitors
15LBS CURRENT MARKET GNSS MARKET
Chipset manufacturers
Application and content developers
Map data providers
Smartphone Vendors
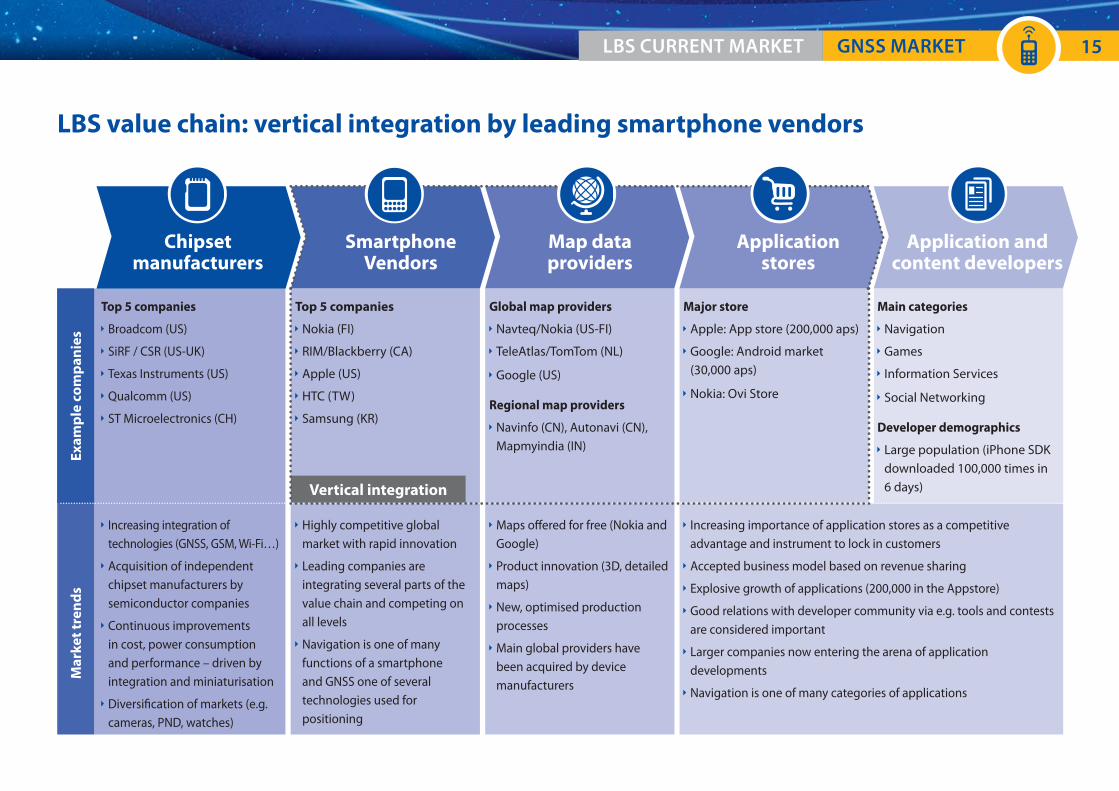
LBS value chain: vertical integration by leading smartphone vendors
Ex
am
ple
co
mp
an
ies
Top 5 companies
Broadcom (US)
SiRF / CSR (US-UK)
Texas Instruments (US)
Qualcomm (US)
ST Microelectronics (CH)
Top 5 companies
Nokia (FI)
RIM/Blackberry (CA)
Apple (US)
HTC (TW)
Samsung (KR)
Global map providers
Navteq/Nokia (US-FI)
TeleAtlas/TomTom (NL)
Google (US)
Regional map providers
Navinfo (CN), Autonavi (CN), Mapmyindia (IN)
Major store
Apple: App store (200,000 aps)
Google: Android market (30,000 aps)
Nokia: Ovi Store
Main categories
Navigation
Games
Information Services
Social Networking
Developer demographics
Large population (iPhone SDK downloaded 100,000 times in 6 days)
Ma
rke
t tr
en
ds
Increasing integration of technologies (GNSS, GSM, Wi-Fi…)
Acquisition of independent chipset manufacturers by semiconductor companies
Continuous improvements in cost, power consumption and performance – driven by integration and miniaturisation
Diversifi cation of markets (e.g. cameras, PND, watches)
Highly competitive global market with rapid innovation
Leading companies are integrating several parts of the value chain and competing on all levels
Navigation is one of many functions of a smartphone and GNSS one of several technologies used for positioning
Maps off ered for free (Nokia and Google)
Product innovation (3D, detailed maps)
New, optimised production processes
Main global providers have been acquired by device manufacturers
Increasing importance of application stores as a competitive advantage and instrument to lock in customers
Accepted business model based on revenue sharing
Explosive growth of applications (200,000 in the Appstore)
Good relations with developer community via e.g. tools and contests are considered important
Larger companies now entering the arena of application developments
Navigation is one of many categories of applications
Application stores
Vertical integration

0
60
120
180
240
300
20092008200720062005
5% 7% 9% 11% 15%
European Union
North America
Rest of the World
GNSS-enabled device price*
GNSS penetration in mobile phones**
Av
era
ge
price
of G
NS
S-e
na
ble
d d
ev
ice (€
)
Sh
ipm
en
ts o
f G
NS
S-e
na
ble
d m
ob
ile
ph
on
es
(mln
un
its)
0
70
140
210
280
350
%
16 GNSS MARKET LBS CURRENT MARKET
* Only a fraction of this price is used to estimate the revenues attributable to GNSS.** The penetration represents the percentage of mobile phones in use which are GNSS-enabled.
GNSS penetration in mobile phones reached 15% in 2009
Analysis of the market evolution
Global shipments of GNSS-enabled mobile phones increased from
60 mln to 280 mln in the last 5 years (45% CAGR).
In the same period, GNSS penetration worldwide has increased
from below 5% to 15% in 2009.
Simultaneously prices decreased about 10% annually. In 2009 the
average selling price of a GNSS equipped mobile phone was just
above €200.

17LBS FORECAST & TRENDS GNSS MARKET
Almost 1 billion GNSS-enabled mobile phones shipped every year in 2020
Shipments of GNSS-enabled mobile phones (mln units) and penetration of GNSS in mobile phones (%) worldwide
Driver Assumption
Population growth Annual growth of 1%
GNSS penetration By 2020, more than 65% GNSS penetration in mobile phones worldwide
Device diff usion Based on market forecasts of replacement cycle
Pe
ne
tratio
n (%
)
Sh
ipm
en
ts (
mln
un
its)
0
125
250
375
500
625
750
875
1,000
202020182016201420122010
GNSS enabled mobile phones GNSS penetration in mobile phones
0%
10%
20%
30%
40%
50%
60%
70%
80%
Shipments of GNSS-enabled smartphones, PDA and mobile handsets are expected to increase from 350 mln to almost 1bln (11% CAGR) over the next decade.
By 2020 the penetration of GNSS-enabled mobile phones will have reached 65%. This growth is expected to slow down after 2020 as the markets in most countries will be mature.
These developments are driven by increasing attractiveness and increasing aff ordability of LBS devices.
Attractiveness: Besides navigation, new applications and services such as vulnerable people tracking, mobile commerce and location-based games are becoming prevalent.
Aff ordability: Price erosion and reduced power consumption of GNSS chipsets thanks to integration and miniaturisation make it easier and cheaper to integrate GNSS in
mobile phones.

18 GNSS MARKET LBS FORECAST & TRENDS
Value-added services will drive revenues in the global LBS market
Global GNSS market size (€ bln) and device prices and service spendings (€) in LBS sectorDriver Assumption
Location based service subscribers
22% in 2015
43% in 2020
ARPU 9% CAGR 2010-2020
GNSS-enabled device price From €190 in 2010 to €90 in 2020
Price
(€)
Re
ve
nu
es
(€ b
ln)
GNSS enabled device price
Subscribers to GNSS based services among GNSS equipped users
GNSS ARPU from services
0
50
100
150
200
202020182016201420122010 202020182016201420122010
%
14% 21% 30% 43% 54% 59%
Core GNSS market, accounting only parts of the retail price that are directly attributable to GNSS (e.g. chipset, maps, navigation software)
Enabled GNSS market, accounting full price of GNSS mobile phones
0
50
100
150
200
Total annual core GNSS revenues in LBS are expected to grow between 2010 and 2020 from €12 bln to €96bn (24% CAGR). More than 85% of cumulated revenues during the
period are from GNSS based services, the remainder coming from devices sales.
ARPU from GNSS based services will grow at an average of 9% per year during the next decade. Average revenues will increase as new personal location-based services are developed,
such as people tracking, mobile commerce and location-based games. Device prices on the other hand will decline from an average of €190 in 2010 to €90 in 2020 (-7% CAGR).
The growth of revenues is also driven by the increased penetration of GNSS in mobile handsets (reaching 65% by 2020) and the larger base of mobile users (+11% from 2010 to 2020).
Devices = 15%
Services = 85%
Distribution of revenues Devices vs. Services(% of cumulated value 2010-2020)

+11%
202020182016201420122010
352
528
719
839
913
974
European Union North America Rest of the World
19LBS FORECAST & TRENDS GNSS MARKET
EU to experience signifi cant growth
GNSS penetration by region
Penetration in 2010 is much higher in North America and Japan driven by early
availability of GNSS-enabled phones. The gap is expected to decline as penetration of
GNSS in mobile phones will already exceed 50% in the European Union in 2015 and will
continue to grow up to 97% in 2020. At this time, the penetration of GNSS in mobile
phones will reach 97% in North America, almost 100% in Japan and 82% in China.
GNSS-enabled mobile phone shipments by region
Shipments of GNSS-enabled smartphones are expected to grow in all regions by an
average of 11% per year and reach 175 mln units in the European Union (CAGR 16%), 205
mln in North America (CAGR 3%) and almost 600 mln in the rest of the world (CAGR 14%).
GNSS penetration in mobile phones (%) Shipments of GNSS-enabled mobile phones (mln units)
European Union Japan North America China
0%
20%
40%
60%
80%
100%
202020182016201420122010

20 GNSS MARKET AVIATION CURRENT MARKET
GNSS devices increasingly relevant for aviation
Commercial Aviation (CA) and General Aviation (GA)
Commercial aviation involves scheduled commercial
passenger and cargo fl ights. Most commercial aviation
aircraft have GNSS integrated in their avionics and usually
feature two receivers.
General aviation covers a wide range of activities such as
leisure, business, surveillance, etc. and usually involves smaller sized aircraft.
In general aviation GNSS equipped aircraft have a stand-alone device with panel
mounted display. For these, GNSS deployment is quicker, easier and cheaper than for
large aircraft with a separate FMS.
Use of GNSS in Aviation
Traditionally, radio navigation systems near airports, combined with inertial systems
which keep track of the plane’s location are used. GNSS-based navigation has the
potential to greatly complement these systems for en-route navigation at all altitudes
and for airport approaches.
However, in order to match the accuracy, integrity and availability of integrity of existing
infrastructure based on Instrument Landing Systems (ILS) CAT II and CAT III, additional
ground-based augmentation systems are required near the runways.
Users requirements in the aviation market are diff erentiated between CA and GA and
evolve slowly due to heavy regulation and safety concerns and due to the long life cycle
of aircraft (>20 years).
* Delays, Diversions and Cancellations
Benefi ts of SBAS, the case for EGNOS
The aviation market requires the highest possible robustness and integrity. SBAS systems
improve the accuracy and integrity of GNSS via a network of ground stations that take
measurements of GNSS and broadcast information messages to users via satellite. The US
WAAS system is an SBAS developed by the US FAA.
EGNOS, the European SBAS, is set to be certifi ed for civil
aviation in 2010. Its enhanced vertical precision and integrity
will improve safety, effi ciency and accessibility.
EGNOS enables:
Reduced occurrence of Controlled Flight into Terrain by 75%.
Decision altitudes for landing similar to ILS CAT I, reducing costly DDC* without the
need for airport infrastructure.
Curved approaches and continuous descent paths, which can reduce noise and emissions.
Opportunity for GNSS
GNSS overcomes many of the defi ciencies in today’s air traffi c infrastructure thanks to
its accurate, continuous, all-weather positioning. This is especially relevant for GA which
often use smaller airports.
The Single European Sky ATM Research (SESAR) programme defi nes
in its 2020 navigation baseline that the primary means for aircraft
positioning should be GNSS for all fl ight phases using a minimum
of two dual frequency satellite constellations or augmentation
systems (including SBAS). Today all new commercial aircraft are equipped with GNSS
devices. GNSS will eventually be widely used throughout the world.

21AVIATION CURRENT MARKET GNSS MARKET
Aviation value chain: increasing reliance on on-board solutions
Device manufacturers
AirportsAirlines / Aircraft owners
Aircraft manufacturers
Ex
am
ple
co
mp
an
ies
Main players (CA)
Honeywell (US)
Rockwell Collins (US)
Thales Avionics (FR)
Main players (GA)
Garmin (US)
Honeywell (US)
Main players (CA)
Airbus (EU)
Boeing (US)
Main players (GA)
Cessna (US)
Dassault (FR)
Embraer (BR)
Piper (US)
Main airline alliances
Oneworld
SkyTeam
Star Alliance
General aviation
Aircraft Owners and Pilots Association (AOPA)
Main organisation
The Civil Air Navigation Services Organisation (CANSO) represents the ANSP worldwide.
The International Civil Aviation Organisation (ICAO) codifi es the principles of international air navigation.
Main categories
International airports
Regional airports
Private airports
Ma
rke
t tr
en
ds
Increasing sophistication of avionics and specifi cally navigation systems.
Robustness and integrity remain a priority and results in the evolution towards a multi-constellation and multi-frequency environment.
Reducing reliance on ground navigation infrastructures, especially in General Aviation, partly to avoid reliance on low-quality or poorly maintained navigation aids in some parts of the world.
Migration of navigation route control from ground based infrastructures to on-board solutions such as GNSS, SBAS and other on board sensors.
Increasing reliance on on-board solutions for airport approaches.
Air Navigation Service Providers (ANSP)
+4% p.a.
European Union North America Rest of the World
200920082007
8488
91
GNSS penetration in aircraft*%
27% 31% 35%
22 GNSS MARKET AVIATION CURRENT MARKET
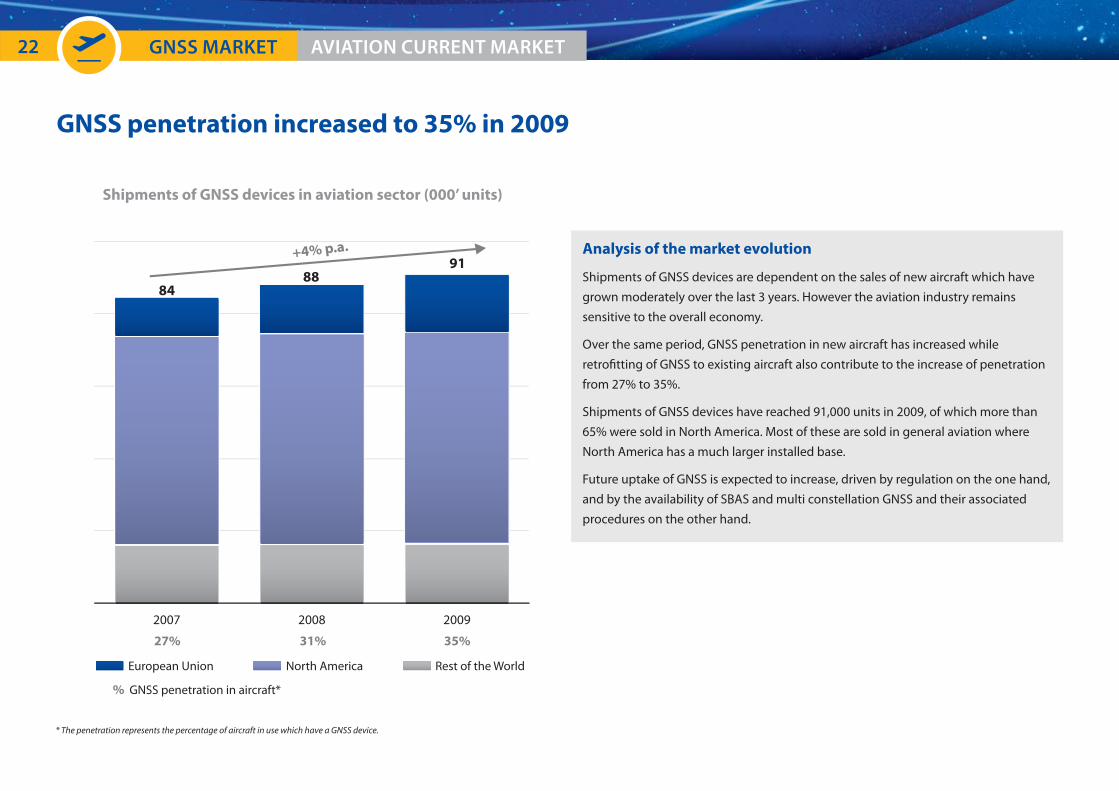
GNSS penetration increased to 35% in 2009
Shipments of GNSS devices in aviation sector (000’ units)
Analysis of the market evolution
Shipments of GNSS devices are dependent on the sales of new aircraft which have
grown moderately over the last 3 years. However the aviation industry remains
sensitive to the overall economy.
Over the same period, GNSS penetration in new aircraft has increased while
retrofi tting of GNSS to existing aircraft also contribute to the increase of penetration
from 27% to 35%.
Shipments of GNSS devices have reached 91,000 units in 2009, of which more than
65% were sold in North America. Most of these are sold in general aviation where
North America has a much larger installed base.
Future uptake of GNSS is expected to increase, driven by regulation on the one hand,
and by the availability of SBAS and multi constellation GNSS and their associated
procedures on the other hand.
* The penetration represents the percentage of aircraft in use which have a GNSS device.

23AVIATION FORECAST & TRENDS GNSS MARKET
GNSS penetration is expected to reach 75% of aircraft by 2020
Shipments (000’ units) and penetration (%) of GNSS devices worldwide in aviation sector
Driver Assumptions
General aviation fl eet 1% growth 2010-2020
93% of total fl eet in 2010
Retrofi tting (CA and GA – IFR) 1% of aircraft stock
GA – VFR life cycle 4 years
SESAR regulation (Europe) 100% GNSS penetration expected by 2020
Distribution CA vs. GA (% of shipments)
Pe
ne
tratio
n (%
)
Sh
ipm
en
ts (
00
0’ u
nit
s)0
20
40
60
80
100
120
140
160
Shipments GNSS penetration in aircraft
0%
10%
20%
30%
40%
50%
60%
70%
80%
202020182016201420122010
CA = 2%
GA = 98%
Over the next decade, GNSS penetration is expected to rapidly increase from 38% in 2020 to 75% by 2020.
Shipments increase, from 94,000 to 147,000 (CAGR 4%).
Device sales for general aviation aircraft will account for about 98% of the total.

24 GNSS MARKET AVIATION FORECAST & TRENDS
Revenues from GNSS in aviation will reach €415 mln in 2020
Global GNSS market size (€ mln) and device prices (€) in aviation sector
* from sales of devices** price of Flight Management System including GNSS receiver
Driver Assumptions
GNSS penetration 58% by 2015
75% by 2020
Distribution VFR/IFR in GA 74% VFR
26% IFR
Average GNSS receiver price 2010-2020
CA – €34,000** GA – €2,900
Av
era
ge
price
(€)R
ev
en
ue
s (€
mln
)0
50
100
150
200
250
300
350
400
450
500
202020182016201420122010
Revenues from CA* Revenues from GA*
CA average device priceGA average device price
0
5,000
10,000
15,000
20,000
25,000
30,000
35,000
40,000
45,000
50, 000
202020182016201420122010
Total cumulated revenues from GNSS in the aviation sector for the period 2010-2020 will be €4.2 bln. Large aircraft will account for 19% of total revenues, regional aircrafts for 5%
and general aviation for 76%.
In commercial aviation average price of Flight Management System including GNSS receivers are expected to fall from €37,000 in 2010 to €31,000 in 2020 while average prices of
GNSS devices in general aviation will decline from €3,200 in 2010 to €2,000 in 2020, corresponding to a 2% annual price erosion.

25AVIATION FORECAST & TRENDS GNSS MARKET
Strongest growth is expected in the EU
GNSS penetration in aircraft (%) Shipments of GNSS devices in aviation sector (000’ units)
GNSS penetration by region
Penetration of GNSS in aviation will already exceed 70% in the European Union in 2015,
growing to 97% by 2020 driven by the SESAR programme. In North America, penetration
of GNSS in aircraft will reach 78% by 2020.
GNSS device shipments in aviation by region
Shipments of GNSS receivers in the aviation sector are expected to grow in all regions to
reach 42,000 units in the European Union (CAGR 14%), 61,000 in North America (CAGR
1%) and 44,000 in the rest of the world (CAGR 5%). Despite the EU displaying faster
growth in penetration, the higher installed base of aircraft in North America results in the
highest volumes being shipped there.
North AmericaEuropean Union
20%
40%
60%
80%
100%
202020182016201420122010EU North Amercia Rest of the World
94 103103
112123
135
147+5% p.a.
202020182016201420122010
26 GNSS MARKET AGRICULTURE CURRENT MARKET
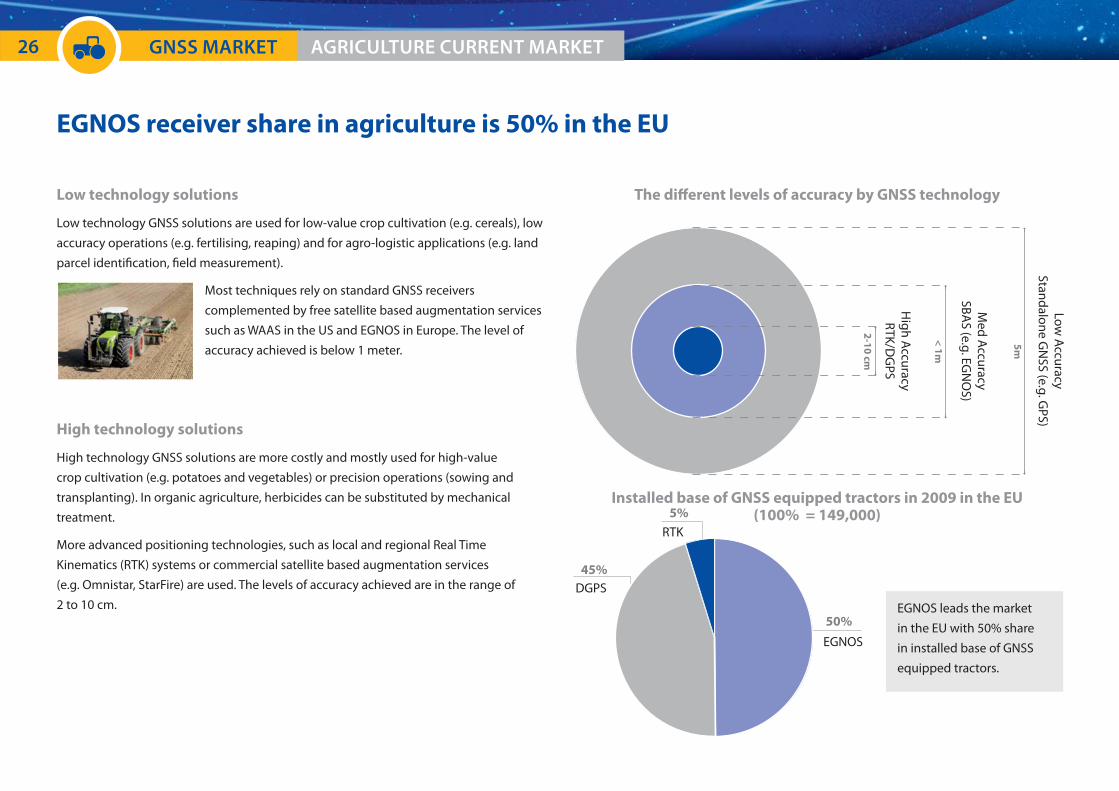
EGNOS receiver share in agriculture is 50% in the EU
Low technology solutions
Low technology GNSS solutions are used for low-value crop cultivation (e.g. cereals), low
accuracy operations (e.g. fertilising, reaping) and for agro-logistic applications (e.g. land
parcel identifi cation, fi eld measurement).
Most techniques rely on standard GNSS receivers
complemented by free satellite based augmentation services
such as WAAS in the US and EGNOS in Europe. The level of
accuracy achieved is below 1 meter.
High technology solutions
High technology GNSS solutions are more costly and mostly used for high-value
crop cultivation (e.g. potatoes and vegetables) or precision operations (sowing and
transplanting). In organic agriculture, herbicides can be substituted by mechanical
treatment.
More advanced positioning technologies, such as local and regional Real Time
Kinematics (RTK) systems or commercial satellite based augmentation services
(e.g. Omnistar, StarFire) are used. The levels of accuracy achieved are in the range of
2 to 10 cm.
The diff erent levels of accuracy by GNSS technology
Installed base of GNSS equipped tractors in 2009 in the EU (100% = 149,000)
2-1
0 c
m
< 1
m
5m
High A
ccuracyRTK/D
GPS
Med A
ccuracySBA
S (e.g. EGN
OS)
Low A
ccuracyStandalone G
NSS (e.g. G
PS)
5%
50%
45%
RTK
DGPS
EGNOS
EGNOS leads the market
in the EU with 50% share
in installed base of GNSS
equipped tractors.
27AGRICULTURE CURRENT MARKET GNSS MARKET
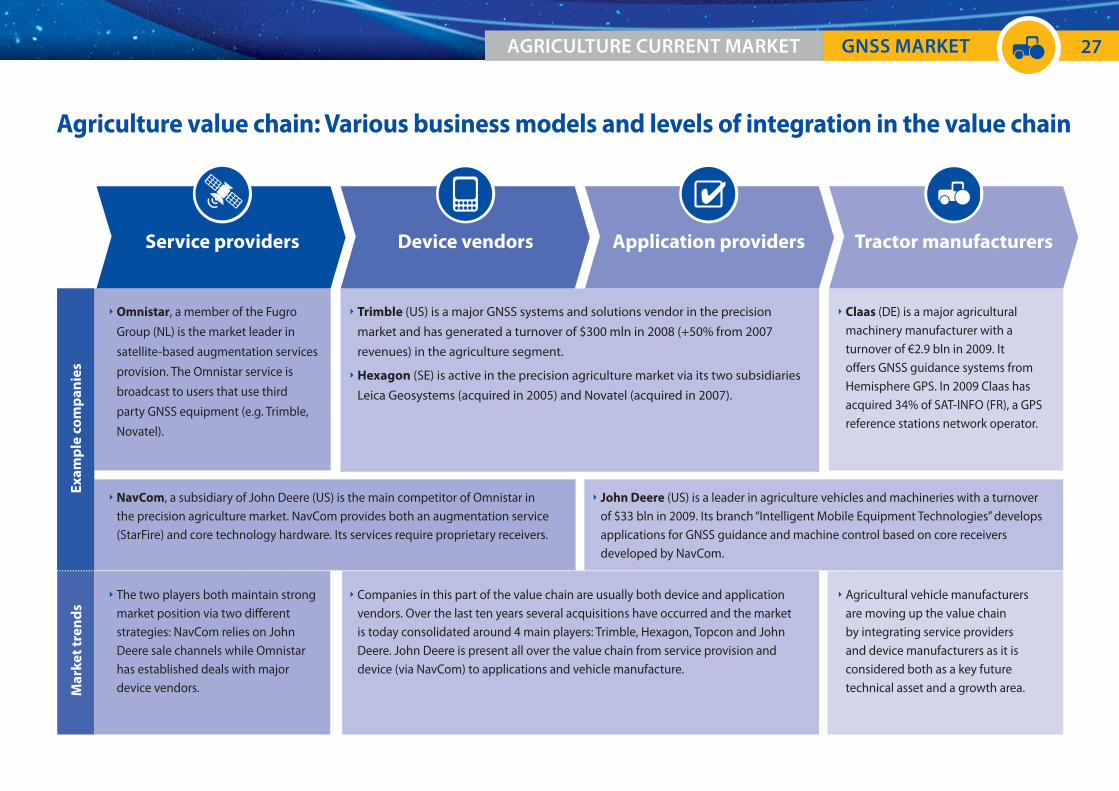
Agriculture value chain: Various business models and levels of integration in the value chain
Service providers
Omnistar, a member of the Fugro
Group (NL) is the market leader in
satellite-based augmentation services
provision. The Omnistar service is
broadcast to users that use third
party GNSS equipment (e.g. Trimble,
Novatel).
Trimble (US) is a major GNSS systems and solutions vendor in the precision
market and has generated a turnover of $300 mln in 2008 (+50% from 2007
revenues) in the agriculture segment.
Hexagon (SE) is active in the precision agriculture market via its two subsidiaries
Leica Geosystems (acquired in 2005) and Novatel (acquired in 2007).
Claas (DE) is a major agricultural machinery manufacturer with a turnover of €2.9 bln in 2009. It off ers GNSS guidance systems from Hemisphere GPS. In 2009 Claas has acquired 34% of SAT-INFO (FR), a GPS reference stations network operator.
NavCom, a subsidiary of John Deere (US) is the main competitor of Omnistar in the precision agriculture market. NavCom provides both an augmentation service (StarFire) and core technology hardware. Its services require proprietary receivers.
John Deere (US) is a leader in agriculture vehicles and machineries with a turnover of $33 bln in 2009. Its branch “Intelligent Mobile Equipment Technologies” develops applications for GNSS guidance and machine control based on core receivers developed by NavCom.
The two players both maintain strong market position via two diff erent strategies: NavCom relies on John Deere sale channels while Omnistar has established deals with major device vendors.
Companies in this part of the value chain are usually both device and application vendors. Over the last ten years several acquisitions have occurred and the market is today consolidated around 4 main players: Trimble, Hexagon, Topcon and John Deere. John Deere is present all over the value chain from service provision and device (via NavCom) to applications and vehicle manufacture.
Agricultural vehicle manufacturers are moving up the value chain by integrating service providers and device manufacturers as it is considered both as a key future technical asset and a growth area.
Device vendors Application providers Tractor manufacturers
Ex
am
ple
co
mp
an
ies
Ma
rke
t tr
en
ds

28 GNSS MARKET AGRICULTURE CURRENT MARKET
Shipments have more than doubled in the EU over the last 5 years
Shipments of GNSS devices in agriculture sector (‘000 units) Average price per device (€)
* The penetration represents the percentage of tractors in use which have a GNSS device.
EU Rest of the World
GNSS penetration in tractors installed base (EU only)*
20092008200720062005
6%5%4%3%3%
%
105
93
75
59
42
+26% p.a.
0
3,000
6,000
9,000
12,000
15,000
20092008200720062005
High technology device priceLow technology device price
Analysis of the market evolution
Within the last 5 years the GNSS market for agriculture has grown signifi cantly, from 42,000 to 105,000 annual shipments (26% CAGR).
In parallel prices of equipment have gone down slightly, notwithstanding increasing functionality such as the availability of EGNOS, increasing the accuracy of systems at a very
low cost. The price of high technology devices has declined from €13,000 to €12,000 while the price of low technology devices declined from €1,900 to €1,800.
Awareness of the benefi ts of precision agriculture in the farming community has increased.

29AGRICULTURE FORECAST & TRENDS GNSS MARKET
Increasing penetration of GNSS in tractors
Shipments (000’ units) and penetration (%) of installed base of GNSS devices worldwide in agriculture sector
Driver Assumptions
Addressable market High power tractors
Farms larger than 50 ha
GNSS penetration in new tractors
EU: 8% in 2009
US: 12% in 2009
Retrofi tting 4% of all tractors in 2009CAGR 12%
Pe
ne
tratio
n (%
)
Sh
ipm
en
ts (
00
0’ u
nit
s)
202020182016201420122010
High tech GNSS penetration in tractors (EU only)Low tech
0
100
200
300
400
500
600
5%
10%
15%
20%
25%
30%
35%
GNSS penetration in tractors will reach 33% in EU in 2020.
Between 2010 and 2020, GNSS device sales are expected to grow at an average rate of 16%. Annual shipments of GNSS devices for the agriculture sector are estimated to some
530,000 units in 2020.
Low technology devices (using e.g. EGNOS or WAAS) will dominate the market accounting for 93% of total sales.

30
GNSS revenues* in agriculture expected to reach almost €500 mln in 2020
Global GNSS market size (€ mln) and device prices (€) in agriculture sector
Driver Assumptions
GNSS penetration in tractors
18% by 2015
33% by 2020
Share devices (2020) Low technology 94%
High technology 6%
Average device price (2020) Low technology - €1,400
High technology - €9,800
Share of device price attributable to GNSS
Low technology - 80%
High technology - 50%
GNSS MARKET AGRICULTURE FORECAST & TRENDS
* Revenues from sales of devices. Revenues from services are not represented here.
Av
era
ge
price
(€)R
ev
en
ue
s (€
mln
)202020182016201420122010
Revenue from low tech devices
Low tech devices price High tech devices price
0
100
200
300
400
500
0
3,000
6,000
9,000
12,000
15,000
Revenue from high tech devices
Worldwide agriculture revenues will increase over the next decade driven by the increase in device sales from €198 mln in 2010 to €486 mln in 2020 (9% CAGR). 77% of these
revenues derive from low technology devices, a proportion that remains fairly stable over time.
The price of devices is expected to decrease by 2% each year. The price of low technology devices will fall from €1,700 in 2010 to €1,400 in 2020 while prices for high technology
devices will decrease from €12,000 in 2010 to €9,800 in 2020.

31
Agriculture market 2010-2020 by region
AGRICULTURE FORECAST & TRENDS GNSS MARKET
Shipments of GNSS devices in agriculture sector (000’ units)
European Union North America Rest of the World
202020182016201420122010
+16% p
.a.
118
146
239
334
434
537GNSS device shipments in agriculture by region
Annual shipments of GNSS devices in the agriculture sector are expected to grow
in all regions to reach 75,000 units by 2020 in the European Union (CAGR 8%),
110,000 units in North America (CAGR 18%) and 350,000 units in the rest of the world
(CAGR 19%).
Increased sales are mainly driven by the growth of the fl eet and the higher
penetration of GNSS in new tractors. Retrofi tting is not a main driver.
32
API Application Programming Interface
APV Approach with Vertical Guidance
ADAS Advanced Driver Assistance Systems
ARPU Average Revenue Per User (annually)
ASP Average Selling Price
ATM Air Traffi c Management
AWU Annual Work Unit
CA Commercial Aviation
CAGR Compound Annual Growth Rate
CAT Category
CS Commercial Service (of Galileo)
DDC Delays, Diversions and Cancellations
DGPS Diff erential GPS
EC European Commission
EGNOS European Geostationary Navigation Overlay Service
ESA European Space Agency
EU European Union
GA General Aviation
GNSS Global Navigation Satellite System
GSA European GNSS Agency
GPS Global Positioning System
IFR Instrument Flight Rules
IOC Initial Operational Capacity (of Galileo)
LBS Location Based Services
p.a. Per Annum (per year)
PDA Personal Digital Assistant
PND Personal Navigation Device
POI Point Of Interest
ROW Rest of the World
RTK Real Time Kinematic
RUC Road User Charging
SBAS Satellite Based Augmentation System
SDK Software Development Kit
SESAR Single European Sky ATM Research
TTFF Time To First Fix
VAT Value Added Tax
VFR Visual Flight Rules
WAAS Wide Area Augmentation System
Wi-Fi Wireless Fidelity (a common wireless networking technology)
ANNEXES LIST OF ACRONYMS

33
The Galileo and EGNOS programmes
Galileo
Galileo will be Europe’s own Global Navigation Satellite System (GNSS),
providing highly accurate, guaranteed global positioning services under
civilian control. It will be interoperable with the US GPS and the Russian
Glonass, two other global satellite navigation systems in operation.
Galileo will open up new and exciting prospects for economic growth. It will benefi t
citizens, businesses and governments throughout the EU and beyond.
The European Commission
The European Commission, mainly through its Directorate General for
Enterprise and Industry, is the programme manager of Galileo.
The Full Operational Capability phase of the Galileo programme is
managed by the European Commission and is fully funded by the European Union. The
Commission and the European Space Agency (ESA) have signed a delegation agreement
under which ESA acts as design and procurement agent on behalf of the Commission.
The European Commission is also promoting the use of EGNOS and Galileo by end-users
and decision makers alike in order to foster the development of cutting-edge GNSS
applications and user services and devices.
EGNOS
EGNOS is Europe’s fi rst venture into satellite navigation.
It increases the accuracy of the GPS position and provides
information on its reliability, making it suitable for safety-critical applications.
Consisting of three geostationary satellites and a network of ground stations, EGNOS
achieves its aim by transmitting a signal containing information on the reliability and
accuracy of the positioning signals sent out by GPS. It allows users in Europe and beyond
to determine their position to within about 1 metre.
The European GNSS Agency (GSA)
The European GNSS Agency (GSA) is the authority formed by the
European Union to accomplish specifi c tasks related to the European
GNSS programmes. Its current mission is to:
ensure the security accreditation of the systems and the operation of the Galileo
security centre;
contribute to the preparation of the commercialisation of the systems, laying the
foundations for the economic sustainability and maximising the economic, social and
public benefi ts;
accomplish other tasks entrusted to it by the Commission, such as the promotion of
applications and services and managing the R&D programmes on satellite navigation.
ABOUT THE EUROPEAN GNSS PROGRAMMES ANNEXES

www.gsa.europa.eu
www.egnos-portal.eu
© 2010 European GNSS Agency
Copyright note: This information can be republished without charge provided the European GNSS Agency (GSA) is acknowledged. If you do republish, we would be grateful if you link back to the GSA website (www.gsa.europa.eu).
Related Documents