1 Framingham State College Framingham, Ma Computers in Education: Is there a relationship between achievements in computer-related subjects and classic subjects? Giovanni Nanni Research and Evaluation (ED 14.999 – Sec. 1) Instructor: William McMullen Fall - 2001

GN Computers in education dissert
Aug 17, 2015
Welcome message from author
This document is posted to help you gain knowledge. Please leave a comment to let me know what you think about it! Share it to your friends and learn new things together.
Transcript
1
Framingham State College
Framingham, Ma
Computers in Education:
Is there a relationship between achievements in computer-related subjects
and classic subjects?
Giovanni Nanni
Research and Evaluation (ED 14.999 – Sec. 1)
Instructor: William McMullen
Fall - 2001
2
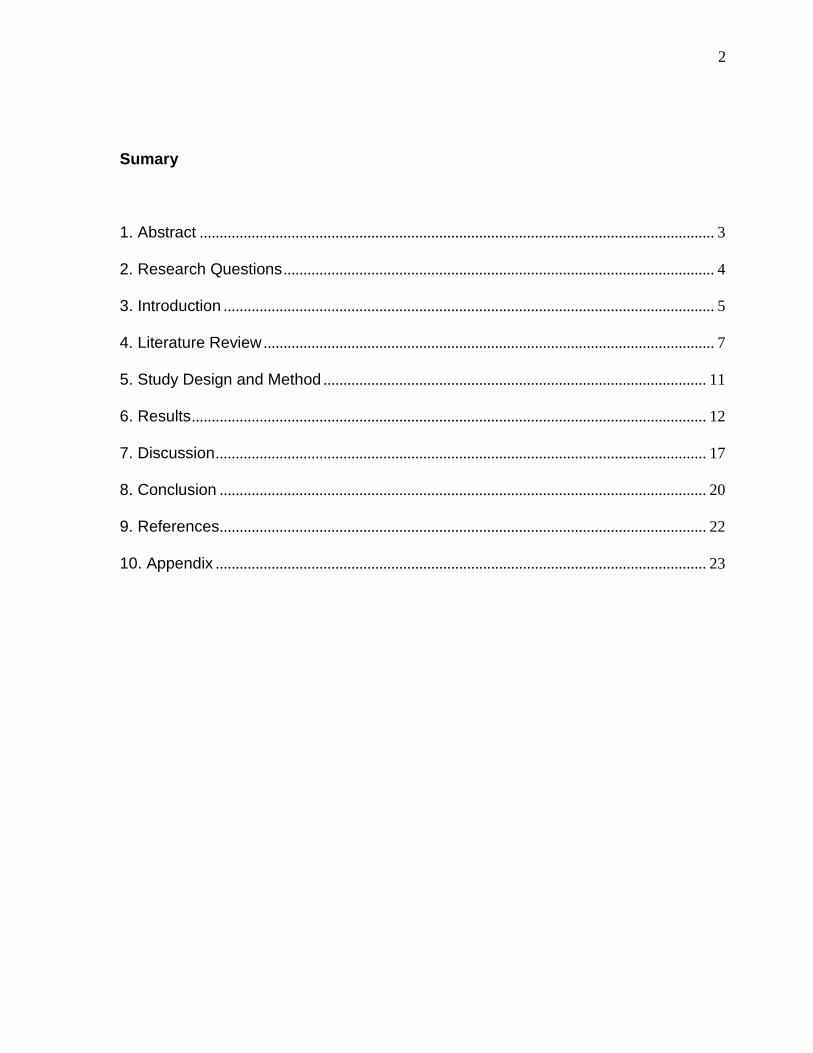
Sumary
1. Abstract ................................................................................................................................. 3
2. Research Questions ............................................................................................................ 4
3. Introduction ........................................................................................................................... 5
4. Literature Review ................................................................................................................. 7
5. Study Design and Method ................................................................................................ 11
6. Results ................................................................................................................................. 12
7. Discussion ........................................................................................................................... 17
8. Conclusion .......................................................................................................................... 20
9. References .......................................................................................................................... 22
10. Appendix ........................................................................................................................... 23
3
1. Abstract
Computer Education is observed in order to determine whether it has an implication
or not in the performance of the average grades of students in classic subjects such
as: Language, History, Algebra, and Science. This study examines the impact that the
Computer subject has over the classic subjects. The data was collected focusing the
observation of the connection between the subjects in question. The data was drawn
from the teacher’s grade book and consists in the average grades of the students
registered as freshman (High school) in the year 2000. The data was manipulated in
order to provide a view of the relationship between the subjects and the impact of the
computer education upon them. The findings are discussed according to the
observations of the grade performance and its relationship between subjects,
involving or not the improvement or decrease in the average level.
Resumo: A Educação através de Computadores é observada no sentido de determinar se
existe implicação ou não no desempenho das médias estudantis em disciplinas clássicas tais
como: Linguagem, História, Álgebra e Ciências. Este estudo examina o impacto que a
disciplina de Informática tem sobre estas disciplinas clássicas. Os dados foram coletados
focando a observação da conexão entre os assuntos em questão. Os dados foram retirados
dos livros diários dos professores e consistem na média das notas dos estudantes
matriculados no primeiro ano do ensino médio no ano de 2000. Os dados foram manipulados
de maneira que providencie uma visão da relação entre as disciplinas e o impacto que a
educação através de computadores tem em relação aos mesmos. As conclusões são discutidas
de acordo com a observação do desempenho das notas e sua relação entre as disciplinas,
envolvendo ou não a melhoria ou decréscimo do nível das médias.
4
2. Research Questions
The purpose of this study is to investigate the relationship between student’s
achievement in classic subjects and computer-related subjects. It will be examined
subjects that involve language skills (Language Arts and Social Studies), logical
thinking skills (Math and Science), and the their relationship with the subjects that
involve computers and electronics devices use. This study will be discussing the work
of Armstrong & Casement (2000) and their findings about the relationship of the
computer education in schools and how it benefits the students. It will be used the
student’s grades as a means to compare their achievement in the core subjects and
subjects related to computer education.
From those discussions and points of views about computer education and the
possibilities that this kind of instruction supposedly open for the students, which are
the reasons for the question that this study is considering.
The primary question that guides this study is:
Does computer education improve achievement in classic subjects such as
Language, Math, History, and Science?
5
3. Introduction
Nowadays, computing and technology applied to education is a concern of
many educators and their counterparts. The value of teaching about technology and
information in a global economy. The integration of information technology and
classic education. The role that computers have in the education of our students. The
many discussions about the real meaning of the use of computers and its applications
in education. The results that this equipment gives our pupils in their path to
education acquisition and knowledge retention. The proper use of the tools that are
available in order to improve the educational condition of our schools. With those
thoughts in mind, some questions may surface and make us wonder about the
answers: Will the teaching and use of these machines lead to a better future where
the students can become good citizens, and productive workers no matter what they
choose to work with? Is the impact in our children positive? Are the results showing if
the methods are right or not? Are the frameworks well addressed and
comprehensive? Does the curriculum reach and fulfill the requirements of our pupils?
Those worries lead us to think about the use and utility of these apparatus and their
role in education. There is a pressure coming from the so called “information era”, the
burden to cope with new technologies and software, and their use and application. All
this giving our students an extra load to carry, and not knowing if the measures that
we are taking now, as educators, will bring good results or not.
With those same concerns and questions in mind, this study will investigate the
relationship between student’s achievement in classic subjects and computer-related

6
subjects. In this study, I examine the benefits that the computer education might
have, in promoting or not promoting, the higher achievement in the classic subjects.
7
4. Literature Review
We live in a society where the share of information is increasing and the
necessity to master the skills to dominate the technologies that transmit this
information is escalating. Some authors have been proclaiming that in the future our
boundaries, the limitations of socialization, and the conventional neighborhoods will
be transported to the digital space, where the space and time will be looked at from a
different point of view (Negroponte, 1996).
This era is invading our schools as well. We see people talking about how to
introduce the digital world in our schools. We see more teachers looking for new
advances and techniques to introduce the subject for our youngsters in order to
prepare them for the future. As we assess, the technology has definitely entered our
schools, but technology education has not yet (Postman, 1995).
Are we working towards a goal that will bring anything but loss of knowledge?
Are we investing in technologies that will end the education that we have
known for so long?
Does classroom technology really prepare our children for the future?
Do computers really help our children learn to read, write, or think?
According to some authors, the defenders of the computer education, these
machines are improving the level of education in our schools. Meanwhile, the critics
of the education through a computer are attesting that the benefits from the
computers are not so astonishing.
8
Frederick Bennett (1999), one of the defenders, made it clear that using
technology to educate can overcome an immense gap in our education system. The
benefit from using the machines to improve the education for those that suffer from
deprivation in our present system is incredible. According to him, the use of
computers can help to teach kids how to read or improve their reading skills, which
will bring a gigantic transformation in the American education.
In the other hand, Armstrong & Casement (2000) discuss the validity in the
education based on the computer and its applications. They maintain that the
students cannot understand themselves and their world. The students do not have
time to reflect upon their own feelings, which leads to alienation from themselves.
The effects of misuse of computers to educate can be devastating according to
Schwartz (1989). The power that a computer has is much greater than the power that
a book has, and its damaging effects will be much greater than a book as well (Idem).
In Bennett’s (1999) point of view, computers can break the impasse between
students that need access to education at their own pace and the necessities from
the students that are successful in the format that is in place. He maintains that
computers can break any lesson or unit in sizes that will fit the needs of each student,
giving them the feeling of achievement, fueling the sense of continuity in the
education process.
I must agree with the capacity of the computer and its applications to
accommodate needs, pacing lessons, breaking in smaller pieces the subject to study,
and helping kids to work accordingly to their own capabilities.
9
However, I must consider also what Armstrong & Casement (2000) says about
the effect of the “techno-tunnel vision” that undermine the ability of our children to
make sound judgments related to how and when to use the computer in its most
effective way.
There is a point to the idea of computers being used as a tool for research of
new methods of teaching the children and targeting their needs, fulfilling them and
supplying the students with extra support (Bennett, 1999). However, it is imperative
that we use the tools wisely, not taking away the opportunities of our children to
experience the world as it is (Armstrong & Casement 2000).
Making sure that the statement of David Skirbna, a parent of two young
children in Detroit, Michigan, as cited in Armstrong & Casement (2000) does not
became a reality for our children in general,
“Computers mediate and control their experiences, and provide a very limited
view on things. I am concerned that they may come to see this limited
perspective as normal, or even desirable…. I do not want them to think that
their success in any way depends on having access to the appropriate
machine.”
Due to the profound impact that the electronic media has in our perceptions,
and because it makes us not so sure about our place in the world, it is imperative that
we really have a sound and comprehensive knowledge of the use of technology in
means to educate our children. They do not just need the better machine or the better
10
connection. They need the best education. They need the type of education that will
prepare them to face all sorts of barriers and overcome them. An education that will
develop thinking, reasoning, judging and, assessing skills in order to provide better
options for themselves and the others around them.
Technology in education has its place. We just need to find where it is and
figure out how to use it properly. Improving the skills that need to be improved,
enhancing the perceptions of the world around and, deepening the knowledge, this is
the only wealth that time and circumstances cannot take away from no one.
11
5. Study Design and Method
The data used in this study, will be collected from the database of a school
system in Massachusetts (not allowed to disclose). The data are the grades that the
students achieved during the school year of 2000-2001, and were recorded in the
teacher’s grade book. The study will focus on students that were registered in the
freshman year (9th grade).
The gathering of the data will include all the students that were registered in
the freshman year (9th grade) within the school system, in the school year of 2000-
2001, and attended the subjects in study (population). The age ranges between 14
and 15 years old.
Data is based on the grades of five (5) academic subjects: Language (English),
Math, Science, History, and Computer Education (sometimes named with others
titles, but taught in the computer labs).
The sample will be drawn from the population using random selection, where
the names will be placed in a list in numerical order (based on the school ID number)
and I will pick every other name in the list regardless of gender or age.
I intend to assess the relationships between the subjects that involve language
skills (Language (English) and History) relating to the achievement in the subject that
involve computer education and. I also will relate the subjects that involve logical
thinking skills (Math and Science) with the computer subject in order to establish a
relationship between the achievement in the classic subjects and computer related
subjects.
12
6. Results
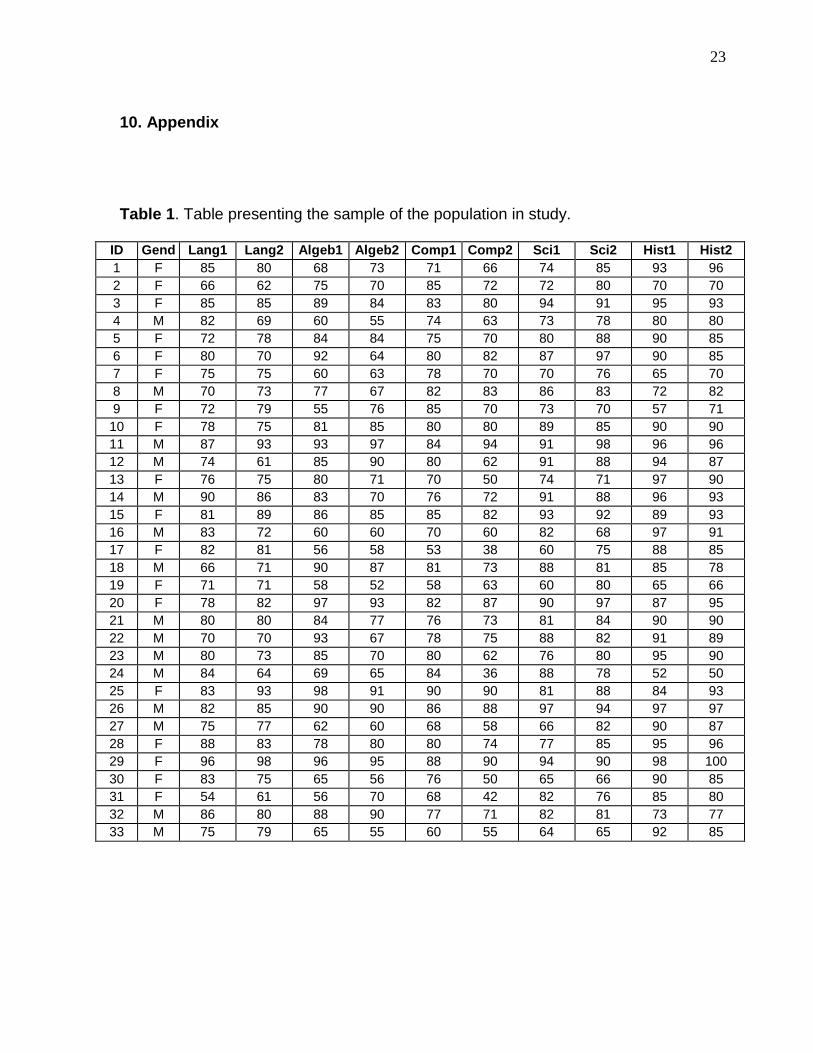
Table 1 presents the individual data for the sample used in study.
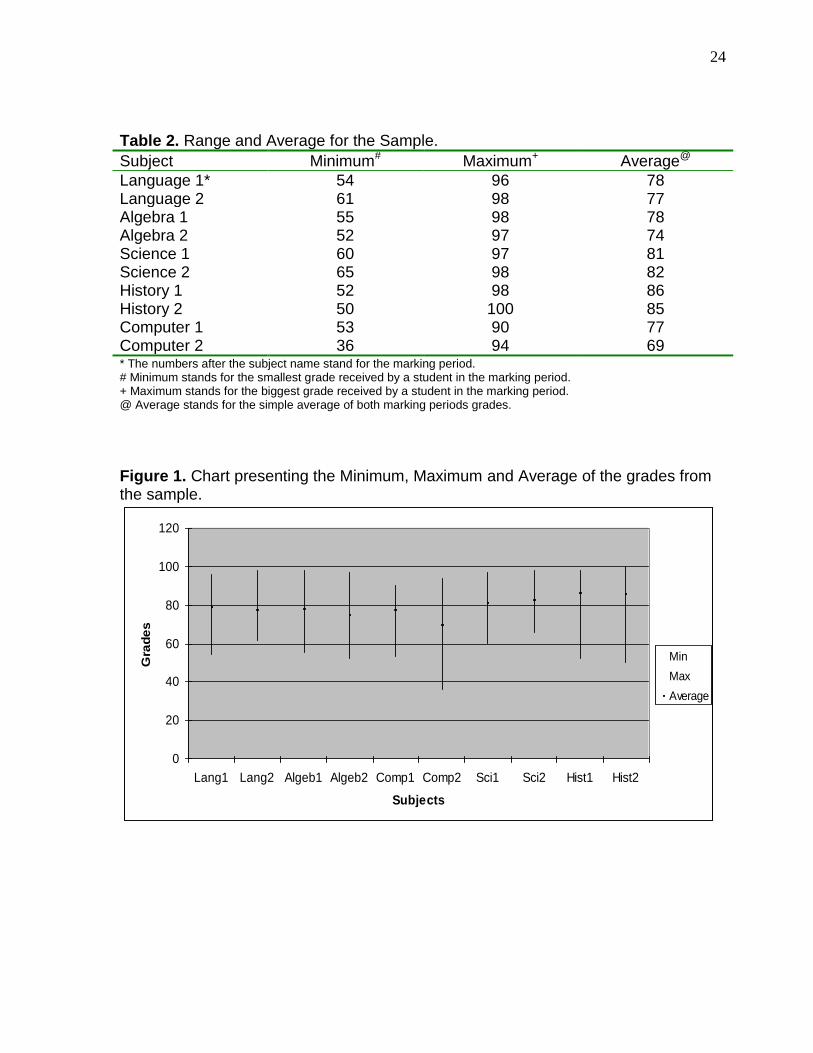
Figure 1 presents the Averages of grades for each subject in study. In this
chart, it is possible to see that the limits of dispersion, in most subjects, respects the
boundaries established by the school as a passing grade.
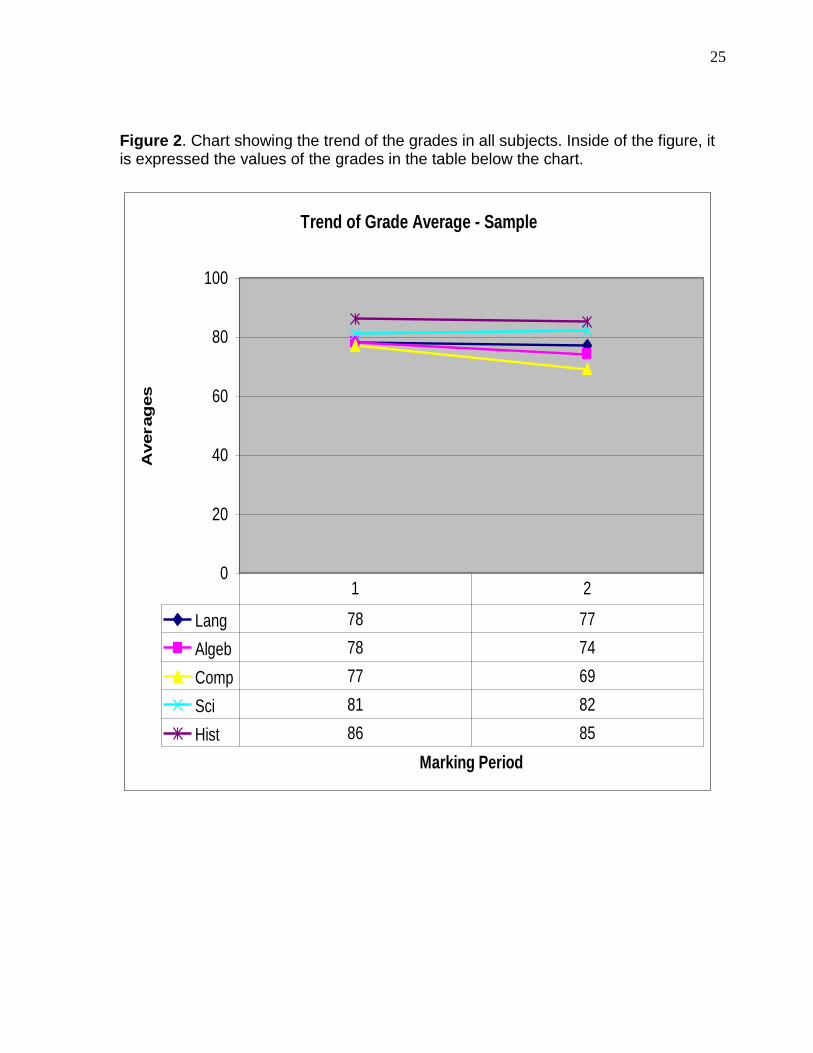
Figure 2 shows the trend of the grade averages for all the subjects. Due to the
number of subjects and marking periods that were taken in consideration, I have
arranged the figures in the following way:
Figures 4 to Figures 6 show the trajectories of individual growth of the
grades for students that had a pattern of raising, maintaining or dropping
the averages for the Computer subject between marking periods showing
the trend of their grades.
An examination of Figure 2 reveals that there is a pattern in the grades of the
subjects. The lines of the chart show that the students were averaging a grade of 80
(the general average for the sample is 79). The distribution of the grades according to
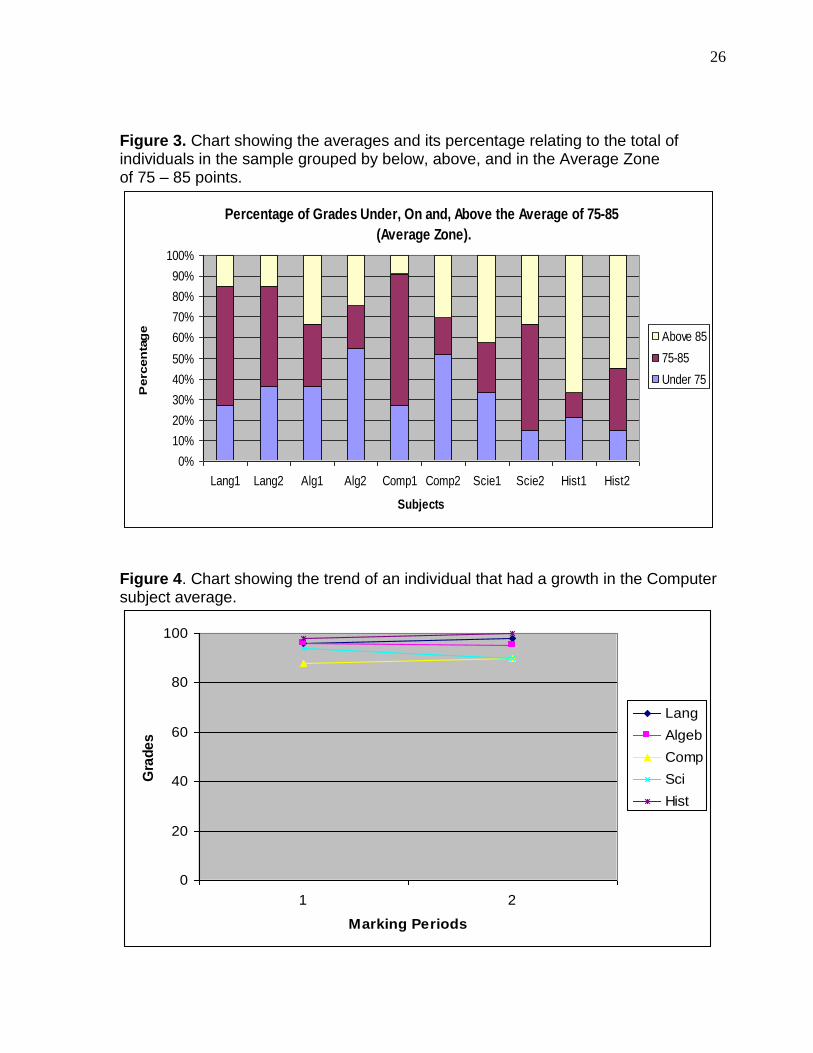
the average is shown in the Figure 3.
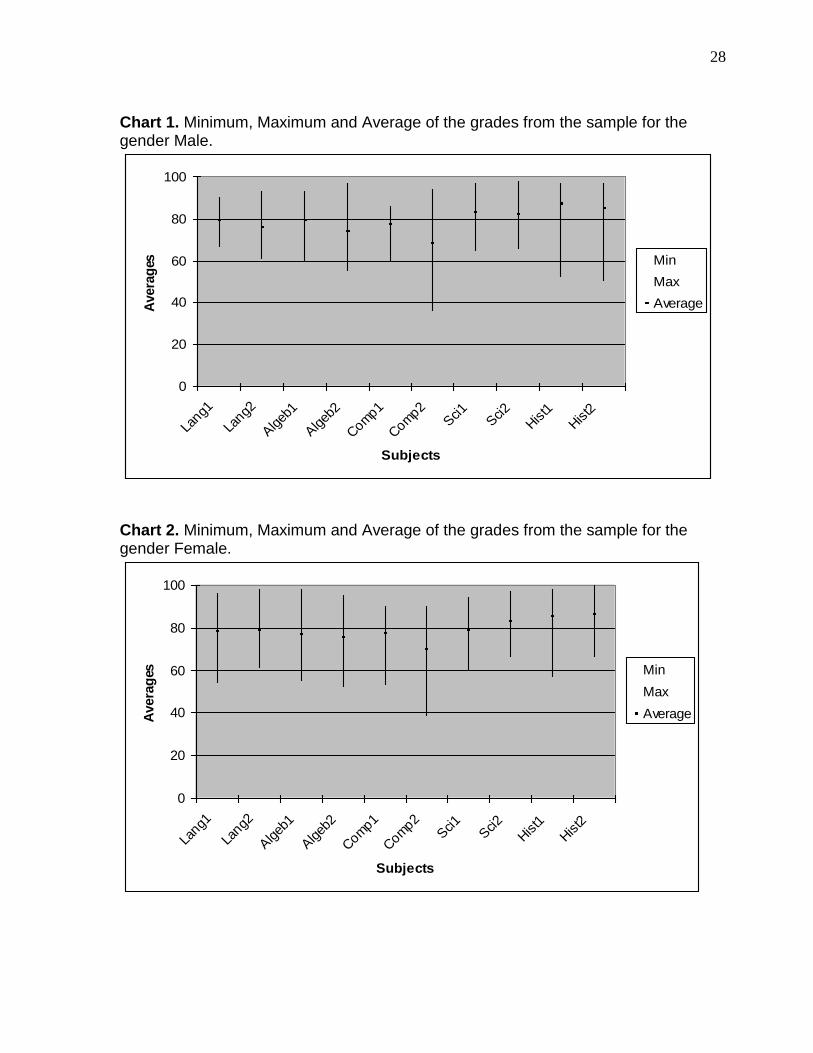
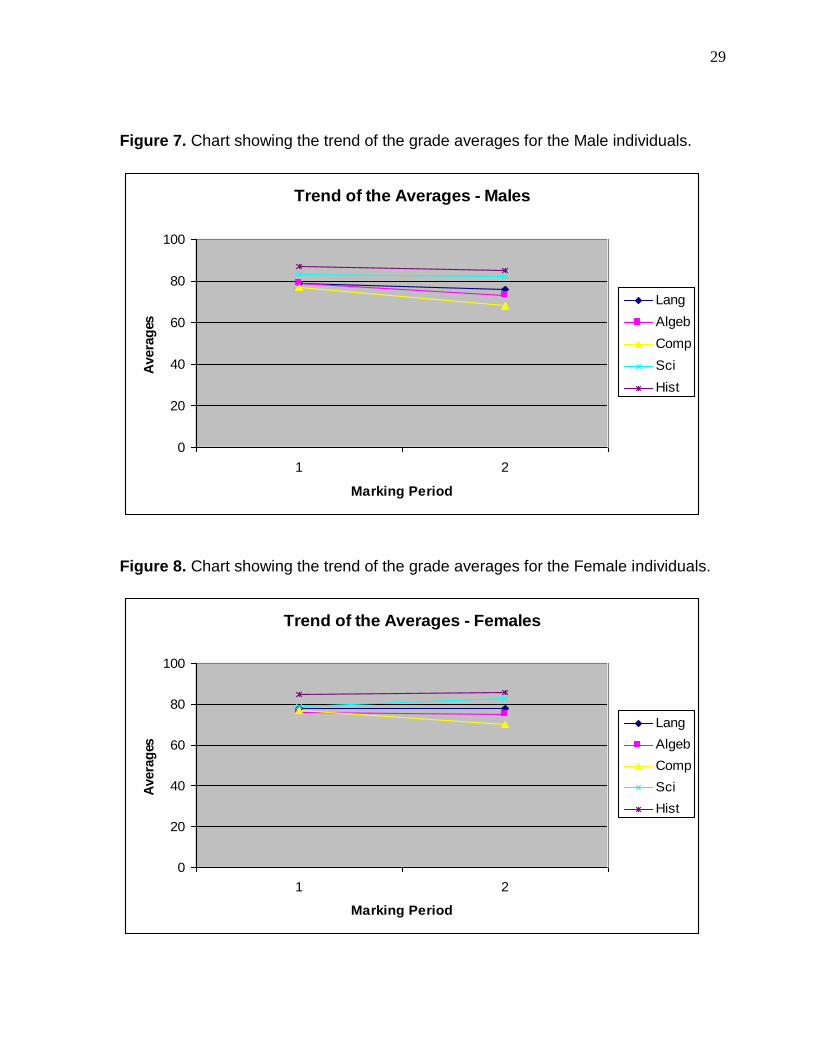
Charts 1 and 2 show the trend of the averages by gender. The general
average for the male and female sample is the same, average 79. This average
agrees with the results obtained for the sample, which is the same.
It was observed that the females tend to maintain the average level for the
subjects when not increasing them (See Figure 8). Even though a pronounced
decrease in the average of the Computer subject was detected (a total of 7 points of
decrease), the trend is to keep or increase the averages.
13
For the males, in the other hand, the pattern was a tendency to decrease of
the grade average in all the subjects (the biggest decreases were in Computer and
Algebra, with a loss of 9 and 6 points in the average respectively) (See Figure 7). The
tendency to decrease the grade average for the male individuals is not compatible
with the tendency observed in the female individuals.
It is fair to say that the female individuals, in this study, were somewhat more
dedicated to keep or increase their grades as opposite to the males. It is also fair to
say that dispersion of grade averages of the females is bigger than the same one of
the male individuals.
The grade results of the Computer subject regarding the students whom
averaged 75 to 85 (average zone), as result of the end of the marking period,
represents 64% of the grades in the first marking period (27% below average zone
and 9% above it) and, 18% in the second marking period.
It was noted that the second marking period was completely abnormal taking
as a base average of 69 and the range of the grades (min 36, max 94). There was an
increase in the grades below the average zone, representing 52% of the grades.
However, an increase in the grades above the average zone was detected,
representing 30% of the grades.
An examination of Figure 3, reveals that, the first marking period of Computer
subject and both marking periods of Language, the students that were in the average
zone represent 58% of the sample and, in the second marking period, the grades of
these same students were 48% of the sample.
14
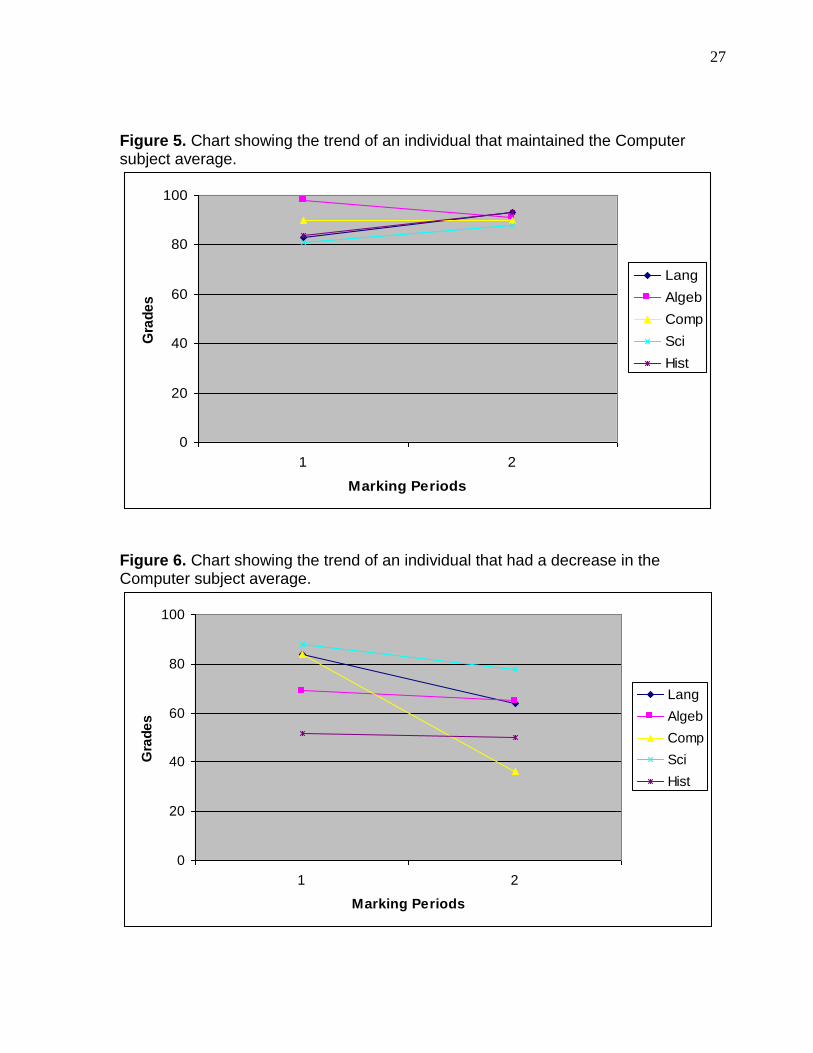
In Figures 4, 5 and 6, it is shown the examples of individuals, randomly
selected from the population using as criteria the individuals that had an increase
(Figure 4), maintained (Figure 5), and had a decrease (Figure 6) in the grade
averages for the Computer subject.
In those figures, one can observe the pattern among the subjects. The
Computer subject trend is the reflection of the trend presented in the classic subjects.
In Figure 4, it is possible to observe that all subjects, but Science, had an
increase in the averages from the first marking period to the second. It was observed
that the general tendency for the classic subjects is well represented, in this case, by
the Computer subject. The classic subjects had an increase of 2 points in average,
which is clearly represented by the growth in the computer subject.
For the student represented by Figure 5, the range of the grades in the first
marking period was 17 points (minimum of 81, maximum of 98) and the Computer
subject was in the center of the range. For the second marking period, the range
decreased to 5 points (88 min., 93 max.) and the grade average for the Computer
subject was also in the center of the dispersion. For this individual, the Computer
subject (regardless the constancy of the grade average being 90 points in both
marking periods) was the most accurate subject to show the trend of the grade
averages for this student.
Observing Figure 6 is possible to see the most accentuated single case from
this sample. The student had a decrease in all the subjects (a decrease ranging from
20 points for Language Arts and 2 points for History), however the Computer subject
was the one that suffered the worst lost in average grade points (48 points lost
15
between marking periods). For this example, the trend is clearly determined using the
Computer subject as tendency line. It was asked to the Computer teacher if a reason
for the steep drop could be established and the answer was that the student in
question just lost interest in the academics.
The observation of these charts suggests that the Computer subject, in
general, could be used as the line to show the trends of the average grades of the
students.
In the three single cases observed, the trend shown by the Computer subject
is the most accentuated (for the student that dropped the averages); the most stable
among the subjects (for the student that maintained the same average for the
Computer subject); and, the most representative in the case of the student that
increased the grades, because it reflected the general pattern of the change for the
grade averages between marking periods.
In this study, it was observed a pattern in the grades disregarding the subject.
As seen in Figure 2, a strong drop in the grades for the Computer subject (comparing
to the other subjects) in the second marking period was detected, making this period
the one with the biggest range (from 36 to 94) as well as the lowest marking period
average (69 points). This event shows the trend for all the subjects. All, but Science
that had a raise of a single point between marking periods, the other subjects had a
decrease in the performance of the averages and the strongest drop as said before
accounts for the Computer subject.
While gathering the data, I could not find a plausible explanation for this event
making it more difficult to define a pattern of the influence of the Computer subject
16
over the other four subjects in study. However, it is clear in the study that the
Computer subject is the one that, generally, can help the observer to determine the
trend for the grades of an individual, for the Computer subject represents well the
tendency of the changes in the other subjects.
17
7. Discussion
The population in study includes: 99 students registered in the school year of
2000-2001 as freshman in high school. In order to be considered part of the
population of the study, the students must have taken all the academic subjects in
consideration. From this population, a sample of 33 students was collected using
random selection, one of every three students (sample size of 30% of population).
The data gathered incorporated two separate marking periods that are
determined as one (1) and two (2). This is so, due to the computer subject being
taught in half-year courses.
The findings indicate that the Computer subject did not have a relevant effect
upon student performance in order to improve or not the grades of the others subjects
in study, even though this subject represent well the changes and the tendencies. In
fact, I observed that all subjects had a small drop in the averages from the first
marking period to the second one, as well as the Computer subject. There was one
exception, Science, which raised a single point to the average between marking
periods (See Table 2 and Figures 2 and 3 for better visualization of the event).
The most impressive finding was the possibility to use the Computer subject
trend line to draw a conclusion about the results of the other subjects, for this subject
was a very good reflection and reference for the tendencies of the averages in the
other subjects (See Figure 2).
It was not possible to determine whether the Computer subject taught in this
school had an impact on the grades of other subjects. However, it was clear that the
18
trend of this subject was a stronger reflection of the general tendency of all subjects
within this study. While the majority of the subjects dropped their average, the fall of
the averages in the Computer subject was stronger and more visible.
Another fact observed, was the strong increase of the grades above the
Average Zone for the Computer subject differing of the pattern that the other subjects
have in dropping or remaining the same level of grades when comparing the marking
periods (See Figure 3).
Armstrong & Casement (2000) attest that the computer education when not
properly applied tends to interfere in the progress of the students, limiting their
perspective of the real world. It was not possible to link the increase in the grades
above the Average Zone, in the Computer subject from the first to the second
marking period, to the decrease or maintaining of the grades between marking
periods, in the others subjects in this study.
This event comes linked to a strong increase in the grades below Average
Zone for the Computer subject in the same period, which was a tendency for the
Language and Algebra subjects, which were opposite to the decrease for Sciences
and History in the grades below Average Zone.
In the other hand, Bennett (1999) says that computer can build a bridge
between the gaps that exists in the education connecting the two extremities of the
system, opening the opportunities for those that cannot reach the end without the
necessary support and help.

19
The tendencies observed in this study cannot support Bennett’s (1999)
statement. There is no proof of increase in the grades regarding the Computer
subject, as mentioned before.
20
8. Conclusion
Since this is a recent topic for research and discussion, the studies that were
concluded show many different results for the same content. The two that I have
based my study upon are opposite in findings and conclusions. Due to this, it is
difficult to correlate the observations to any of them. There are aspects that can be
connected to this study from both of the studies analyzed.
The findings of this study do not show any link between the increase and
decrease of the grades of students. Neither finding can support both of the studies
used as base for this research. However, as said before, it was concluded through
this study the possibility to use the event line for the Computer subject as a trend
indicator, leaving to the observer a very good basis to infer about the general
tendency of the population regarding their average grades results and performances.
Bennett (1999) defends the use of a computer as a promoter of the education
and opportunity of those that cannot be serviced by the system that is in place. With
the computer as a tool, the improvement of the student performance will be
considerable and worthy. While improving and enhancing the schooling experience
for those nor so fortunate to have the tools to work with, the use of computers leave
the educator’s mind free to focus in the students’ real necessities.
Armstrong & Casement (2000) discuss the impact of education through
computers, using them in order to provide “digital experiences” instead of allowing
students to have a “real experience” without having a computer as medium between
the real world and the student. Taking away from the children the opportunity to enjoy
21
e experiment life by their own. Forbidding the children the experience to learn by
touch, smell, taste and hear.
I agree in part with both of the theories as well as disagree with part of each
theory; both have their strengths and weaknesses.
I do believe that nothing can substitute the real life experience and the world is
much more than a square screen that a person supposedly interacts with others.
More over, I believe that computers can and are filling in the mechanical gaps
human beings are not filling. Computers can and are promoting better opportunities
for those who cannot find space within the system already in place.
I do not agree, however, that the end of the educational system or the
salvation of education is dependent on a brainless machine. Computers, as all other
tools that education might deploy in order to educate, have its place and its use.
Overestimation and underestimation are extremes of a scale that needs to find
its equilibrium.
Under using what is at our hand in order to help the needy, or over using in a
way that may harm those exposed to it have their consequences.
In my view, putting the proper value in a tool that can either help or damage,
using technology with wisdom and caution, can be useful and the results that it may
provide will be beneficial to all.
Concluding, there is no losing side in the battle for the improvement and
enhancement of education, and the growth of our society as a whole.
22
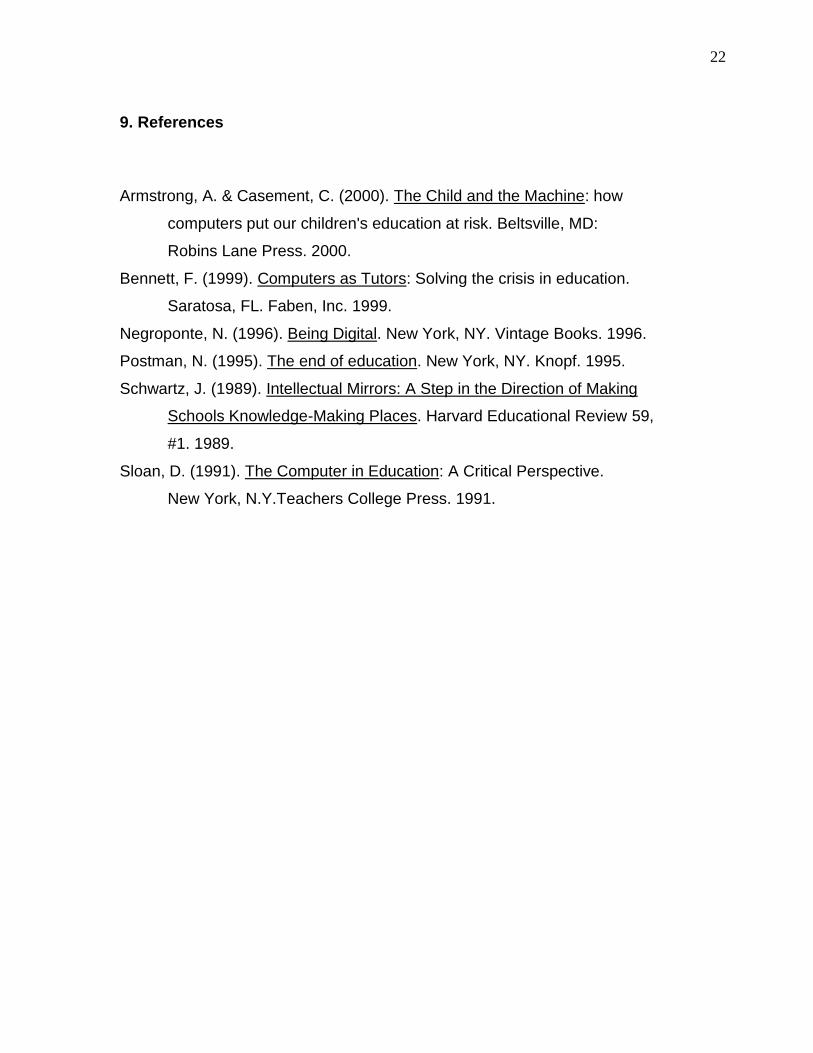
9. References
Armstrong, A. & Casement, C. (2000). The Child and the Machine: how
computers put our children's education at risk. Beltsville, MD:
Robins Lane Press. 2000.
Bennett, F. (1999). Computers as Tutors: Solving the crisis in education.
Saratosa, FL. Faben, Inc. 1999.
Negroponte, N. (1996). Being Digital. New York, NY. Vintage Books. 1996.
Postman, N. (1995). The end of education. New York, NY. Knopf. 1995.
Schwartz, J. (1989). Intellectual Mirrors: A Step in the Direction of Making
Schools Knowledge-Making Places. Harvard Educational Review 59,
#1. 1989.
Sloan, D. (1991). The Computer in Education: A Critical Perspective.
New York, N.Y.Teachers College Press. 1991.
23
10. Appendix
Table 1. Table presenting the sample of the population in study.
ID Gend Lang1 Lang2 Algeb1 Algeb2 Comp1 Comp2 Sci1 Sci2 Hist1 Hist2 1 F 85 80 68 73 71 66 74 85 93 96 2 F 66 62 75 70 85 72 72 80 70 70 3 F 85 85 89 84 83 80 94 91 95 93 4 M 82 69 60 55 74 63 73 78 80 80 5 F 72 78 84 84 75 70 80 88 90 85 6 F 80 70 92 64 80 82 87 97 90 85 7 F 75 75 60 63 78 70 70 76 65 70 8 M 70 73 77 67 82 83 86 83 72 82 9 F 72 79 55 76 85 70 73 70 57 71 10 F 78 75 81 85 80 80 89 85 90 90 11 M 87 93 93 97 84 94 91 98 96 96 12 M 74 61 85 90 80 62 91 88 94 87 13 F 76 75 80 71 70 50 74 71 97 90 14 M 90 86 83 70 76 72 91 88 96 93 15 F 81 89 86 85 85 82 93 92 89 93 16 M 83 72 60 60 70 60 82 68 97 91 17 F 82 81 56 58 53 38 60 75 88 85 18 M 66 71 90 87 81 73 88 81 85 78 19 F 71 71 58 52 58 63 60 80 65 66 20 F 78 82 97 93 82 87 90 97 87 95 21 M 80 80 84 77 76 73 81 84 90 90 22 M 70 70 93 67 78 75 88 82 91 89 23 M 80 73 85 70 80 62 76 80 95 90 24 M 84 64 69 65 84 36 88 78 52 50 25 F 83 93 98 91 90 90 81 88 84 93 26 M 82 85 90 90 86 88 97 94 97 97 27 M 75 77 62 60 68 58 66 82 90 87 28 F 88 83 78 80 80 74 77 85 95 96 29 F 96 98 96 95 88 90 94 90 98 100 30 F 83 75 65 56 76 50 65 66 90 85 31 F 54 61 56 70 68 42 82 76 85 80 32 M 86 80 88 90 77 71 82 81 73 77 33 M 75 79 65 55 60 55 64 65 92 85
24
Table 2. Range and Average for the Sample. Subject Minimum# Maximum+ Average@ Language 1* 54 96 78 Language 2 61 98 77 Algebra 1 55 98 78 Algebra 2 52 97 74 Science 1 60 97 81 Science 2 65 98 82 History 1 52 98 86 History 2 50 100 85 Computer 1 53 90 77 Computer 2 36 94 69 * The numbers after the subject name stand for the marking period. # Minimum stands for the smallest grade received by a student in the marking period. + Maximum stands for the biggest grade received by a student in the marking period. @ Average stands for the simple average of both marking periods grades.
Figure 1. Chart presenting the Minimum, Maximum and Average of the grades from the sample.
0
20
40
60
80
100
120
Lang1 Lang2 Algeb1 Algeb2 Comp1 Comp2 Sci1 Sci2 Hist1 Hist2
Subjects
Gra
de
s
Min
Max
Average
25
Figure 2. Chart showing the trend of the grades in all subjects. Inside of the figure, it is expressed the values of the grades in the table below the chart.
Trend of Grade Average - Sample
0
20
40
60
80
100
Marking Period
Avera
ges
Lang 78 77
Algeb 78 74
Comp 77 69
Sci 81 82
Hist 86 85
1 2
26
Figure 3. Chart showing the averages and its percentage relating to the total of individuals in the sample grouped by below, above, and in the Average Zone of 75 – 85 points.
Percentage of Grades Under, On and, Above the Average of 75-85 (Average Zone).
0%
10%
20%
30%
40%
50%
60%
70%
80%
90%
100%
Lang1 Lang2 Alg1 Alg2 Comp1 Comp2 Scie1 Scie2 Hist1 Hist2
Subjects
Perc
en
tag
e
Above 85
75-85
Under 75
Figure 4. Chart showing the trend of an individual that had a growth in the Computer subject average.
0
20
40
60
80
100
1 2
Marking Periods
Gra
des
Lang
Algeb
Comp
Sci
Hist
27
Figure 5. Chart showing the trend of an individual that maintained the Computer subject average.
0
20
40
60
80
100
1 2
Marking Periods
Gra
des
Lang
Algeb
Comp
Sci
Hist
Figure 6. Chart showing the trend of an individual that had a decrease in the Computer subject average.
0
20
40
60
80
100
1 2
Marking Periods
Gra
des
Lang
Algeb
Comp
Sci
Hist
28
Chart 1. Minimum, Maximum and Average of the grades from the sample for the gender Male.
0
20
40
60
80
100
Lang1
Lang2
Algeb1
Algeb2
Comp1
Comp2Sci1 Sci2
Hist1
Hist2
Subjects
Ave
rage
s Min
Max
Average
Chart 2. Minimum, Maximum and Average of the grades from the sample for the gender Female.
0
20
40
60
80
100
Lang1
Lang2
Algeb1
Algeb2
Comp1
Comp2Sci1 Sci2
Hist1
Hist2
Subjects
Ave
rag
es Min
Max
Average
29
Figure 7. Chart showing the trend of the grade averages for the Male individuals.
Trend of the Averages - Males
0
20
40
60
80
100
1 2
Marking Period
Ave
rag
es
Lang
Algeb
Comp
Sci
Hist
Figure 8. Chart showing the trend of the grade averages for the Female individuals.
Trend of the Averages - Females
0
20
40
60
80
100
1 2
Marking Period
Ave
rage
s
Lang
Algeb
Comp
Sci
Hist
Related Documents