RESEARCH ARTICLE Glycosylation of liver acute-phase proteins in pancreatic cancer and chronic pancreatitis Ariadna Sarrats 1 , Radka Saldova 2 , Eva Pla 1 , Esther Fort 3 , David J. Harvey 4 , Weston B. Struwe 2 , Rafael de Llorens 1 , Pauline M. Rudd 2 and Rosa Peracaula 1 1 Unitat de Bioquı´mica i Biologia Molecular, Departament de Biologia, Universitat de Girona, Campus de Montilivi, Girona, Spain 2 Dublin-Oxford Glycobiology Laboratory, NIBRT, Conway Institute, University College Dublin, Belfield, Dublin, Ireland 3 Unitat de Digestiu, Hospital Universitari Dr Josep Trueta, Girona, Spain 4 Glycobiology Institute, Department of Biochemistry, Oxford University, Oxford, UK Received: July 10, 2009 Revised: October 6, 2009 Accepted: December 18, 2009 Purpose: Glycosylation of acute-phase proteins (APP), which is partially regulated by cyto- kines, may be distinct in disease and provide useful tumour markers. Thus, we have examined the glycosylation of major serum APP in pancreatic cancer (PaC), chronic pancreatitis (CP) and control patients. Experimental design: Using a specific anti-sialyl Lewis X antibody and N-glycan sequencing, we have determined glycosylation changes on a-1-acid glycoprotein (AGP), haptoglobin (HPT), fetuin (FET), a-1-antitrypsin (AT) and transferrin (TRF). Results: Increased levels of sialyl Lewis X (SLe x ) were detected on AGP in advanced PaC and CP and on HPT, FET, AT and TRF in CP. An increase in N-glycan branching was detected on AGP and HPT in the advanced stage of PaC and CP and on FET and TRF in the CP. A core fucosylated structure was increased on AGP and HPT only in the advanced PaC patients. Conclusions and clinical relevance: Changes in APP SLe x and branching are probably asso- ciated with an inflammatory response because they were detected in both advanced PaC and CP patients and these conditions give rise to inflammation. On the contrary, the increase in APP core fucosylation could be cancer associated and the presence of this glycoform may give an advantage to the tumour. Keywords: Acute-phase proteins / Core fucose / Liver / Pancreatic cancer / Sialyl Lewis X 1 Introduction Pancreatic cancer (PaC) is the fourth leading overall cause of cancer death in the United States and it has the lowest 5-year survival rate (about 5%) [1]. This poor survival is mostly because of late diagnosis, frequently after metastasis. Early detection of PaC is currently not available because existing biomarkers for this disease are inadequate [2]. For example, the use of CA19-9, the most common tumour marker for PaC, is restricted by its false-positive results Abbreviations: 2-AB, 2-aminobenzamide; AGP, a-1-acid glyco- protein; APP, acute-phase proteins; AT, a-1-antitrypsin; ConA, concanavalin A; CP, chronic pancreatitis; FET, fetuin; FUT, fucosyltransferase; HC, healthy control; HCC, hepatocellular carcinoma; HPT, haptoglobin; IL, interleukin; NP, normal phase; PaC, pancreatic cancer; Q, quadrupole; RT, room temperature; SLe x , sialyl Lewis X; TBST, 0.1% Tween in TBS; TRF, transferrin; WAX, weak anion exchange Additional corresponding author: Dr. Rosa Peracaula E-mail address: [email protected] Correspondence: Professor Pauline M. Rudd, Dublin-Oxford Glycobiology Laboratory, NIBRT, Conway Institute, University College Dublin, Belfield, Dublin 4, Ireland E-mail: [email protected] Fax: 1353-17166950 & 2010 WILEY-VCH Verlag GmbH & Co. KGaA, Weinheim www.clinical.proteomics-journal.com Proteomics Clin. Appl. 2010, 4, 1–17 1 DOI 10.1002/prca.200900150

Welcome message from author
This document is posted to help you gain knowledge. Please leave a comment to let me know what you think about it! Share it to your friends and learn new things together.
Transcript

RESEARCH ARTICLE
Glycosylation of liver acute-phase proteins in pancreatic
cancer and chronic pancreatitis
Ariadna Sarrats1, Radka Saldova2, Eva Pla1, Esther Fort3, David J. Harvey4, Weston B. Struwe2,Rafael de Llorens1, Pauline M. Rudd2 and Rosa Peracaula1�
1 Unitat de Bioquımica i Biologia Molecular, Departament de Biologia, Universitat de Girona, Campus de Montilivi,Girona, Spain
2 Dublin-Oxford Glycobiology Laboratory, NIBRT, Conway Institute, University College Dublin, Belfield, Dublin,Ireland
3 Unitat de Digestiu, Hospital Universitari Dr Josep Trueta, Girona, Spain4 Glycobiology Institute, Department of Biochemistry, Oxford University, Oxford, UK
Received: July 10, 2009
Revised: October 6, 2009
Accepted: December 18, 2009
Purpose: Glycosylation of acute-phase proteins (APP), which is partially regulated by cyto-
kines, may be distinct in disease and provide useful tumour markers. Thus, we have
examined the glycosylation of major serum APP in pancreatic cancer (PaC), chronic
pancreatitis (CP) and control patients.
Experimental design: Using a specific anti-sialyl Lewis X antibody and N-glycan sequencing,
we have determined glycosylation changes on a-1-acid glycoprotein (AGP), haptoglobin
(HPT), fetuin (FET), a-1-antitrypsin (AT) and transferrin (TRF).
Results: Increased levels of sialyl Lewis X (SLex) were detected on AGP in advanced PaC and
CP and on HPT, FET, AT and TRF in CP. An increase in N-glycan branching was detected on
AGP and HPT in the advanced stage of PaC and CP and on FET and TRF in the CP. A core
fucosylated structure was increased on AGP and HPT only in the advanced PaC patients.
Conclusions and clinical relevance: Changes in APP SLex and branching are probably asso-
ciated with an inflammatory response because they were detected in both advanced PaC and
CP patients and these conditions give rise to inflammation. On the contrary, the increase in
APP core fucosylation could be cancer associated and the presence of this glycoform may give
an advantage to the tumour.
Keywords:
Acute-phase proteins / Core fucose / Liver / Pancreatic cancer / Sialyl Lewis X
1 Introduction
Pancreatic cancer (PaC) is the fourth leading overall cause of
cancer death in the United States and it has the lowest
5-year survival rate (about 5%) [1]. This poor survival is
mostly because of late diagnosis, frequently after metastasis.
Early detection of PaC is currently not available because
existing biomarkers for this disease are inadequate [2]. For
example, the use of CA19-9, the most common tumour
marker for PaC, is restricted by its false-positive results
Abbreviations: 2-AB, 2-aminobenzamide; AGP, a-1-acid glyco-
protein; APP, acute-phase proteins; AT, a-1-antitrypsin; ConA,
concanavalin A; CP, chronic pancreatitis; FET, fetuin; FUT,
fucosyltransferase; HC, healthy control; HCC, hepatocellular
carcinoma; HPT, haptoglobin; IL, interleukin; NP, normal phase;
PaC, pancreatic cancer; Q, quadrupole; RT, room temperature;
SLex, sialyl Lewis X; TBST, 0.1% Tween in TBS; TRF, transferrin;
WAX, weak anion exchange
�Additional corresponding author: Dr. Rosa Peracaula
E-mail address: [email protected]
Correspondence: Professor Pauline M. Rudd, Dublin-Oxford
Glycobiology Laboratory, NIBRT, Conway Institute, University
College Dublin, Belfield, Dublin 4, Ireland
E-mail: [email protected]
Fax: 1353-17166950
& 2010 WILEY-VCH Verlag GmbH & Co. KGaA, Weinheim www.clinical.proteomics-journal.com
Proteomics Clin. Appl. 2010, 4, 1–17 1DOI 10.1002/prca.200900150

[3, 4]. This marker is unable to differentiate PaC from
benign pancreaticobiliary disorders such as chronic
pancreatitis (CP). Thus, a great need exists for new sensitive
and specific biomarkers for PaC.
Liver plays an important role in the acute-phase response
that is one of the key processes of the innate and natural
immunity in response to tissue injury, infection and
inflammation. Cytokines produced during inflammatory
processes, including cancer, are the main stimulators for the
synthesis of liver-positive acute-phase proteins (APP) the
concentration of which in plasma increases [5]. At the same
time, the production of a number of other liver proteins is
reduced (negative APP). Some major plasma APP are
glycosylated, and include a-1-acid-glycoprotein (AGP),
haptoglobin (HPT), a-1-anti-chymotrypsin, a-1-antitrypsin
(AT) and fibrinogen (positive APP); fetuin (FET) and
transferrin (TRF) (negative APP).
Altered glycosylation is a common feature of tumour
cells and it can be reflected in their glycocalyx and secreted
glycoproteins. Generally, N-glycans are more branched and
more sialylated in tumours [6]. In addition, the Lewis
structures sialyl Lewis X (SLex) and sialyl Lewis A (SLea),
which carry an outer-arm fucose linked to N-acetyl-
glucosamine and a sialic acid linked to a-2,3 to galactose, are
overexpressed in carcinomas and have been related to
increase the invasive and metastatic tumour potential [7]. In
particular, Lewis X and related antigens, such as SLex, have
been found to be expressed in PaC tissues at higher rates
than inflamed pancreas (CP) while they were barely detected
in healthy pancreatic tissues [8–10]. PaC sera, but not sera
from healthy subjects, inhibit E-selectin binding of
pancreatic tumour cells [11], suggesting an overexpression
of the sialylated Lewis antigens SLex and SLea in the PaC
sera glycoproteins, which act as E-selectin ligands. Taken
together, these data suggest that serum-specific proteins
secreted by the tumour, which carry SLex or aberrant glycans
moieties, could be used as PaC tumour markers. In fact,
using glycoprotein microarrays with multi-lectin detection
techniques, an increase in both fucosylation and sialylation
of some serum glycoproteins has been described for PaC
patients compared with healthy controls and pancreatitis
patients [12, 13].
Pancreatic adenocarcinoma is a tumour with a high
inflammatory component [14] to which the liver responds by
producing APP. In addition, factors released by tumour
cells, such as cytokines, into the local microenvironment can
have tumour-promoting effects. These include favouring the
proliferation and survival of malignant cells, promoting
angiogenesis and metastasis [15] and modulating the cellu-
lar glycosylation machinery. Proinflammatory cytokines,
such as interleukin-1b (IL-1b), upregulate the biosynthesis
of SLex in hepatoma cells [16], and IL-6 and IL-8 increase the
levels of SLex and 6-sulfo-SLex on bronchial mucins from
cystic fibrosis patients [17]. Pancreatic adenocarcinoma cell
lines and tissues produce proinflammatory cytokines
[18, 19]. These released cytokines could alter the glycosyla-
tion of the tumour neighbouring cells and their secreted
glycoproteins. Given the close proximity of pancreas and
liver, the liver-secreted acute-phase-response glycoproteins
could also alter their glycosylation in pancreatic adeno-
carcinoma. Therefore, not only tumour-secreted glycans but
also tumour host-response glycans could provide useful
biomarkers.
Our aim was to identify glycosylation changes on the
major APP (AGP, HPT, AT, FET and TRF) produced by the
liver in the serum of PaC patients compared with healthy
controls and CP patients. For that we used two approaches.
One based on the use of specific antibodies against glycan
epitopes, as they are known to be highly more specific than
lectins, and if changes in their reactivity in the different
groups of patients could be detected, they would provide
more feasible approaches to develop PaC biomarkers. In
particular, we have used antibodies against SLex to highlight
proteins with altered expression of this cancer-related
epitope. As there are not available antibodies against all
possible N-glycan modifications in tumours, it is necessary
to determine the complete N-glycan structures of these
potential altered glycoproteins in PaC. N-glycan sequencing
is a well-established, direct strategy to evaluate glycan
alterations [20]. Thus, in our second approach, we have used
N-glycan sequencing, including HPLC, exoglycosidase
digestion analysis and MS, in order to identify other specific
glycosylation changes in different stages of PaC patients
compared with healthy controls and CP patients.
2 Materials and methods
2.1 Serum samples
Serum samples were obtained from five healthy controls
(three females and two males; age range 44–72), nine PaC
patients (six females and three males; age range 52–85, one
each in stages I, II, III and IVA and five in stage IVB) and
three CP patients (all males, age range 38–53) from the
Hospital Universitari Dr J. Trueta (Girona, Spain) following
the standard operating procedures of its Ethics Committee.
Patients were diagnosed by biopsy or image examination by
the Digestive and Pathology Units.
2.2 HSA and IgG depletion and concentration of
serum samples
Serum samples were subjected to HSA and IgG depletion
according to the procedure described by Wang et al. [21],
with modifications. Briefly, 600mL of protein G sepharose
fast flow (GE Healthcare, Uppsala, Sweden) was added to
Spin-X centrifuge tube (Costar, Corning, NY, USA) and
washed three times with MilliQ water. Polyclonal rabbit
anti-human albumin antibody (Dako, Glostrup, Denmark)
was added to the spin tube and incubated with protein G at
2 A. Sarrats et al. Proteomics Clin. Appl. 2010, 4, 1–17
& 2010 WILEY-VCH Verlag GmbH & Co. KGaA, Weinheim www.clinical.proteomics-journal.com

room temperature (RT) for 30 min with rotation, then
washed three times with PBS for removal of unbound
proteins. Thirty microlitre of human serum was diluted 1:10
in PBS, sonicated for 5 min and then incubated in a spin
tube rotating for 30 min at RT. Afterwards, the spin tube
was spun down for 2 min and the flow through was collec-
ted. The spin tube was washed three times with PBS and the
flow-through fractions were pooled (final volume of
approximately 1.8 mL).
To concentrate and desalt the samples, they were
placed on a MicroSep 3K tube (Pall, Ann Arbor, MI, USA)
and centrifuged at 6000� g for 1 h. After that the MicroSep
tube was washed four times with 2 mL of MilliQ
water and centrifuged until the sample volume was
about 300 mL. Protein concentration was determined
by the Bradford protein assay using BSA as standard
(Quick Start Bradford protein assay, BioRad, Hercules, CA,
USA).
2.3 SLex immunodetection in depleted serum
samples
After HSA and IgG depletion and concentration of serum
samples, 40mg of total protein was electrophoresed on a
10% polyacrylamide gel and transferred onto a PVDF
membrane (Millipore, Bedford, MA, USA). The membrane
was then washed with 0.1% Tween in TBS (TBST, 10 mM
Tris-HCl pH 7.5, 100 mM NaCl, 0.1% Tween-20) for 15 min
and blocked with 1% BSA in TBST for 1 h at RT. After
blocking, it was washed with TBST for 5 min and incubated
with a mouse monoclonal anti-sialyl Lewis X antibody
(Clone KM93, Calbiochem, Darmstadt, Germany) diluted
1/50 in incubation buffer (0.5% BSA in TBST) for 2 h at RT.
The membrane was then washed three times for 5 min with
TBST and subsequently incubated with a goat polyclonal
horseradish peroxidase-conjugated anti-mouse IgG1IgM1
IgA antibody F(ab)2 fragments (Abcam, Cambridge, UK)
diluted 1/40 000 in incubation buffer for 1 h at RT. After
washing out the secondary antibody five times as described
above, the membrane was incubated for 5 min with the
horseradish peroxidase substrate solution West Dura (Pierce
Biotechnology, Rockford, IL, USA). Chemi luminescence
was visualized using the imaging system Fluorochem SP
(AlphaInnotech, San Leandro, CA, USA) under non-satur-
ating conditions.
2.4 2-DE
Two different 2-DE procedures were performed depending
on the type of strip (GE Healthcare) used in the first
dimension.
(i) For the identification of glycoproteins carrying
increased SLex, isoelectric focusing was performed on
immobiline dry strips pH 3–10, 7 cm. Strips were subjected
to active in-gel rehydration (12 h, 50 V, 201C) with 60 or
100 mg of depleted serum dissolved in 200 mL of rehydration
buffer (8 M urea, 0.5% Triton X-100, 65 mM DTT, 1%
pharmalyte 3–10 (GE Healthcare), traces of bromophenol
blue). After rehydration, a water-damp electrode wick was
placed between the strip and each of the electrodes. An extra
50 mM DTT wick was placed at 1 cm from the negative
electrode. Isoelectric focusing was performed as follows:
0–500 V in 30 min, 500 V for 1 h, from 500–1000 V for
30 min, 1000 V for 1 h, from 1000–2000 V for 1.5 h, 2000 V
for 1 h, 2000–4000 V for 1.5 h, 4000 V until 14 250 V h.
For the second dimension, the strips were first equili-
brated for 15 min in equilibration buffer (6 M urea, 30%
v/v glycerol, 2% SDS, 50 mM Tris pH 8.8) containing
65 mM DTT and afterwards for 15 min in equilibration
buffer containing 135 mM iodoacetamide. The strips were
then placed on top of 10% polyacrylamide gels and sealed
with a 0.5% agarose solution containing traces of bromo-
phenol blue in running buffer (192 mM glycine, 25 mM
Tris-HCl pH 8.5, 0.1% SDS). The second dimension was
performed in a Miniprotean III unit (BioRad) under the
following conditions: 10 mA per gel and an increase of
2.5 mA per gel every 15 min.
(ii) For isolation of the APP to perform N-glycan
sequencing, immobiline dry strips pH 3–7 non-linear, 24 cm
were used. Strips were subjected to in-gel rehydration with
10 mL of serum dissolved in 450mL of rehydration buffer 2
(8 M urea; 0.5% CHAPS; 0.2% pharmalyte 3–10; 0.2% DTT,
trace of bromophenol blue) overnight at RT. Isoelectric
focusing was performed in Ettan IPGphor II IEF system
(GE Healthcare) as follows: 3500–75 000 V h, 8000 V for
10 min, 8000 V for 1 h.
For the second dimension, the strips were first equili-
brated for 15 min in equilibration buffer (50 mM Tris-HCl
pH 8.8, 6 M urea, 30% v/v glycerol, 2% w/v SDS, traces of
bromophenol blue) containing 1% w/v DTT and afterwards
for 15 min in equilibration buffer containing 2.5% w/v
iodoacetamide. The strips were then placed on top of 10%
polyacrylamide gels and sealed with a 1% agarose solution
in running buffer. The second dimension was performed in
a Protean Plus Dodeca Cell (BioRad) under the following
conditions: 1 W per gel overnight at 151C.
Following electrophoresis, proteins separated in the 2-DE
gels were either transferred to a PVDF membrane and
subjected to SLex immunodetection (after using procedure i)
or were Coomassie blue stained (after using both the
procedures i and ii).
2.5 High throughput release and processing of
N-glycans from 2-DE gel spots
Selected 2-DE gel spots were excised from the gel, cut into
1 mm3 gel pieces, transferred to a filter plate (protein
precipitation plate, Whatman, Maidstone, Kent, UK) and
stored at �201C. N-glycans were released from 2-DE gel
Proteomics Clin. Appl. 2010, 4, 1–17 3
& 2010 WILEY-VCH Verlag GmbH & Co. KGaA, Weinheim www.clinical.proteomics-journal.com
pieces and labelled according to the in-gel block method for
human serum described earlier [20], with modifications.
Briefly, gel pieces were treated with protein N-glycosidase F
to release the N-linked glycans. Half of the extracted
N-glycans were fluorescently labelled with 2-aminobenza-
mide (2-AB) by reductive amination (LudgerTag 2-AB
labelling kit, Ludger, Culham, Oxfordshire, UK). The excess
2-AB was removed in this case with Whatman 3MM chro-
matography paper. The 2-AB-labelled N-glycans were then
analyzed by normal-phase HPLC (NP-HPLC) and weak
anion exchange (WAX)-HPLC. The unlabelled N-glycans
were later analyzed by ESI-MS/MS and MALDI-TOF MS.
2.6 Simultaneous oligosaccharide sequencing by
exoglycosidase digestions
All enzymes were purchased from Prozyme (San Leandro,
CA, USA). The 2-AB-labelled glycans were digested in 10mL of
50 mM sodium acetate buffer, pH 5.5 for 18 h at 371C, (except
in the case of jack bean a-mannosidase where the buffer was
100 mM sodium acetate, 2 mM Zn21, pH 5.0) using arrays of
the following enzymes at the indicated concentrations:
Arthrobacter ureafaciens sialidase (EC 3.2.1.18), 1 U/mL;
Streptococcus pneumoniae sialidase (EC 3.2.1.18), 1 U/mL;
bovine testes b-galactosidase (EC 3.2.1.23), 1 U/mL;
S. pneumoniae b-galactosidase (EC 3.2.1.23), 0.1 U/mL; bovine
kidney a-fucosidase (EC 3.2.1.51), 1 U/mL; S. pneumoniae b-N-
acetylglucosaminidase, recombinant in Escherichia coli (EC
3.2.1.30), 8 U/mL; jack bean b-N-acetylglucosaminidase (EC
3.2.1.30), 10 U/mL; jack bean a-mannosidase (EC 3.2.1.24),
50 U/mL; almond meal a-fucosidase (EC 3.2.1.111), 3 mU/
mL; Xanthomonus sp. a-fucosidase (EC 3.2.1.51.), 0.1 U/mL.
After incubation, enzymes were removed by filtration through
a protein-binding EZ filters (Millipore) [22]. N-glycans were
then analyzed by NP-HPLC or WAX-HPLC.
2.7 N-glycan analysis by WAX-HPLC and NP-HPLC
WAX-HPLC was performed using a Vydac 301VHP575
7.5� 50-mm column (Anachem, Luton, Bedfordshire, UK)
on a 2695 Alliance separations module with a 474 fluores-
cence detector (Waters, Elstree Hertfordshire, UK). Solvent
A was 0.5 M formic acid adjusted to pH 9.0 with ammonium
solution, and solvent B was 10% v/v methanol in water.
Gradient conditions were as follows: a linear gradient of
0–5% A over 12 min at a flow rate of 1 mL/min, followed by
5–21% A over 13 min and then 21–50% A over 25 min,
80–100% A over 5 min, and then 5 min at 100% A. Samples
were injected in water. A FET N-glycan standard was used
for calibration [22].
All HPLC units were equipped with Waters temperature
control modules and Waters 2475 fluorescence detectors set
with excitation and emission wavelengths of 330 and
420 nm, respectively [20].
NP-HPLC was performed using a TSKgel amide-80 5-mm
(250� 4.6 mm) (Anachem) column on a Waters 2795 Alli-
ance HT separations module. Solvent A was 50 mM formic
acid adjusted to pH 4.4 with ammonia solution and solvent
B was ACN. The column temperature was set to 301C.
Conditions used were as follows: 60 min method – a linear
gradient of 35–47% solvent A over 48 min at a flow rate of
0.8 mL/min, followed by 1 min at 47–100% A and 4 min at
100% A, returning to 35% A over 1 min and then finishing
with 35% A for 6 min [20]. Samples were injected in 65%
ACN. The system was calibrated using an external standard
of hydrolyzed and 2-AB-labelled glucose oligomers to create
a dextran ladder, as described previously [22].
2.8 N-glycan analysis by MS
2.8.1 ESI-MS and MS/MS
One microlitre of each sample was cleaned by allowing it to
sit for approximately 1 h on the surface of a Nafion 117
membrane (Aldrich, Poole, Dorset, UK) [23] that was float-
ing on water. The samples were then transferred to a small
Eppendorf tube to which was added 6mL of a 1:1 (v/v)
mixture of water:methanol containing 0.2 M ammonium
phosphate and the entire solution was then infused through
Proxeon (Proxeon Biosystems, Odense, Denmark) borosili-
cate capillaries into a Waters (Waters MS Technologies,
Manchester, UK) tandem quadrupole TOF (Q-TOF) mass
spectrometer at a source temperature of 1201C for acquisi-
tion of electrospray (ESI) spectra. Both negative ion MS and
MS/MS (argon collisions) spectra of glycan ions were
recorded. Data acquisition and processing were conducted
with Waters MassLynx version 4.1. Interpretation of the
negative ion MS/MS spectra was according to published
work [24–27].
2.8.2 MALDI-MS
One microlitre of an aqueous solution, cleaned with the
Nafion membrane as above, was mixed on the stainless steel
MALDI target plate with 0.5 mL of a saturated solution of
2,5-DHB in ACN and allowed to dry under ambient condi-
tions. The sample spot was then recrystallized from ethanol.
Spectra were acquired with a Waters Micro MX MALDI-TOF
mass spectrometer in reflectron mode with an acceleration
voltage of 12 kV. Data acquisition and processing were
conducted with Waters MassLynx version 4.1.
2.9 Identification of the proteins in 2-DE spots by
MS analysis
Proteins contained in the 2-DE spots were in-gel digested
with trypsin (sequencing grade modified, Promega Biotech
4 A. Sarrats et al. Proteomics Clin. Appl. 2010, 4, 1–17
& 2010 WILEY-VCH Verlag GmbH & Co. KGaA, Weinheim www.clinical.proteomics-journal.com

Iberica, Madrid, Spain) in the automatic investigator
ProGest robot from Genomic Solutions. Briefly, excised gel
spots were washed with ammonium bicarbonate buffer
(50 mM NH4HCO3) and ACN. Proteins were reduced with
10 mM DTT solution during 30 min and alkylated
with a 55 mM solution of iodoacetamide. After washing with
buffer and ACN, proteins were digested overnight,
at 371C with 0.27 nmol of trypsin. Tryptic peptides were
extracted from the gel matrix with 10% formic acid and
ACN; the extracts were pooled and dried in a vacuum
centrifuge. Proteins were either analyzed in a MALDI-TOF-
TOF (4700 Proteomics Analyzer, Applied Biosystems, IL,
USA) or LC-ESI-Q-TOF (Q-TOF Global, Waters) mass
spectrometer.
For MALDI-MS and MS/MS analyses, the digests
were redissolved in 5mL of 0.1% TFA in 50% ACN.
Typically, a 0.5–1 mL of sample was mixed with the same
volume of a matrix solution (5 mg/mL CHCA; Waters)
in 0.1% TFA in 50% ACN and spotted to the MALDI
plate. MS spectra were acquired in positive reflector mode
(voltage of 20 kV in the source and a laser intensity that
ranged from 5800 to 6200). Typically, 500 shots perspectrum were accumulated. MS/MS spectra were
acquired using collision-induced dissociation with atmo-
spheric air as the collision gas. An MS/MS 1 kV positive
fragmentation mode was used. MS and MS/MS spectra
from the same spot were merged in a single MASCOT
(Matrix Science, London, UK) generic file prior to submis-
sion for database searching.
For on-line LC-ESI-MS/MS analysis (Cap-LC-nano-ESI-
Q-TOF) (CapLC, Waters), the tryptic digested peptide
samples were resuspended in 25mL of 1% formic acid
solution and 4 mL was injected to a reversed-phase capillary
C18 column (75 mm internal diameter and 15 cm length,
PepMap column, LC Packings (Dionex Biogen, Madrid,
Spain)). The eluted peptides were ionized via coated nano-
ES needles (PicoTipTM, New Objective, Woburn, MA, USA).
A capillary voltage of 2000–2800 V was applied together with
a cone voltage of 80 V. The collision energy for collision-
induced dissociation was 20–35 eV, and argon was employed
as the collision gas. Data were generated in PKL file format
and submitted for database searching in the MASCOT
server against a non-redundant Swiss-Prot database. The
search parameters were: human taxonomy, two missed
cleavages allowed, carbamidomethyl of cysteine as a fixed
modification and oxidation of methionine as a variable
modification. The peptide tolerance was 100 ppm and
0.25 Da for MS and MS/MS spectra, respectively. The
significance threshold was set at po0.05.
For the MASCOT generic file searches, only proteins
with scores above significant MASCOT level (456) were
considered as positive hits and protein summary was
selected as the report format. For the PKL files, only
peptides with scores above the significant MASCOT level
were considered for protein identification (428) and peptide
summary was selected as the report format.
3 Results
3.1 HSA and IgG serum depletion yields
Depletion of HSA and IgG from serum samples reduced the
quantity of serum proteins by about 70%. Coomassie
staining of SDS-PAGE gels from the retained and flow-
through fractions showed that only albumin and IgG were
removed (data not shown). To check that other minor serum
proteins were not extracted along with albumin and
removed from the sera, ELISA against ribonuclease 1, which
is one minor serum protein, was performed with the serum
and the corresponding serum-depleted fraction. The recov-
ery yield for ribonuclease 1 was approximately 80%, giving
some indication of the level of the losses of protein asso-
ciated with the depletion method. After removal of albumin
and IgG, depleted serum samples contained mainly serum
liver proteins including APP and other minor proteins.
3.2 SLex immunodetection in depleted serum
samples
Forty microgram of depleted serum samples from healthy
controls (HC 1–3), PaC (PaC 1–9) and CP (CP 1–3) patients
were electrophoresed, transferred onto a PVDF membrane
and subjected to SLex immunodetection. An immuno-
reactive band of approximately 50 kDa was observed for
stage IV PaC patients (PaC 1–5 and 8). Stages I, II and III
PaC patients (PaC 6, 7 and 9) showed no SLex immunode-
tection. Although this band was not detected in any of the
healthy controls analyzed, it did appear in some of the CP
patients CP 1 and 2 (two of three) (Fig. 1A). CP patients also
showed upper bands of more than 100 kDa that were posi-
tively stained for SLex, which were not further analyzed. We
focused the study on the 50 kDa band, as it was increased in
all advanced PaC patients.
In order to identify the glycoproteins carrying the
increased SLex epitope in the 50 kDa band, 60mg of depleted
PaC 8 sample was subjected to 2-DE followed by SLex
immunodetection. At approximately 50 kDa, a single SLex
immunoreactive spot was detected and showed a pI of 3.8
(Fig. 1B). A preparative 2-DE gel was run under the same
conditions but with 100 mg of depleted PaC 8 sample to
isolate and identify the proteins of the SLex immunoreactive
spot. For that the spot was excised from the
gel and subjected to the analysis of the peptide mass
fingerprints. AGP1 (score: 102, sequence coverage: 26%,
number of peptides: 9) and AGP2 (score: 119, sequence
coverage: 25%, number of peptides: 10) were the only
significant hits. AGP1 and AGP2 are two variants of the
same protein, AGP, that comigrate in the 2-DE due to their
high homology [28, 29]. Thus, AGP, one of the major
members of the positive APP [30], is the main protein
contributing to the increased SLex detection in the
approximately 50 kDa band.
Proteomics Clin. Appl. 2010, 4, 1–17 5
& 2010 WILEY-VCH Verlag GmbH & Co. KGaA, Weinheim www.clinical.proteomics-journal.com
3.3 N-glycan analysis of APP
The increased SLex found in AGP of stage IV PaC serum
compared with healthy controls suggested that other APP may
show an altered N-glycan moiety in tumour situations;
therefore, we analyzed them in detail by N-glycan sequencing.
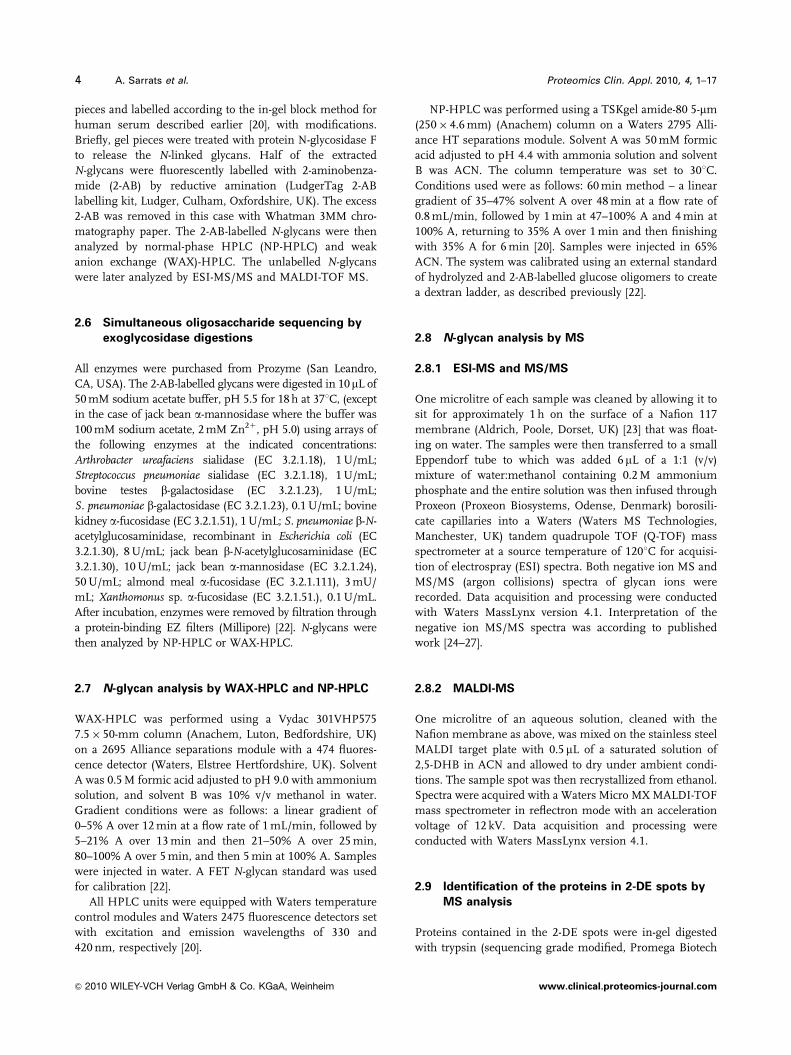
2-DE was used to isolate different APP including AGP,
HPT, FET and AT (Fig. 2) from three healthy controls (HC
2, HC 4 and HC 5), four PaC patients from different stages
(PaC 9 (stage II), PaC 7 (stage III), PaC 5 (stage IVa), PaC 8
(stage IVb)) and two CP patients (CP 1 and CP 2) that had
been found SLex positive for AGP. These protein spots were
excised from the gel and screened for possible altered
glycosylation by N-glycan analysis. After N-glycan release,
the glycoproteins contained in each spot were identified
using mass spectrometric analysis, as AGP (spot 1), FET
(spots 2–4), AT (spots 5–7), HPT (spots 8–13) and TRF (spot
14) (Table 1). LC-ESI-Q-TOF analysis of spot 14 indicated
that apart from TRF (score 642, 18 peptides matched), Ig mu
chain (score 73, only two peptides matched) could also be
present. Taking into account that Ig mu chain was not
detected by MALDI-TOF-TOF, altogether indicates that this
glycoprotein could be present in this spot, but in much
minor proportion than TRF.
N-glycans from each of the sample spots were identified
using quantitative NP-HPLC combined with exoglycosidase
digestions and the structural assignments were checked
using Glycobase database matching (http://glycobase.nibrt.
ie/cgi-bin/public/glycobase.cgi). MALDI-TOF and negative
ion ESI-MS N-glycan analyses were also performed to
corroborate the N-glycan structures contained in each spot.
In addition, N-glycans from AGP from a pool of the patients
were subjected to WAX fractionation, prior to NP-HPLC, in
order to assign the number of sialic acids in each peak. NP-
HPLC of the N-glycan profiles of a representative spot of
each APP is shown in Fig. 3. N-glycans identified in each
protein spot are shown in Table 2. The relative percentages
of the N-glycan structures for each individual protein spot
were calculated in order to measure glycosylation changes
between the different groups of patients.
The N-glycans assigned in the AGP, HPT, AT and FET
spots (spots 1 to 13) were all complex type, and presented bi-,
tri- and tetra-antennary structures. TRF (spot 14) contained
only bi- and tri-antennary glycans together with bisected
Figure 1. Sialyl Lewis X immunodetection on HSA-IgG-depleted sera of healthy controls, PaC and CP patients. (A) 40 mg of total protein
was electrophoresed on a 10% polyacrylamide gel and transferred onto a PVDF to perform SLex immunodetection. (B) 2-DE of 100 mg of
total protein of sample PaC8. At approximately 50 kDa, a SLex immunoreactive spot (pI of 3.8) was detected and identified to be AGP.
Figure 2. Example of a 2-DE gel of an unde-
pleted serum (HC 2). Different protein spots
corresponding to AGP, HPT, AT, FET and TRF
were isolated by using 24 cm, pH 3–7 non-
linear immobiline dry strips and 10% poly-
acrylamide gels, followed by Coomassie
staining.
6 A. Sarrats et al. Proteomics Clin. Appl. 2010, 4, 1–17
& 2010 WILEY-VCH Verlag GmbH & Co. KGaA, Weinheim www.clinical.proteomics-journal.com

structures, which were not detected in the other APP. In
addition, TRF had high mannose type N-glycans in a
percentage that ranged from 3 to 11%, depending on the
sample. High-mannose-type structures have not been descri-
bed before for TRF. As spot 14 could include Ig mu chain,
which has been reported to contain only high mannose
structures [31], we cannot discard the possibility that these
N-glycan structures originated from the Ig mu chain. The rest
of the N-glycan structures of spot 14 can be attributed solely to
TRF. The proportion of bi-, tri-, tetra-antennary, bisected and
high-mannose structures were calculated for each APP spot.
In order to estimate these changes for HPT, AT and FET,
which are separated in several spots, the mean of the different
spots of the same protein was calculated (Fig. 4A). Several
N-glycans were outer-arm fucosylated and only one minor
structure, a disialylated biantennary glycan F(6)A2G(4)2S2 in
peak 7, present in all APP was core fucosylated. TRF
contained in addition other three core fucosylated structures
F(6)A2G(4)2S(6)1 in peak 4, F(6)A2BG(4)2S1 in peak 5 and
F(6)A2BG(4)2S2 in peak 7. No N-acetylgalactosamine was
detected. All galactoses were b-1-4-linked to N-acetyl-
glucosamine (the same HPLC profile was obtained after
digestion with bovine testes b-galactosidase, which hydrolyses
non-reducing b-1-3- and b-1-4-linked terminal galactose,
and with S. pneumoniae b-galactosidase, which hydrolyses
non-reducing b-1-4-linked terminal galactose only). All
outer-arm fucoses were determined to be a-1-3 linked,
because they were digested by almond meal a-fucosidase
(which releases a-1-3 and a-1-4 non-reducing terminal
fucose) but not by Xanthomonus sp. a-fucosidase (which
releases a-1-2 non-reducing terminal fucose). Substitution
at position 4 was discarded because it was occupied by
galactose. The summation of the relative peak areas contain-
ing sialylated structures with outer-arm fucose linked to
N-acetylglucosamine, which is simultaneously attached to
galactose (peaks 10, 13, 14 and 17–20), was taken as a measure
of the SLex antigen and was calculated for each spot. Although
peak 13 contained a mixture of two structures with and
without a-1-3 outer-arm fucosylation in AGP and HPT, the
major one was always the outer-arm fucosylated tri-antennary
glycan, A3F(3)1G(4)3S3 which was in a proportion of about
70% in AGP and 80% in HPT. In the rest of APP analyzed,
FET, AT and TRF, peak 13 contained only the
A3F(3)1G(4)3S3 structure.
3.4 Altered glycosylation of AGP
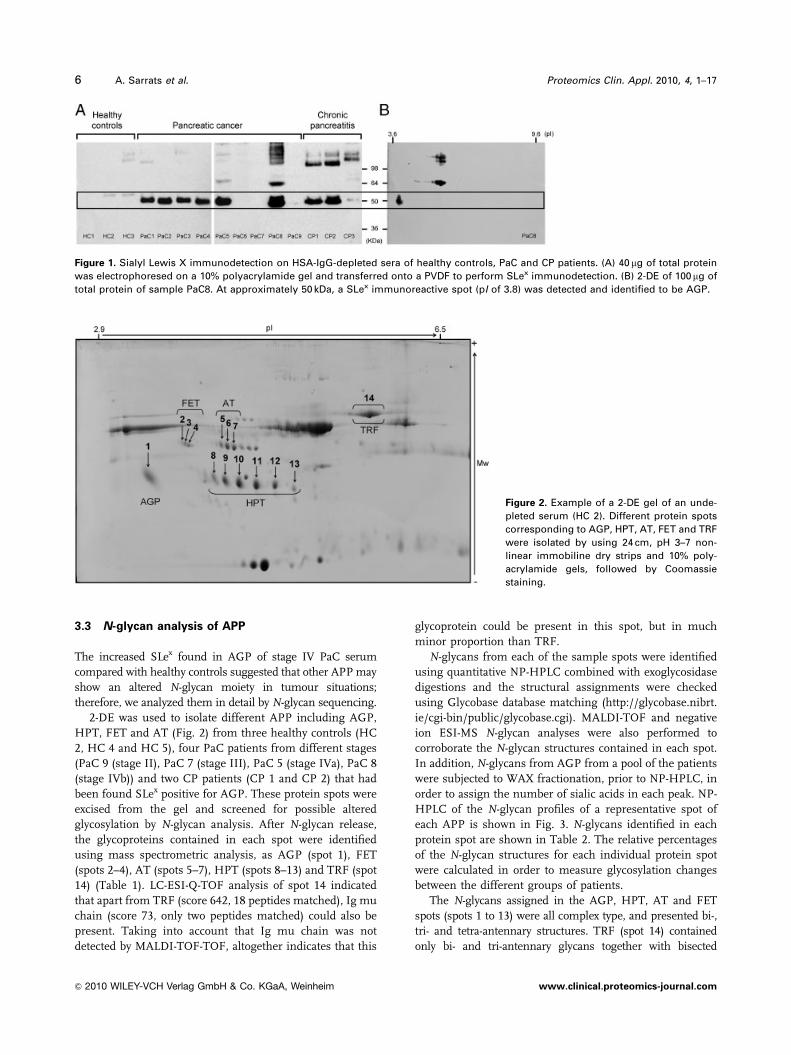
The HPLC profiles of the N-glycans obtained from spot 1
(AGP) from controls, PaC and CP patient sera are shown in
Fig. 3A. Most of the altered peaks were gradually increased or
decreased compared with healthy controls according the
following order: stages II–III PaC, stage IV PaC and CP.
Thus, stages II–III PaC profiles were more similar to controls,
while stage IV PaC and CP showed more marked differences
compared with controls. Peaks 10, 13, 14 and 17–20 were
increased in PCa stage IV and pancreatitis and contained tri-
or tetra-antennary structures with a-1-3 outer-arm fucosy-
lation. The rest of the peaks (usually the non-fucosylated form
of the increased ones) were either decreased or not altered.
Taking into account that peak 13 of AGP contains a mixture of
tri-antennary A3F(3)1G(4)3S3 (13a) and tetra-antennary
A4G(4)4S3 (13b) in a proportion of about 70:30, the percen-
tage of a-1-3 fucosylation (SLex) was calculated first by
Table 1. Identification of the proteins in 2-DE spots by MS analysis
Spot Equipment Identificationa) Accessionno.
Proteinscoreb)
Sequencecoverage (%)
Peptidesmatched
1 MALDI-TOF-TOF AGP1 P02763 201 42 71 MALDI-TOF-TOF AGP2 P19652 78 34 72 LC-ESI-Q-TOF a-2-HS-glycoprotein/fetuin P02765 110 8 33 LC-ESI-Q-TOF a-2-HS-glycoprotein/fetuin P02765 99 13 34 LC-ESI-Q-TOF a-2-HS-glycoprotein/fetuin P02765 67 2 15 MALDI-TOF-TOF a-1-antitrypsin P01009 525 66 266 MALDI-TOF-TOF a-1-antitrypsin P01009 722 70 317 MALDI-TOF-TOF a-1-antitrypsin P01009 771 72 318 MALDI-TOF-TOF Haptoglobin P00738 185 22 79 MALDI-TOF-TOF Haptoglobin P00738 237 46 13
10 MALDI-TOF-TOF Haptoglobin P00738 250 33 911 MALDI-TOF-TOF Haptoglobin P00738 230 43 1312 MALDI-TOF-TOF Haptoglobin P00738 230 43 1313 MALDI-TOF-TOF Haptoglobin P00738 287 33 914 MALDI-TOF-TOF Transferrin P02787 547 40 2314 LC-ESI-Q-TOF Transferrin P02787 642 34 1814 LC-ESI-Q-TOF Ig mu chain C region P01871 73 5 2
a) Only glycoproteins identified are listed (unglycosylated proteins are not listed).b) Only proteins with a significant MASCOT score (456) are listed for the MALDI analysis. For the ESI analysis, all the proteins identified
with significant peptides scores (428) are listed.
Proteomics Clin. Appl. 2010, 4, 1–17 7
& 2010 WILEY-VCH Verlag GmbH & Co. KGaA, Weinheim www.clinical.proteomics-journal.com
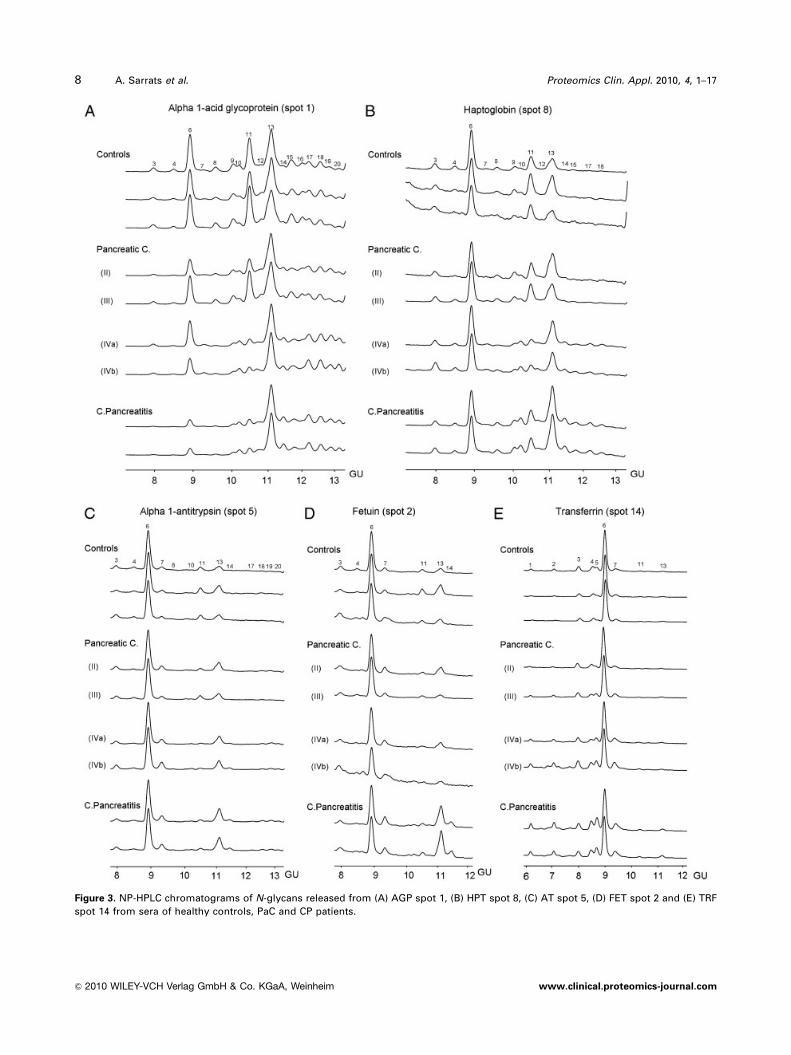
Figure 3. NP-HPLC chromatograms of N-glycans released from (A) AGP spot 1, (B) HPT spot 8, (C) AT spot 5, (D) FET spot 2 and (E) TRF
spot 14 from sera of healthy controls, PaC and CP patients.
8 A. Sarrats et al. Proteomics Clin. Appl. 2010, 4, 1–17
& 2010 WILEY-VCH Verlag GmbH & Co. KGaA, Weinheim www.clinical.proteomics-journal.com

Table 2. N-glycan structures identified on the APP
Peaka) GUb) Structurec) Spot 1(AGP)
Spots 2–4(FET)
Spots 5–7(AT)
Spots 8–13(HPT)
Spot 14(TRF)
1 6.12 M5 �d)
2 6.94 M6 �d)
3 7.86 3a A2G(4)2S1 � �� � � �
3b M7 �d)
4 8.43 4a A2G(4)2S(3)2 � �� � �
4b F(6)A2G(4)2S(6)1 �
5 8.67 5a F(6)A2BG(4)2S1 �
5b M8 (�)d)
6 8.93 6a A2G(4)2S(6)2 � �� � � �
6b A2G(4)2S(3,6)2 � � � �
7 9.40 7a F(6)A2G(4)2S2 � �� � �� �
7b F(6)A2BG(4)2S2 �
8 9.69 8a A3G(4)3S(3)2 � � �
8b A3G(4)3S(3,6)2 � �
9 10.16 A3G(4)3S(6)2 � �
10 10.30 A3F(3)1G(4)3S2 � � �
11 10.56 A3G(4)3S3 � �� � � �
12 10.93 A4G(4)4S2 � �
13 11.11 13aA3F(3)1G(4)3S3
� �70% �� � � �80% �
Proteomics Clin. Appl. 2010, 4, 1–17 9
& 2010 WILEY-VCH Verlag GmbH & Co. KGaA, Weinheim www.clinical.proteomics-journal.com

adding the relative peak areas of A3F(3)1G(4)1, A4 F(3)1G(4)1,
A4F(3)2G(4)2 and A4F(3)3G(4)3 generated after A. ureafacienssialidase 1 bovine testes b-galactosidase digestion of each of
the patients’ AGP N-glycans. Then, it was compared with that
from the summation of the undigested peaks 10, 13, 14 and
17–20 relative areas. The change in the proportion of SLex
Table 2. Continued.
Peaka) GUb) Structurec) Spot 1(AGP)
Spots 2–4(FET)
Spots 5–7(AT)
Spots 8–13(HPT)
Spot 14(TRF)
13bA4G(4)4S(3,?,?)3
� �30% � �20%
14 11.39 A4F(3)1G(4)4S2 � �� �� �
15 11.74 15a A4G(4)4S(6)3 �
15b A4G(4)4S(3,?,?,?)4
� �
15cA3F(3)2G(4)3S3
�
16 11.83 A4G(4)4S(6)4 �
17 12.00 17aA4F(3)1G(4)4S3
� � �
17b A4F(3)1G(4)4S(3,?,?,?)4
� � �
17c A4F(3)2G(4)4S2
�
18 12.37 18aA4F(3)1G4S(6)4
� � �
18b A4F(3)2G4S3 �
19 12.75 A4F(3)2G4S4 � � �
20 ? A4F(3)3G4S4 � �
a) Only peaks marked with a dot were detected on each protein.b) GU are mean values of the N-glycan peaks from all the glycoproteins analyzed.c) The N-glycan structures were assigned to each peak using quantitative HPLC, exoglycosidase digestion and Glycobase (http://
glycobase.nibrt.ie/cgi-bin/public/glycobase.cgi) combined with MALDI-TOF and ESI-MS. Structures not confirmed by MS are markedwith an asterisk. Fetuin samples failed to give any spectra neither by ESI nor MALDI-TOF.
d) High mannose structures could not be unambiguously assigned to transferrin. Minor structures are in brackets.
10 A. Sarrats et al. Proteomics Clin. Appl. 2010, 4, 1–17
& 2010 WILEY-VCH Verlag GmbH & Co. KGaA, Weinheim www.clinical.proteomics-journal.com

between the groups of patients was practically the same using
the two methods, indicating that the structure 13b hardly
influences the differences between the groups. Thus, in order
to simplify the comparison with the results of the other APP,
only the data of the undigested peaks are shown. The
percentage of outer-arm fucosylation (SLex) was clearly
increased in stage IV PaC (69.370.6) and CP (72.870.8)
groups compared with controls (45.773.7), whereas the
stages II–III PaC group showed a lower increase in outer-arm
fucosylation (54.978.9) (Fig. 4B). Branching was also
increased in stage IV PaC and CP compared with controls.
Thus, the percentage of tetra-antennary structures was
increased in both stage IV PaC (40.874.0) and CP (42.770.8)
compared with controls (29.871.7). Interestingly, stage IV
PaC showed a decrease of tri-antennary structures compared
with controls (43.670.1 versus 52.970.7), whereas the CP
group showed a decrease in biantennary glycans compared
with controls (6.370.1 versus 17.372.2) (Fig. 4A).
Peak 7 was the only peak containing core fucosylated
structures (F(6)A2G(4)2S2). In spite of its low relative
abundance, it was specifically increased in stage IV PCa
(about 50%) compared with the other groups (Fig. 4C).
3.5 Altered glycosylation of HPT
In all HPT spots (8–13), there was a gradual increase in the
percentage of tri- and tetra-antennary structures with a-1-3
outer-arm fucosylation (peaks 10, 13 and 14), compared with
controls according the following order: stages II–III PaC,
stage IV PaC and CP. However, these differences were more
easily observed in spots 8–11, as spots 12 and 13 contain
mainly biantennary structures, both mono- or disialylated
and hardly any tri- or tetra-antennary structures. Generally
speaking, the higher the isoelectric point of the protein spot,
the lower the sialic acid content of the glycoprotein. In HPT
spots, the most acidic spot (8) contained the lowest
proportion of monosialylated structures and the highest
proportion of tri- and tetra-sialylated structures, whereas the
least acid spot (13) contained the highest proportion of
monosialylated structures. N-glycan profiles of spot 8 are
shown as an example of the changes observed (Fig. 3B). The
percentage of outer-arm fucosylation (SLex) was increased in
the CP group (31.370.4) compared with controls
(22.072.1); however, it was just slightly increased in the
stage IV PaC group (25.371.3) and not increased for the
stages I–II PaC group (Fig. 4B). The changes in branching
showed the same behaviour as for spot 1 (AGP): the
percentage of tetra-antennary structures was increased in
both stage IV PaC and CP compared with controls (9.370.4
and 11.970.1 versus 8.572.0), and tri-antennary structures
were decreased in stage IV PaC (26.370.6 versus 28.872.4),
while biantennary ones where decreased in CP (55.270.4
versus 62.772.3) (Fig. 4A). Regarding core fucosylation, the
low abundant peak 7 (F(6)A2G(4)2S2) was again increased
in the stage IV PCa group compared with the rest of groups;
however, the differences were not as pronounced as in AGP
(Fig. 4C).
3.6 Altered glycosylation of AT
In all AT spots, there was also a gradual increase in the size
of peaks 13 and 14 (tri- and tetra-antennary structures with
outer-arm fucosylation) compared with controls as follows:
stages II–III PaC, stage IV PaC and CP. However, these
differences were more easily observed in spots 5 and 6. The
N-glycan profiles of spot 5 are shown as an example of the
changes observed (Fig. 3C). The percentage of a-13 outer-
arm fucosylation (SLex) was slightly increased in the CP
(21.870.0) compared with controls (17.171.9) and it was
not increased for any of the PaC groups (Fig. 4A). There
were no evident changes of branching (Fig. 4A). Regarding
core fucosylation, the low abundant peak 7 (F(6)A2G(4)2S2)
was again not only increased in the stage IV PCa group
(10.872.6), but also in the CP group (10.070.1) compared
with controls (5.670.6) (Fig. 4C).
3.7 Altered glycosylation of FET
In all FET spots, a gradual increase in the size of
peaks 13 and 14 (tri- and tetra-antennary structures with
outer-arm fucosylation) was detected compared with
controls as follows: stages II–III PaC, stage IV PaC and CP.
However, these differences were more easily observed in
spots 2 and 3. The N-glycan profiles of spot 2 are shown as
an example of the changes observed (Fig. 3D). The
percentage of a-1-3 outer-arm fucosylation (SLex) was
increased in the CP group around 2.5-fold compared with
controls (32.278.5 versus 12.473.6) and it was not increased
for any of the PaC groups. The percentage of tri- and tetra-
antennary structures was increased in CP compared with
controls (21.172.6 versus 13.573.9 and 15.377.0 versus4.87.0.9), while biantennary structures were decreased in
CP (63.679.6 versus 81.774.7) (Fig. 4B). There
were no significant changes regarding core fucosylation
although an increased tendency in stage IV PaC was
observed (Fig. 4C).
3.8 Altered glycosylation of TRF
In TRF, only one peak (13) was found to contain a-1-3-
fucosylated structures; thus, its relative percentage was
taken as a measure of outer-arm fucosylation (SLex) and
gradually increased compared with controls as follows:
stages II–III PaC, stage IV PaC and CP (Fig. 4B). Following
the same gradation, the percentage of high mannose
structures, bisected structures and tri-antennary structures
gradually increased concomitant with a decrease in bi-
antennary structures (Fig. 4A). Interestingly, and in a
Proteomics Clin. Appl. 2010, 4, 1–17 11
& 2010 WILEY-VCH Verlag GmbH & Co. KGaA, Weinheim www.clinical.proteomics-journal.com

similar way to the other APP studied, peak 7 showed an
increase in stage IV PaC compared with the rest of the
groups, although, in this case, when comparing with CP,
this increase was very small. When considering all peaks
containing core-fucosylated structures (peaks 4, 5 and 7), CP
was the group that showed the highest increase compared
with controls (Fig. 4C).
4 Discussion
4.1 Altered glycosylation of APP in PaC and
pancreatitis
APP are plasma proteins secreted mostly by the liver and
their plasma concentration increases (positive APP) or
decreases (negative APP) by at least 25% in response to
inflammation [5]. Most of these proteins are glycosylated
and changes in their glycosylation pattern can be associated
with disease [28, 32, 33]. Positive APP fulfil a variety
of functions but principally are thought to help in the
body response to infection and may also have a role in
healing and repair [5, 34]. In our study, we have focused
on the possible changes in the N-glycans of some of the
major APP AGP, HPT, FET, AT and TRF in the serum
of PaC patients. As controls, we have chosen serum
from healthy people and also from CP patients that have a
chronic inflammatory status, as changes of APP N-glycans
have been described in inflammation [32]. Our results
have shown several N-glycan modifications in stage IV
PaC and in CP on the different APP analyzed. The main
changes included increased a-1-3 fucosylation (SLex) and
Figure 4. Representation of
branching (A), a-1-3 fucosyla-
tion (B) and core fucosylation
(C) changes on AGP, HPT, AT,
FET and TRF in healthy
controls, stages II–III PaC, stage
IV PaC and CP patients. �High
mannose structures could not
be unambiguously assigned to
TRF.
12 A. Sarrats et al. Proteomics Clin. Appl. 2010, 4, 1–17
& 2010 WILEY-VCH Verlag GmbH & Co. KGaA, Weinheim www.clinical.proteomics-journal.com

branching in both stage IV PaC and CP and an increase of
core fucosylation in stage IV PaC on most of the APP
analyzed.
4.2 Changes in N-glycan branching
An increase in the amount of tetra-antennary structures on
AGP and HPT was observed in CP and in stage IV PaC. A
concomitant decrease in tri-antennary structures was
observed in stage IV PaC patients, while in CP patients, the
percentage of biantennary glycans was decreased. FET
showed the same changes in CP patients as AGP and HPT
but more significantly, and in addition, an increase of tri-
antennary structures was also observed.
TRF showed a different repertoire of N-glycan structures
than the other studied APP; apart from the main disialylated
biantennary and minor tri-antennary N-glycans, it contained
no tetra-antennary structures, but possessed bisected
glycans, in agreement with other data previously reported
[35–38]. In our work, we also found minor high mannose
structures in each of the samples analyzed (from 3 to 11%);
these probably originate from the Ig mu chain protein that
appeared to contaminate the TRF sample. Interestingly, a
change in branching pattern was also detected, namely a
decrease in biantennary structures in both stage IV PaC and
CP patients concomitant with an increase in bisected and
tri-antennary glycans.
Substantial increases in AGP glycoforms expressing
biantennary glycans are apparent in the early phase of an
acute-phase reaction. However, these are decreased
compared with control levels after the second day following
surgical trauma [39]. There is no agreement regarding
branching changes observed in chronic inflammation.
Some publications described an increase of biantennary
glycans on AGP [40]. Others reported that AGP concanava-
lin A (ConA) reactivity showed a transition from initially
elevated to decreased levels as disease became chronic,
which indicates an increase in branching in chronic
inflammation [41], consistent with the increased branching
we observe in CP.
HPT has previously been described as having an
increased branching in ovarian cancer compared with
controls [42] and in prostate cancer compared with benign
prostatic hyperplasia [43]. Increase in TRF branching has
been reported for HCC compared with healthy controls [38]
and for chronic inflammation, in particular in different
types of rheumatoid arthritis [44].
4.3 Changes in SLex expression
AGP showed an increased SLex content in pancreatitis and
stage IV PaC patients compared with controls by two
different approaches, Western blot and N-glycan sequen-
cing. This APP has been described to carry an increased
a-1-3 fucosylation in patients with acute inflammation
[39, 40] and chronic inflammation such as rheumatoid
arthritis and diabetes mellitus [40, 45, 46]. An increase in
SLex expression on AGP has also been reported in both
acute and chronic inflammations [47].
a-1-3 fucosylation on AGP was proposed as a marker of
progression and prognosis in different types of malig-
nancies in a study with 214 patients [48]. In both advanced
ovarian and breast cancers an increase of SLex in serum
AGP have been described and indeed proposed as a
marker of disease progression in the case of breast cancer
[49, 50].
The rest of APP, such as HPT, FET, AT and TRF, showed
an increased a-1-3 fucosylation (SLex) for the CP patients
compared with controls, which was much more pronounced
on FET. Taking into account that the CP group showed also
other immunoreactive bands for SLex detected by Western
blot, altogether these data suggest that this sialylated anti-
gen is closely linked to an inflammatory condition of the
pancreas.
In the case of HPT, stage IV PaC patients also showed an
increased SLex compared with controls. Increases in fuco-
sylated HPT have been observed in both acute (severe
trauma) and chronic inflammations (rheumatic arthritis and
inflammatory bowel disease) [42, 47] and in different types
of cancers including advanced ovarian cancer [49, 51],
mammary carcinoma [52], prostate cancer [43] and lung
cancer [53]. An increase of total fucosylation on HPT has
been described in PaC [50] and, in agreement with our
results, the incidence of positive HPT fucosylation (Aleuriaaurantia lectin affinity) increased in advanced stages [54]. In
another work [55], the authors described that SLex-type
fucosylation on HPT also increased in pancreatitis patients
but to a lower extent than in PaC patients. On the contrary,
we have observed a higher HPT SLex-type fucosylation in
pancreatitis than in PaC patients. Interestingly, we observed
a significant increase in the a-1-3 fucosylation of FET (2.5-
fold) in the pancreatitis patients that should be further
investigated with more serum samples to define a possible
clinical implications.
Although an increased fucosylation on AT has been
described in other types of cancer (breast and ovarian) [56],
we did not observe an increase in PaC patients and only
pancreatitis patients showed a slight increase of a-1-3
fucosylation on AT. The increase in a-1-3 fucosylation of
TRF has been detected in the tri-antennary structure present
in peak 13. a-1-3 fucosylation increase has also been
reported in the tri-antennary N-glycans of TRF for HCC
patients using lectin and Bio-Gel P4 chromatography [38].
4.4 Changes in core fucosylation
While our results indicate that increase in branching and
a-1-3 fucosylation on APP is a common feature of both
advanced PaC and pancreatitis, increase of the minor-core-
Proteomics Clin. Appl. 2010, 4, 1–17 13
& 2010 WILEY-VCH Verlag GmbH & Co. KGaA, Weinheim www.clinical.proteomics-journal.com
fucosylated biantennary structure F(6)A2G(4)2S2 seems to
be a more cancer-specific modification. Although the
percentage of this glycan is increased in all the APP, it is
only significantly augmented at advanced stages of PaC
patients on AGP and HPT.
AGP and HPT showed an increased core fucosylation in
lung cancer patients compared with healthy controls [57]. In
HCC, an increase of core fucosylation in AGP, AT, FET and
TRF has been described compared with controls and other
chronic liver diseases [38, 36, 58, 59]. An increase of core
fucosylation on HPT has also been reported in HCC
compared with chronic liver disease [60], although another
study showed an opposite tendency when comparing HPT
from HCC and control serum [58]. The increase in core
fucosylation for most APP described in HCC has been usually
detected using specific lectins, namely Lens culinaris aggluti-
nin. Increase of core-fucosylated HPT has been described in
PaC patients (Aspergillus oryzae lectin affinity) compared with
controls [54] in agreement with our results. In our work, we
have performed detailed N-glycan sequencing, which can
discriminate between core and outer-arm fucosylation and
gives more precise information than lectin-binding studies. In
addition, we have also included the pancreatitis patients and
have shown that increased core fucosylation is a cancer-
specific modification of AGP and HPT. Other glycoproteins
show an increased core fucosylation in cancer. Core fucosy-
lated a-fetoprotein, called AFP-L3, is very specifically increased
in HCC and was approved as a tumour marker by the food
and drug administration in 2005 [61]. Serum ribonuclease 1
was also much more core fucosylated in PaC sera than in
control patients [62] which suggests that quantification of core
fucosylation of some PaC serum glycoproteins might be
useful for diagnostic or prognosis purposes.
4.5 Regulation of glycosylation in APP
Cytokines involved in the induction of the inflammatory
reaction have been described to regulate both APP synthesis
and glycosylation [5]. Their effect has been studied in vitro
using hepatoma cell lines. Stimulation of the hepatic carci-
noma cells HUH-7 with proinflammatory cytokines such as
IL-1b and/or IL-6 for 2 days increased AGP production and
ConA reactivity (biantennary glycoforms). However, there
was a decrease on AGP ConA reactivity after 5 days of
stimulation, probably linked to a decrease of biantennary
structures (increase of branching) [63], consistently with the
present study where an increase of branching is observed in
chronic inflammation (pancreatitis). However, the
mechanism by which these cytokines cause the branching
modifications of APP has not been studied. Increases in
tetra-antennary structures have been related to an upregu-
lation of N-acetylglucosaminyltransferase V (GnT-V), the
enzyme responsible for the b-1-6 branching [64]. Thus,
this enzyme may be overexpressed in liver cells of both
pancreatitis and stage IV PaC patients, as both illnesses
show an increase of tetra-antennary structures in AGP and
HPT. In stage IV PaC patients, a concomitant decrease in
tri-antennary structures was observed while in pancreatitis
biantennary glycans were decreased. These results suggest
that N-acetylglucosaminyltransferase IV (GnT-IV), the
enzyme responsible for the addition of the b-1-4 branch-
ing (third antennae), may be upregulated in CP.
Stimulation of HUH-7 cells with IL-1b also increased
SLex on secreted AGP by enhancing the expression of the
b-galactoside a-2,3-sialyltransferase IV (ST3 Gal IV) and
fucosyltransferase VI (FUT VI) [16, 63]. Stimulation of
hepatoma cells with IL-6 increase both HPT synthesis and
fucosylation, which was linked to an enhanced expression of
fucosylation-related genes such as FUT6 and FUT8, GDP-
fucose synthase and GDP-mannose-4,6-dehydratase [65].
Cytokines might play a similar role in vivo and modify APP
glycosylation. The most important sources of cytokines are
macrophages and monocytes at the inflammatory sites [5]. In a
chronic inflammatory condition such as CP, these cytokines
would be produced in the damaged pancreas and produce
various systemic effects including liver stimulation to increase
APP synthesis and specific glycosyltransferases responsible for
the increase of APP branching and SLex-type fucosylation. A
similar mechanism may take place in cancer, as tumours and
Clinical Relevance
PaC lacks any specific and sensitive tumour marker.
As other carcinomas, it is associated with changes in
cellular glycosylation and release of inflammatory
cytokines. Serum APP, which are secreted by the
liver, may modify their glycosylation in tumours and
could be potential sensors of this disease. The
glycosylation analysis of major APP in PaC, CP and
control patients has shown that some N-glycan
changes were associated to an inflammatory
condition, as they were detected in advanced stages
of PaC and in CP, while others (core fucosylation)
could only be detected in advanced PaC patients and
therefore could be regarded as cancer specific. The
evaluation of a larger cohort of patients is required
to define the potential clinical utility of increased
core fucosylation of AGP and HPT as PaC markers.
However, these results highlight the importance of
determining the glycosylation changes of serum
proteins, such as APP, as this post-translational
modification is modulated in pathophysiological
conditions and therefore it may be useful as a
disease marker.
14 A. Sarrats et al. Proteomics Clin. Appl. 2010, 4, 1–17
& 2010 WILEY-VCH Verlag GmbH & Co. KGaA, Weinheim www.clinical.proteomics-journal.com
tumour microenvironments are a rich source of cytokines [15].
This fact has indeed been observed in PaC tissues and cell lines
[18, 19]. In addition, it was described that IL-6 from the
conditioned media of the PSN-1 PaC cells increase production
of fucosylated HPT from HepG2 hepatoma cells [65].
Different serum cytokines are increased in PaC patient
serum compared with healthy controls, although most of
them are increased even more in CP [66]. This would explain
why increase of SLex and branching on APP is more evident
in pancreatitis and in stage IV PaC. Stages II–III PaC show
very little APP glycan alterations, probably due to a lower
serum level of cytokines. However, the presence of other
cancer-related regulatory factors of APP glycosylation cannot
be ruled out. In this regard, the increase in core fucosylation
seems to be a more specific cancer glycan alteration than SLex-
type fucosylation or branching. FUT8 is the only known FUT
involved in the addition of core fucose [61]. Thus, upregulation
of this enzyme, which expression is very low in normal liver
[67], might take place in the liver of PaC patients from
advanced stages but not in pancreatitis patients. Other
mechanisms such as the enhancement in the levels of GDP-
fucose synthase or GDP-mannose-4,6-dehydratase proteins,
which both contribute to the synthesis of GDP-fucose, or even
in the levels of GDP-fucose transporter, could also occur and
would contribute to the increase of the core-fucosylated glycan
structures on AGP and HPT in the liver of PCa patients.
4.6 Biological function and diagnostic significance
of APP-altered glycosylation
It is not clear which biological functions are affected by the
altered glycosylation of APP in cancer and in inflammation.
It has been proposed that the increase in SLex-substituted
glycans on AGP might represent a mechanism for feedback
inhibition of leukocyte extravasation into inflamed tissues.
AGP expressing SLex may interact with E-selectin expressed
at the surface of endothelial cells and compete with leuko-
cytes also expressing SLex [30]. Regarding the diagnostic
significance of the APP glycan alterations, increases of
branching and SLex on APP might reflect the inflammatory
status of the patient, and may only be used as markers of
progression and prognosis [48, 50]. However, core fucosy-
lation of APP seems to be a cancer-specific modification not
related to inflammation, as it was detected in our study at
advanced stages of PaC and also reported in other cancers
such as HCC. The increase in core fucosylation in several
serum APP has been described using several methods in
different sets of samples, which makes it difficult to draw
solid conclusions relating to its potential clinical applica-
tions. An overall study that could analyze this N-glycan
modification in a larger number of samples and in different
types of malignancies would be required to establish the
clinical utility of APP core fucosylation changes.
In conclusion, glycosylation changes in serum APP could
act as sensors of disease. We have shown that increased
branching and SLex-type fucosylation on APP is a common
feature of advanced PaC and CP. Thus, these glycan changes
may be associated with the cancer-related inflammation and
not just the cancer itself. Increase of core fucosylation on
AGP and HPT seems to be a more cancer-specific modifi-
cation, although only detectable at advanced stages of PaC.
It should be investigated in a larger cohort of patients
including other cancers, to define its potential clinical utility
as a PaC diagnostic or monitoring tool.
A. S. acknowledges University of Girona for a pre-doctoralfellowship and for a short-term mobility fellowship. The authorsthank the Proteomics Platform of Barcelona Science Park; amember of ProteoRed network for the MS analysis of the proteinsand the Wellcome Trust for an equipment grant to purchase theQ-TOF Ultima Global mass spectrometer. This work was supportedby Spanish Ministerio de Ciencia e Innovacion (grant BIO 2007-61323, awarded to R. P.), La Marato de TV3 foundation (grant050932, awarded to R. P.), the Government of Catalonia (grant2005SGR00065, awarded to R. L.) and National Institute forBioprocessing Research and Training, Ireland.
The authors have declared no conflict of interest.
5 References
[1] Jemal, A., Siegel, R., Ward, E., Hao, Y. et al., Cancer statis-
tics, 2008. CA Cancer J. Clin. 2008, 58, 71–96.
[2] Goggins, M., Molecular markers of early pancreatic cancer.
J. Clin. Oncol. 2005, 23, 4524–4531.
[3] Grote, T., Logsdon, C. D., Progress on molecular markers
of pancreatic cancer. Curr. Opin. Gastroenterol. 2007, 23,
508–514.
[4] Misek, D. E., Patwa, T. H., Lubman, D. M., Simeone, D. M.,
Early detection and biomarkers in pancreatic cancer. J. Natl.
Compr. Cancer Netw. 2007, 5, 1034–1041.
[5] Gabay, C., Kushner, I., Acute-phase proteins and other
systemic responses to inflammation. N. Engl. J. Med. 1999,
340, 448–454.
[6] Dube, D. H., Bertozzi, C. R., Glycans in cancer and inflam-
mation – potential for therapeutics and diagnostics. Nat.
Rev. Drug Discov. 2005, 4, 477–488.
[7] Peracaula, R., Barrabes, S., Sarrats, A., Rudd, P. M., de
Llorens, R., Altered glycosylation in tumours focused to
cancer diagnosis. Dis. Markers 2008, 25, 207–218.
[8] Kim, Y. S., Itzkowitz, S. H., Yuan, M., Chung, Y. et al., Lex and
Ley antigen expression in human pancreatic cancer. Cancer
Res. 1988, 48, 475–482.
[9] Satomura, Y., Sawabu, N., Takemori, Y., Ohta, H. et al.,
Expression of various sialylated carbohydrate antigens in
malignant and nonmalignant pancreatic tissues. Pancreas
1991, 6, 448–458.
[10] Sinn, H. P., Brown, S. A., Oberle, E., Thompson, J. S., Analysis
of the Lewisx epitope in human pancreas and pancreatic
adenocarcinomas. Int. J. Pancreatol. 1992, 11, 125–135.
Proteomics Clin. Appl. 2010, 4, 1–17 15
& 2010 WILEY-VCH Verlag GmbH & Co. KGaA, Weinheim www.clinical.proteomics-journal.com

[11] Sawada, T., Ho, J. J., Chung, Y. S., Sowa, M., Kim, Y. S.,
E-selectin binding by pancreatic tumor cells is inhibited by
cancer sera. Int. J. Cancer 1994, 57, 901–907.
[12] Li, C., Simeone, D. M., Brenner, D. E., Anderson, M. A.
et al., Pancreatic cancer serum detection using a lectin/
glyco-antibody array method. J. Proteome Res. 2009, 8,
483–492.
[13] Zhao, J., Patwa, T. H., Qiu, W., Shedden, K. et al., Glyco-
protein microarrays with multi-lectin detection: unique
lectin binding patterns as a tool for classifying normal,
chronic pancreatitis and pancreatic cancer sera.
J. Proteome Res. 2007, 6, 1864–1874.
[14] Farrow, B., Evers, B. M., Inflammation and the development
of pancreatic cancer. Surg. Oncol. 2002, 10, 153–169.
[15] Mantovani, A., Allavena, P., Sica, A., Balkwill, F., Cancer-
related inflammation. Nature 2008, 454, 436–444.
[16] Higai, K., Miyazaki, N., Azuma, Y., Matsumoto, K.,
Interleukin-1beta induces sialyl Lewis X on hepato-
cellular carcinoma HuH-7 cells via enhanced expression
of ST3Gal IV and FUT VI gene. FEBS Lett. 2006, 580,
6069–6075.
[17] Groux-Degroote, S., Krzewinski-Recchi, M. A., Cazet, A.,
Vincent, A. et al., IL-6 and IL-8 increase the expression of
glycosyltransferases and sulfotransferases involved in the
biosynthesis of sialylated and/or sulfated Lewisx epitopes in
the human bronchial mucosa. Biochem. J. 2008, 410,
213–223.
[18] Bellone, G., Smirne, C., Mauri, F. A., Tonel, E. et al., Cyto-
kine expression profile in human pancreatic carcinoma cells
and in surgical specimens: implications for survival. Cancer
Immunol. Immunother. 2006, 55, 684–698.
[19] Blanchard, J. A., II, Barve, S., Joshi-Barve, S., Talwalker, R.,
Gates, L. K., Jr., Cytokine production by CAPAN-1 and
CAPAN-2 cell lines. Dig. Dis. Sci. 2000, 45, 927–932.
[20] Royle, L., Campbell, M. P., Radcliffe, C. M., White, D. M.
et al., HPLC-based analysis of serum N-glycans on a 96-well
plate platform with dedicated database software. Anal.
Biochem. 2008, 376, 1–12.
[21] Wang, Y. Y., Cheng, P., Chan, D. W., A simple affinity spin
tube filter method for removing high-abundant common
proteins or enriching low-abundant biomarkers for serum
proteomic analysis. Proteomics 2003, 3, 243–248.
[22] Royle, L., Radcliffe, C. M., Dwek, R. A., Rudd, P. M., Detailed
structural analysis of N-glycans released from glycopro-
teins in SDS-PAGE gel bands using HPLC combined with
exoglycosidase array digestions. Methods Mol. Biol. 2006,
347, 125–143.
[23] Bornsen, K. O., Mohr, M. D., Widmer, H. M., Ion exchange
and purification of carbohydrates on a Nafion(R) membrane
as a new sample pretreatment for matrix-assisted laser
desorption-ionization mass spectrometry. Rapid Commun.
Mass Spectrom. 1995, 9, 1031–1034.
[24] Harvey, D. J., Fragmentation of negative ions from carbo-
hydrates: part 1. Use of nitrate and other anionic adducts for
the production of negative ion electrospray spectra from
N-linked carbohydrates. J. Am. Soc. Mass Spectrom. 2005,
16, 622–630.
[25] Harvey, D. J., Fragmentation of negative ions from
carbohydrates: part 2. Fragmentation of high-mannose
N-linked glycans. J. Am. Soc. Mass Spectrom. 2005, 16,
631–646.
[26] Harvey, D. J., Fragmentation of negative ions from carbo-
hydrates: part 3. Fragmentation of hybrid and complex
N-linked glycans. J. Am. Soc. Mass Spectrom. 2005, 16,
647–659.
[27] Harvey, D. J., Royle, L., Radcliffe, C. M., Rudd, P. M., Dwek,
R. A., Structural and quantitative analysis of N-linked
glycans by matrix-assisted laser desorption ionization and
negative ion nanospray mass spectrometry. Anal. Biochem.
2008, 376, 44–60.
[28] Ceciliani, F., Pocacqua, V., The acute-phase protein alpha1-
acid glycoprotein: a model for altered glycosylation during
diseases. Curr. Protein Pept. Sci. 2007, 8, 91–108.
[29] Sanchez, J. C., Appel, R. D., Golaz, O., Pasquali, C. et al.,
Inside SWISS-2DPAGE database. Electrophoresis 1995, 16,
1131–1151.
[30] Fournier, T., Medjoubi, N. N., Porquet, D., Alpha-1-acid
glycoprotein. Biochim. Biophys. Acta 2000, 1482, 157–171.
[31] Wormald, M. R., Wooten, E. W., Bazzo, R., Edge, C. J. et al.,
The conformational effects of N-glycosylation on the tail-
piece from serum IgM. Eur. J. Biochem. 1991, 198, 131–139.
[32] Gornik, O., Lauc, G., Glycosylation of serum proteins in
inflammatory diseases. Dis. Markers 2008, 25, 267–278.
[33] Klein, A., Human total serum N-glycome. Adv. Clin. Chem.
2008, 46, 51–85.
[34] Gruys, E., Toussaint, M. J., Niewold, T. A., Koopmans, S. J.,
Acute-phase reaction and acute-phase proteins. J. Zhejiang
Univ. Sci. B 2005, 6, 1045–1056.
[35] Fu, D., van Halbeek, H., N-glycosylation site mapping of
human serotransferrin by serial lectin affinity chromato-
graphy, fast atom bombardment-mass spectrometry, and
1H nuclear magnetic resonance spectroscopy. Anal.
Biochem. 1992, 206, 53–63.
[36] Matsumoto, K., Maeda, Y., Kato, S., Yuki, H., Alteration of
asparagine-linked glycosylation in serum transferrin of
patients with hepatocellular carcinoma. Clin. Chim. Acta
1994, 224, 1–8.
[37] Satomi, Y., Shimonishi, Y., Hase, T., Takao, T., Site-specific
carbohydrate profiling of human transferrin by nano-flow
liquid chromatography/electrospray ionization mass spec-
trometry. Rapid Commun. Mass Spectrom. 2004, 18,
2983–2988.
[38] Yamashita, K., Koide, N., Endo, T., Iwaki, Y., Kobata, A.,
Altered glycosylation of serum transferrin of patients with
hepatocellular carcinoma. J. Biol. Chem. 1989, 264,
2415–2423.
[39] De Graaf, T. W., Van der Stelt, M. E., Anbergen, M. G., van
Dijk, W., Inflammation-induced expression of sialyl Lewis X-
containing glycan structures on alpha 1-acid glycoprotein
(orosomucoid) in human sera. J. Exp. Med. 1993, 177,
657–666.
[40] Higai, K., Aoki, Y., Azuma, Y., Matsumoto, K., Glycosylation
of site-specific glycans of alpha1-acid glycoprotein and
& 2010 WILEY-VCH Verlag GmbH & Co. KGaA, Weinheim www.clinical.proteomics-journal.com
16 A. Sarrats et al. Proteomics Clin. Appl. 2010, 4, 1–17
alterations in acute and chronic inflammation. Biochim.
Biophys. Acta 2005, 1725, 128–135.
[41] Fassbender, K., Zimmerli, W., Kissling, R., Sobieska, M.
et al., Glycosylation of alpha 1-acid glycoprotein in relation
to duration of disease in acute and chronic infection and
inflammation. Clin. Chim. Acta 1991, 203, 315–327.
[42] Turner, G. A., Haptoglobin. A potential reporter molecule
for glycosylation changes in disease. Adv. Exp. Med. Biol.
1995, 376, 231–238.
[43] Fujimura, T., Shinohara, Y., Tissot, B., Pang, P. C. et al.,
Glycosylation status of haptoglobin in sera of patients with
prostate cancer vs. benign prostate disease or normal
subjects. Int. J. Cancer 2008, 122, 39–49.
[44] Feelders, R. A., Vreugdenhil, G., de Jong, G., Swaak, A. J.,
van Eijk, H. G., Transferrin microheterogeneity in rheuma-
toid arthritis. Relation with disease activity and anemia of
chronic disease. Rheumatol. Int. 1992, 12, 195–199.
[45] Higai, K., Azuma, Y., Aoki, Y., Matsumoto, K., Altered
glycosylation of alpha1-acid glycoprotein in patients with
inflammation and diabetes mellitus. Clin. Chim. Acta 2003,
329, 117–125.
[46] Poland, D. C., Schalkwijk, C. G., Stehouwer, C. D., Koele-
man, C. A. et al., Increased alpha3-fucosylation of alpha1-
acid glycoprotein in type I diabetic patients is related to
vascular function. Glycoconj. J. 2001, 18, 261–268.
[47] Brinkman-van der Linden, E. C., de Haan, P. F., Havenaar,
E. C., van Dijk, W., Inflammation-induced expression of sialyl
LewisX is not restricted to alpha1-acid glycoprotein but also
occurs to a lesser extent on alpha1-antichymotrypsin and
haptoglobin. Glycoconj. J. 1998, 15, 177–182.
[48] Hashimoto, S., Asao, T., Takahashi, J., Yagihashi, Y. et al.,
alpha1-acid glycoprotein fucosylation as a marker of carci-
noma progression and prognosis. Cancer 2004, 101,
2825–2836.
[49] Saldova, R., Royle, L., Radcliffe, C. M., Abd Hamid, U. M.
et al., Ovarian cancer is associated with changes in glyco-
sylation in both acute-phase proteins and IgG. Glycobiology
2007, 17, 1344–1356.
[50] Abd Hamid, U. M., Royle, L., Saldova, R., Radcliffe, C. M.
et al., A strategy to reveal potential glycan markers from
serum glycoproteins associated with breast cancer
progression. Glycobiology 2008, 18, 1105–1118.
[51] Thompson, S., Dargan, E., Turner, G. A., Increased fucosy-
lation and other carbohydrate changes in haptoglobin in
ovarian cancer. Cancer Lett. 1992, 66, 43–48.
[52] Thompson, S., Turner, G. A., Elevated levels of abnormally-
fucosylated haptoglobins in cancer sera. Br. J. Cancer 1987,
56, 605–610.
[53] Kossowska, B., Ferens-Sieczkowska, M., Gancarz, R.,
Passowicz-Muszynska, E., Jankowska, R., Fucosylation of
serum glycoproteins in lung cancer patients. Clin. Chem.
Lab. Med. 2005, 43, 361–369.
[54] Okuyama, N., Ide, Y., Nakano, M., Nakagawa, T. et al.,
Fucosylated haptoglobin is a novel marker for pancreatic
cancer: a detailed analysis of the oligosaccharide structure
and a possible mechanism for fucosylation. Int. J. Cancer
2006, 118, 2803–2808.
[55] Nakano, M., Nakagawa, T., Ito, T., Kitada, T. et al., Site-
specific analysis of N-glycans on haptoglobin in sera of
patients with pancreatic cancer: a novel approach for the
development of tumor markers. Int. J. Cancer 2008, 122,
2301–2309.
[56] Goodarzi, M. T., Turner, G. A., Decreased branching,
increased fucosylation and changed sialylation of alpha-1-
proteinase inhibitor in breast and ovarian cancer. Clin.
Chim. Acta 1995, 236, 161–171.
[57] Ueda, K., Katagiri, T., Shimada, T., Irie, S. et al., Compara-
tive profiling of serum glycoproteome by sequential puri-
fication of glycoproteins and 2-nitrobenzensulfenyl (NBS)
stable isotope labeling: a new approach for the novel
biomarker discovery for cancer. J. Proteome Res. 2007, 6,
3475–3483.
[58] Comunale, M. A., Lowman, M., Long, R. E., Krakover, J.
et al., Proteomic analysis of serum associated fucosylated
glycoproteins in the development of primary hepatocellular
carcinoma. J. Proteome Res. 2006, 5, 308–315.
[59] Naitoh, A., Aoyagi, Y., Asakura, H., Highly enhanced fuco-
sylation of serum glycoproteins in patients with hepato-
cellular carcinoma. J. Gastroenterol. Hepatol. 1999, 14,
436–445.
[60] Ang, I. L., Poon, T. C., Lai, P. B., Chan, A. T . et al., Study of
serum haptoglobin and its glycoforms in the diagnosis
of hepatocellular carcinoma: a glycoproteomic approach.
J. Proteome Res. 2006, 5, 2691–2700.
[61] Miyoshi, E., Moriwaki, K., Nakagawa, T., Biological function
of fucosylation in cancer biology. J. Biochem. 2008, 143,
725–729.
[62] Barrabes, S., Pages-Pons, L., Radcliffe, C. M., Tabares, G.
et al., Glycosylation of serum ribonuclease 1 indicates a major
endothelial origin and reveals an increase in core fucosylation
in pancreatic cancer. Glycobiology 2007, 17, 388–400.
[63] Azuma, Y., Murata, M., Matsumoto, K., Alteration of sugar
chains on alpha(1)-acid glycoprotein secreted following
cytokine stimulation of HuH-7 cells in vitro. Clin. Chim. Acta
2000, 294, 93–103.
[64] Taniguchi, N., Miyoshi, E., Ko, J. H., Ikeda, Y., Ihara, Y.,
Implication of N-acetylglucosaminyltransferases III and V in
cancer: gene regulation and signaling mechanism. Biochim.
Biophys. Acta 1999, 1455, 287–300.
[65] Narisada, M., Kawamoto, S., Kuwamoto, K., Moriwaki, K.
et al., Identification of an inducible factor secreted by
pancreatic cancer cell lines that stimulates the production of
fucosylated haptoglobin in hepatoma cells. Biochem.
Biophys. Res. Commun. 2008, 377, 792–796.
[66] Zeh, H. J., Winikoff, S., Landsittel, D. P., Gorelik, E. et al.,
Multianalyte profiling of serum cytokines for detection of
pancreatic cancer. Cancer Biomark 2005, 1, 259–269.
[67] Miyoshi, E., Uozumi, N., Noda, K., Hayashi, N. et al.,
Expression of alpha1-6 fucosyltransferase in rat tissues and
human cancer cell lines. Int. J. Cancer 1997, 72, 1117–1121.
& 2010 WILEY-VCH Verlag GmbH & Co. KGaA, Weinheim www.clinical.proteomics-journal.com
Proteomics Clin. Appl. 2010, 4, 1–17 17
Related Documents