Gluskin Sheff + Associates Inc. Investing Past the Seventh-Inning Stretch David A. Rosenberg November 2017 Invested in your prosperity

Welcome message from author
This document is posted to help you gain knowledge. Please leave a comment to let me know what you think about it! Share it to your friends and learn new things together.
Transcript

Gluskin Sheff + Associates Inc.
Investing Past the Seventh-Inning Stretch
David A. Rosenberg
November 2017
Invested in your prosperity

Gluskin Sheff + Associates Inc.
Notes:
Source: New York Post (March 10, 2016) 1

Gluskin Sheff + Associates Inc.
2
“People who mix their politics up with
their investment activities, I don't think
that makes sense.”
“If you mix your politics with your
investment decisions, you're making a
big mistake.”
Warren Buffett, February 27, 2017
THE “ORACLE” OPINES: POLITICS AND MARKETS = OIL AND WATER

Gluskin Sheff + Associates Inc.
3
WHAT YOU SEE ISN’T ALWAYS WHAT YOU GET
Election NarrativeWhat Actually
Happened
Ronald Reagan (1980-88)Deregulation, small government,
tax cuts, defense spending
Recession in first two years,
massive deficits, S&P 500 down
25% (the good stuff happened
later)
George H.W. Bush (1988-92)Extend the Reagan era (nothing
more)
Proposed tax hikes, Recession
within two years, one-term
president
Bill Clinton (1992-2000)Health care reform, socialist from
Arkansas
Eight-year expansion, stock market
tripled, deregulation, welfare reform
George W. Bush (2000-08)Deregulation, fiscal conservatism,
isolationism
Tax cuts, public spending, Iraq war,
35% stock market plunge
Barack Obama (2008-16)Health care reform, Main Street
over Wall Street, socialist from
Illinois
Obamacare, bank bailouts,
weakest recovery ever, record
income inequality, S&P 500 tripled
Gluskin Sheff + Associates Inc.
4Notes:
Source: Bloomberg Businessweek (February 6, 2017)
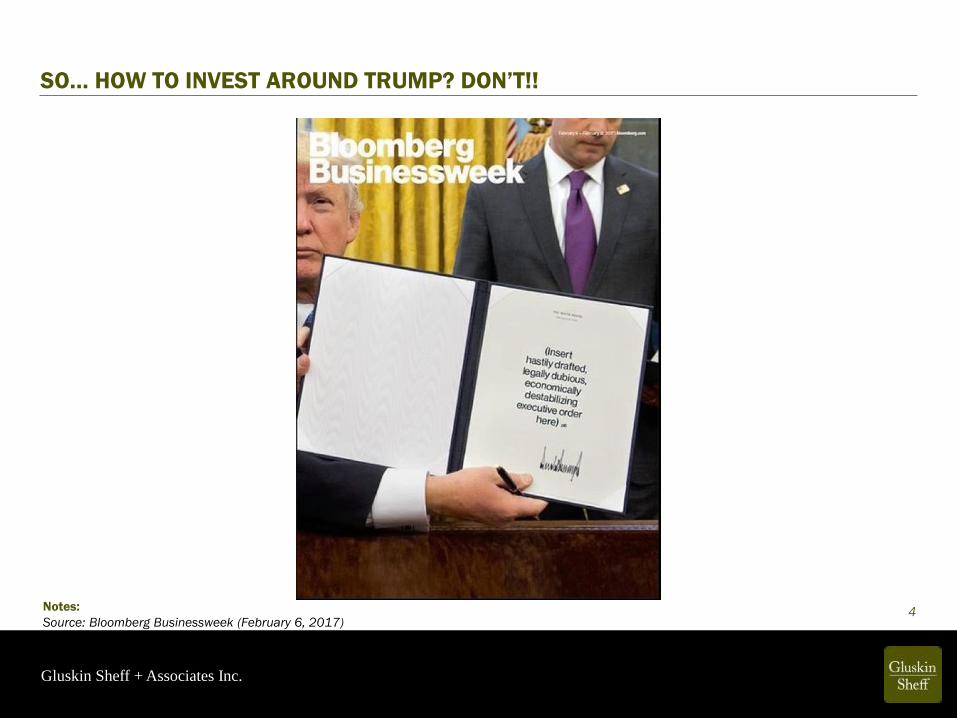
SO… HOW TO INVEST AROUND TRUMP? DON’T!!
Gluskin Sheff + Associates Inc.
5
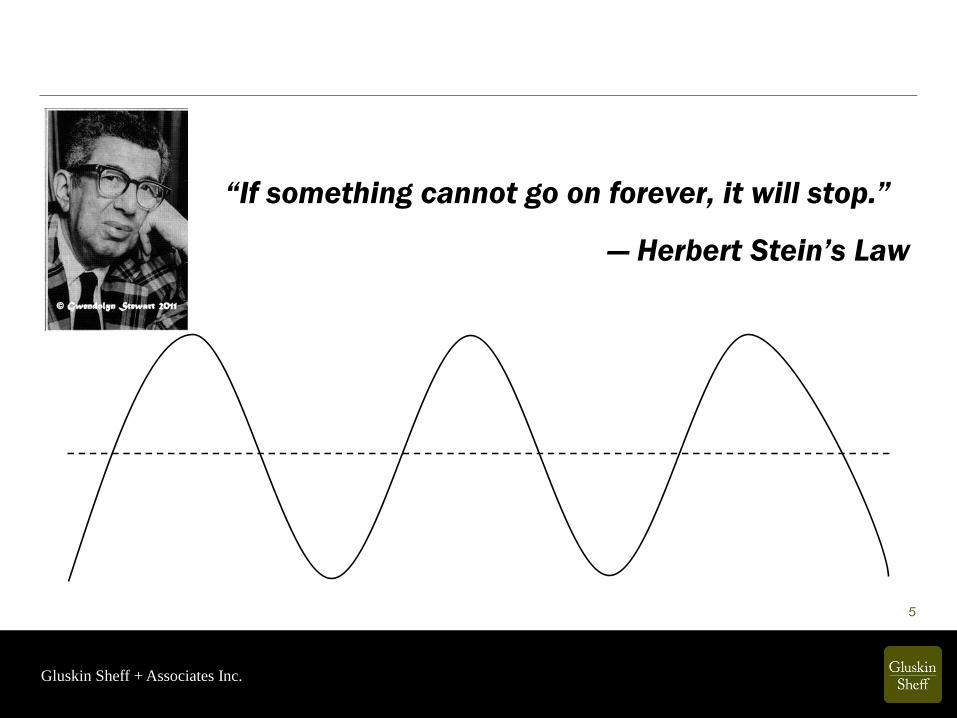
“If something cannot go on forever, it will stop.”
— Herbert Stein’s Law
Gluskin Sheff + Associates Inc.
(months)
6
Month of Economic Cycle Peak
Notes:
Source: National Bureau of Economic Research, Gluskin Sheff
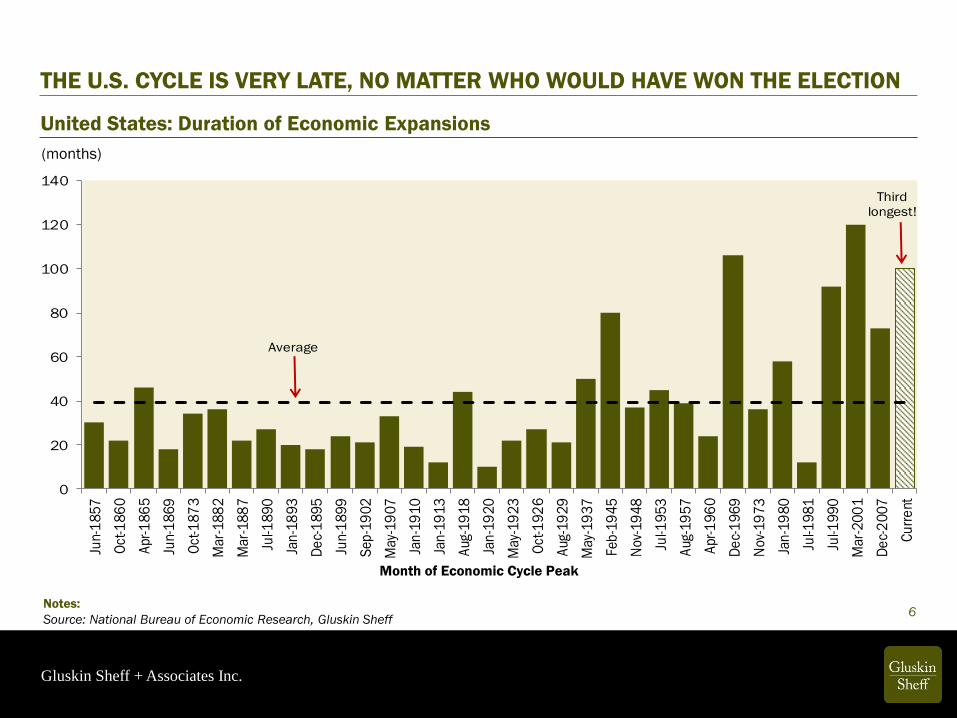
THE U.S. CYCLE IS VERY LATE, NO MATTER WHO WOULD HAVE WON THE ELECTION
United States: Duration of Economic Expansions
0
20
40
60
80
100
120
140
Jun
-18
57
Oct
-18
60
Ap
r-1
86
5
Jun
-18
69
Oct
-18
73
Ma
r-1
88
2
Ma
r-1
88
7
Jul-1
89
0
Jan
-18
93
De
c-1
89
5
Jun
-18
99
Sep
-19
02
Ma
y-1
90
7
Jan
-19
10
Jan
-19
13
Au
g-1
91
8
Jan
-19
20
Ma
y-1
92
3
Oct
-19
26
Au
g-1
92
9
Ma
y-1
93
7
Fe
b-1
94
5
No
v-1
94
8
Jul-1
95
3
Au
g-1
95
7
Apr
-19
60
De
c-1
96
9
No
v-1
97
3
Jan
-19
80
Jul-1
98
1
Jul-1
99
0
Ma
r-2
00
1
De
c-2
00
7
Cu
rre
nt
Third
longest!
Average

Gluskin Sheff + Associates Inc.
WHEN CONFIDENCE PEAKS — RECESSION A YEAR LATER!
United States: Consumer Confidence
(1985 = 100)
7
Notes:
Shaded regions represent periods of U.S. recession
Source: Haver Analytics, Gluskin Sheff
0
20
40
60
80
100
120
140
160
1967 1972 1977 1982 1987 1992 1997 2002 2007 2012 2017
peak
peakpeak
peak
peak
peak
peak
peak
Gluskin Sheff + Associates Inc.
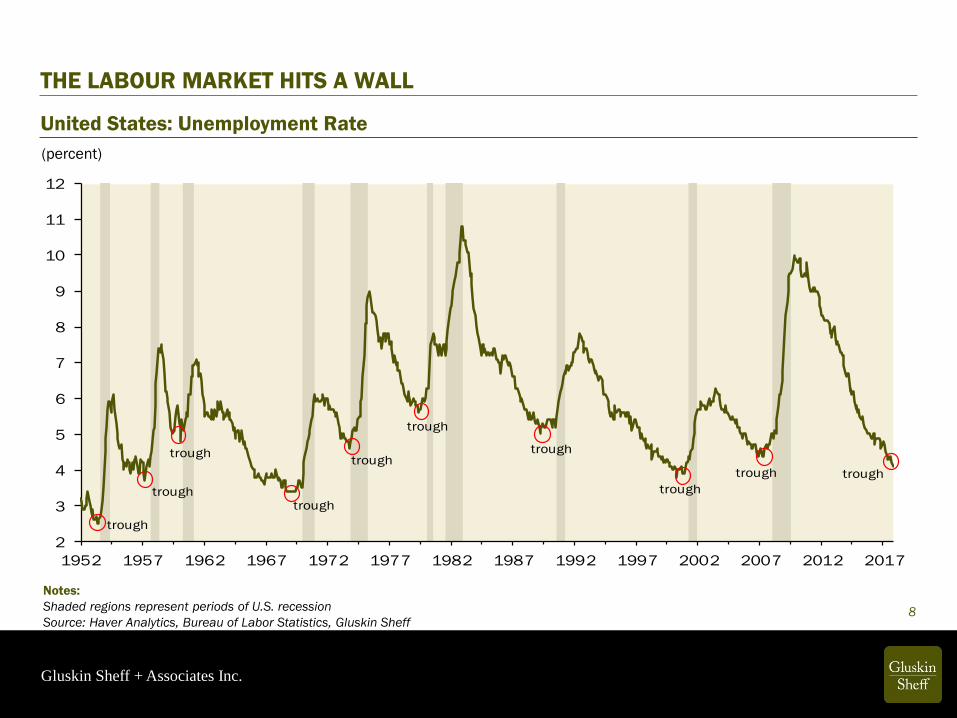
THE LABOUR MARKET HITS A WALL
United States: Unemployment Rate
(percent)
8
Notes:
Shaded regions represent periods of U.S. recession
Source: Haver Analytics, Bureau of Labor Statistics, Gluskin Sheff
2
3
4
5
6
7
8
9
10
11
12
1952 1957 1962 1967 1972 1977 1982 1987 1992 1997 2002 2007 2012 2017
trough
trough
trough
trough
trough
trough
trough
trough
trough trough
Gluskin Sheff + Associates Inc.
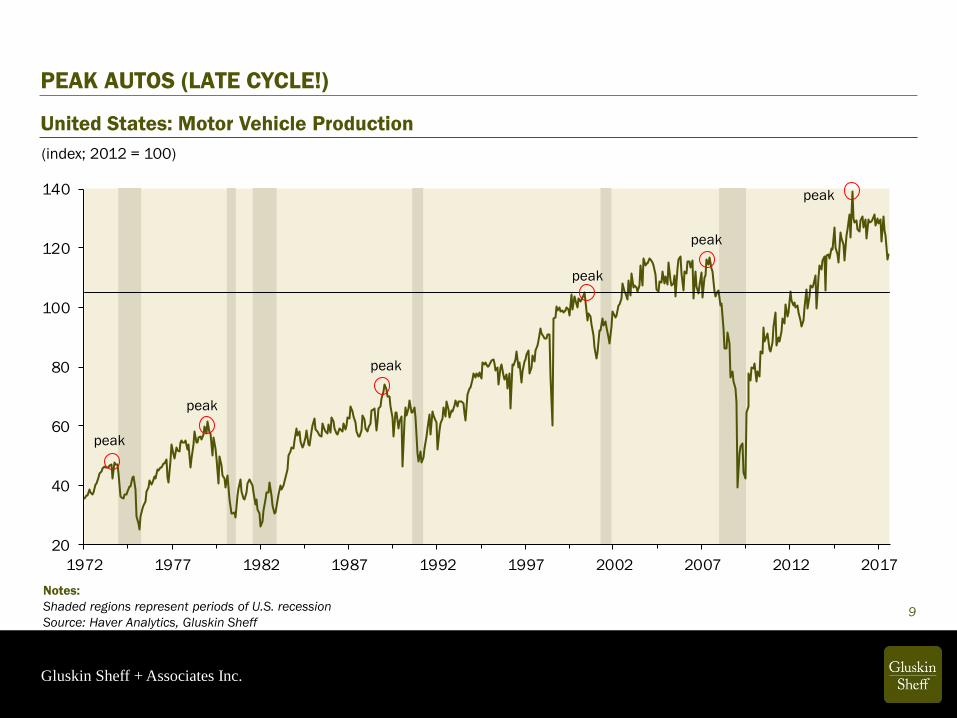
PEAK AUTOS (LATE CYCLE!)
United States: Motor Vehicle Production
(index; 2012 = 100)
9
Notes:
Shaded regions represent periods of U.S. recession
Source: Haver Analytics, Gluskin Sheff
20
40
60
80
100
120
140
1972 1977 1982 1987 1992 1997 2002 2007 2012 2017
peak
peak
peak
peak
peak
peak
Gluskin Sheff + Associates Inc.
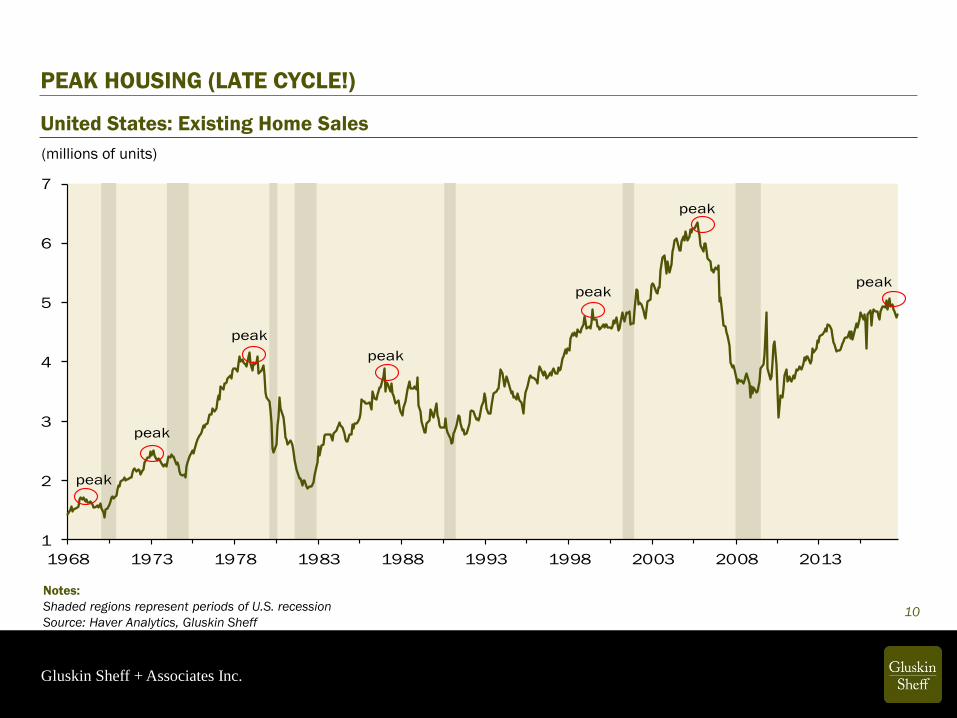
PEAK HOUSING (LATE CYCLE!)
United States: Existing Home Sales
(millions of units)
10
Notes:
Shaded regions represent periods of U.S. recession
Source: Haver Analytics, Gluskin Sheff
1
2
3
4
5
6
7
1968 1973 1978 1983 1988 1993 1998 2003 2008 2013
peak
peak
peak
peak
peak
peakpeak

Gluskin Sheff + Associates Inc.
PEAK VALUATIONS
11
Notes:
Shaded regions represent periods of U.S. recession
Source: Haver Analytics, Gluskin Sheff
(ratio)
5x
10x
15x
20x
25x
30x
35x
40x
45x
50x
1979 1984 1989 1994 1999 2004 2009 2014
peak
peak
peak
peak
peak
peak?
United States: Cyclically Adjusted P/E Multiple
Gluskin Sheff + Associates Inc.
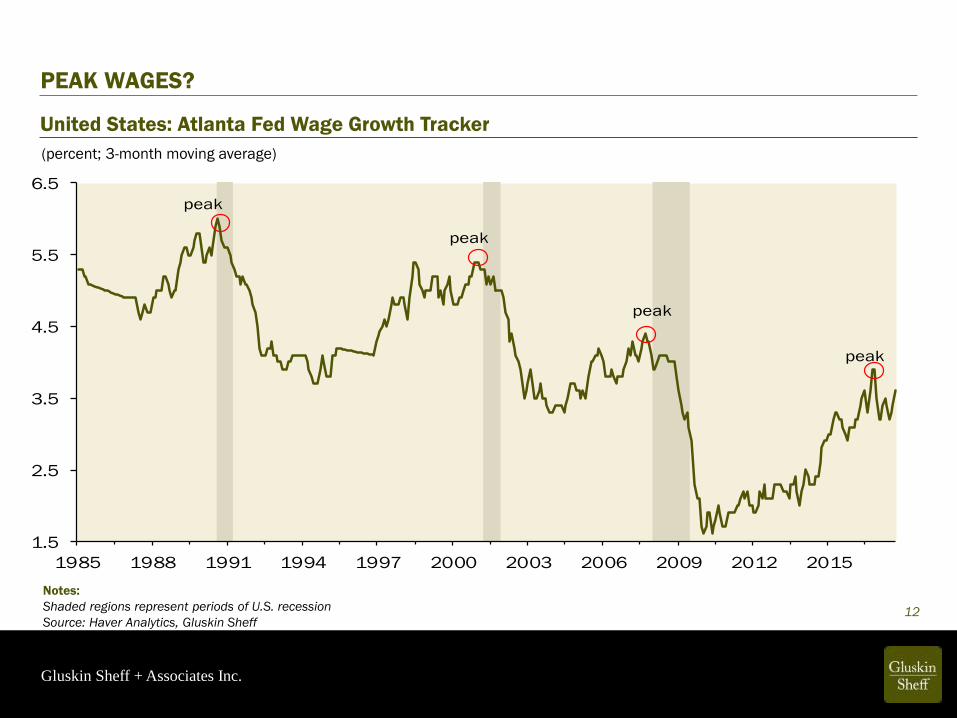
PEAK WAGES?
12
Notes:
Shaded regions represent periods of U.S. recession
Source: Haver Analytics, Gluskin Sheff
(percent; 3-month moving average)
United States: Atlanta Fed Wage Growth Tracker
1.5
2.5
3.5
4.5
5.5
6.5
1985 1988 1991 1994 1997 2000 2003 2006 2009 2012 2015
peak
peak
peak
peak
Gluskin Sheff + Associates Inc.
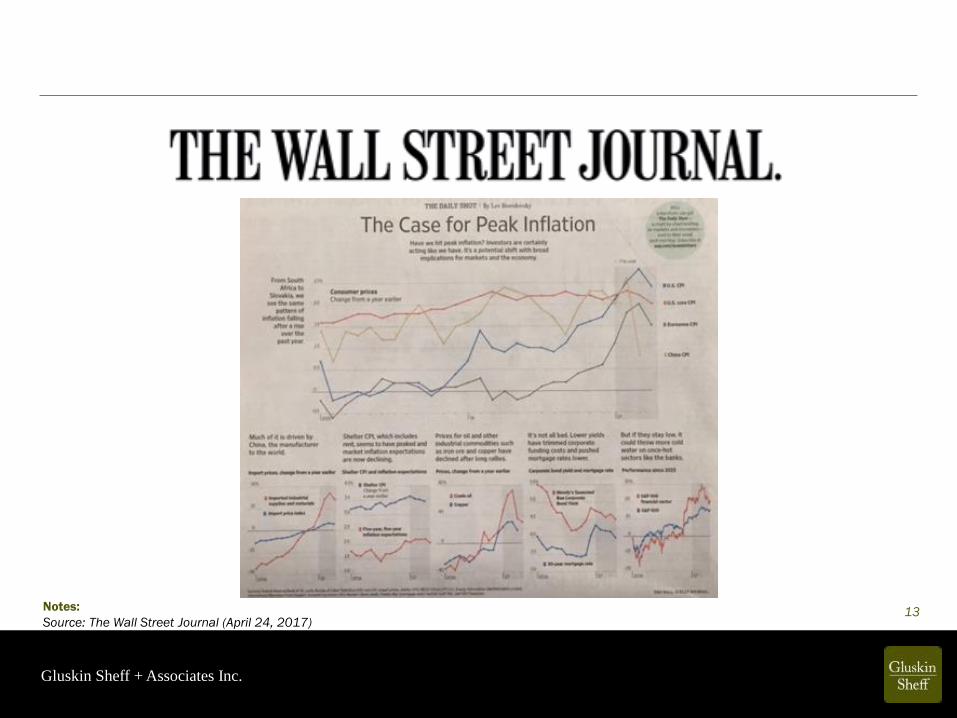
13Notes:
Source: The Wall Street Journal (April 24, 2017)
Gluskin Sheff + Associates Inc.
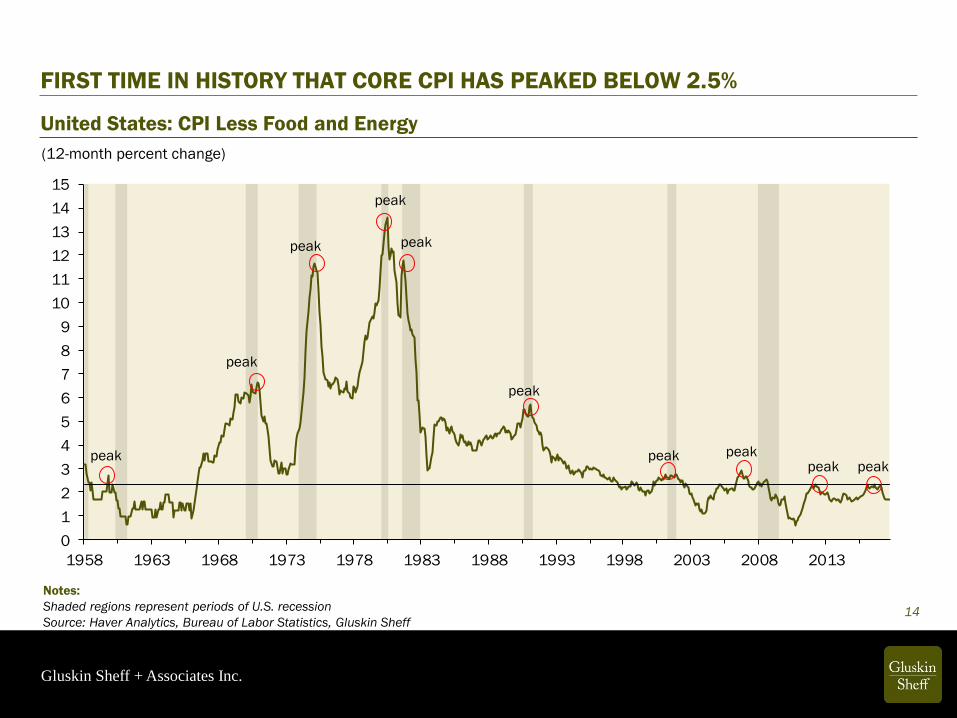
FIRST TIME IN HISTORY THAT CORE CPI HAS PEAKED BELOW 2.5%
United States: CPI Less Food and Energy
(12-month percent change)
14
Notes:
Shaded regions represent periods of U.S. recession
Source: Haver Analytics, Bureau of Labor Statistics, Gluskin Sheff
0
1
2
3
4
5
6
7
8
9
10
11
12
13
14
15
1958 1963 1968 1973 1978 1983 1988 1993 1998 2003 2008 2013
peak
peak
peak
peak peakpeak peak
peak
peak
peak
Gluskin Sheff + Associates Inc.
FED TIGHTENING CYCLES AND FINANCIAL EVENTS
15
Notes:
Shaded regions represent periods of U.S. recession
Source: Haver Analytics, Gluskin Sheff
(percent)
United States: Federal Funds Rate
-2
0
2
4
6
8
10
12
14
16
18
20
1965 1968 1971 1974 1977 1980 1983 1986 1989 1992 1995 1998 2001 2004 2007 2010 2013 2016
First Penn/Latam Debt
Crisis
Asian Crisis/Russian
Default & LTCM
U.S. Housing and
Credit Collapse
Orange
County/Mexican Crisis
Penn Central
Continental Illinois
Bankruptcy
Franklin National
Savings & Loan
Debacle
Lincoln Savings
Tech Wreck
Gluskin Sheff + Associates Inc.
16
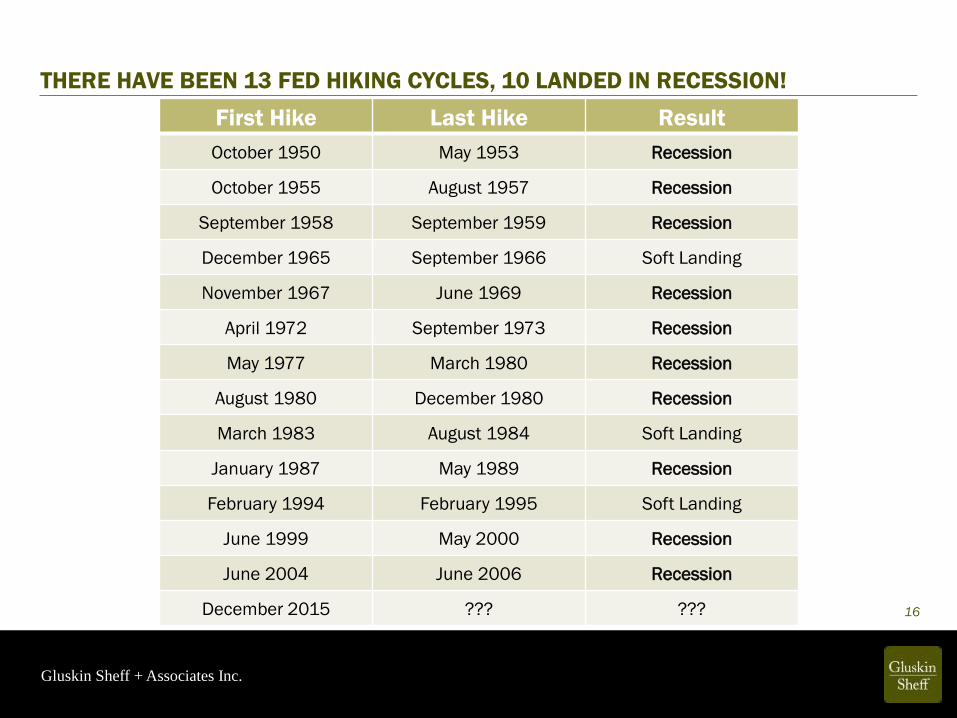
THERE HAVE BEEN 13 FED HIKING CYCLES, 10 LANDED IN RECESSION!
First Hike Last Hike Result
October 1950 May 1953 Recession
October 1955 August 1957 Recession
September 1958 September 1959 Recession
December 1965 September 1966 Soft Landing
November 1967 June 1969 Recession
April 1972 September 1973 Recession
May 1977 March 1980 Recession
August 1980 December 1980 Recession
March 1983 August 1984 Soft Landing
January 1987 May 1989 Recession
February 1994 February 1995 Soft Landing
June 1999 May 2000 Recession
June 2004 June 2006 Recession
December 2015 ??? ???
Gluskin Sheff + Associates Inc.
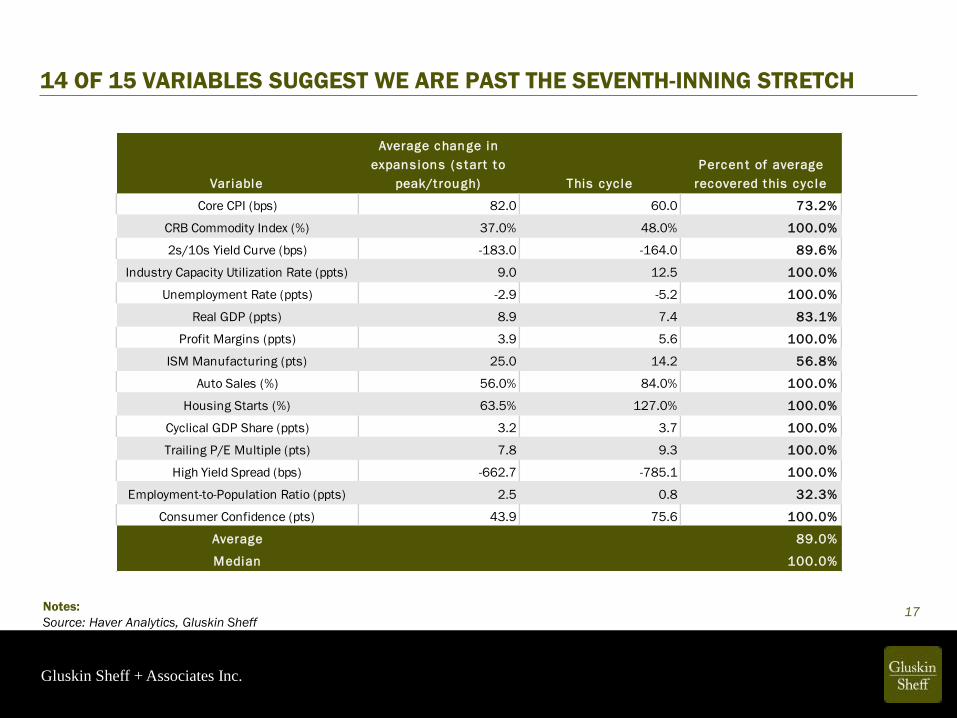
17Notes:
Source: Haver Analytics, Gluskin Sheff
Variable
Average change in
expans ions ( s tart to
peak/trough) This cyc le
Percent of average
recovered this cyc le
Core CPI (bps) 82.0 60.0 73.2%
CRB Commodity Index (%) 37.0% 48.0% 100.0%
2s/10s Yield Curve (bps) -183.0 -164.0 89.6%
Industry Capacity Utilization Rate (ppts) 9.0 12.5 100.0%
Unemployment Rate (ppts) -2.9 -5.2 100.0%
Real GDP (ppts) 8.9 7.4 83.1%
Profit Margins (ppts) 3.9 5.6 100.0%
ISM Manufacturing (pts) 25.0 14.2 56.8%
Auto Sales (%) 56.0% 84.0% 100.0%
Housing Starts (%) 63.5% 127.0% 100.0%
Cyclical GDP Share (ppts) 3.2 3.7 100.0%
Trailing P/E Multiple (pts) 7.8 9.3 100.0%
High Yield Spread (bps) -662.7 -785.1 100.0%
Employment-to-Population Ratio (ppts) 2.5 0.8 32.3%
Consumer Confidence (pts) 43.9 75.6 100.0%
Average 89.0%
Median 100.0%
14 OF 15 VARIABLES SUGGEST WE ARE PAST THE SEVENTH-INNING STRETCH
Gluskin Sheff + Associates Inc.
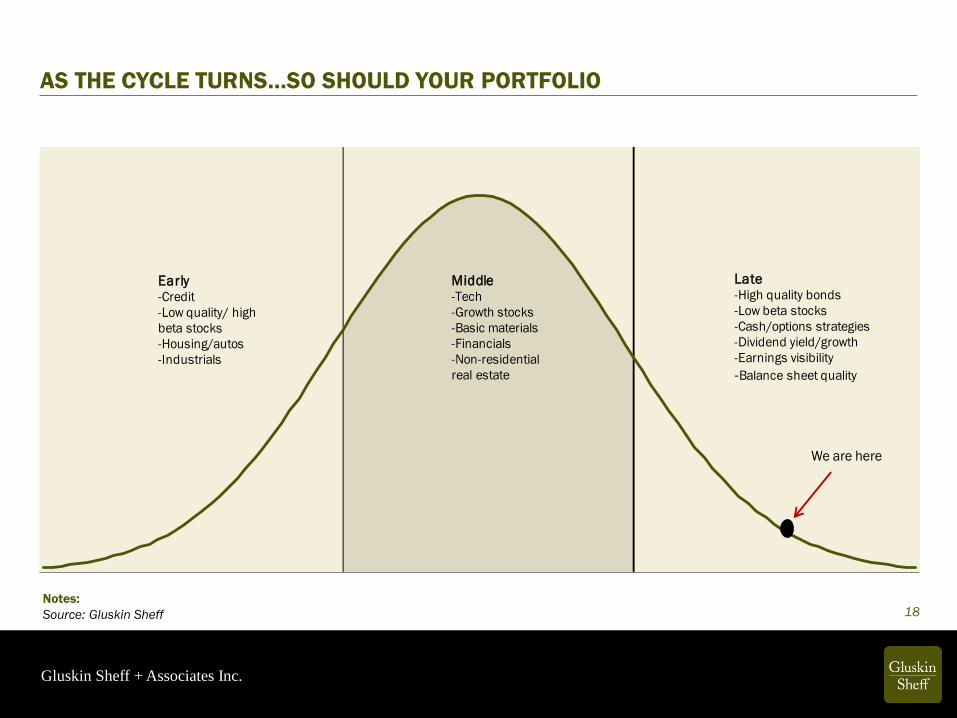
AS THE CYCLE TURNS…SO SHOULD YOUR PORTFOLIO
18
We are here
Early-Credit
-Low quality/ high
beta stocks
-Housing/autos
-Industrials
Middle-Tech
-Growth stocks
-Basic materials
-Financials
-Non-residential
real estate
Late-High quality bonds
-Low beta stocks
-Cash/options strategies
-Dividend yield/growth
-Earnings visibility
-Balance sheet quality
Notes:
Source: Gluskin Sheff

Gluskin Sheff + Associates Inc.
19
IT’S A BIG WORLD OUT THERE
Gluskin Sheff + Associates Inc.
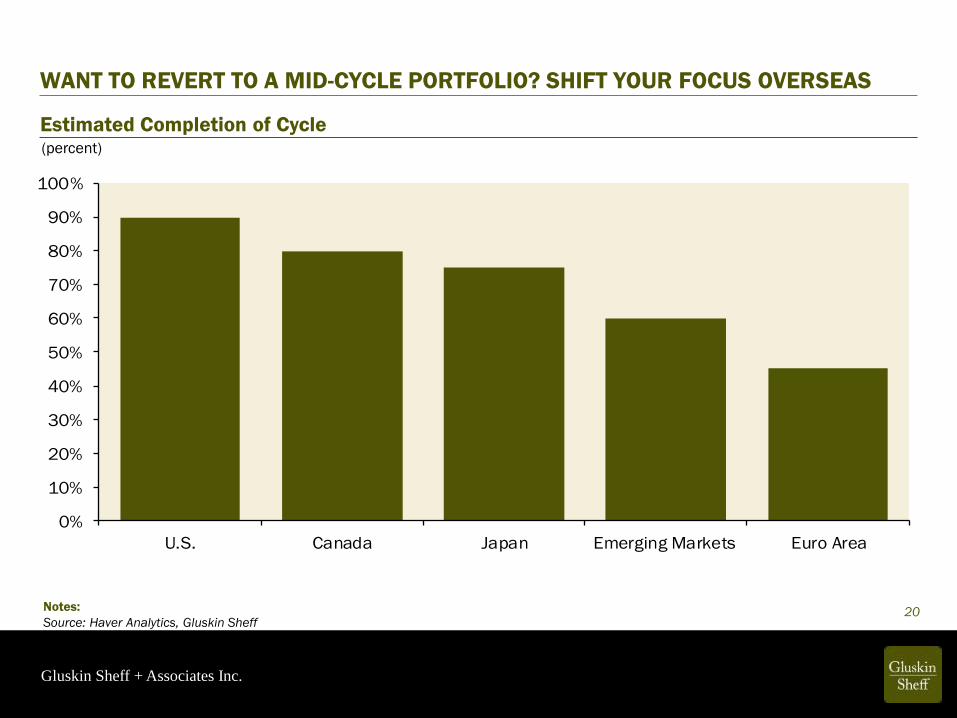
WANT TO REVERT TO A MID-CYCLE PORTFOLIO? SHIFT YOUR FOCUS OVERSEAS
Estimated Completion of Cycle
20Notes:
Source: Haver Analytics, Gluskin Sheff
(percent)
0%
10%
20%
30%
40%
50%
60%
70%
80%
90%
100%
U.S. Canada Japan Emerging Markets Euro Area
Gluskin Sheff + Associates Inc.
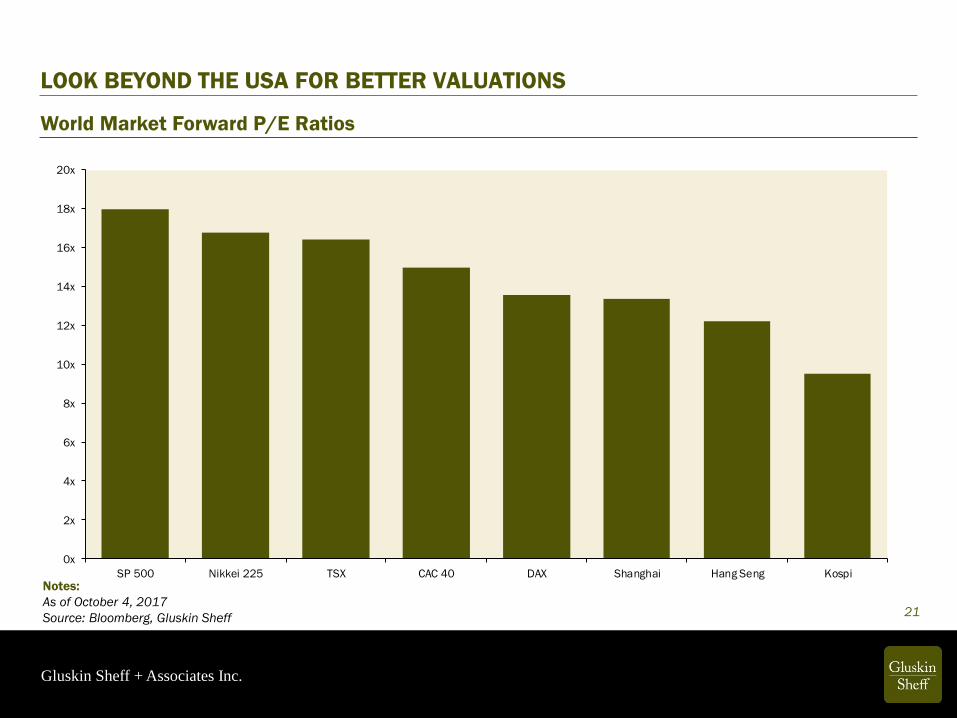
0x
2x
4x
6x
8x
10x
12x
14x
16x
18x
20x
SP 500 Nikkei 225 TSX CAC 40 DAX Shanghai Hang Seng Kospi
LOOK BEYOND THE USA FOR BETTER VALUATIONS
World Market Forward P/E Ratios
21
Notes:
As of October 4, 2017
Source: Bloomberg, Gluskin Sheff
Gluskin Sheff + Associates Inc.
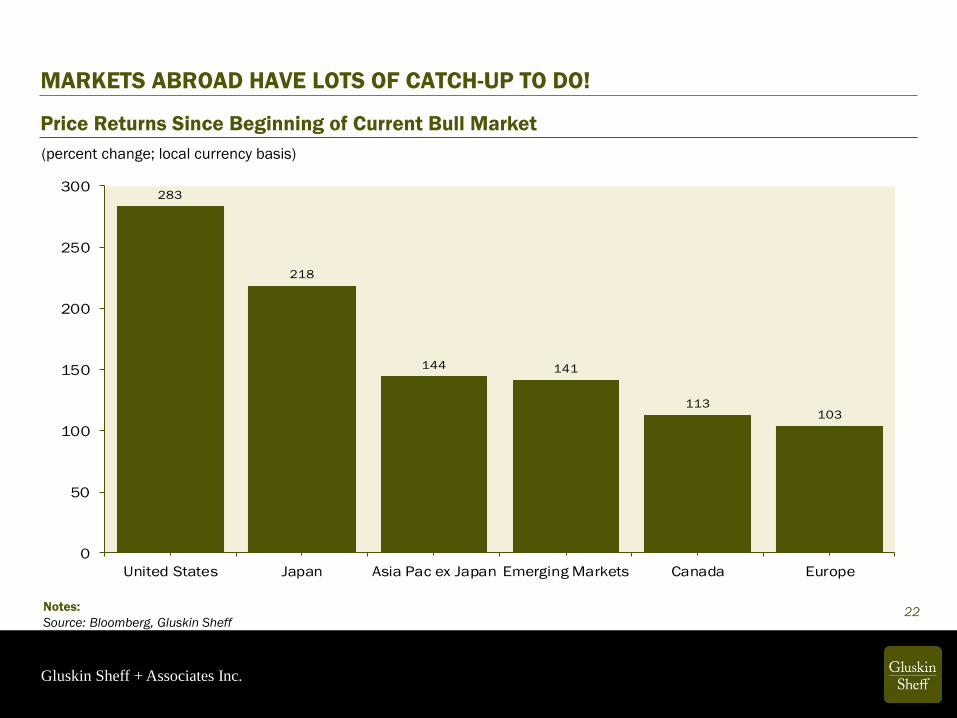
MARKETS ABROAD HAVE LOTS OF CATCH-UP TO DO!
Price Returns Since Beginning of Current Bull Market
(percent change; local currency basis)
22Notes:
Source: Bloomberg, Gluskin Sheff
283
218
144 141
113103
0
50
100
150
200
250
300
United States Japan Asia Pac ex Japan Emerging Markets Canada Europe

Gluskin Sheff + Associates Inc.
Notes:
Source: The Economist (June, 2017)23
Gluskin Sheff + Associates Inc.
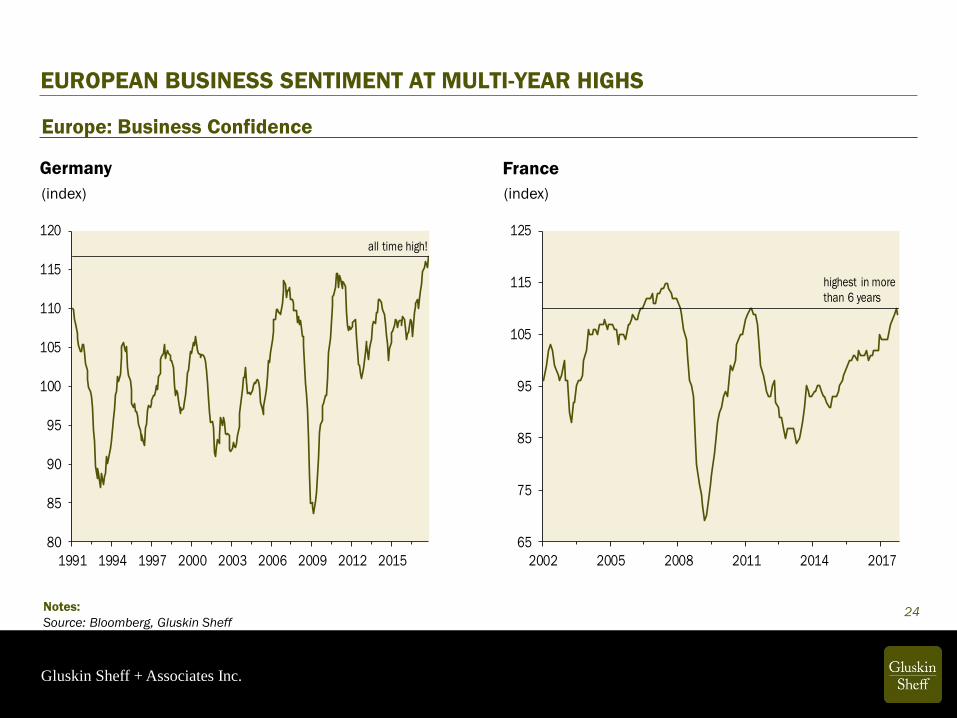
24
Europe: Business Confidence
(index) (index)
Germany France
EUROPEAN BUSINESS SENTIMENT AT MULTI-YEAR HIGHS
Notes:
Source: Bloomberg, Gluskin Sheff
80
85
90
95
100
105
110
115
120
1991 1994 1997 2000 2003 2006 2009 2012 2015
all time high!
65
75
85
95
105
115
125
2002 2005 2008 2011 2014 2017
highest in more
than 6 years

Gluskin Sheff + Associates Inc.
25
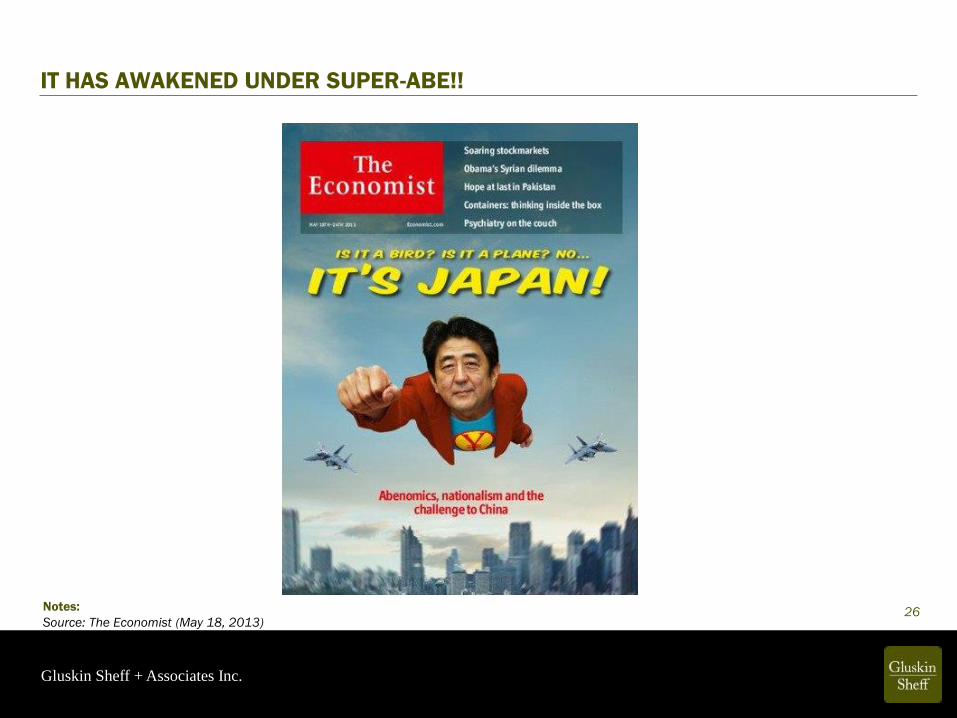
JAPAN…WAS ASLEEP FOR A LONG TIME!
Gluskin Sheff + Associates Inc.
26Notes:
Source: The Economist (May 18, 2013)
IT HAS AWAKENED UNDER SUPER-ABE!!
Gluskin Sheff + Associates Inc.
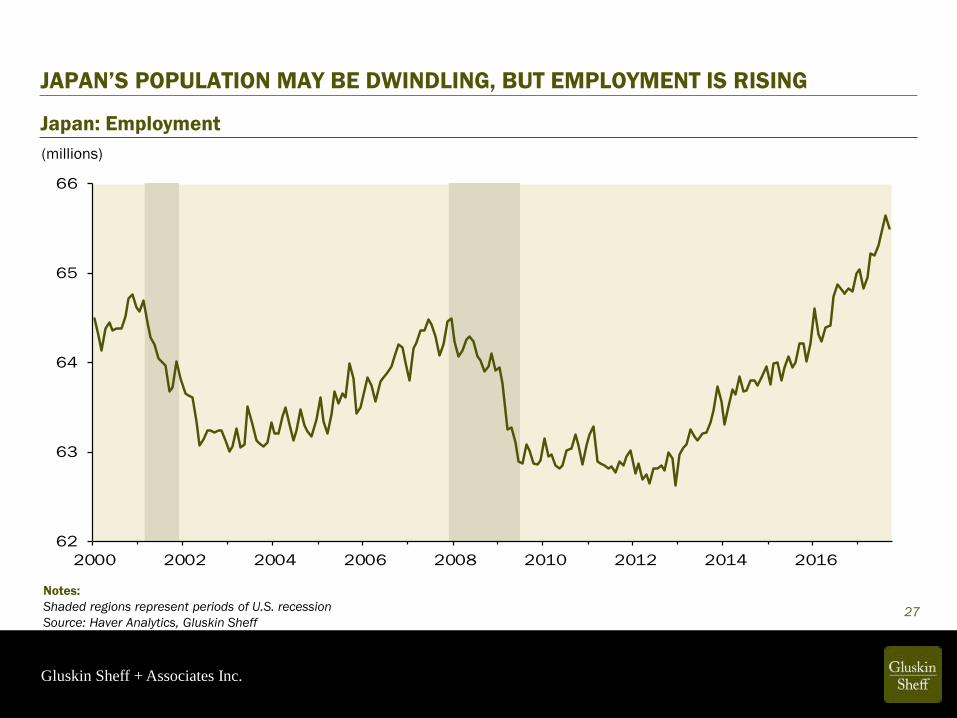
Japan: Employment
(millions)
27
Notes:
Shaded regions represent periods of U.S. recession
Source: Haver Analytics, Gluskin Sheff
JAPAN’S POPULATION MAY BE DWINDLING, BUT EMPLOYMENT IS RISING
62
63
64
65
66
2000 2002 2004 2006 2008 2010 2012 2014 2016
Gluskin Sheff + Associates Inc.
Notes:
Source: The Economist (Week of November 18, 2017)28

Gluskin Sheff + Associates Inc.
TABOOS BEING BROKEN!
29Notes:
Source: International Labour Organization, Gluskin Sheff
(percent)
Japan: Female Labour Force Participation Rate
48.0
48.5
49.0
49.5
50.0
50.5
51.0
1990 1995 2000 2005 2010 2015
Abe assumes
office
Gluskin Sheff + Associates Inc.
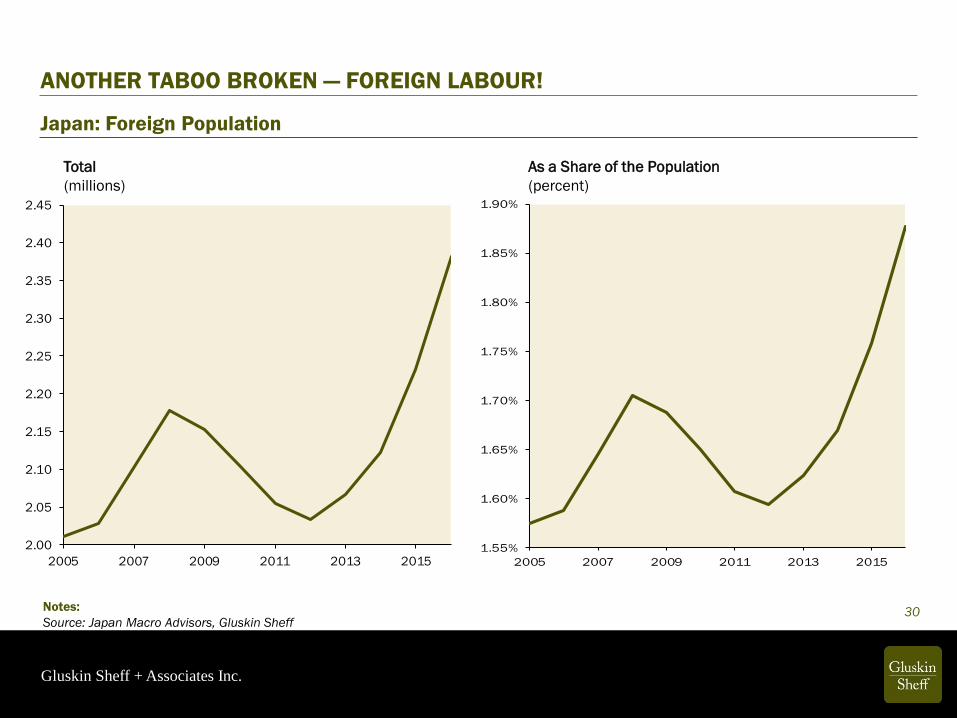
30Notes:
Source: Japan Macro Advisors, Gluskin Sheff
Japan: Foreign Population
2.00
2.05
2.10
2.15
2.20
2.25
2.30
2.35
2.40
2.45
2005 2007 2009 2011 2013 20151.55%
1.60%
1.65%
1.70%
1.75%
1.80%
1.85%
1.90%
2005 2007 2009 2011 2013 2015
Total As a Share of the Population
ANOTHER TABOO BROKEN — FOREIGN LABOUR!
(millions) (percent)
Gluskin Sheff + Associates Inc.
31
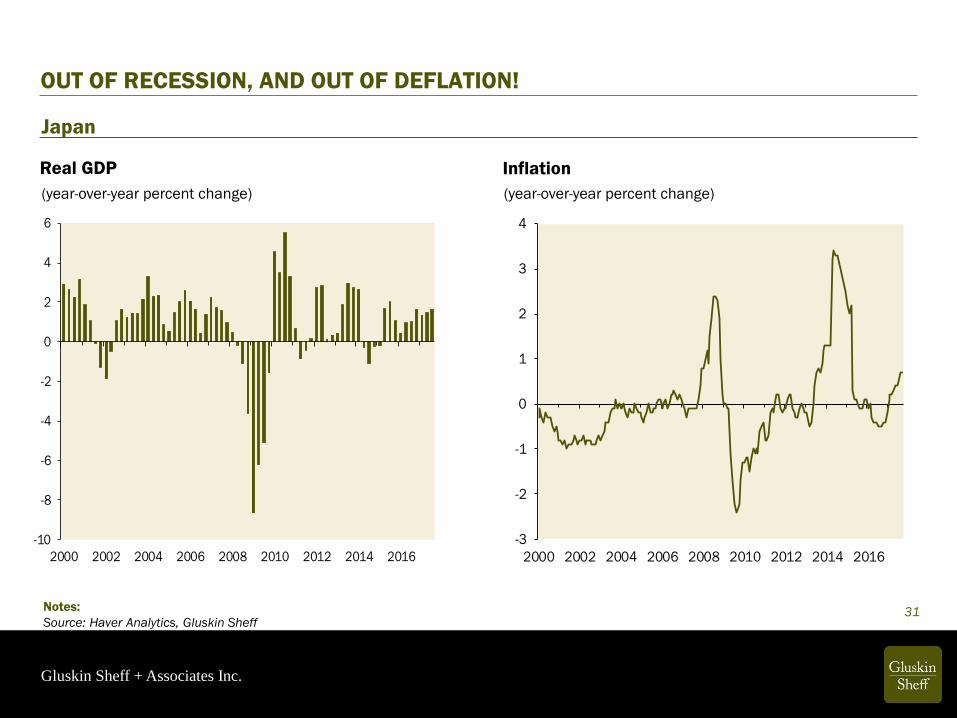
Japan
(year-over-year percent change) (year-over-year percent change)
Real GDP Inflation
OUT OF RECESSION, AND OUT OF DEFLATION!
Notes:
Source: Haver Analytics, Gluskin Sheff
-10
-8
-6
-4
-2
0
2
4
6
2000 2002 2004 2006 2008 2010 2012 2014 2016
-3
-2
-1
0
1
2
3
4
2000 2002 2004 2006 2008 2010 2012 2014 2016
Gluskin Sheff + Associates Inc.
32
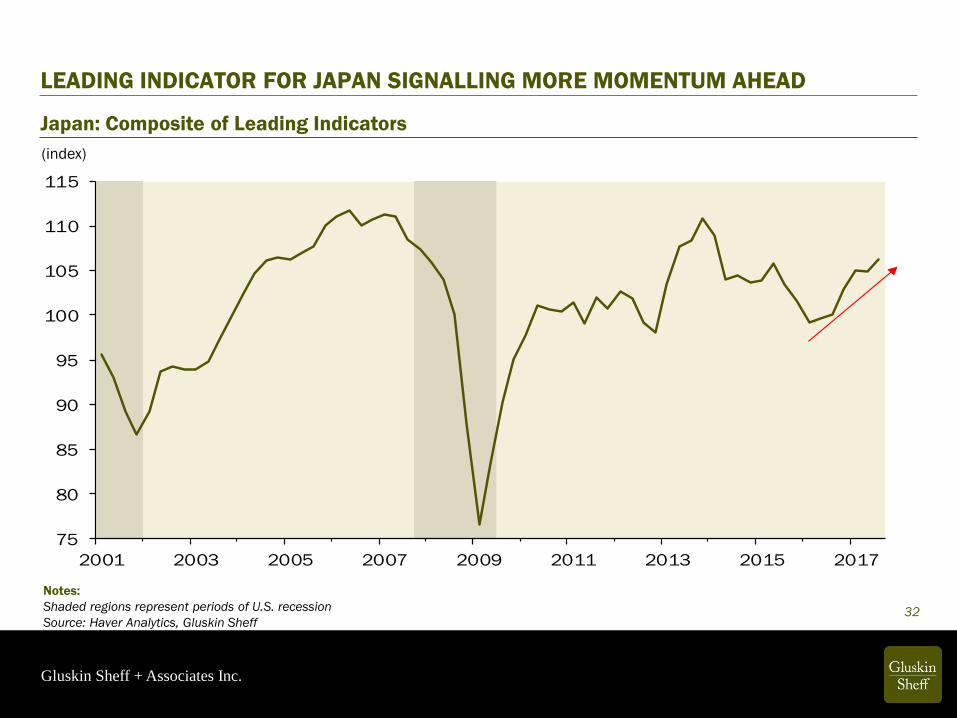
LEADING INDICATOR FOR JAPAN SIGNALLING MORE MOMENTUM AHEAD
Notes:
Shaded regions represent periods of U.S. recession
Source: Haver Analytics, Gluskin Sheff
Japan: Composite of Leading Indicators
75
80
85
90
95
100
105
110
115
2001 2003 2005 2007 2009 2011 2013 2015 2017
(index)
Gluskin Sheff + Associates Inc.
Notes:
Source: The Globe & Mail (November 3, 2017)33
Gluskin Sheff + Associates Inc.
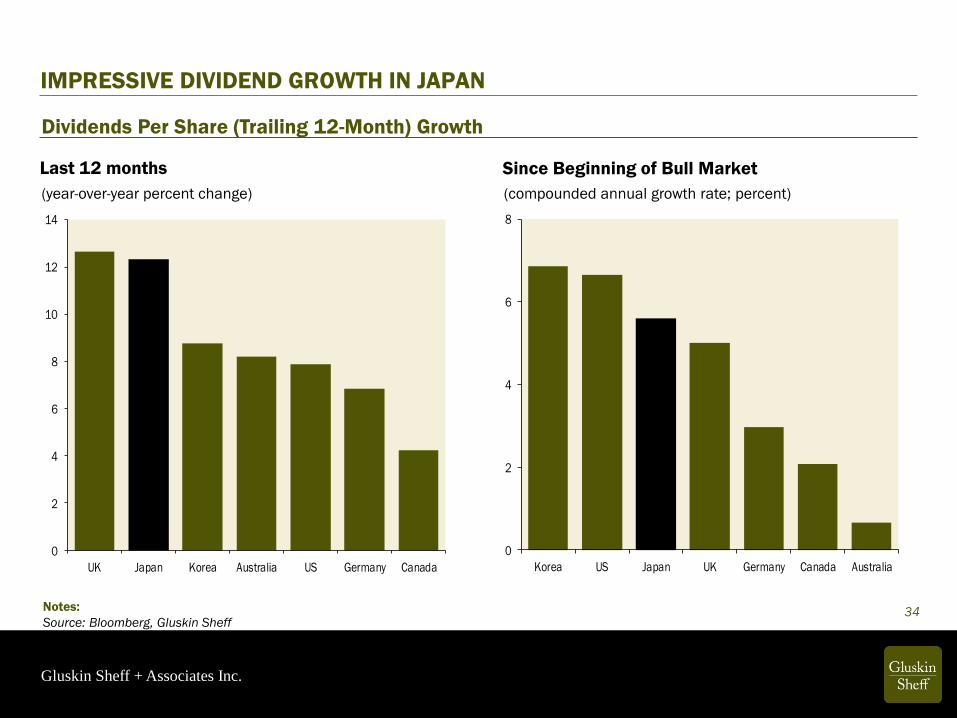
34Notes:
Source: Bloomberg, Gluskin Sheff
Dividends Per Share (Trailing 12-Month) Growth
(year-over-year percent change)
0
2
4
6
8
10
12
14
UK Japan Korea Australia US Germany Canada
0
2
4
6
8
Korea US Japan UK Germany Canada Australia
(compounded annual growth rate; percent)
Last 12 months Since Beginning of Bull Market
IMPRESSIVE DIVIDEND GROWTH IN JAPAN

Gluskin Sheff + Associates Inc.
35Notes:
Source: CLSA, Bloomberg, Gluskin Sheff
Current Year Expected Dividend Payout Ratios
17%
29%31%
39% 39%41%
50%53%
63%
0%
10%
20%
30%
40%
50%
60%
70%
Korea Japan India US Germany Hong Kong France Italy UK
AND BETTER DIVIDEND GROWTH PROSPECTS AS WELL
(percent)
Gluskin Sheff + Associates Inc.
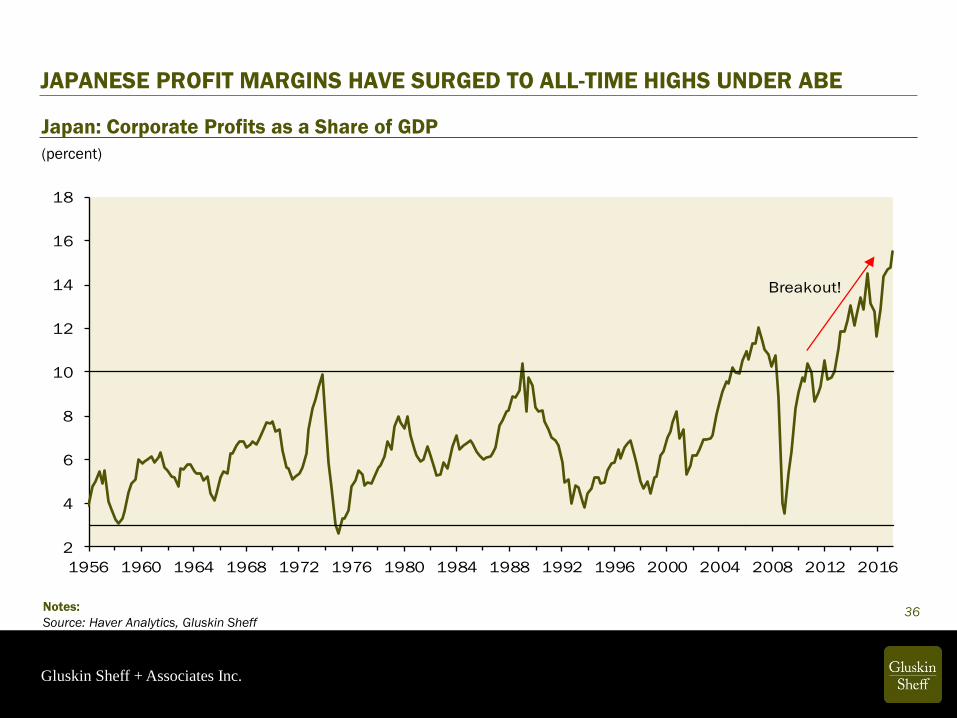
36Notes:
Source: Haver Analytics, Gluskin Sheff
(percent)
Japan: Corporate Profits as a Share of GDP
2
4
6
8
10
12
14
16
18
1956 1960 1964 1968 1972 1976 1980 1984 1988 1992 1996 2000 2004 2008 2012 2016
Breakout!
JAPANESE PROFIT MARGINS HAVE SURGED TO ALL-TIME HIGHS UNDER ABE
Gluskin Sheff + Associates Inc.
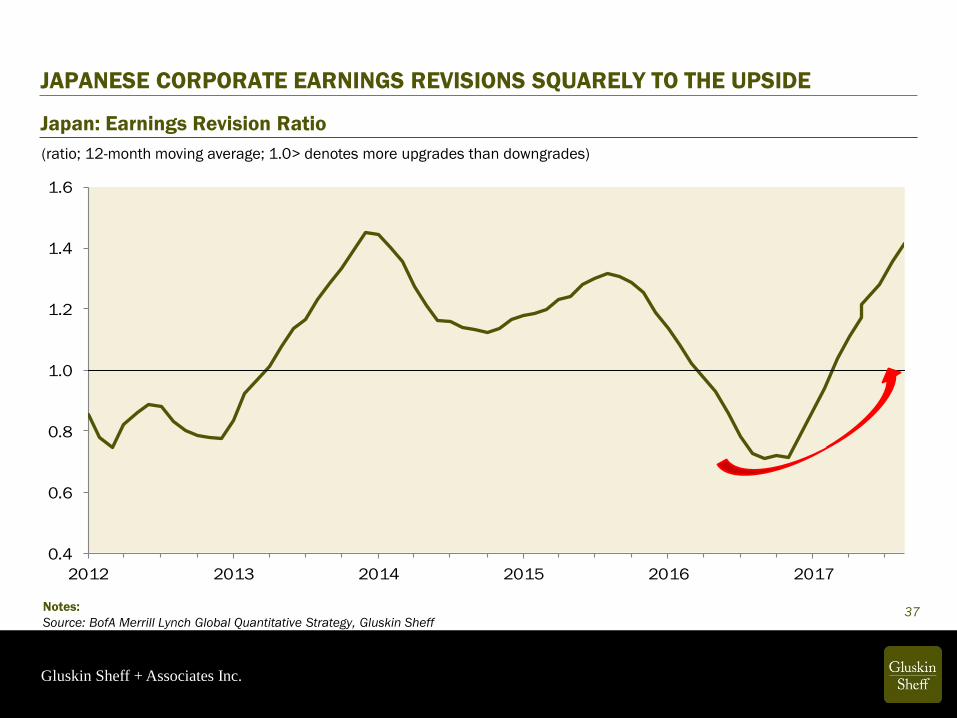
JAPANESE CORPORATE EARNINGS REVISIONS SQUARELY TO THE UPSIDE
37Notes:
Source: BofA Merrill Lynch Global Quantitative Strategy, Gluskin Sheff
Japan: Earnings Revision Ratio
0.4
0.6
0.8
1.0
1.2
1.4
1.6
2012 2013 2014 2015 2016 2017
(ratio; 12-month moving average; 1.0> denotes more upgrades than downgrades)

Gluskin Sheff + Associates Inc.
WHAT A DIFFERENCE A YEAR MAKES
38Notes:
Source: BofA Merrill Lynch Global Quantitative Strategy, Gluskin Sheff
World: 3-Month Earnings Revision Ratio
Today
0.6
0.7
0.8
0.9
1.0
1.1
1.2
1.3
1.4
1.5
1.6
Japan USA World Asia Pac ex.
Japan
Emerging
Markets
Europe
0.4
0.5
0.6
0.7
0.8
0.9
1.0
USA Europe Emerging
Markets
World Asia Pac ex.
Japan
Japan
One Year Ago
(ratio; 1.0> denotes more upgrades than downgrades)

Gluskin Sheff + Associates Inc.
39Notes:
Source: Haver Analytics, Gluskin Sheff
(index)
Japan: Nikkei 225
5000
10000
15000
20000
25000
30000
35000
40000
1988 1990 1992 1994 1996 1998 2000 2002 2004 2006 2008 2010 2012 2014 2016
S&P 500 was 700
JAPANESE EQUITIES ARE BREAKING OUT

Gluskin Sheff + Associates Inc.
40Notes:
Source: Bloomberg, Gluskin Sheff
Japan: Market Cap Share of Total
(percent share)
6
7
8
9
10
11
12
13
2003 2004 2005 2006 2007 2008 2009 2010 2011 2012 2013 2014 2015 2016 2017
average
IF YOU BELIEVE IN MEAN REVERSION, THIS IS THE MARKET TO BE IN

Gluskin Sheff + Associates Inc.
41Notes:
Source: National Post (November 3, 2017)
Gluskin Sheff + Associates Inc.
DISCLAIMER
The information, opinions, and other materials contained in this presentation is the
property of Gluskin Sheff + Associates Inc. and may not be reproduced in any way, in
whole or in part, without express authorization of the copyright holder in writing. The
statements and statistics contained herein have been prepared by Gluskin Sheff +
Associates Inc. based on information from sources considered to be reliable. We make
no representation or warranty, express or implied, as to its accuracy or completeness.
This publication is for the information of investors and business persons and does not
constitute an offer to sell or a solicitation to buy securities.
42
Related Documents

![^F mF n PoY[K v v h [ ! 5 V ^ [ Znoja/f.pdf · 9 2 X (9 < 5o =9 X ?> 1 @ BA & l X! G ? ? C: 9 9ED F: HG X G X G I !( "9 $ ! vj J $ q 9 5 j 9 & " jm K' Io"1] y. KL ` 6AM: 9 9ONQP](https://static.cupdf.com/doc/110x72/5ec40ffd9579f031121de05d/f-mf-n-poyk-v-v-h-5-v-z-nojafpdf-9-2-x-9-5o-9-x-1-ba.jpg)
![TI - unican.es · (IV) {isc1.m}:x [ n ]=!∞ k = −∞ x [ k ] δ [n − k ] ≡!∞ k = −∞ p k [n ]. p k [n ] ada x [k ] instante k. a p k [ n ] es v k [n ]= x [k ] h[n −](https://static.cupdf.com/doc/110x72/5e89c15993604a6d474be7b4/ti-iv-isc1mx-n-a-k-aa-x-k-n-a-k-aa-k-aa.jpg)