Glucose Transporter Expression in an Avian Nectarivore: The Ruby-Throated Hummingbird (Archilochus colubris) Kenneth C. Welch, Jr.*, Amina Allalou, Prateek Sehgal, Jason Cheng, Aarthi Ashok Department of Biological Sciences, University of Toronto Scarborough, Toronto, Ontario, Canada Abstract Glucose transporter (GLUT) proteins play a key role in the transport of monosaccharides across cellular membranes, and thus, blood sugar regulation and tissue metabolism. Patterns of GLUT expression, including the insulin-responsive GLUT4, have been well characterized in mammals. However, relatively little is known about patterns of GLUT expression in birds with existing data limited to the granivorous or herbivorous chicken, duck and sparrow. The smallest avian taxa, hummingbirds, exhibit some of the highest fasted and fed blood glucose levels and display an unusual ability to switch rapidly and completely between endogenous fat and exogenous sugar to fuel energetically expensive hovering flight. Despite this, nothing is known about the GLUT transporters that enable observed rapid rates of carbohydrate flux. We examined GLUT (GLUT1, 2, 3, & 4) expression in pectoralis, leg muscle, heart, liver, kidney, intestine and brain from both zebra finches (Taeniopygia guttata) and ruby-throated hummingbirds (Archilochus colubris). mRNA expression of all four transporters was probed using reverse-transcription PCR (RT-PCR). In addition, GLUT1 and 4 protein expression were assayed by western blot and immunostaining. Patterns of RNA and protein expression of GLUT1-3 in both species agree closely with published reports from other birds and mammals. As in other birds, and unlike in mammals, we did not detect GLUT4. A lack of GLUT4 correlates with hyperglycemia and an uncoupling of exercise intensity and relative oxidation of carbohydrates in hummingbirds. The function of GLUTs present in hummingbird muscle tissue (e.g. GLUT1 and 3) remain undescribed. Thus, further work is necessary to determine if high capillary density, and thus surface area across which cellular-mediated transport of sugars into active tissues (e.g. muscle) occurs, rather than taxon-specific differences in GLUT density or kinetics, can account for observed rapid rates of sugar flux into these tissues. Citation: Welch KC Jr, Allalou A, Sehgal P, Cheng J, Ashok A (2013) Glucose Transporter Expression in an Avian Nectarivore: The Ruby-Throated Hummingbird (Archilochus colubris). PLoS ONE 8(10): e77003. doi:10.1371/journal.pone.0077003 Editor: Makoto Kanzaki, Tohoku University, Japan Received June 20, 2013; Accepted August 26, 2013; Published October 14, 2013 Copyright: ß 2013 Welch et al. This is an open-access article distributed under the terms of the Creative Commons Attribution License, which permits unrestricted use, distribution, and reproduction in any medium, provided the original author and source are credited. Funding: This study was supported by Natural Sciences and Engineering Research Council (NSERC) of Canada Discovery Grant #386466 (http://www.nserc- crsng.gc.ca/index_eng.asp), Canada Foundation for Innovation – Leaders Opportunity Fund (CFI-LOF) grant #25326 (http://www.innovation.ca/), and Ontario Research Fund – Research Infrastructure Program (ORF-RIP) grant #25326 (http://www.ontario.ca/business-and-economy/ontario-research-fund) to KCW. The funders had no role in study design, data collection and analysis, decision to publish, or preparation of the manuscript. Competing Interests: The authors have declared that no competing interests exist. * E-mail: [email protected] Introduction While hovering at flowers, feeding on sugar-rich nectar, hummingbirds sustain some of the highest aerobic metabolic rates observed among vertebrates [1]. Remarkably, hummingbirds can fuel energetically expensive hovering flight with either endogenous lipids when fasted or with recently ingested sugars when foraging, completely switching between fuel sources over the course of only 30–40 minutes [2–4]. Tracking of carbon from ingested nectars with distinct isotopic signatures in expired CO 2 indicates extremely rapid turnover within the pool of actively metabolized substrates [2,3]. This rapid flux of sugar from floral nectar to working flight muscles in hummingbirds (and other nectarivorous vertebrates) where it is oxidized, termed the ‘sugar oxidation cascade’ [5], involves the concerted upregulation of sugar transport through the cardiovascular system and across multiple tissue barriers (e.g. intestinal wall, capillary endothelial and muscle fiber membranes). Capacities for the assimilation and absorption of sugar in the gut are enhanced by very high maximal rates of sucrase activity in the hummingbird intestine [6], and high rates of both active and passive sugar movement across the intestinal wall [7,8]. However, mechanisms governing the flux of sugars from the cardiovascular system to metabolically active tissues is poorly understood in birds generally, and hummingbirds in particular. The transport of hydrophilic sugar molecules across cell membranes occurs through one of several related facultative transporters comprising the GLUT family of proteins. While 14 members of the GLUT transporter family have thus far been described in mammals [9], the first four to be described, GLUT proteins 1–4 (class I), remain the best characterized [10]. GLUT1 is expressed in almost every tissue in mammals and is thought to provide basal levels of glucose transport [10,11]. While GLUT3 mRNA is found in most mammalian tissues, protein expression is generally limited to the brain, testes, and skeletal muscle [12,13]. GLUT2 and 4 play key roles in the hormonal and activity-induced regulation of blood sugar level and uptake rate into tissues [11,14,15]. GLUT2 is a key element of the peripheral glucose sensing system [10,15]. Its expression in mammals is generally limited to tissues with important roles in whole organism energy homeostasis, such as the liver, kidneys, pancreas and intestine [10,11]. In mammals, increased binding of glucose to GLUT2 following a rise in blood sugar activates pathways promoting insulin release by pancreatic b-cells [10]. GLUT4 expression is limited to skeletal muscle, heart, and adipose tissues [10,16]. PLOS ONE | www.plosone.org 1 October 2013 | Volume 8 | Issue 10 | e77003

Welcome message from author
This document is posted to help you gain knowledge. Please leave a comment to let me know what you think about it! Share it to your friends and learn new things together.
Transcript
Glucose Transporter Expression in an Avian Nectarivore:The Ruby-Throated Hummingbird (Archilochus colubris)Kenneth C. Welch, Jr.*, Amina Allalou, Prateek Sehgal, Jason Cheng, Aarthi Ashok
Department of Biological Sciences, University of Toronto Scarborough, Toronto, Ontario, Canada
Abstract
Glucose transporter (GLUT) proteins play a key role in the transport of monosaccharides across cellular membranes, andthus, blood sugar regulation and tissue metabolism. Patterns of GLUT expression, including the insulin-responsive GLUT4,have been well characterized in mammals. However, relatively little is known about patterns of GLUT expression in birdswith existing data limited to the granivorous or herbivorous chicken, duck and sparrow. The smallest avian taxa,hummingbirds, exhibit some of the highest fasted and fed blood glucose levels and display an unusual ability to switchrapidly and completely between endogenous fat and exogenous sugar to fuel energetically expensive hovering flight.Despite this, nothing is known about the GLUT transporters that enable observed rapid rates of carbohydrate flux. Weexamined GLUT (GLUT1, 2, 3, & 4) expression in pectoralis, leg muscle, heart, liver, kidney, intestine and brain from bothzebra finches (Taeniopygia guttata) and ruby-throated hummingbirds (Archilochus colubris). mRNA expression of all fourtransporters was probed using reverse-transcription PCR (RT-PCR). In addition, GLUT1 and 4 protein expression wereassayed by western blot and immunostaining. Patterns of RNA and protein expression of GLUT1-3 in both species agreeclosely with published reports from other birds and mammals. As in other birds, and unlike in mammals, we did not detectGLUT4. A lack of GLUT4 correlates with hyperglycemia and an uncoupling of exercise intensity and relative oxidation ofcarbohydrates in hummingbirds. The function of GLUTs present in hummingbird muscle tissue (e.g. GLUT1 and 3) remainundescribed. Thus, further work is necessary to determine if high capillary density, and thus surface area across whichcellular-mediated transport of sugars into active tissues (e.g. muscle) occurs, rather than taxon-specific differences in GLUTdensity or kinetics, can account for observed rapid rates of sugar flux into these tissues.
Citation: Welch KC Jr, Allalou A, Sehgal P, Cheng J, Ashok A (2013) Glucose Transporter Expression in an Avian Nectarivore: The Ruby-Throated Hummingbird(Archilochus colubris). PLoS ONE 8(10): e77003. doi:10.1371/journal.pone.0077003
Editor: Makoto Kanzaki, Tohoku University, Japan
Received June 20, 2013; Accepted August 26, 2013; Published October 14, 2013
Copyright: � 2013 Welch et al. This is an open-access article distributed under the terms of the Creative Commons Attribution License, which permitsunrestricted use, distribution, and reproduction in any medium, provided the original author and source are credited.
Funding: This study was supported by Natural Sciences and Engineering Research Council (NSERC) of Canada Discovery Grant #386466 (http://www.nserc-crsng.gc.ca/index_eng.asp), Canada Foundation for Innovation – Leaders Opportunity Fund (CFI-LOF) grant #25326 (http://www.innovation.ca/), and OntarioResearch Fund – Research Infrastructure Program (ORF-RIP) grant #25326 (http://www.ontario.ca/business-and-economy/ontario-research-fund) to KCW. Thefunders had no role in study design, data collection and analysis, decision to publish, or preparation of the manuscript.
Competing Interests: The authors have declared that no competing interests exist.
* E-mail: [email protected]
Introduction
While hovering at flowers, feeding on sugar-rich nectar,
hummingbirds sustain some of the highest aerobic metabolic rates
observed among vertebrates [1]. Remarkably, hummingbirds can
fuel energetically expensive hovering flight with either endogenous
lipids when fasted or with recently ingested sugars when foraging,
completely switching between fuel sources over the course of only
30–40 minutes [2–4]. Tracking of carbon from ingested nectars
with distinct isotopic signatures in expired CO2 indicates
extremely rapid turnover within the pool of actively metabolized
substrates [2,3]. This rapid flux of sugar from floral nectar to
working flight muscles in hummingbirds (and other nectarivorous
vertebrates) where it is oxidized, termed the ‘sugar oxidation
cascade’ [5], involves the concerted upregulation of sugar
transport through the cardiovascular system and across multiple
tissue barriers (e.g. intestinal wall, capillary endothelial and muscle
fiber membranes). Capacities for the assimilation and absorption
of sugar in the gut are enhanced by very high maximal rates of
sucrase activity in the hummingbird intestine [6], and high rates of
both active and passive sugar movement across the intestinal wall
[7,8]. However, mechanisms governing the flux of sugars from the
cardiovascular system to metabolically active tissues is poorly
understood in birds generally, and hummingbirds in particular.
The transport of hydrophilic sugar molecules across cell
membranes occurs through one of several related facultative
transporters comprising the GLUT family of proteins. While 14
members of the GLUT transporter family have thus far been
described in mammals [9], the first four to be described, GLUT
proteins 1–4 (class I), remain the best characterized [10]. GLUT1
is expressed in almost every tissue in mammals and is thought to
provide basal levels of glucose transport [10,11]. While GLUT3
mRNA is found in most mammalian tissues, protein expression is
generally limited to the brain, testes, and skeletal muscle [12,13].
GLUT2 and 4 play key roles in the hormonal and activity-induced
regulation of blood sugar level and uptake rate into tissues
[11,14,15]. GLUT2 is a key element of the peripheral glucose
sensing system [10,15]. Its expression in mammals is generally
limited to tissues with important roles in whole organism energy
homeostasis, such as the liver, kidneys, pancreas and intestine
[10,11]. In mammals, increased binding of glucose to GLUT2
following a rise in blood sugar activates pathways promoting
insulin release by pancreatic b-cells [10]. GLUT4 expression is
limited to skeletal muscle, heart, and adipose tissues [10,16].
PLOS ONE | www.plosone.org 1 October 2013 | Volume 8 | Issue 10 | e77003
GLUT4 in muscle, heart, and adipose is translocated from
intracellular vesicles to the plasma membrane in response to
insulin [11] and, through an independent pathway in muscle,
increased contractile activity [17,18], resulting in a dramatic
enhancement of glucose uptake.
Blood glucose levels in most mammals are typically below
10 mM and are tightly regulated by regulatory pathways including
the insulin/glucagon axis, involving members of the GLUT family
of transporters [15,19]. In contrast, birds exhibit relative
hyperglycemia, with blood glucose levels averaging 2–3 times
the level seen in comparably sized mammals [15,19]. In addition,
birds appear insulin insensitive, with blood glucose levels either
unaffected by exposure to insulin [20,21] or with moderate
hypoglycemia induced only by exposure to supra-physiological
insulin levels [22–24].
Blood glucose levels in fasted hummingbirds (1460.4 mM;
fasting duration: 1.3 hrs - overnight) are among the highest
reported and are considerably higher than levels measured in
terrestrial mammals following feeding [19,25]. Foraging hum-
mingbirds exhibit blood glucose concentrations that are several
times higher still (28 to 41 mM) [25]. Hummingbird blood glucose
levels remain high when foraging regularly (feeding on nectar
every several minutes).
The fact that hummingbirds can rely exclusively on recently
ingested sugars to fuel energetically expensive hovering flight
implies that the integrated rate of sugar transport from circulation
into metabolically active muscle tissue is quite high. Much of the
control over rates of glucose uptake and use by metabolically
active tissues such as exercising muscle is believed to occur in steps
defining the transport of glucose from circulation into these tissues
[26–31]. In addition, rapid turnover of ingested sugars in the pool
of actively metabolized substrates combined with sugar intake
rates which significantly exceed immediate catabolic requirements
implies sugars can be removed from circulation to build fat stores
in the liver and adipose tissue at high rates as well. The fact that
even fasted hummingbirds exhibit relatively high blood glucose
levels suggests that there may be important differences in the
expression or control of one or more members of the GLUT
transporter family involved in blood sugar regulation. Addition-
ally, assuming GLUT transporters represent a key rate limiting
step in the ‘sugar oxidation cascade’ pathway it is reasonable to
hypothesize that there is functional enhancement of GLUT
transporter capacity in the vasculature, muscle, liver, adipose and
other metabolically active tissues in hummingbirds.
The goal of this study was to characterize expression patterns of
class I glucose transporters in the tissues of hummingbirds.
Transporter expression was first examined in zebra finches,
because better characterization of this species’ genome facilitated
primer design and antibody cross-reactivity screening prior to
initiating work in hummingbirds. We hypothesized that, similar to
other avian taxa, GLUT4 is not expressed in the tissues of either
species. Expression of GLUTs was assessed in several tissues using
reverse transcriptase (RT) PCR, immunoblotting, and immuno-
histochemistry.
Materials and Methods
Ethics StatementThis study was carried out in strict accordance with the
recommendations in the Canadian Council on Animal Care’s
Guide to the Care and Use of Experimental Animals. All animal
protocols (# 20008396, 20008929, 20009520) were approved by
the University of Toronto Laboratory Animal Care Committee.
AnimalsRuby-throated hummingbirds (Archilochus colubris) were captured
on the University of Toronto Scarborough (Toronto, Ontario,
Canada) campus using modified box traps between May, 2010
and June, 2012 and were sampled between May, 2011 and June,
2012. Zebra finches (Taeniopygia guttata) were purchased from local
suppliers in January, 2011 and January, 2012 and sampled
between February and June, 2011 and January and February,
2012, respectively. All animals were housed in the University of
Toronto Scarborough vivarium under standard conditions. Birds
were provided food (hummingbirds: Nektar Plus, Guenter
Enderle, Tarpon Springs, FL, USA; finches: standard commercial
finch seed and millet) ad libitum up to the time of sacrifice and all
birds were thus considered well-fed immediately prior to sampling.
Additionally, tissue from healthy laboratory mice (FVB back-
ground strain; 010541-UCD, Mutant Mouse Regional Resource
Center, National Institutes of Health, Bethesda, Maryland, USA)
was obtained from individuals sacrificed as part of other studies in
the University Of Toronto Scarborough Department Of Biolog-
ical Sciences and included in our study as positive controls. Birds
were first anesthetized by exposure to .3% isoflurane, delivered
by precision vaporizer, and then euthanized by asphyxiation under
nitrogen. Tissues were immediately extracted.
Reverse Transcription-Polymerase Chain Reaction (RT-PCR)
Primers for D-glyceraldehyde 3-phosphate dehydrogenase
(GAPDH) RNA were used to amplify products that served as a
positive control. GAPDH primers were designed based on
published sequences from chicken [32]. The design of primers
for GLUT1, GLUT2, and GLUT3 were based on the putative
zebra finch genomic sequence listed in GenBank (Accession #XM_002192008, #XM_002193773.1, and #XM_002190755,
respectively). No sequence with sufficient homology to mammalian
GLUT4 is published for the zebra finch or any hummingbird
species within GenBank. As no consensus sequence for any avian
species was available, we adopted the use of a primer set based on
the rat GLUT4 sequence, as employed by Sweazea and Braun
[33]. We also developed a second, non-overlapping set of primers
based on the published sequence in mouse (Accession #NM_009204). The specificity of all primers was examined and
verified using BLAST (http://blast.ncbi.nlm.gov/Blast.cgi). All
oligonucleotide primers were synthesized by Life Technologies
Inc. (Burlington, ON, Canada). Primer sequences are listed in
Table 1.
In zebra finches, total RNA was isolated from the pectoralis (P),
brain (B), heart (H), liver (L), ankle-extensor muscle group (G; e.g.
gastrocnemius, soleus), wrist-extensor muscle group (E; e.g.
extensor digitorum longus), kidney (K), intestine (I), and pancreas
(A) using the RNeasy Mini Kit (Qiagen, Toronto, ON, Canada)
following the manufacturer’s standard protocol. RNA was isolated
from hummingbird tissues following the same protocol. However,
because tissues masses were so small, wrist-extensor muscle,
kidney, and intestine samples from 2 or more individual
hummingbirds had to be pooled prior to analysis in some cases.
This reduced the effective sample sizes for these tissues and meant
that RT-PCR products from all tissues from one individual could
not be run on the same gels in some cases. Additionally, unlike in
zebra finches, the pancreas was not sampled in hummingbirds due
to insufficient tissue mass. RNA was isolated from mouse cardiac
tissue and analyzed to detect GLUT4 expression, serving as a
positive control.
Tissue from 3–7 individual hummingbirds and 3–5 zebra
finches were sampled for use with each primer set, except for the
GLUT Transporters in Hummingbirds
PLOS ONE | www.plosone.org 2 October 2013 | Volume 8 | Issue 10 | e77003
following tissues where, due to limited tissue mass and competing
need of tissue for protein expression analysis (see below), samples
from 2 individuals were included: GLUT1– hummingbird wrist-
extensor muscles (E – pooled from 4 individuals) and zebra finch
pancreas (A). GLUT2– hummingbird brain (B), ankle-extensor
muscle group (G), kidney (K), intestine (I), and wrist-extensor
muscles (E – pooled from 4 individuals) and zebra finch pancreas
(A). GLUT3– hummingbird wrist-extensor muscles (E – pooled
from 4 individuals) and zebra finch pancreas (A). GLUT4– zebra
finch ankle-extensor muscle group (G) and pancreas (A).
Reverse transcription and amplification of cDNA was carried
out using the OneStep RT-PCR kit (Qiagen) following the
manufacturer’s standard protocol. Each 25 ml reaction mix
consisted of 5 ml 56OneStep RT-PCR buffer, 0.4 mM of dNTP
nucleotides, 1 ml of OneStep RT-PCR enzyme mix (containing
HotStarTaq DNA polymerase with Omniscript and Senscript
reverse transcriptases), and 0.6 mM each of the forward and
reverse primers. RT-PCR reactions were carried out in either a
DNA EngineH Peltier Thermal Cycler (model PTC0200, Bio-Rad
Laboratories Ltd., Mississauga, Ontario, Canada) or in an MJ
Research PTC-200 Gradient Thermal Cycler (MJ Research Inc.,
St. Bruno, Quebec, Canada). A thermal cycle profile was run for
40 cycles including denaturation at 94uC for 1 min, annealing at a
primer-specific temperature for 1 min, and extension at 72uC for
1 min. Annealing temperatures were: GAPDH 55uC, GLUT1
65uC, GLUT2 56uC, GLUT3 56.5uC, GLUT4 56uC. Predicted
product sizes, based on the putative zebra finch sequence were:
GAPDH 585 bp, GLUT1 340 bp, GLUT2 305 bp, GLUT3
543 bp, GLUT4 449 bp (based on mouse sequence). Negative
control reactions, conducted as described above except for the
omission of RNA, were conducted using all primer sets. Reaction
products were analyzed on 1.5% agarose gels along with a 100 bp
DNA ladder (GeneDirex 100 bp DNA Ladder RTU, FroggaBio
Inc., Toronto, ON, Canada) after electrophoresis at 90 V for
35 min. Gels were stained with ethidium bromide and images
were captured using a Gel DocTM XR+ System (Bio-Rad
Laboratories Ltd., Mississauga, ON, Canada).
PCR fragments from each reaction were extracted from agarose
gels and purified using the QIAquick Gel Extraction kit (Qiagen)
following the manufacturer’s protocol. PCR product sample
concentration was verified using a NanoDrop ND-1000 UV-Vis
Spectrophotometer (Thermo Fisher Scientific, Ottawa, ON,
Canada) and were sent to The Centre for Applied Genomics in
Toronto, ON, Canada for sequencing. Genetic and predicted
amino acid sequences from zebra finches and hummingbirds were
aligned with each other and with published sequences for mouse,
and chicken using CLUSTALW [34]. Sequence identity and
similarity for each GLUT were then determined using standard
program outputs.
ImmunoblotsGLUT1 and 4 protein expression was examined in the zebra
finch pectoralis, heart, liver, brain, intestine, kidney, and ankle-
extensor muscle group (e.g. gastrocnemius, soleus). Protein
expression was examined in the hummingbird pectoralis, heart,
liver, and brain. Some tissues used in RT-PCR analysis (or
examined in the zebra finch, but not the hummingbird) were not
examined for protein expression due to insufficient tissue sample
mass. With 3 exceptions, expression was examined in a minimum
of 3 samples from 3–9 individual birds of each species, depending
on tissue, for both GLUT1 and GLUT4. GLUT1 expression in
zebra finch intestine and GLUT4 expression in zebra finch
intestine and kidney were examined in 2 samples, due to limited
tissue mass. Samples from mouse skeletal and heart muscle were
included as positive controls for GLUT1 and GLUT4 blots,
respectively. Homogenization and blotting procedures followed
those described in Sweazea and Braun (2006).
Approximately 50 mg of each tissue was homogenized in eight
volumes of Krebs-Henseleit buffer at 4uC using either a disposable
motor-driven pestle (VWR, Mississauga, ON, Canada) for soft
tissues or a VDI 25 Adaptable Homogenizer (VWR) for muscle
tissues. 40 mg of protein was loaded in wells for each lane of a 10%
acrylamide gel and was run at 100 V for 120 minutes.
BenchMarkTM Pre-stained Protein Ladder (Invitrogen Technolo-
gy: Carlsbad, California, USA) or Precision Plus ProteinTM Dual
Color Standards Ladder (Bio-Rad Laboratories Ltd.) was used to
identify protein molecular weights as it displayed bands between
37 kDa to 64 kDa or 37 kDa to 75 kDa, respectively, near the
expected weights of GLUT1 (<65 kDa) [35] and GLUT4 (<45–
55 kDa) [36,37]. Immunoblotting was not attempted for GLUT2
or GLUT3 because no commercial antibody showed sufficiently
high homology to consensus amino acid sequences in the zebra
finch or chicken (zebra finch GLUT2: XP_002193809.1; chicken
GLUT3: NP_990842.1). Each blot was then transferred to a
nitrocellulose membrane by electrophoresis at 90 V for 60
minutes. After blocking with 5% milk in TBST overnight, the
membrane was incubated for 90 minutes in the primary antibody
at room temperature: GLUT1 (1:500; sc-7903, Santa Cruz
Biotechnologies), or GLUT4 (1:500; sc-1608, Santa Cruz
Biotechnologies). After four 15 minute washes in TBST, the
membranes were incubated for 1 hour in an HRP-conjugated goat
anti -rabbit secondary antibody for GLUT1 (1:5000; sc-2004,
Santa Cruz Biotechnologies), and donkey anti-goat for GLUT4
(1:5000; sc-2020, Santa Cruz Biotechnologies) in 2% milk and
TBST. Membranes were then incubated in enhanced chemilumi-
nescent reagent according to manufacturer protocol (Pierce ECL
Western Blotting Substrate, Pierce Biotechnology: Rockford,
Illinois, USA). Finally, the membranes were visualized using a
Gel DocTM XR+ System.
Table 1. Oligonucleotide sequences used for Reverse transcriptase PCR.
Primer Forward sequence Reverse sequence Fragment Size Source
GLUT1 59 - GCATGATCGGCTCCTTCTCTGT - 39 59 - AGCAGCGGCCAGAGAGAGTCGT - 39 340 bp GenBank (XM_002192008)
GLUT2 59 - TTCGCCGTCGGTGGCATGGT - 39 59 - CGTGACTGCTCTCCCGGAGATG - 39 305 bp GenBank (XM_002193773.1)
GLUT3 59 - CTTTGTGGCCCTTTTTGAGA - 39 59 - ATCTCCACCATGGGGTTCTT - 39 543 bp GenBank (XM_002190755)
musGLUT4 59 - TTCACGTTGGTCTCGGTGCT - 39 59 - CGTCGGAAGGCAGCTGAGAT- 39 449 bp* GenBank (NM_009204)
GAPDH 59 - ACGCCATCACTATCTTCCAG - 39 59 - CAGCCTTCACTACCCTCTTG - 39 585 bp Croissant et al., 2000
*Expected fragment size based on mouse sequence.Except where otherwise noted, predicted fragment sizes are based on putative zebra finch sequences.doi:10.1371/journal.pone.0077003.t001
GLUT Transporters in Hummingbirds
PLOS ONE | www.plosone.org 3 October 2013 | Volume 8 | Issue 10 | e77003
GLUT1 stained membranes were then stripped with 0.1 M
glycine:HCl (pH 2.8) for 30 minutes at room temperature.
Membranes were then washed with TBST and blocked for 1
hour with 5% BSA in PBS at room temperature. The membrane
was then incubated with HRP-conjugated GAPDH Ab (1:5000;
ab9482, Abcam Inc, Cambridge, MA, USA) overnight at 4uC.
Following incubation, the membrane was washed three times in
PBS and imaged using the Gel DocTM XR+ System, as above.
ImmunohistochemistryFreshly dissected samples of zebra finch pectoralis and
hummingbird pectoralis and heart (N = 4 or 5; each species) were
coated in VWR Premium Frozen Section Compound (VWR
International, Mississauga, Ontario, Canada), and frozen in 2-
methylbutane cooled to 2160uC by liquid nitrogen. Samples of
hummingbird liver (N = 4) and brain (N = 2) were dissected and
fixed in 30% sucrose/4% formalin for 7 days at 4uC before being
coated in VWR Premium Frozen Section Compound and flash
frozen as above. Samples were also obtained, and identically
prepared, from mouse soleus, heart, brain and liver.
12 mm thick sections from these tissues were cut in a cryostat
maintained at 224 to 220uC. Four to six sections were picked up
on each microscope slide (SuperfrostH Plus, Fisher Scientific,
Ottawa, Ontario, Canada), with 18–54 serial sections obtained
from each tissue. Slides were air dried at room temperature for 1–
2 hours and then immediately stained.
Serial sections were stained to visualize either GLUT1 or
GLUT4 using the same primary antibodies as in the immunoblots.
GLUT staining began with acetone fixation and permeabilization
for 5 min at 4uC. Subsequently, sections were washed twice in
PBS (0.02 M sodium phosphate buffer, 0.15 M NaCl, pH 7.2)
diluted with ddH2O. Sections were blocked in PBS containing
goat serum (5%), bovine serum albumin (BSA; 10%) in PBS, and
EDTA (5 mM) for 30 min. Slides were incubated overnight at 4uCwith one of the two primary GLUT antibodies diluted 1:200 in
PBS. Following overnight incubation, samples were washed in
PBS. Presence of the primary antibody was visualized by
incubating sections for 30 min in the dark at room temperature
with a donkey anti-rabbit IgG secondary antibody conjugated to
an Alexa-488 fluorophore (Alexa FluorH, NY, USA) at a 1:300
dilution in PBS. Sections were washed in PBS prior to staining
with DAPI (1:100 dilution) for 15 min in the dark at room
temperature to visualize nuclei. Sections were washed again in
PBS and fixed in 4% formalin in PBS. Negative controls were
made by excluding primary antibodies from the staining
procedure. Additionally, sections from hummingbird and finch
pectoralis, as well as mouse soleus, were stained to visualize
capillaries using the periodic acid-Schiff (PAS) stain modified from
the technique described in Anderson (1975) [38] or PAS staining
was carried out using the Sigma-Aldrich PAS kit (Sigma-Aldrich,
St. Louis, MO, USA). Sections were fixed for 10 min in a modified
Carnoy’s solution (80% ethanol, 15% chloroform, and 5% glacial
acetic acid) at room temperature, followed by subsequent washes
with double distilled H2O (ddH2O). Then, sections were incubated
in 1% amylase for 25 min at room temperature, followed by
ddH2O washes. Tissues were stained in 1% Schiff’s reagent for 5–
20 min at room temperature, depending on tissue type. Staining
was developed following 10 min of ddH2O washes. Subsequent
dehydration and clearing was carried out at 2 minute intervals
using 80% ethanol, 90% ethanol, 100% ethanol, 100% ethanol,
and xylene sequentially. All sections were mounted in Dako
fluorescent medium (Dako Canada Inc., Burlington, Ontario,
Canada).
PAS-stained sections were visualized with a Zeiss Axioplan-2
imaging Light Microscope (Carl Zeiss Canada Ltd., ON, Canada)
while fluorescently-stained sections were visualized on a Quorum
WaveFX Spinning disk confocal microscope (Quorum Technol-
ogies Inc. Guelph, Ontario, Canada) using Volocity 3D image
analysis software (PerkinElmer, Woodbridge, Ontario, Canada).
Results
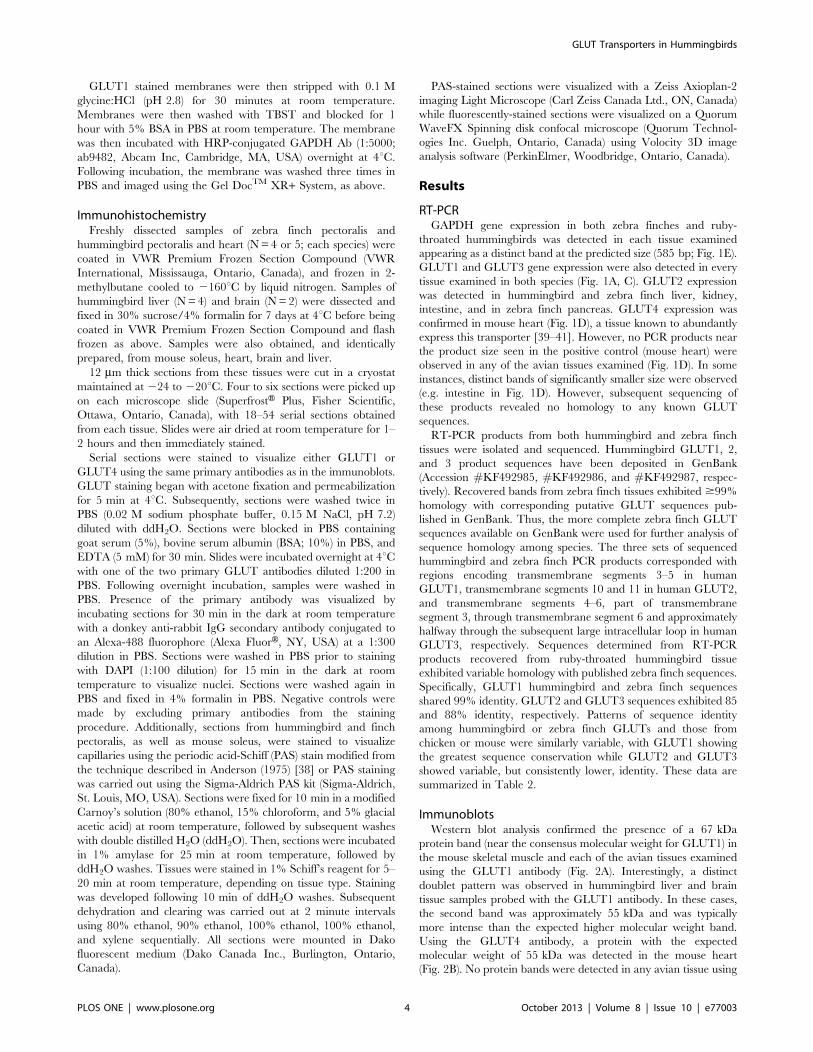
RT-PCRGAPDH gene expression in both zebra finches and ruby-
throated hummingbirds was detected in each tissue examined
appearing as a distinct band at the predicted size (585 bp; Fig. 1E).
GLUT1 and GLUT3 gene expression were also detected in every
tissue examined in both species (Fig. 1A, C). GLUT2 expression
was detected in hummingbird and zebra finch liver, kidney,
intestine, and in zebra finch pancreas. GLUT4 expression was
confirmed in mouse heart (Fig. 1D), a tissue known to abundantly
express this transporter [39–41]. However, no PCR products near
the product size seen in the positive control (mouse heart) were
observed in any of the avian tissues examined (Fig. 1D). In some
instances, distinct bands of significantly smaller size were observed
(e.g. intestine in Fig. 1D). However, subsequent sequencing of
these products revealed no homology to any known GLUT
sequences.
RT-PCR products from both hummingbird and zebra finch
tissues were isolated and sequenced. Hummingbird GLUT1, 2,
and 3 product sequences have been deposited in GenBank
(Accession #KF492985, #KF492986, and #KF492987, respec-
tively). Recovered bands from zebra finch tissues exhibited $99%
homology with corresponding putative GLUT sequences pub-
lished in GenBank. Thus, the more complete zebra finch GLUT
sequences available on GenBank were used for further analysis of
sequence homology among species. The three sets of sequenced
hummingbird and zebra finch PCR products corresponded with
regions encoding transmembrane segments 3–5 in human
GLUT1, transmembrane segments 10 and 11 in human GLUT2,
and transmembrane segments 4–6, part of transmembrane
segment 3, through transmembrane segment 6 and approximately
halfway through the subsequent large intracellular loop in human
GLUT3, respectively. Sequences determined from RT-PCR
products recovered from ruby-throated hummingbird tissue
exhibited variable homology with published zebra finch sequences.
Specifically, GLUT1 hummingbird and zebra finch sequences
shared 99% identity. GLUT2 and GLUT3 sequences exhibited 85
and 88% identity, respectively. Patterns of sequence identity
among hummingbird or zebra finch GLUTs and those from
chicken or mouse were similarly variable, with GLUT1 showing
the greatest sequence conservation while GLUT2 and GLUT3
showed variable, but consistently lower, identity. These data are
summarized in Table 2.
ImmunoblotsWestern blot analysis confirmed the presence of a 67 kDa
protein band (near the consensus molecular weight for GLUT1) in
the mouse skeletal muscle and each of the avian tissues examined
using the GLUT1 antibody (Fig. 2A). Interestingly, a distinct
doublet pattern was observed in hummingbird liver and brain
tissue samples probed with the GLUT1 antibody. In these cases,
the second band was approximately 55 kDa and was typically
more intense than the expected higher molecular weight band.
Using the GLUT4 antibody, a protein with the expected
molecular weight of 55 kDa was detected in the mouse heart
(Fig. 2B). No protein bands were detected in any avian tissue using
GLUT Transporters in Hummingbirds
PLOS ONE | www.plosone.org 4 October 2013 | Volume 8 | Issue 10 | e77003
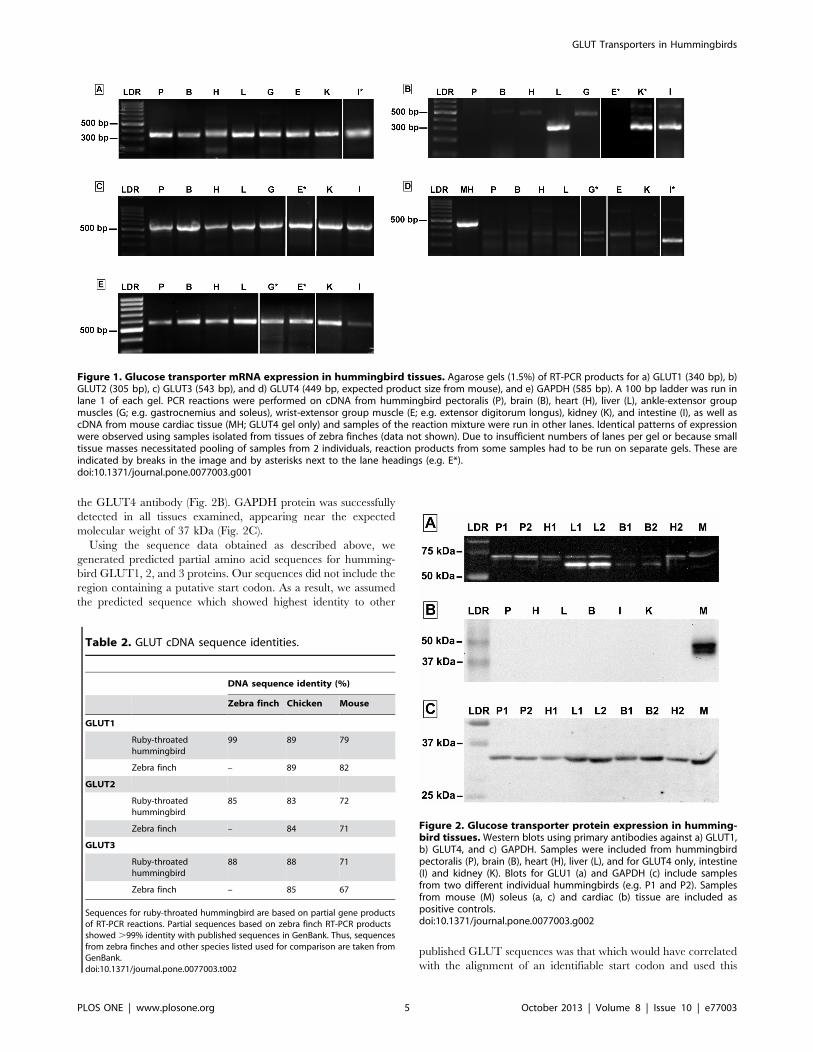
the GLUT4 antibody (Fig. 2B). GAPDH protein was successfully
detected in all tissues examined, appearing near the expected
molecular weight of 37 kDa (Fig. 2C).
Using the sequence data obtained as described above, we
generated predicted partial amino acid sequences for humming-
bird GLUT1, 2, and 3 proteins. Our sequences did not include the
region containing a putative start codon. As a result, we assumed
the predicted sequence which showed highest identity to other
published GLUT sequences was that which would have correlated
with the alignment of an identifiable start codon and used this
Figure 1. Glucose transporter mRNA expression in hummingbird tissues. Agarose gels (1.5%) of RT-PCR products for a) GLUT1 (340 bp), b)GLUT2 (305 bp), c) GLUT3 (543 bp), and d) GLUT4 (449 bp, expected product size from mouse), and e) GAPDH (585 bp). A 100 bp ladder was run inlane 1 of each gel. PCR reactions were performed on cDNA from hummingbird pectoralis (P), brain (B), heart (H), liver (L), ankle-extensor groupmuscles (G; e.g. gastrocnemius and soleus), wrist-extensor group muscle (E; e.g. extensor digitorum longus), kidney (K), and intestine (I), as well ascDNA from mouse cardiac tissue (MH; GLUT4 gel only) and samples of the reaction mixture were run in other lanes. Identical patterns of expressionwere observed using samples isolated from tissues of zebra finches (data not shown). Due to insufficient numbers of lanes per gel or because smalltissue masses necessitated pooling of samples from 2 individuals, reaction products from some samples had to be run on separate gels. These areindicated by breaks in the image and by asterisks next to the lane headings (e.g. E*).doi:10.1371/journal.pone.0077003.g001
Table 2. GLUT cDNA sequence identities.
DNA sequence identity (%)
Zebra finch Chicken Mouse
GLUT1
Ruby-throatedhummingbird
99 89 79
Zebra finch – 89 82
GLUT2
Ruby-throatedhummingbird
85 83 72
Zebra finch – 84 71
GLUT3
Ruby-throatedhummingbird
88 88 71
Zebra finch – 85 67
Sequences for ruby-throated hummingbird are based on partial gene productsof RT-PCR reactions. Partial sequences based on zebra finch RT-PCR productsshowed .99% identity with published sequences in GenBank. Thus, sequencesfrom zebra finches and other species listed used for comparison are taken fromGenBank.doi:10.1371/journal.pone.0077003.t002
Figure 2. Glucose transporter protein expression in humming-bird tissues. Western blots using primary antibodies against a) GLUT1,b) GLUT4, and c) GAPDH. Samples were included from hummingbirdpectoralis (P), brain (B), heart (H), liver (L), and for GLUT4 only, intestine(I) and kidney (K). Blots for GLU1 (a) and GAPDH (c) include samplesfrom two different individual hummingbirds (e.g. P1 and P2). Samplesfrom mouse (M) soleus (a, c) and cardiac (b) tissue are included aspositive controls.doi:10.1371/journal.pone.0077003.g002
GLUT Transporters in Hummingbirds
PLOS ONE | www.plosone.org 5 October 2013 | Volume 8 | Issue 10 | e77003
predicted sequence for further analysis. All other GLUT amino
acid sequences (including those from zebra finch) were obtained
from GenBank. Variation in amino acid sequence identity among
species followed patterns observed among genetic sequences.
Ruby-throated hummingbird and zebra finch GLUT1, GLUT2,
and GLUT3 amino acid sequences exhibited 92%, 84% and 86%
identity, respectively. Amino acid sequence similarity between the
two species was 96%, 88%, and 93%, for GLUT1, GLUT2, and
GLUT3, respectively. Sequence identity/homology among taxa
are listed in table 3.
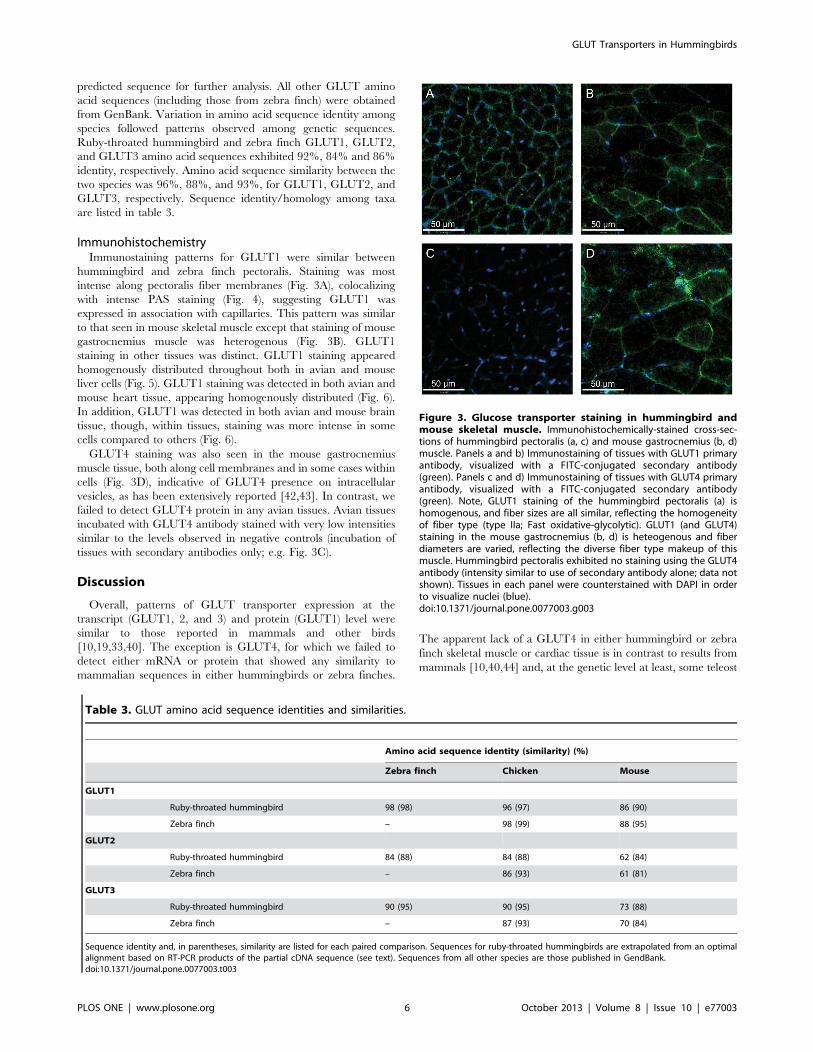
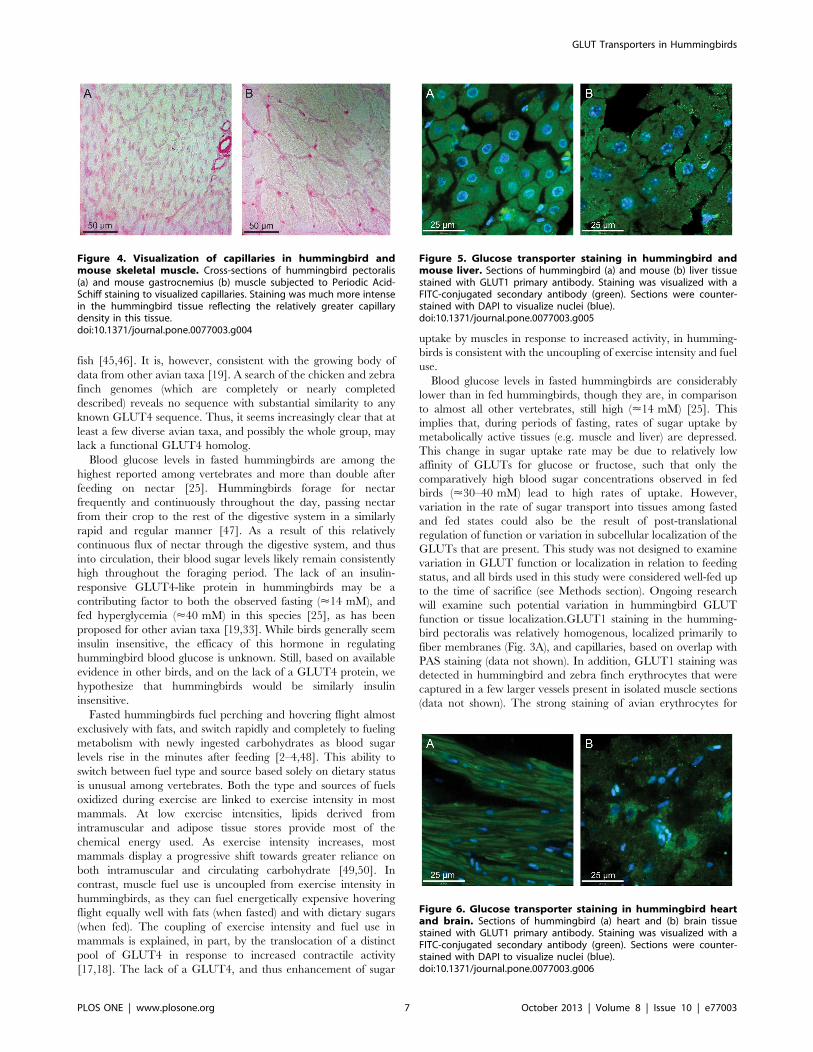
ImmunohistochemistryImmunostaining patterns for GLUT1 were similar between
hummingbird and zebra finch pectoralis. Staining was most
intense along pectoralis fiber membranes (Fig. 3A), colocalizing
with intense PAS staining (Fig. 4), suggesting GLUT1 was
expressed in association with capillaries. This pattern was similar
to that seen in mouse skeletal muscle except that staining of mouse
gastrocnemius muscle was heterogenous (Fig. 3B). GLUT1
staining in other tissues was distinct. GLUT1 staining appeared
homogenously distributed throughout both in avian and mouse
liver cells (Fig. 5). GLUT1 staining was detected in both avian and
mouse heart tissue, appearing homogenously distributed (Fig. 6).
In addition, GLUT1 was detected in both avian and mouse brain
tissue, though, within tissues, staining was more intense in some
cells compared to others (Fig. 6).
GLUT4 staining was also seen in the mouse gastrocnemius
muscle tissue, both along cell membranes and in some cases within
cells (Fig. 3D), indicative of GLUT4 presence on intracellular
vesicles, as has been extensively reported [42,43]. In contrast, we
failed to detect GLUT4 protein in any avian tissues. Avian tissues
incubated with GLUT4 antibody stained with very low intensities
similar to the levels observed in negative controls (incubation of
tissues with secondary antibodies only; e.g. Fig. 3C).
Discussion
Overall, patterns of GLUT transporter expression at the
transcript (GLUT1, 2, and 3) and protein (GLUT1) level were
similar to those reported in mammals and other birds
[10,19,33,40]. The exception is GLUT4, for which we failed to
detect either mRNA or protein that showed any similarity to
mammalian sequences in either hummingbirds or zebra finches.
The apparent lack of a GLUT4 in either hummingbird or zebra
finch skeletal muscle or cardiac tissue is in contrast to results from
mammals [10,40,44] and, at the genetic level at least, some teleost
Table 3. GLUT amino acid sequence identities and similarities.
Amino acid sequence identity (similarity) (%)
Zebra finch Chicken Mouse
GLUT1
Ruby-throated hummingbird 98 (98) 96 (97) 86 (90)
Zebra finch – 98 (99) 88 (95)
GLUT2
Ruby-throated hummingbird 84 (88) 84 (88) 62 (84)
Zebra finch – 86 (93) 61 (81)
GLUT3
Ruby-throated hummingbird 90 (95) 90 (95) 73 (88)
Zebra finch – 87 (93) 70 (84)
Sequence identity and, in parentheses, similarity are listed for each paired comparison. Sequences for ruby-throated hummingbirds are extrapolated from an optimalalignment based on RT-PCR products of the partial cDNA sequence (see text). Sequences from all other species are those published in GendBank.doi:10.1371/journal.pone.0077003.t003
Figure 3. Glucose transporter staining in hummingbird andmouse skeletal muscle. Immunohistochemically-stained cross-sec-tions of hummingbird pectoralis (a, c) and mouse gastrocnemius (b, d)muscle. Panels a and b) Immunostaining of tissues with GLUT1 primaryantibody, visualized with a FITC-conjugated secondary antibody(green). Panels c and d) Immunostaining of tissues with GLUT4 primaryantibody, visualized with a FITC-conjugated secondary antibody(green). Note, GLUT1 staining of the hummingbird pectoralis (a) ishomogenous, and fiber sizes are all similar, reflecting the homogeneityof fiber type (type IIa; Fast oxidative-glycolytic). GLUT1 (and GLUT4)staining in the mouse gastrocnemius (b, d) is heteogenous and fiberdiameters are varied, reflecting the diverse fiber type makeup of thismuscle. Hummingbird pectoralis exhibited no staining using the GLUT4antibody (intensity similar to use of secondary antibody alone; data notshown). Tissues in each panel were counterstained with DAPI in orderto visualize nuclei (blue).doi:10.1371/journal.pone.0077003.g003
GLUT Transporters in Hummingbirds
PLOS ONE | www.plosone.org 6 October 2013 | Volume 8 | Issue 10 | e77003
fish [45,46]. It is, however, consistent with the growing body of
data from other avian taxa [19]. A search of the chicken and zebra
finch genomes (which are completely or nearly completed
described) reveals no sequence with substantial similarity to any
known GLUT4 sequence. Thus, it seems increasingly clear that at
least a few diverse avian taxa, and possibly the whole group, may
lack a functional GLUT4 homolog.
Blood glucose levels in fasted hummingbirds are among the
highest reported among vertebrates and more than double after
feeding on nectar [25]. Hummingbirds forage for nectar
frequently and continuously throughout the day, passing nectar
from their crop to the rest of the digestive system in a similarly
rapid and regular manner [47]. As a result of this relatively
continuous flux of nectar through the digestive system, and thus
into circulation, their blood sugar levels likely remain consistently
high throughout the foraging period. The lack of an insulin-
responsive GLUT4-like protein in hummingbirds may be a
contributing factor to both the observed fasting (<14 mM), and
fed hyperglycemia (<40 mM) in this species [25], as has been
proposed for other avian taxa [19,33]. While birds generally seem
insulin insensitive, the efficacy of this hormone in regulating
hummingbird blood glucose is unknown. Still, based on available
evidence in other birds, and on the lack of a GLUT4 protein, we
hypothesize that hummingbirds would be similarly insulin
insensitive.
Fasted hummingbirds fuel perching and hovering flight almost
exclusively with fats, and switch rapidly and completely to fueling
metabolism with newly ingested carbohydrates as blood sugar
levels rise in the minutes after feeding [2–4,48]. This ability to
switch between fuel type and source based solely on dietary status
is unusual among vertebrates. Both the type and sources of fuels
oxidized during exercise are linked to exercise intensity in most
mammals. At low exercise intensities, lipids derived from
intramuscular and adipose tissue stores provide most of the
chemical energy used. As exercise intensity increases, most
mammals display a progressive shift towards greater reliance on
both intramuscular and circulating carbohydrate [49,50]. In
contrast, muscle fuel use is uncoupled from exercise intensity in
hummingbirds, as they can fuel energetically expensive hovering
flight equally well with fats (when fasted) and with dietary sugars
(when fed). The coupling of exercise intensity and fuel use in
mammals is explained, in part, by the translocation of a distinct
pool of GLUT4 in response to increased contractile activity
[17,18]. The lack of a GLUT4, and thus enhancement of sugar
uptake by muscles in response to increased activity, in humming-
birds is consistent with the uncoupling of exercise intensity and fuel
use.
Blood glucose levels in fasted hummingbirds are considerably
lower than in fed hummingbirds, though they are, in comparison
to almost all other vertebrates, still high (<14 mM) [25]. This
implies that, during periods of fasting, rates of sugar uptake by
metabolically active tissues (e.g. muscle and liver) are depressed.
This change in sugar uptake rate may be due to relatively low
affinity of GLUTs for glucose or fructose, such that only the
comparatively high blood sugar concentrations observed in fed
birds (<30–40 mM) lead to high rates of uptake. However,
variation in the rate of sugar transport into tissues among fasted
and fed states could also be the result of post-translational
regulation of function or variation in subcellular localization of the
GLUTs that are present. This study was not designed to examine
variation in GLUT function or localization in relation to feeding
status, and all birds used in this study were considered well-fed up
to the time of sacrifice (see Methods section). Ongoing research
will examine such potential variation in hummingbird GLUT
function or tissue localization.GLUT1 staining in the humming-
bird pectoralis was relatively homogenous, localized primarily to
fiber membranes (Fig. 3A), and capillaries, based on overlap with
PAS staining (data not shown). In addition, GLUT1 staining was
detected in hummingbird and zebra finch erythrocytes that were
captured in a few larger vessels present in isolated muscle sections
(data not shown). The strong staining of avian erythrocytes for
Figure 4. Visualization of capillaries in hummingbird andmouse skeletal muscle. Cross-sections of hummingbird pectoralis(a) and mouse gastrocnemius (b) muscle subjected to Periodic Acid-Schiff staining to visualized capillaries. Staining was much more intensein the hummingbird tissue reflecting the relatively greater capillarydensity in this tissue.doi:10.1371/journal.pone.0077003.g004
Figure 5. Glucose transporter staining in hummingbird andmouse liver. Sections of hummingbird (a) and mouse (b) liver tissuestained with GLUT1 primary antibody. Staining was visualized with aFITC-conjugated secondary antibody (green). Sections were counter-stained with DAPI to visualize nuclei (blue).doi:10.1371/journal.pone.0077003.g005
Figure 6. Glucose transporter staining in hummingbird heartand brain. Sections of hummingbird (a) heart and (b) brain tissuestained with GLUT1 primary antibody. Staining was visualized with aFITC-conjugated secondary antibody (green). Sections were counter-stained with DAPI to visualize nuclei (blue).doi:10.1371/journal.pone.0077003.g006
GLUT Transporters in Hummingbirds
PLOS ONE | www.plosone.org 7 October 2013 | Volume 8 | Issue 10 | e77003
GLUT1 mirrors such staining observed in mammalian erythro-
cytes [9,10,40]. Staining was similar in the zebra finch pectoralis.
By comparison, GLUT1 (and GLUT4) staining in the mouse
gastrocnemius muscle was heterogenous, with some fibers staining
more intensely than others (Fig. 3B, D). Density of GLUT
transporters, and thus intensity of staining in mouse skeletal muscle
differs among distinct fiber types. In contrast, the flight muscles of
hummingbirds, zebra finches, like many other small-bodied,
volant avian species, are composed of a single fiber type (type
IIa, fast-twitch oxidative glycolytic) [51,52]. Homogenous staining
of these muscles suggests that, like distribution of myosin heavy
chain isoforms and mitochondrial density, capacities for uptake of
sugars from circulation (at least via GLUT1) are also homogenous.
Given that GLUT1 staining intensity differs among fiber types in
mammalian skeletal muscle, we hypothesize that patterns of
GLUT1 staining among fibers in the hummingbird and zebra
finch ankle-extensor muscle group (e.g. gastrocnemius, soleus)
would also be heterogenous since these muscles, unlike the flight
muscles, are composed of multiple fiber types [52]. Because ankle-
extensor muscle groups in each species are so small, and because
these tissues were prioritized for RT-PCR and immunoblot use,
we were unable to conduct immunostaining studies to test this
hypothesis.
Genetic and amino acid sequence similarity among species was
highest for GLUT1 and, on average, progressively lower for
GLUT2 and 3. Generally, sequence similarity is quite high for
GLUT1 among mammals (.97%) and it seems this trend holds
among birds as well, with hummingbird GLUT1 showing .90%
amino acid sequence homology to zebra finch and chicken
GLUT1 [53]. The lower similarity of GLUT2 and 3 sequences
among avian and mammalian taxa is consistent with fact that
antibodies developed against these proteins in mammals are poorly
cross-reactive with their avian homologs.
In hummingbirds, much of the glucose (and, presumably, other
hexoses) is absorbed across the gut wall via a non-mediated,
paracellular pathway [8,54]. Reliance on paracellular absorption
of sugars in the gut facilitates high rates of flux of sugars
independent of GLUT transporter function, an adaptation which
has permitted the evolution of smaller, lighter mass digestive
machinery in hummingbirds and other small, volant vertebrates
[54]. Still, it appears that the Vmax for cellular-mediated (i.e.
involving GLUT transporters) glucose transport across the
hummingbird gut wall is comparatively large [8]. That said,
passive diffusion of into cells (e.g. liver, muscle, brain) does not
occur. Unlike in the hummingbird gut, the surface area
(normalized to body mass, or muscle volume, respectively) across
which sugars move from circulation into muscle fibers is much
greater in hummingbirds than in most other vertebrates [55]. It is
likely that, just as with the diffusion of oxygen, small muscle fiber
cross-sectional area (high fiber surface area to volume ratio) and
high capillary density facilitate high rates of sugar transport per
volume of tissue facilitated solely by GLUT transporters [5,55,56].
Still, because the functional capacities of hummingbird GLUTs
are undescribed it remains only an assumption that GLUT
mediated transport is sufficient to explain observed high rates of
sugar uptake into active flight or liver tissues.
A recent study shows that the kinetics of oxidation of ingested
fructose in hovering hummingbirds is at least as rapid as that for
ingested glucose [2]. This raises the possibility that these animals,
which receive ,50% of their calories in the form of fructose
[57,58], may be capable of transporting this hexose directly from
circulation into their muscle cells and oxidizing it at rates much
higher than maximal capacities seen in most mammals [59,60]. In
mammals, only a few of the 14 GLUT transporters are believed to
have significant affinity for fructose. These are GLUT2 (class 1),
GLUT5, 11 (class 2), and GLUT8 (class 3) [10]. While we detected
GLUT2 gene expression in the liver, it was not detected in the
skeletal muscle of either bird. Other studies have failed to find
GLUT2 expression in avian skeletal muscles [61]. Thus, it seems
highly unlikely that GLUT2 protein is present in the hummingbird
flight muscles where it could provide some capacity for the uptake
of fructose. We did not examine expression patterns of the other
three fructose transporters. The only one of these transporters
localized to skeletal muscle in mammals is GLUT11 [10]. Patterns
of GLUT5 and 11 expression in avian tissues are not known.
GLUT8 cDNA has been detected in chicken pectoralis, though at
much lower levels than in other tissues [61,62]. GLUT8 protein
expression patterns in birds remain undescribed. In general,
affinities and functional capacities of any avian GLUTs for
fructose are not known. The regions of GLUT1-3 sequenced as
part of this study generally fall outside the specific regions that
have, in humans, been shown to be especially variable among
GLUT family members (e.g. either terminal region or extracellular
loops 1 or 9 [36]) or in which specific sequence motifs have been
associated with functional variation (e.g. the QLS motif present in
transmembrane segment 7 [63]). Further study is warranted. For
the time being, it remains unclear by what mechanisms significant
rates of fructose transport to and from metabolically active tissues
such as flight muscle and liver may be enabled in hummingbirds or
any other avian taxa.
In summary, we show that hummingbirds and zebra finches do
not express a GLUT4 transporter. The consensus emerging from a
growing body of work on avian taxa [19,33,62,64] is that this
group generally does not possess a functional GLUT4 protein and
that the gene may have been lost early in its evolution. We also
show that expression patterns for GLUT1, 2 and 3 are consistent
with reports from both birds and mammals [10,19,40].
The lack of a GLUT4 protein in hummingbirds may be related
in this group, as it is hypothesized to be in other avian taxa
[19,33], to persistent hyperglycemia during both fasting and fed
periods. Further, we conclude that the lack of a contraction-
responsive GLUT4 in hummingbirds at least partly explains an
uncoupling between exercise intensity (e.g. hovering flight) and
muscle substrate oxidation that is otherwise consistently seen in
most mammals [49,50].
We highlight the need for continuing work to better understand
the function and regulatory role of glucose transporters in the
movement of sugars between the circulatory system and active
tissues in hummingbirds and other avian taxa. Hummingbirds
demonstrate a remarkable capacity for the rapid flux of sugars
from the intestine, through the circulatory system, and to active
tissues, such as flight muscle and liver [2–4]. Yet, qualitative
differences in class I GLUT expression which might explain such
capacities are not evident. Further work is needed to discover if
GLUT transporter kinetics, and not simply transporter density or
abundance, are substantially enhanced in hummingbirds and
other energetic avian taxa.
Acknowledgments
The authors thank members of the Aarts, Nash, and Terebiznik labs, as
well as staff at the Centre for the Neurobiology of Stress at UTSC for
technical assistance and for use of equipment and supplies. Specifically, the
authors thank M. Aarts, B. Chue, J. Nash, M. Ratman, C. Seepersad, R.
Temkin, M. Terebiznik, and S. Thiele for their help. The authors also
thank two anonymous reviewers for their constructive comments.
GLUT Transporters in Hummingbirds
PLOS ONE | www.plosone.org 8 October 2013 | Volume 8 | Issue 10 | e77003
Author Contributions
Conceived and designed the experiments: KCW PS AAllalou JC AAshok.
Performed the experiments: KCW AAllalou PS JC. Analyzed the data:
KCW AAllalou PS JC AAshok. Contributed reagents/materials/analysis
tools: KCW AAshok. Wrote the paper: KCW AAllalou PS JC AAshok.
References
1. Suarez RK (1992) Hummingbird flight: Sustaining the highest mass-specific
metabolic rates among vertebrates. Experientia 48: 565–570. doi:10.1007/
BF01920240.
2. Chen CCW, Welch Jr. KC (In review) Ruby-throated hummingbirds can fuel
hovering flight with either glucose or fructose. Funct Ecol: FE-2013-00244.
3. Welch Jr KC, Suarez RK (2007) Oxidation rate and turnover of ingested sugar
in hovering Anna’s (Calypte anna) and rufous (Selasphorus rufus) humming-
birds. J Exp Biol 210: 2154–2162.
4. Welch Jr KC, Bakken BH, Martınez del Rio C, Suarez RK (2006)
Hummingbirds fuel hovering flight with newly ingested sugar. Physiol Biochem
Zool 79: 1082–1087.
5. Suarez RK, Herrera M LG, Welch Jr KC (2011) The sugar oxidation cascade:
aerial refueling in hummingbirds and nectar bats. J Exp Biol 214: 172–178.
doi:10.1242/jeb.047936.
6. McWhorter TJ, Martinez del Rio C (2000) Does gut function limit hummingbird
food intake? Physiol Biochem Zool 73: 313–324.
7. Diamond JM, Karasov WH, Phan D, Carpenter FL (1986) Digestive physiology
is a determinant of foraging bout frequency in hummingbirds. Nature 320: 62–
63.
8. McWhorter TJ, Bakken BH, Karasov WH, Martinez del Rio C (2006)
Hummingbirds rely on both paracellular and carrier-mediated intestinal glucose
absorption to fuel high metabolism. Biol Lett 2: 131–134.
9. Thorens B, Mueckler M (2010) Glucose transporters in the 21st Century.
Am J Physiol-Endocrinol Metab 298: E141–E145.
10. Uldry M, Thorens B (2004) The SLC2 family of facilitated hexose and polyol
transporters. Pflugers Arch - Eur J Physiol 447: 480–489.
11. Shepherd PR, Kahn BB (1999) Glucose transporters and insulin action –
implications for insulin resistance and diabetes mellitus. N Engl J Med 341: 248–
257.
12. Haber RS, Weinstein SP, O’Boyle E, Morgello S (1993) Tissue distribution of
the human GLUT3 glucose transporter. Endocrinology 132: 2538–2543.
doi:10.1210/en.132.6.2538.
13. Stuart CA, Wen G, Peng B-H, Popov VL, Hudnall SD, et al. (2000) GLUT-3
expression in human skeletal muscle. Am J Physiol - Endocrinol Metab 279:
E855–E861.
14. Cherrington AD (1999) Banting Lecture 1997. Control of glucose uptake and
release by the liver in vivo. Diabetes 48: 1198–1214. doi:10.2337/diabe-
tes.48.5.1198.
15. Polakof S, Mommsen TP, Soengas JL (2011) Glucosensing and glucose
homeostasis: From fish to mammals. Comp Biochem Physiol B Biochem Mol
Biol 160: 123–149. doi:10.1016/j.cbpb.2011.07.006.
16. Joost H-G, Thorens B (2001) The extended GLUT-family of sugar/polyol
transport facilitators: nomenclature, sequence characteristics, and potential
function of its novel members. Mol Membr Biol 18: 247–256.
17. Coderre L, Kandror KV, Vallega G, Pilch PF (1995) Identification and
Characterization of an Exercise-sensitive Pool of Glucose Transporters in
Skeletal Muscle. J Biol Chem 270: 27584–27588. doi:10.1074/
jbc.270.46.27584.
18. Douen AG, Ramlal T, Rastogi S, Bilan PJ, Cartee GD, et al. (1990) Exercise
induces recruitment of the ‘‘insulin-responsive glucose transporter’’. Evidence for
distinct intracellular insulin- and exercise-recruitable transporter pools in skeletal
muscle. J Biol Chem 265: 13427–13430.
19. Braun EJ, Sweazea KL (2008) Glucose regulation in birds. Comp Biochem
Physiol B Biochem Mol Biol 151: 1–9.
20. Sweazea KL (2005) Glucose transport by english sparrow (Passer domesticus)
skeletal muscle: Have we been chirping up the wrong tree? J Exp Zoolog A Comp
Exp Biol 303A: 143–153.
21. Sweazea KL, McMurtry JP, Braun EJ (2006) Inhibition of lipolysis does not
affect insulin sensitivity to glucose uptake in the mourning dove. Comp Biochem
Physiol – Part B Biochem Mol Biol 144: 387–394.
22. Chen KK, Anderson RC, Maze N (1945) Susceptibility of birds to insulin as
compared with mammals. J Pharmacol Exp Ther 84: 74–77.
23. Chida Y, Ohtsu H, Takahashi K, Sato K, Toyomizu M, et al. (2000)
Carbohydrate metabolism in temporal and persistent hypoglycemic chickens
induced by insulin infusion. Comp Biochem Physiol – Part C 126: 187–193.
24. Tokushima Y, Takahashi K, Sato K, Akiba Y (2005) Glucose uptake in vivo in
skeletal muscles of insulin-injected chicks. Comp Biochem Physiol B Biochem
Mol Biol 141: 43–48.
25. Beuchat CA, Chong CR (1998) Hyperglycemia in hummingbirds and its
consequences for hemoglobin glycation. Comp Biochem Physiol-Part Mol Integr
Physiol 120: 409–416.
26. Bertoldo A, Pencek RR, Azuma K, Price JC, Kelley C, et al. (2006) Interactions
Between Delivery, Transport, and Phosphorylation of Glucose in Governing
Uptake Into Human Skeletal Muscle. Diabetes 55: 3028–3037. doi:10.2337/
db06-0762.
27. Fueger PT, Hess HS, Bracy DP, Pencek RR, Posey KA, et al. (2004) Regulation
of Insulin-Stimulated Muscle Glucose Uptake in the Conscious Mouse: Role ofGlucose Transport Is Dependent on Glucose Phosphorylation Capacity.
Endocrinology 145: 4912–4916. doi:10.1210/en.2004-0465.
28. Fueger PT, Li CY, Ayala JE, Shearer J, Bracy DP, et al. (2007) Glucose kinetics
and exercise tolerance in mice lacking the GLUT4 glucose transporter. J Physiol582: 801–812. doi:10.1113/jphysiol.2007.132902.
29. Furler SM, Jenkins AB, Storlien LH, Kraegen EW (1991) In vivo location of therate-limiting step of hexose uptake in muscle and brain tissue of rats. Am J Physiol
- Endocrinol Metab 261: E337–E347.
30. Bonadonna RC, Saccomani MP, Seely L, Zych KS, Ferrannini E, et al. (1993)
Glucose transport in human skeletal muscle. The in vivo response to insulin.Diabetes 42: 191–198. doi:10.2337/diabetes.42.1.191.
31. Post RL, Morgan HE, Park CR (1961) Regulation of Glucose Uptake in Muscle.J Biol Chem 236: 269–272.
32. Croissant JD, Carpenter S, Bader D (2000) Identification and Genomic Cloningof CMHC1 a unique myosin heavy chain expressed exclusively in the developing
chicken heart. J Biol Chem 275: 1944–1951. doi:10.1074/jbc.275.3.1944.
33. Sweazea KL, Braun EJ (2006) Glucose transporter expression in English
sparrows (Passer domesticus). Comp Biochem Physiol B Biochem Mol Biol 144:263–270. doi:10.1016/j.cbpb.2005.12.027.
34. Larkin MA, Blackshields G, Brown NP, Chenna R, McGettigan PA, et al. (2007)Clustal W and Clustal X version 2.0. Bioinformatics 23: 2947–2948.
doi:10.1093/bioinformatics/btm404.
35. Gaudreault N, Scriven DRL, Moore EDW (2004) Characterisation of glucose
transporters in the intact coronary artery endothelium in rats: GLUT-2upregulated by long-term hyperglycaemia. Diabetologia 47: 2081–2092.
doi:10.1007/s00125-004-1583-4.
36. Zhao F-Q, Keating AF (2007) Functional Properties and Genomics of Glucose
Transporters. Curr Genomics 8: 113.
37. Brozinick Jr JT, McCoid SC, Reynolds TH, Wilson CM, Stevenson RW, et al.
(1997) Regulation of cell surface GLUT4 in skeletal muscle of transgenic mice.
Biochem J 321: 75–81.
38. Andersen P (1975) Capillary Density in Skeletal Muscle of Man. Acta PhysiolScand 95: 203–205. doi:10.1111/j.1748-1716.1975.tb10043.x.
39. Kaestner KH, Christy RJ, McLenithan JC, Braiterman LT, Cornelius P, et al.(1989) Sequence, tissue distribution, and differential expression of mRNA for a
putative insulin-responsive glucose transporter in mouse 3T3-L1 adipocytes.
Proc Natl Acad Sci 86: 3150–3154.
40. Mueckler M (1994) Facilitative glucose transporters. Eur J Biochem 219: 713–
725.
41. Olson AL (1996) Structure, Function, and Regulation of the Mammalian
Facilitative Glucose Transporter Gene Family. Annu Rev Nutr 16: 235–256.
42. Khan AH, Thurmond DC, Yang C, Ceresa BP, Sigmund CD, et al. (2001)Munc18c Regulates Insulin-stimulated GLUT4 Translocation to the Transverse
Tubules in Skeletal Muscle. J Biol Chem 276: 4063–4069. doi:10.1074/
jbc.M007419200.
43. Lauritzen HPMM, Galbo H, Brandauer J, Goodyear LJ, Ploug T (2008) Large
GLUT4 Vesicles Are Stationary While Locally and Reversibly Depleted DuringTransient Insulin Stimulation of Skeletal Muscle of Living Mice Imaging
Analysis of GLUT4–Enhanced Green Fluorescent Protein Vesicle Dynamics.Diabetes 57: 315–324. doi:10.2337/db06-1578.
44. Joost H, Bell GI, Best JD, Birnbaum MJ, Charron MJ, et al. (2002)Nomenclature of the GLUT/SLC2A family of sugar/polyol transport
facilitators. Am J Physiol - Endocrinol Metab 282: E974–976.
45. Hall JR, Short CE, Driedzic WR (2006) Sequence of Atlantic cod (Gadus
morhua) GLUT4, GLUT2 and GPDH: developmental stage expression, tissueexpression and relationship to starvation-induced changes in blood glucose. J Exp
Biol 209: 4490–4502.
46. Planas JV, Capilla E, Gutierrez J (2000) Molecular identification of a glucose
transporter from fish muscle. Febs Lett 481: 266–270.
47. Karasov WH, Phan D, Diamond JM, Carpenter FL (1986) Food passage and
intestinal nutrient absorption in hummingbirds. The Auk 103: 453–464.
48. Suarez RK, Lighton JRB, Moyes CD, Brown GS, Gass CL, et al. (1990) Fuel
selection in rufous hummingbirds: Ecological implications of metabolicbiochemistry. Proc Natl Acad Sci U S A 87: 9207–9210.
49. McClelland GB (2004) Fat to the fire: the regulation of lipid oxidation withexercise and environmental stress. Comp Biochem Physiol B Biochem Mol Biol
139: 443–460. doi:10.1016/j.cbpc.2004.07.003.
50. Weber J-M, Haman F (2004) Oxidative fuel selection: adjusting mix and flux to
stay alive. Integr Congr Ser 1275: 22–31.
51. Grinyer I, George JC (1969) Some observations on ultrastructure of
hummingbird pectoral muscles. Can J Zool.
52. Welch Jr KC, Altshuler DL (2009) Fiber type homogeneity of the flight
musculature in small birds. Comp Biochem Physiol B Biochem Mol Biol 152:324–331. doi:10.1016/j.cbpb.2008.12.013.
GLUT Transporters in Hummingbirds
PLOS ONE | www.plosone.org 9 October 2013 | Volume 8 | Issue 10 | e77003
53. Teerijoki H, Krasnov A, Pitkanen TL, Molsa H (2000) Cloning and
characterization of glucose transporter in teleost fish rainbow trout (Onchorhynchusmykiss). Biochim Biophys Acta - Bioenerg 1494: 290–294.
54. Caviedes-Vidal E, McWhorter TJ, Lavin SR, Chediack JG, Tracy CR, et al.
(2007) The digestive adaptation of flying vertebrates: high intestinal paracellularabsorption compensates for smaller guts. Proc Natl Acad Sci U S A 104: 19132–
19137.55. Mathieu-Costello O, Suarez RK, Hochachka PW (1992) Capillary-to-fiber
geometry and mitochondrial density in hummingbird flight muscle. Respir
Physiol 89: 113–132. doi:10.1016/0034-5687(92)90075-8.56. Suarez RK, Lighton JRB, Brown GS, Mathieu-Costello O (1991) Mitochondrial
respiration in hummingbird flight muscles. Proc Natl Acad Sci U S A 88: 4870–4873. doi:VL - 88.
57. Baker HG (1975) Sugar concentrations in nectars from hummingbird flowers.Biotropica 7: 37–41.
58. Baker HG, Baker I, Hodges SA (1998) Sugar composition of nectars and fruits
consumed by birds and bats in the tropics and subtropics. Biotropica 30: 559–586.
59. Kristiansen S, Darakhshan F, Richter EA, Hundal HS (1997) Fructose transport
and GLUT-5 protein in human sarcolemmal vesicles. Am J Physiol-Endoc M.Available: ,Go to ISI.://A1997XV09400012.
60. Zierath JR, Nolte LA, Wahlstrom E, Galuska D, Shepherd PR, et al. (1995)
Carrier-mediated fructose uptake significantly contributes to carbohydratemetabolism in human skeletal muscle. Biochem J 311: 517–521.
61. Kono T, Nishida M, Nishiki Y, Seki Y, Sato K, et al. (2005) Characterisation ofglucose transporter (GLUT) gene expression in broiler chickens. Br Poult Sci 46:
510. doi:10.1080/00071660500181289.
62. Seki Y, Sato K, Kono T, Abe H, Akiba Y (2003) Broiler chickens (Ross strain)lack insulin-responsive glucose transporter GLUT4 and have GLUT8 cDNA.
Gen Comp Endocrinol 133: 80–87.63. Seatter MJ, De La Rue SA, Porter LM, Gould GW (1998) QLS Motif in
Transmembrane Helix VII of the Glucose Transporter Family Interacts with theC-1 Position of d-Glucose and Is Involved in Substrate Selection at the Exofacial
Binding Site. Biochemistry (Mosc) 37: 1322–1326. doi:10.1021/bi972322u.
64. Carver F, Shibley I, Pennington J, Pennington S (2001) Differential expression ofglucose transporters during chick embryogenesis. Cell Mol Life Sci 58: 645–652.
GLUT Transporters in Hummingbirds
PLOS ONE | www.plosone.org 10 October 2013 | Volume 8 | Issue 10 | e77003
Related Documents