Glucose ingestion fails to inhibit hypothalamic neuronal activity in patients with type 2 diabetes mellitus Solrun Vidarsdottir 1 , Paul A.M. Smeets 2 , Diane L. Eichelsheim 1 , Matthias J.P. van Osch 3 , Max A. Viergever 2 , Johannes A. Romijn 1 , Jeroen van der Grond 3 , Hanno Pijl 1 1 Department of Endocrinology and Metabolism, Leiden University Medical Center, Leiden, The Netherlands 2 Image Sciences Institute, University Medical Center Utrecht, Utrecht, The Netherlands 3 Department of Radiology, Leiden University Medical Center, Leiden, The Netherlands Corresponding author: Hanno Pijl, MD, PhD, Department of Endocrinology and Metabolism, Leiden University Medical Center, Leiden, The Netherlands, [email protected]. Received for publication 20 February 2007 and accepted in revised form 1 July 2007. 1 Diabetes Publish Ahead of Print, published online August 1, 2007 Copyright American Diabetes Association, Inc., 2007

Welcome message from author
This document is posted to help you gain knowledge. Please leave a comment to let me know what you think about it! Share it to your friends and learn new things together.
Transcript

Glucose ingestion fails to inhibit hypothalamic neuronal activity in patients with type 2 diabetes mellitus
Solrun Vidarsdottir1, Paul A.M. Smeets2, Diane L. Eichelsheim1, Matthias J.P. van Osch3, Max A. Viergever2, Johannes A. Romijn1, Jeroen van der Grond3, Hanno Pijl1
1 Department of Endocrinology and Metabolism, Leiden University Medical Center, Leiden,
The Netherlands 2 Image Sciences Institute, University Medical Center Utrecht, Utrecht, The Netherlands 3 Department of Radiology, Leiden University Medical Center, Leiden, The Netherlands
Corresponding author: Hanno Pijl, MD, PhD,
Department of Endocrinology and Metabolism, Leiden University Medical Center,
Leiden, The Netherlands, [email protected].
Received for publication 20 February 2007 and accepted in revised form 1 July 2007.
1
Diabetes Publish Ahead of Print, published online August 1, 2007
Copyright American Diabetes Association, Inc., 2007
Abstract Objective: The hypothalamus plays a critical role in the regulation of energy balance and fuel flux. Glucose ingestion inhibits hypothalamic neuronal activity in healthy humans. We hypothesized that hypothalamic neuronal activity in response to an oral glucose load would be altered in patients with type 2 diabetes mellitus. Research Design and Methods: In this randomized, single blind, case-control study, 7 male patients with type 2 diabetes mellitus (BMI 27.9 ± 2.0 kg/m2) and 10 healthy (BMI 26.1 ± 3.2 kg/m2), age-matched men participated. Subjects were scanned twice for 38 minutes on separate days, using functional magnetic resonance imaging. After 8 min, they ingested either a glucose solution (75 g in 300 mL water) or water (300 mL). Results: Glucose ingestion resulted in a prolonged significant blood oxygen level dependent (BOLD) signal decrease in the upper and lower hypothalamus in healthy men, but not in patients with diabetes. Conclusions: Glucose ingestion fails to inhibit hypothalamic neuronal activity in patients with type 2 diabetes mellitus. Failure of neural circuits to properly adapt to nutrient ingestion may contribute to metabolic imbalance in DM2 patients.
2
The brain plays a central role in the regulation of food intake and energy balance (1). Hypothalamic- and brain stem nuclei perceive and integrate circulating metabolic (glucose, lipids) and hormonal (e.g. leptin, insulin, and various gut peptides) cues reflecting available fuel sources. Indeed, an oral glucose load acutely mitigates hypothalamic neuronal activity in healthy humans (2). Efferent neuroendocrine ensembles subsequently orchestrate food intake and fuel metabolism so as to maintain energy homeostasis (1;3). Energy imbalance and anomalous fuel flux are metabolic hallmarks of obesity and type 2 diabetes mellitus. In view of the critical role of the brain in the control of metabolism alluded to above, inappropriate hypothalamic processing of signals indicating disruption of energy homeostasis could contribute to such metabolic anomalies. We hypothesized that hypothalamic neuronal activity in response to glucose ingestion would be altered in patients with DM2, reflecting aberrant perception of current metabolic status. The blood oxygen level-dependent (BOLD) signal, recorded by functional magnetic resonance imaging (fMRI), was used as a proximate measure of neuronal activity (4). This technique detects changes in blood oxygen levels, determined by local changes in oxygen consumption, blood flow and blood volume driven by neuronal firing (5). We studied 7 male patients with DM2, who were treated with either oral glucose-lowering medication or diet alone, and 10 healthy men without family history of DM2. The characteristics of the subjects are given in Table 1. Subjects were excluded when they had poorly controlled hypertension (>160/100 mmHg), chronic renal failure or leg ulcers, any other chronic disease, and when they smoked or had a history of alcohol or drug abuse.
Glucose solution (75 gram in 300 mL of water) or 300 mL tap water were ingested after a 10h overnight fast in random order on two separate days with an interval of at least one week. As from 8 min before drinking, the hypothalamic BOLD signal was recorded for 30 minutes by fMRI on a 3.0 Tesla scanner (Philips Achieva, Philips Medical Systems, Best, The Netherlands). A T2
*-weighted echo-planar imaging (EPI) sequence (repetition time = 120 ms, echo time = 30 ms, flip angle = 30°, image matrix = 256 × 231, field of view = 208 × 208 mm, 12 signal averages/scan) was used to scan a 12-mm thick midsagittal slice. A T1-weighted anatomical scan was made of the same slice (repetition time = 550 ms, echo time = 10 ms, field of view = 208 × 208 mm). The images were pre-processed and analyzed as described previously (2), except for the use of a thalamic reference area (10 × 10 pixels, see figure 1A) instead of a reference area in the frontal cortex (which had poor image quality). For every subject, the hypothalamus was manually segmented, and divided into four regions (figure 1A) by two orthogonal axes according to predefined criteria (6): the upper anterior hypothalamus (UAH), upper posterior hypothalamus (UPH), lower anterior hypothalamus (LAH), and lower posterior hypothalamus (LPH). This was done to make the data comparable to those reported in previous publications. Figure 1B sketches relevant nuclei contained within each hypothalamic area by approximation. SPSS 12.0 (SPSS Inc, Chicago, Illinois, USA) was used for data management and statistical analysis. The baseline BOLD signal was defined as the average of signals recorded during 8 minutes prior to ingestion of test solutions. Signal changes in response to intervention were calculated per minute as % of baseline. Results are presented as mean ± SEM. Differences within groups were assessed by differential regression analysis (7). A Bonferroni-
3
corrected threshold of significance (P = 0.0013) was applied, since 38 t-tests were performed per comparison. On average it took 5.5 ± 2.4 min (both groups pooled) to ingest the glucose solution or the water. Figure 2 shows BOLD signal changes in the 4 hypothalamic regions defined by our zoning strategy. After a considerable drop, occurring during ingestion of the test solutions in both groups, the signal returned to baseline. The signal drop is an artefact, caused by swallowing and slight movements of the head during drinking. Thereafter, the BOLD signal steadily, consistently and significantly decreased in response to glucose ingestion in all regions in the control group. In contrast, glucose ingestion did not impact the BOLD signal in DM2 patients in any hypothalamic area (figure 2). Notably, the BOLD signal increased significantly in the LAH and LPH after water ingestion in DM2 patients, but not in controls. The diminution of hypothalamic BOLD signals in response to an oral glucose load that we observed in control subjects, corroborates earlier reports of similar studies in healthy humans (2;8). The identity of the neurons whose activity is suppressed by glucose ingestion, remains to be established. Hypothalamic nuclei harbour a host of distinct neuronal cell types that are involved in the control of postprandial satiety and fuel flux. These neurons respond to various circulating nutrients and hormones to guide homeostatic adjustments of food consumption and metabolism (1). For example, inhibition of neuropeptide Y (NPY) neurons in the arcuate nucleus (located in the lower posterior hypothalamic region as defined in the current study) by meal related hormones such as glucagon-like peptide 1 (GLP-1) and peptide YY (PYY) induces satiety (9;10). Moreover, this component of the gut-brain axis may reinforce insulin action
after meals to effectively inhibit endogenous glucose production and promote storage of ingested nutrients (11;12). The mechanism driving these adaptations involves other hypothalamic areas, including the paraventricular nucleus and lateral hypothalamus (figure 1B) (1). The fact that the BOLD signal did not decline in response to ingestion of glucose in diabetic subjects suggests that the hypothalamus of patients with DM2 inappropriately perceives and/or processes signals reflecting encroachment of fuel homeostasis in response to a nutrient load. In view of the critical role of the hypothalamus in the regulation of food intake and fuel flux alluded to above, such maladaptive response may have important ramifications. Thus, erroneous hypothalamic processing of metabolic and/or endocrine signals mirroring energy availability may compromise postprandial satiety in DM2 patients. Also, hypothalamic dysfunction may hamper postprandial insulin action and thereby contribute to inadequate suppression of glucose production and diminution of nutrient disposal after meals, metabolic anomalies that mark DM2. Finally, postprandial thermogenesis and energy expenditure may be abnormal in diabetic humans, as the hypothalamus is critically involved in the regulation of energy metabolism (13). Conversely, the metabolic anomalies that typify DM2 may have led to the aberrant hypothalamic response reported here. The mechanistic link between oral glucose ingestion and hypothalamic neuronal activity remains to be established. Various circulating metabolic and endocrine cues that change in response to glucose intake may be involved, including glucose, fatty acids, insulin and a number of gut peptides (13). Since DM2 is marked by abnormal postprandial plasma concentrations of virtually all of these cues, it is conceivable that the metabolic state of our patients has contributed to the failure of hypothalamic
4
neurons to properly respond to an oral glucose load. Although both circulating glucose and insulin can modulate neuronal firing in the hypothalamus (14;15), we have some evidence that neither of these cues alone contributes significantly to the hypothalamic response observed here. Indeed, maltodextrin intake does not impact on hypothalamic activity determined by fMRI, despite ensuing plasma glucose and insulin profiles similar to those in response to glucose ingestion (16). As GLP-1 secretion in response to meals is diminished in type 2 diabetes (17), and GLP-1 inhibits hypothalamic neuronal activity (18), this peptide may be one of the aberrant cues involved. However, whatever the cause of the phenomenon we have observed, given the important role of the hypothalamus in the control of metabolism, improper relay of signals by (circulating) cues supposedly compromises postprandial metabolic flux. At least 2 alternative explanations for the lack of BOLD signal response to glucose ingestion in DM2 patients should be considered here. Firstly, neurovascular coupling, i.e. the mechanism by which changes in neuronal activity regulate local cerebral blood perfusion (19), could be compromised in patients with DM2. There are no data on the influence of diabetes on neurovascular coupling to date. Importantly, normal aging, often associated
with insulin resistance, did not affect neurovascular coupling in a recent study (20). Secondly, microvascular disease, which often accompanies diabetes, may hamper hemodynamic adaptations to neural activity. However, the patients participating in our study had diabetes for only 4.7 ± 2.8 yrs, they were in good glycemic control, and they had virtually no signs of microvascular complications as only one of seven patients had microalbuminuria, and none had retinopathy. In conclusion, we report that the BOLD signal in the hypothalamus does not properly subside in response to an oral glucose load in moderately obese patients with DM2, which indicates that glucose ingestion fails to inhibit hypothalamic neuronal activity in these patients. This suggests that hypothalamic neurons of type 2 diabetic patients erroneously perceive and/or process endocrine cues reflecting nutrient availability. Since the hypothalamus coordinates metabolic and behavioural adaptations in response to these cues to maintain energy balance, hypothalamic dysfunction may hamper postprandial insulin action and compromise satiety in patients with type 2 diabetes. Acknowledgements This study was supported by the Dutch Diabetes Foundation (grant 2002.01.005).
5
Reference List 1. Morton,GJ, Cummings,DE, Baskin,DG, Barsh,GS, Schwartz,MW: Central nervous
system control of food intake and body weight. Nature 443:289-295, 2006 2. Smeets,PA, de Graaf,C, Stafleu,A, van Osch,MJ, van der,GJ: Functional MRI of
human hypothalamic responses following glucose ingestion. Neuroimage 24:363-368, 2005
3. Schwartz,MW, Porte,D, Jr.: Diabetes, obesity, and the brain. Science 307:375-379, 2005
4. Shmuel,A, Augath,M, Oeltermann,A, Logothetis,NK: Negative functional MRI response correlates with decreases in neuronal activity in monkey visual area V1. Nat Neurosci 9:569-577, 2006
5. Logothetis,NK, Pfeuffer,J: On the nature of the BOLD fMRI contrast mechanism. Magn Reson Imaging 22:1517-1531, 2004
6. Matsuda,M, Liu,Y, Mahankali,S, Pu,Y, Mahankali,A, Wang,J, DeFronzo,RA, Fox,PT, Gao,JH: Altered hypothalamic function in response to glucose ingestion in obese humans. Diabetes 48:1801-1806, 1999
7. Cho,ZH, Son,YD, Kang,CK, Han,JY, Wong,EK, Bai,SJ: Pain dynamics observed by functional magnetic resonance imaging: differential regression analysis technique. J Magn Reson Imaging 18:273-283, 2003
8. Liu,Y, Gao,JH, Liu,HL, Fox,PT: The temporal response of the brain after eating revealed by functional MRI. Nature 405:1058-1062, 2000
9. Turton,MD, O'Shea,D, Gunn,I, Beak,SA, Edwards,CM, Meeran,K, Choi,SJ, Taylor,GM, Heath,MM, Lambert,PD, Wilding,JP, Smith,DM, Ghatei,MA, Herbert,J, Bloom,SR: A role for glucagon-like peptide-1 in the central regulation of feeding. Nature 379:69-72, 1996
10. Batterham,RL, Cowley,MA, Small,CJ, Herzog,H, Cohen,MA, Dakin,CL, Wren,AM, Brynes,AE, Low,MJ, Ghatei,MA, Cone,RD, Bloom,SR: Gut hormone PYY(3-36) physiologically inhibits food intake. Nature 418:650-654, 2002
11. van den Hoek,AM, Voshol,PJ, Karnekamp,BN, Buijs,RM, Romijn,JA, Havekes,LM, Pijl,H: Intracerebroventricular neuropeptide Y infusion precludes inhibition of glucose and VLDL production by insulin. Diabetes 53:2529-2534, 2004
12. van den Hoek,AM, Heijboer,AC, Corssmit,EP, Voshol,PJ, Romijn,JA, Havekes,LM, Pijl,H: PYY3-36 reinforces insulin action on glucose disposal in mice fed a high-fat diet. Diabetes 53:1949-1952, 2004
13. Badman,MK, Flier,JS: The gut and energy balance: visceral allies in the obesity wars. Science 307:1909-1914, 2005
14. Levin,BE, Kang,L, Sanders,NM, Dunn-Meynell,AA: Role of Neuronal Glucosensing in the Regulation of Energy Homeostasis. Diabetes 55:S122-S130, 2006
15. Porte,D, Jr., Baskin,DG, Schwartz,MW: Insulin Signaling in the Central Nervous System: A Critical Role in Metabolic Homeostasis and Disease From C. elegans to Humans. Diabetes 54:1264-1276, 2005
16. Smeets,PA, de Graaf,C, Stafleu,A, van Osch,MJ, van der,GJ: Functional magnetic resonance imaging of human hypothalamic responses to sweet taste and calories. Am J Clin Nutr 82:1011-1016, 2005
17. Nauck,MA, Baller,B, Meier,JJ: Gastric inhibitory polypeptide and glucagon-like peptide-1 in the pathogenesis of type 2 diabetes. Diabetes 53 Suppl 3:S190-S196, 2004
6
18. Alvarez,E, Martinez,MD, Roncero,I, Chowen,JA, Garcia-Cuartero,B, Gispert,JD, Sanz,C, Vazquez,P, Maldonado,A, de Caceres,J, Desco,M, Pozo,MA, Blazquez,E: The expression of GLP-1 receptor mRNA and protein allows the effect of GLP-1 on glucose metabolism in the human hypothalamus and brainstem. J Neurochem 92:798-806, 2005
19. Hamel,E: Perivascular nerves and the regulation of cerebrovascular tone. J Appl Physiol 100:1059-1064, 2006
20. Rosengarten,B, Aldinger,C, Spiller,A, Kaps,M: Neurovascular coupling remains unaffected during normal aging. J Neuroimaging 13:43-47, 2003
7
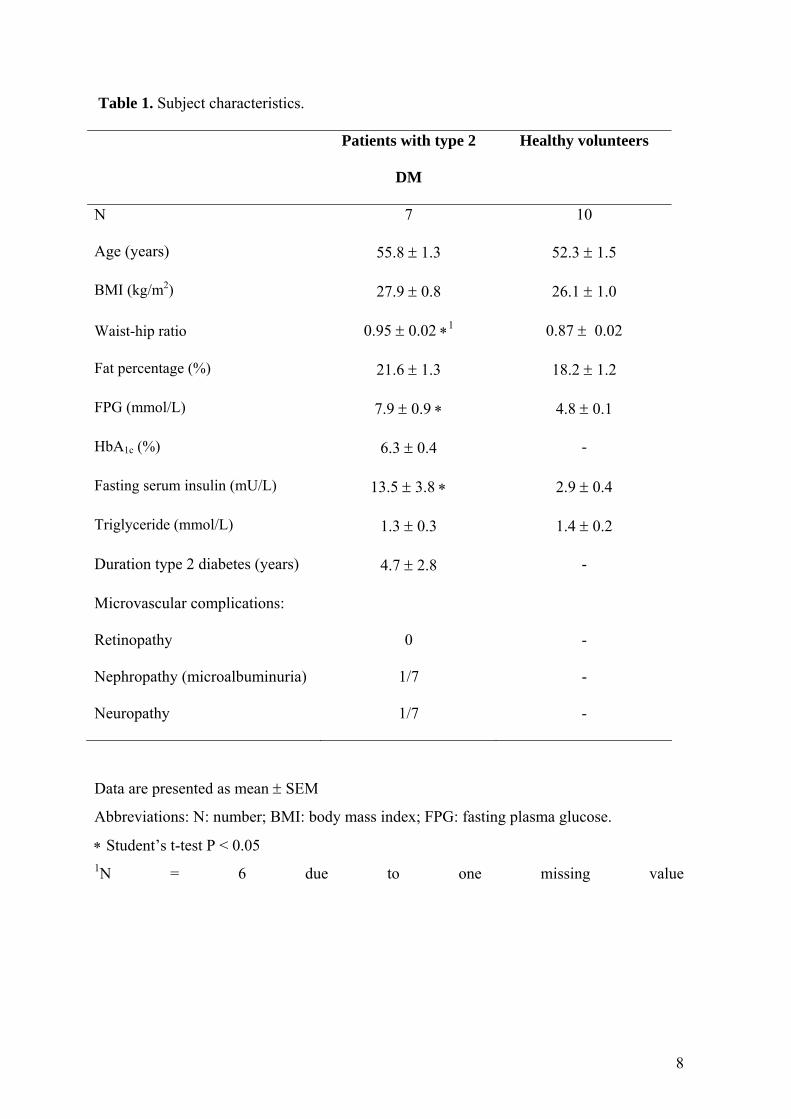
Table 1. Subject characteristics.
Patients with type 2
DM
Healthy volunteers
N 7 10
Age (years) 55.8 ± 1.3 52.3 ± 1.5
BMI (kg/m2) 27.9 ± 0.8 26.1 ± 1.0
Waist-hip ratio 0.95 ± 0.02 ∗1 0.87 ± 0.02
Fat percentage (%) 21.6 ± 1.3 18.2 ± 1.2
FPG (mmol/L) 7.9 ± 0.9 ∗ 4.8 ± 0.1
HbA1c (%) 6.3 ± 0.4 -
Fasting serum insulin (mU/L) 13.5 ± 3.8 ∗ 2.9 ± 0.4
Triglyceride (mmol/L) 1.3 ± 0.3 1.4 ± 0.2
Duration type 2 diabetes (years) 4.7 ± 2.8 -
Microvascular complications:
Retinopathy 0 -
Nephropathy (microalbuminuria) 1/7 -
Neuropathy 1/7 -
Data are presented as mean ± SEM
Abbreviations: N: number; BMI: body mass index; FPG: fasting plasma glucose.
∗ Student’s t-test P < 0.05 1N = 6 due to one missing value
8
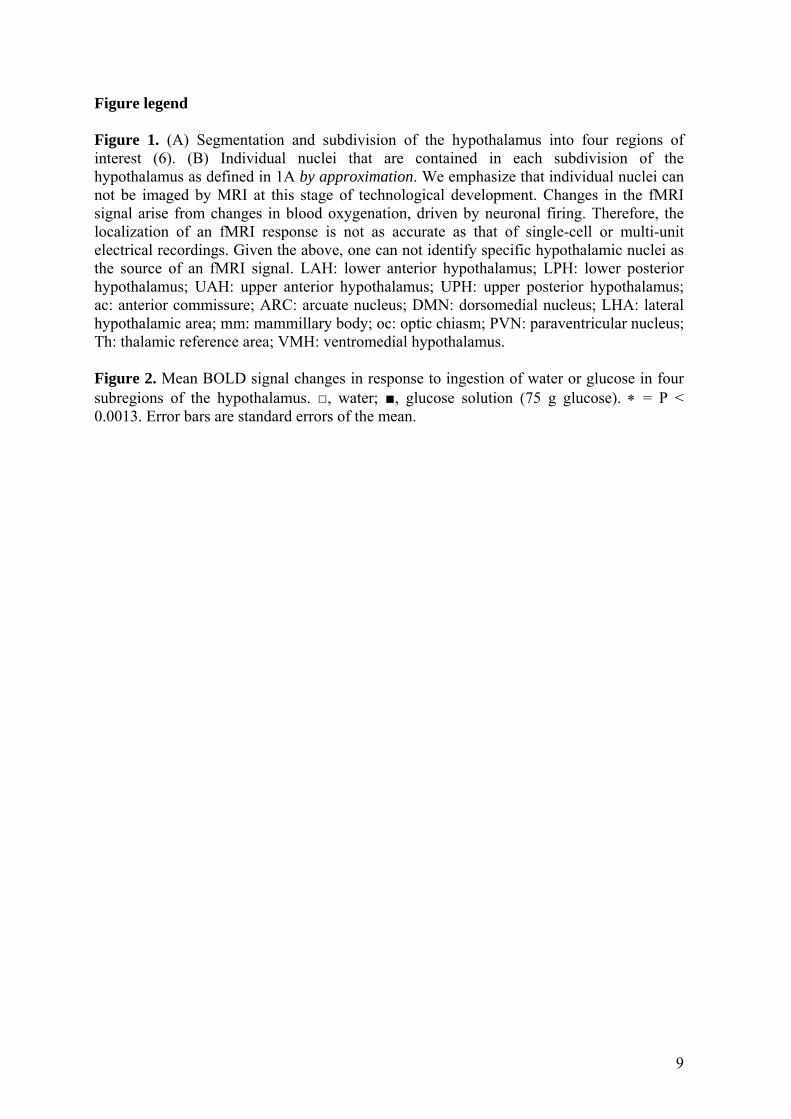
Figure legend Figure 1. (A) Segmentation and subdivision of the hypothalamus into four regions of interest (6). (B) Individual nuclei that are contained in each subdivision of the hypothalamus as defined in 1A by approximation. We emphasize that individual nuclei can not be imaged by MRI at this stage of technological development. Changes in the fMRI signal arise from changes in blood oxygenation, driven by neuronal firing. Therefore, the localization of an fMRI response is not as accurate as that of single-cell or multi-unit electrical recordings. Given the above, one can not identify specific hypothalamic nuclei as the source of an fMRI signal. LAH: lower anterior hypothalamus; LPH: lower posterior hypothalamus; UAH: upper anterior hypothalamus; UPH: upper posterior hypothalamus; ac: anterior commissure; ARC: arcuate nucleus; DMN: dorsomedial nucleus; LHA: lateral hypothalamic area; mm: mammillary body; oc: optic chiasm; PVN: paraventricular nucleus; Th: thalamic reference area; VMH: ventromedial hypothalamus. Figure 2. Mean BOLD signal changes in response to ingestion of water or glucose in four subregions of the hypothalamus. □, water; ■, glucose solution (75 g glucose). ∗ = P < 0.0013. Error bars are standard errors of the mean.
9
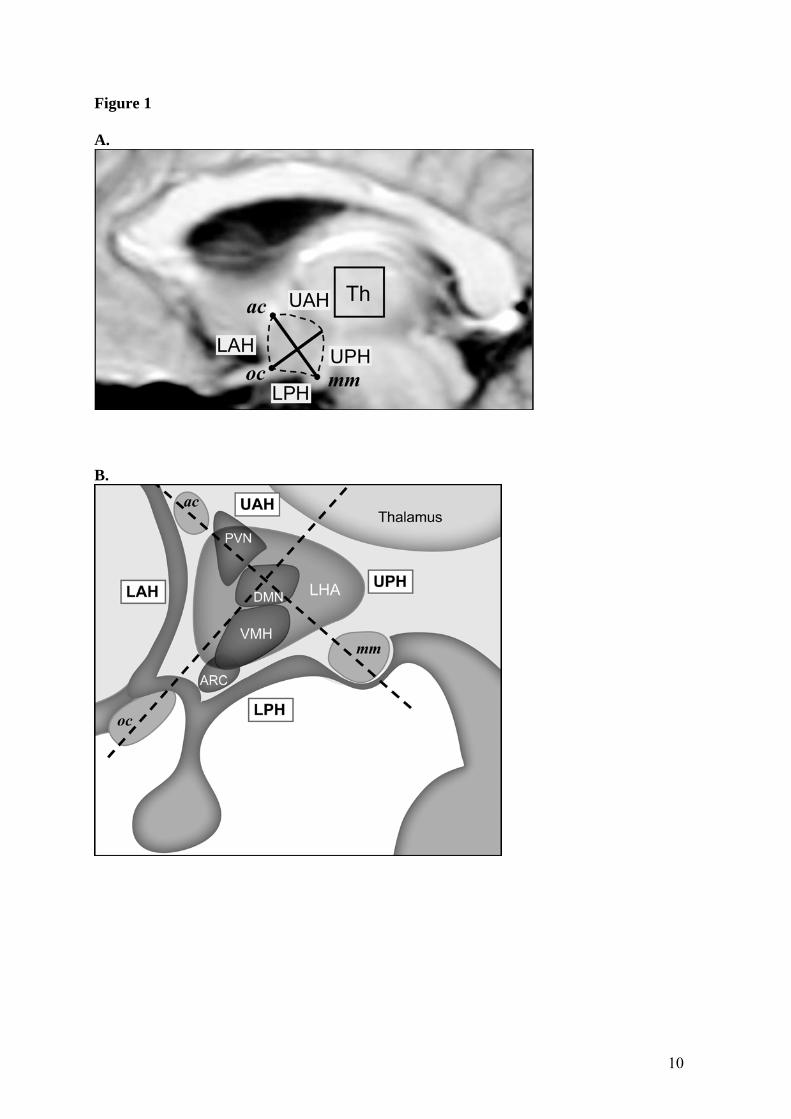
Figure 1 A.
B.
10
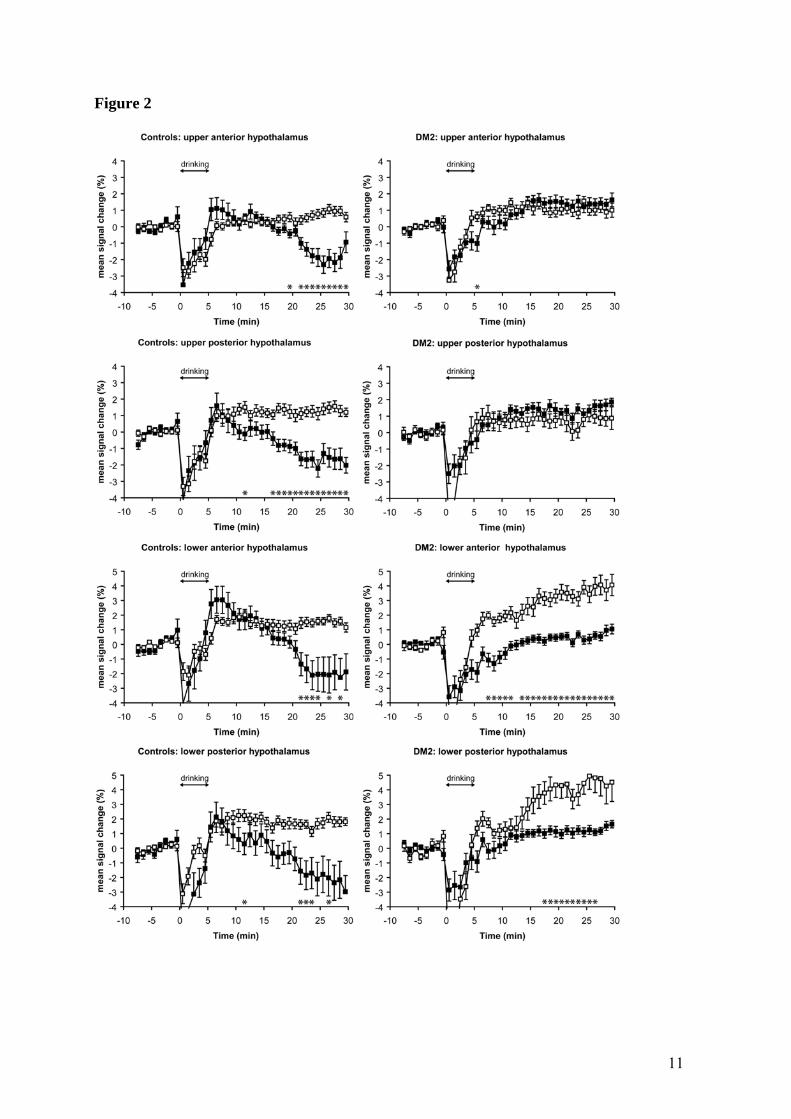
Figure 2
11
Related Documents