Thesis for doctoral degree (Ph.D.) 2008 Glucose and Ketone Body Metabolism – with emphasis on Ketotic Hypoglycemia Jenny Alkén Thesis for doctoral degree (Ph.D.) 2008 Jenny Alkén Glucose and Ketone Body Metabolism – with emphasis on Ketotic Hypoglycemia

Welcome message from author
This document is posted to help you gain knowledge. Please leave a comment to let me know what you think about it! Share it to your friends and learn new things together.
Transcript
Thesis for doctoral degree (Ph.D.)2008
Glucose and Ketone Body Metabolism – with emphasis on Ketotic Hypoglycemia
Jenny Alkén
Thesis for doctoral degree (Ph.D.) 2008
Jenny Alkén
Glu
cose and K
etone B
ody Metabolism
– with
emph
asis on K
etotic Hyp
oglycemia

From DEPARTMENT of CLINICAL SCIENCE, INTERVENTION AND TECHNOLOGY (CLINTEC), DIVISION OF PEDIATRICS
Karolinska Institutet, Stockholm, Sweden
GLUCOSE AND KETONE BODY METABOLISM – WITH
EMPHASIS ON KETOTIC HYPOGLYCEMIA
Jenny Alkén
Stockholm 2008

2008
Gårdsvägen 4, 169 70 Solna
Printed by
All previously published papers were reproduced with permission from the publisher.
Published by Karolinska Institutet. © Jenny Alkén, 2008ISBN 978-91-7357-502-7

Till Morfar, för din osvikliga tro på min förmåga

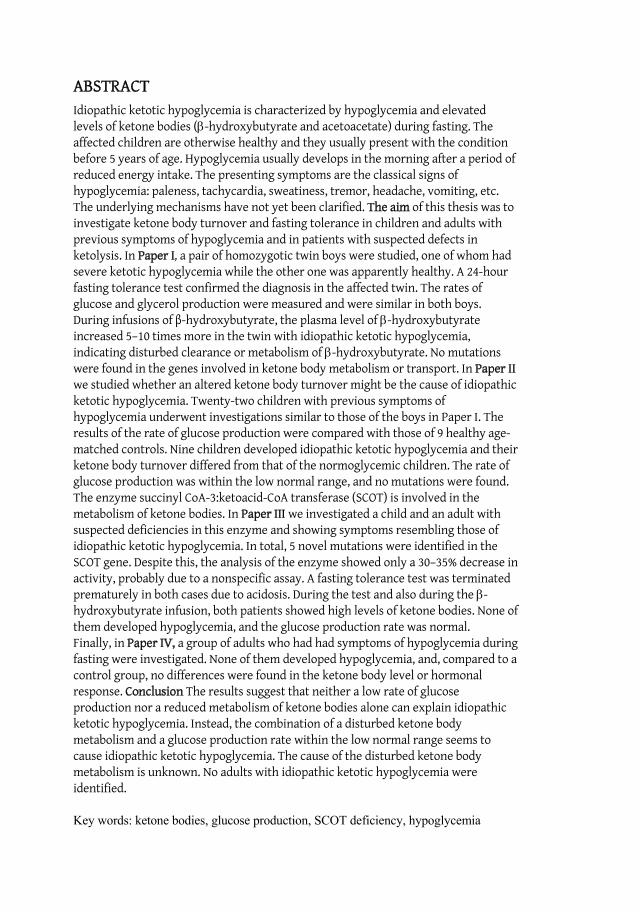
ABSTRACT Idiopathic ketotic hypoglycemia is characterized by hypoglycemia and elevated levels of ketone bodies ( -hydroxybutyrate and acetoacetate) during fasting. The affected children are otherwise healthy and they usually present with the condition before 5 years of age. Hypoglycemia usually develops in the morning after a period of reduced energy intake. The presenting symptoms are the classical signs of hypoglycemia: paleness, tachycardia, sweatiness, tremor, headache, vomiting, etc. The underlying mechanisms have not yet been clarified. The aim of this thesis was to investigate ketone body turnover and fasting tolerance in children and adults with previous symptoms of hypoglycemia and in patients with suspected defects in ketolysis. In Paper I, a pair of homozygotic twin boys were studied, one of whom had severe ketotic hypoglycemia while the other one was apparently healthy. A 24-hour fasting tolerance test confirmed the diagnosis in the affected twin. The rates of glucose and glycerol production were measured and were similar in both boys. During infusions of -hydroxybutyrate, the plasma level of -hydroxybutyrate increased 5–10 times more in the twin with idiopathic ketotic hypoglycemia, indicating disturbed clearance or metabolism of -hydroxybutyrate. No mutations were found in the genes involved in ketone body metabolism or transport. In Paper IIwe studied whether an altered ketone body turnover might be the cause of idiopathic ketotic hypoglycemia. Twenty-two children with previous symptoms of hypoglycemia underwent investigations similar to those of the boys in Paper I. The results of the rate of glucose production were compared with those of 9 healthy age-matched controls. Nine children developed idiopathic ketotic hypoglycemia and their ketone body turnover differed from that of the normoglycemic children. The rate of glucose production was within the low normal range, and no mutations were found. The enzyme succinyl CoA-3:ketoacid-CoA transferase (SCOT) is involved in the metabolism of ketone bodies. In Paper III we investigated a child and an adult with suspected deficiencies in this enzyme and showing symptoms resembling those of idiopathic ketotic hypoglycemia. In total, 5 novel mutations were identified in the SCOT gene. Despite this, the analysis of the enzyme showed only a 30–35% decrease in activity, probably due to a nonspecific assay. A fasting tolerance test was terminated prematurely in both cases due to acidosis. During the test and also during the -hydroxybutyrate infusion, both patients showed high levels of ketone bodies. None of them developed hypoglycemia, and the glucose production rate was normal. Finally, in Paper IV, a group of adults who had had symptoms of hypoglycemia during fasting were investigated. None of them developed hypoglycemia, and, compared to a control group, no differences were found in the ketone body level or hormonal response. Conclusion The results suggest that neither a low rate of glucose production nor a reduced metabolism of ketone bodies alone can explain idiopathic ketotic hypoglycemia. Instead, the combination of a disturbed ketone body metabolism and a glucose production rate within the low normal range seems to cause idiopathic ketotic hypoglycemia. The cause of the disturbed ketone body metabolism is unknown. No adults with idiopathic ketotic hypoglycemia were identified.
Key words: ketone bodies, glucose production, SCOT deficiency, hypoglycemia

Like what you do – do what you like
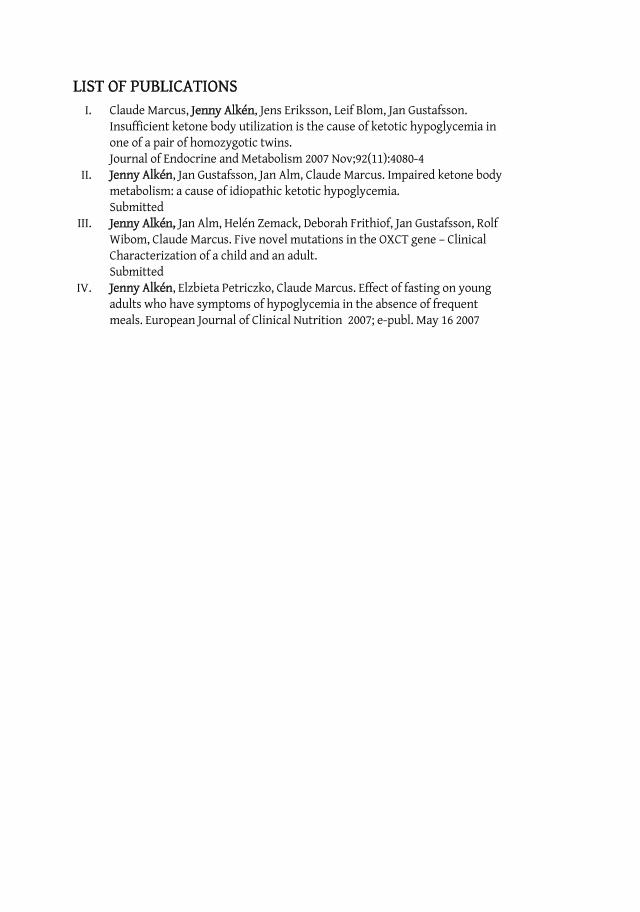
LIST OF PUBLICATIONS I. Claude Marcus, Jenny Alkén, Jens Eriksson, Leif Blom, Jan Gustafsson.
Insufficient ketone body utilization is the cause of ketotic hypoglycemia in one of a pair of homozygotic twins. Journal of Endocrine and Metabolism 2007 Nov;92(11):4080-4
II. Jenny Alkén, Jan Gustafsson, Jan Alm, Claude Marcus. Impaired ketone body metabolism: a cause of idiopathic ketotic hypoglycemia. Submitted
III. Jenny Alkén, Jan Alm, Helén Zemack, Deborah Frithiof, Jan Gustafsson, Rolf Wibom, Claude Marcus. Five novel mutations in the OXCT gene – Clinical Characterization of a child and an adult. Submitted
IV. Jenny Alkén, Elzbieta Petriczko, Claude Marcus. Effect of fasting on young adults who have symptoms of hypoglycemia in the absence of frequent meals. European Journal of Clinical Nutrition 2007; e-publ. May 16 2007
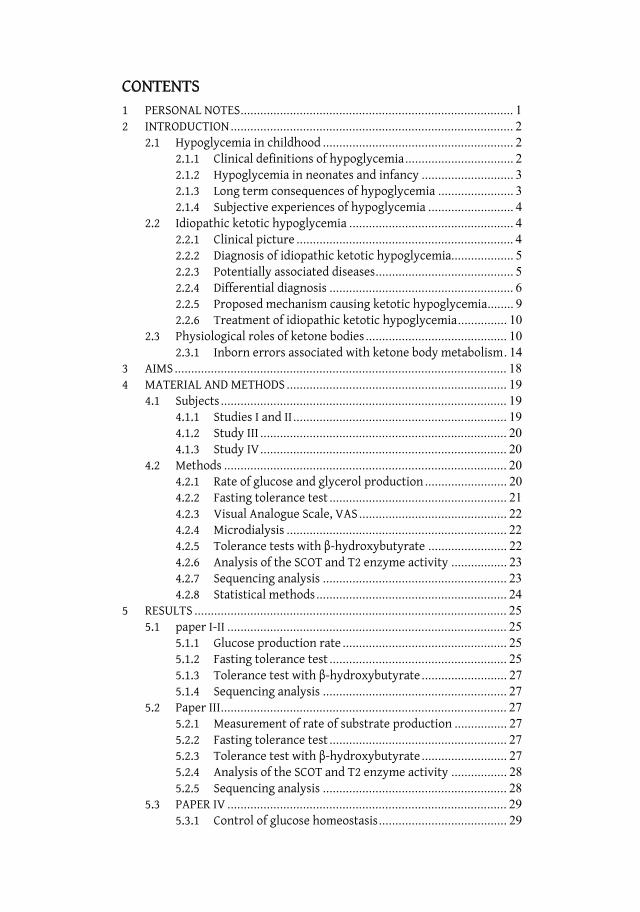
CONTENTS 1 PERSONAL NOTES................................................................................... 1 2 INTRODUCTION ...................................................................................... 2
2.1 Hypoglycemia in childhood .......................................................... 2 2.1.1 Clinical definitions of hypoglycemia ................................. 2 2.1.2 Hypoglycemia in neonates and infancy ............................ 3 2.1.3 Long term consequences of hypoglycemia ....................... 3 2.1.4 Subjective experiences of hypoglycemia .......................... 4
2.2 Idiopathic ketotic hypoglycemia .................................................. 4 2.2.1 Clinical picture .................................................................. 4 2.2.2 Diagnosis of idiopathic ketotic hypoglycemia................... 5 2.2.3 Potentially associated diseases.......................................... 5 2.2.4 Differential diagnosis ........................................................ 6 2.2.5 Proposed mechanism causing ketotic hypoglycemia........ 9 2.2.6 Treatment of idiopathic ketotic hypoglycemia............... 10
2.3 Physiological roles of ketone bodies ........................................... 10 2.3.1 Inborn errors associated with ketone body metabolism. 14
3 AIMS ..................................................................................................... 18 4 MATERIAL AND METHODS ................................................................... 19
4.1 Subjects ....................................................................................... 19 4.1.1 Studies I and II ................................................................. 19 4.1.2 Study III ........................................................................... 20 4.1.3 Study IV........................................................................... 20
4.2 Methods ...................................................................................... 20 4.2.1 Rate of glucose and glycerol production ......................... 20 4.2.2 Fasting tolerance test ...................................................... 21 4.2.3 Visual Analogue Scale, VAS ............................................. 22 4.2.4 Microdialysis ................................................................... 22 4.2.5 Tolerance tests with -hydroxybutyrate ........................ 22 4.2.6 Analysis of the SCOT and T2 enzyme activity ................. 23 4.2.7 Sequencing analysis ........................................................ 23 4.2.8 Statistical methods .......................................................... 24
5 RESULTS ............................................................................................... 25 5.1 paper I-II ..................................................................................... 25
5.1.1 Glucose production rate .................................................. 25 5.1.2 Fasting tolerance test ...................................................... 25 5.1.3 Tolerance test with -hydroxybutyrate .......................... 27 5.1.4 Sequencing analysis ........................................................ 27
5.2 Paper III....................................................................................... 27 5.2.1 Measurement of rate of substrate production ................ 27 5.2.2 Fasting tolerance test ...................................................... 27 5.2.3 Tolerance test with -hydroxybutyrate .......................... 27 5.2.4 Analysis of the SCOT and T2 enzyme activity ................. 28 5.2.5 Sequencing analysis ........................................................ 28
5.3 PAPER IV ..................................................................................... 29 5.3.1 Control of glucose homeostasis....................................... 29
5.3.2 Subjective experience ..................................................... 30 6 GENERAL DISCUSSION.......................................................................... 31
6.1 Population and prevalence ......................................................... 31 6.2 Methodological considerations .................................................. 31
6.2.1 Measurement of energy substrate turnover ................... 31 6.2.2 Measurements of ketone body kinetics .......................... 32
6.3 SCOT deficiency in children and adults ...................................... 33 6.4 Mechanism of idiopathic ketotic hypoglycemia......................... 35
6.4.1 Energy expenditure......................................................... 35 6.4.2 Rate of glucose production ............................................. 35 6.4.3 Alterations in ketone body turnover .............................. 38 6.4.4 Fetal programming ......................................................... 42
6.5 Limitations.................................................................................. 42 6.6 Idiopathic ketotic hypoglycemia, course of clinical events........ 43 6.7 General Conclusions ................................................................... 43
7 Sammanfattning (Summary in Swedish) ............................................. 45 8 Acknowledgements.............................................................................. 47 9 References............................................................................................ 49
LIST OF ABBREVIATIONS
ANOVA Analysis of Variance ATP Adenosine Tri Phosphate BMI Body Mass Index BMISDS Body Mass Index Standard Deviation Score CNS Central Nervous System CoA Coenzyme A DNA Deoxyribonucleic acid FFA Free Fatty Acid HMG 3-hydroxy-3-metylglytaric acid GH Growth Hormone GPR Glucose Production Rate IUGR Intra Uterine Growth Retardation LCAD Long-chain Acyl-CoA dehydrogenase MCAD Medium-chain acyl-CoA dehydrogenase MCT Monocarboxylate transporters T2 Acetoacetyle-CoA thiolase SCOT Succinyl-CoA 3:ketoacid transferase SD Standard Deviation SGA Small for Gestational Age VAS Visual Analogue Scale

1
1 PERSONAL NOTES
My first introduction to the scientific world started during my career as a nurse in a pediatric endocrine department. I was involved in different kinds of scientific projects at the clinic with widely varying aims, but nearly all of them having an endocrine or metabolic perspective and the vast majority involving microdialysis. During those years I found myself being engaged in the planning, performance, data collecting and evaluation of several projects and studies. As time went on I expanded my knowledge in the area, learning more about pediatric endocrinology and metabolism but also got the insight into how much more there was left to learn and to explore.
In spring 2000 my former director and present supervisor asked me if I wanted to focus on a project of my own, giving me several possible projects to consider. Since I just had been involved in an investigation of two enchanting twin brothers and the mysterious connection with the elusive ketone bodies the choice was not hard to make. At that point I saw the project from a pure clinic view and could not imagine the prospective and development of the project I had a head. With the background of not being so interested in chemistry in high school I must say I am rather surprised that I ended up with a project like this.
During this time I also have changed my direction when it comes to my personal career. That same fall I started my training to become a medical doctor at Karolinska Institutet. Combing these two things, university studies and science with extra work and social life has been a true challenge. Despite the logistic problems, the long nights at the hospital, the guilty conscience about always being at the wrong place and the from time to time minimum of spare time I have never regretted my choice.
2
2 INTRODUCTION
2.1 HYPOGLYCEMIA IN CHILDHOOD
Hypoglycemia is one of the most common metabolic derangements in the pediatric population [1] and if not diagnosed, severe and repeated periods can lead to irreversible brain damage [2] making early diagnosis and treatment highly important. Humans have several options for providing sufficient energy during periods of fasting such as gluconeogenesis, glycogenolysis and lipolysis, all aimed at securing a flow of energy substrates to demanding tissues, with the highest priority being to the brain. Due to a reduced capacity for energy storage i.e. smaller muscle and fat mass, children develop hypoglycemia more rapidly than adults, who can tolerate fasting for an extended period of time. Furthermore, children have a higher energy turnover and the energy stores are depleted more rapidly.
Hypoglycemia in children is a well-described metabolic condition with a number of complex aspects to consider. First, several different diseases expose hypoglycemia in the clinical picture, and secondly symptoms of hypoglycemia are not always obvious, and especially not in early childhood. Additionally, despite numerous methods to determine glucose concentrations, when the level of glucose is decreasing, on reaching the lower levels, the less sensitive the methods become [3].
Several endocrine or metabolic diseases present with hypoglycemia and must be considered during the investigation: hormone deficiencies, glycogen storage diseases, tumors, hyperinsulinemia, galactosemia, fructose intolerance, and fatty acid oxidation defects among others [4, 5]. Furthermore, in a broader perspective, infections as well as intake of medications and alcohol must be excluded. However, ketotic hypoglycemia is considered the most common form of hypoglycemia after infancy [6-8].
2.1.1 Clinical definitions of hypoglycemia
There are different ways to approach the term hypoglycemia, i.e. to identify glucose concentrations that will cause brain damage, or to define a level of plasma glucose that most individuals maintain most of the time [5]. The latter definition is predominantly for the adult population in which the regulation of glucose concentrations is more stable.
For a long time in pediatrics, different glucose concentrations have been used to define hypoglycemia depending if the newborn child is term or preterm, or if the child is an infant or older. However, it has now generally agreed that a glucose concentration below 2.6 mmol/L for all children is deleterious to the brain [9, 10]. With a better knowledge of the long-term effects of repeated and severe periods of hypoglycemia clinical investigations are carefully supervised.
Reduced plasma glucose in older infants, children and adults initially results in autonomic symptoms such as tremor, anxiety, sweating and hunger, which are
3
clinical signs of adrenergic origin. This reaction is defined autonomic and includes the hormonal response of glucagon, epinephrine and GH [11, 12]. There is a correlation between the degree of plasma glucose reduction and the counterregulatory response and the first signs are observed when plasma glucose levels reach approximately 3.7 mmol/L. If the concentration of glucose continues to decline and the inflow of glucose to the brain diminishes neuroglycopenic symptoms such as lethargy, confusion, blurred vision and impaired coordination appear. Despite divergences in the literature concerning the crucial lower limit it has been shown that impaired cognition can be observed as early as at plasma glucose levels of 2.7 mmol/L [13].
2.1.2 Hypoglycemia in neonates and infancy
Hypoglycemia during the neonatal period and infancy is a complex condition since glucose homeostasis in newborns differs from that in children and adults [4]. During fasting blood glucose decreases significantly in infants while adults seldom become hypoglycemia despite extended periods of fasting [14]. It has been demonstrated in neonates that glucose concentrations vary over a wide range during the day and in between feedings [15]. Consequently, a single sample showing a glucose level in the lower range does not necessarily reflect a hypoglycemic attack. However, if the glucose concentration continues to remain low, or is recurrent, symptomatic treatment must be started promptly. Also, symptoms in neonates may not be that pronounced and in combination with the lack of verbal communication hypoglycemia may be present without being documented. The typical neuroglucopenic or adrenergic symptoms seen in the adult are seldom seen in neonates. Instead, neonates and newborns usually present with irritability, feeding difficulties, lethargy, cyanosis, tachypnea, and/or hypothermia [16]. Neurological symptoms whether present or absent, are not a conclusive sign of hypoglycemia in terms of glucose concentration, and especially not in neonates [9] in whom it has been shown that with a glucose concentration below 2.6 mmol/L clinical symptoms of hypoglycemia were present in half of the investigated neonates, but the frequency of clinical symptoms was the same [10]. Consequently, when a hypoglycemic disorder is suspected, on any ground, a thorough investigation must be initiated.
2.1.3 Long term consequences of hypoglycemia
Studies on diabetic patients have identified risks for brain damage as a result of extended periods of hypoglycemia [17]. It has been shown that more than three episodes of severe hypoglycemia (defined as events with severe neurological dysfunction, such as seizure, loss of consciousness or inability to be aroused from sleep, and those that required assistance in the treatment) before the age of five have an impact on the spatial response performance [18]. However, it has been reported that even in the acute phase of hypoglycemia impairment of the cognitive function might occur, and this despite the glucose concentration having only declined to around 3 mmol/L [19].
It has been shown in animal studies that sustained hypoglycemia leads to neuronal necrosis and subsequent loss of dendrites. When measuring sensory evoked potentials in children abnormalities were found when glucose concentrations fell
4
below 2.6 mmol/L and these findings were apparent regardless of the presence of symptoms or not [9]. Severe neonatal hypoglycemia is associated with affected neurodevelopment [20] such as loss of vision. Using modern technology it has been demonstrated that the most affected area is the occipital lobes [21].
2.1.4 Subjective experiences of hypoglycemia
The subjective feelings and experiences when decreases in plasma glucose occur are usually associated with the release of epinephrine. Despite the fact that they are otherwise perfectly healthy there are individuals who have symptoms of hypoglycemia from time to time, an experience they find very unpleasant and sometimes worrying. Regardless of the origin of hypoglycemia the sensation of tachycardia, cold sweatiness and nausea, all being symptoms of declining plasma glucose are obviously experienced differently from person to person. It has been reported that around 22 % in a healthy population developed hypoglycemia defined as plasma glucose levels below 3.3 mmol/L [22].
2.2 IDIOPATHIC KETOTIC HYPOGLYCEMIA
2.2.1 Clinical picture
First reported in 1924 idiopathic ketotic hypoglycemia has been a puzzle for pediatricians ever since. The primary description of a child with recurrent vomiting was aimed at clarifying the relationship between ketone bodies and concentrations of blood sugar. The investigation included a fasting tolerance test followed by a ketogenic diet to provoke ketosis [23]. Follow-up reports were few in number until the end of the 1960s when ketotic hypoglycemia became an object of interest, and again during more recent years, increasing attention has been given to idiopathic ketotic hypoglycemia [6, 24-26]. Despite repeated investigations and several proposed theories the complete mechanism causing idiopathic ketotic hypoglycemia is yet not fully understood.
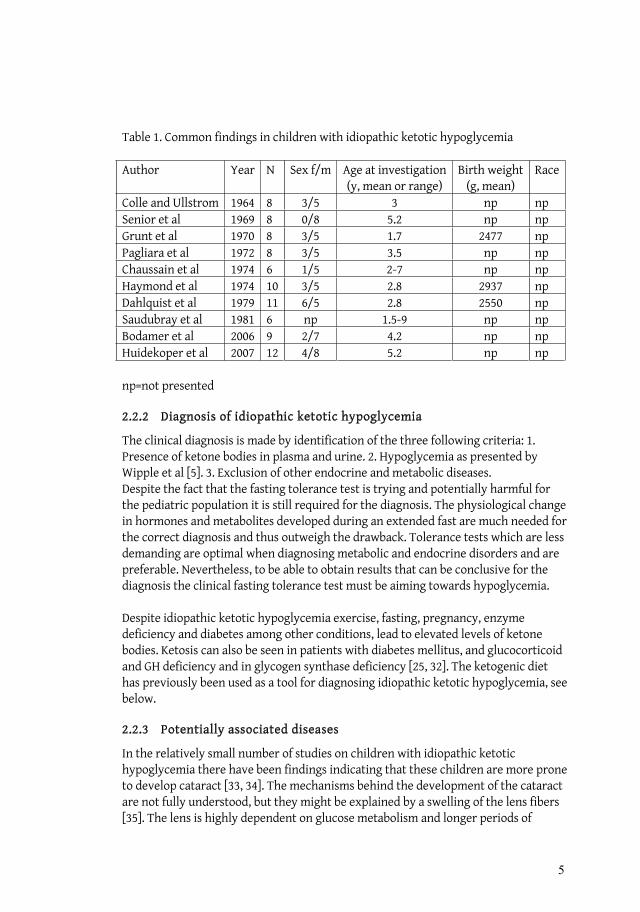
The child who develops idiopathic ketotic hypoglycemia is often described as a male, Caucasian, small for weight and height (SGA) and having more often been exposed to prenatal stress [27-31]. Hypoglycemia usually develops in the morning after a period with reduced energy intake, and often after a period of increased physical activity. The presenting symptoms are the classical ones of hypoglycemia; paleness, tachycardia, sweatiness, tremor, blurred vision, difficulties in concentration, headache etc. The child is usually younger than 5 years old and symptoms are rarely seen before the age of one [31]. The typical high-risk period seems to be at 28-30 months. Clinical findings based on studies comprising more than one patient are presented in Table 1. Even though the severity differs considerably among the affected children they appear to be healthy between the hypoglycemic attacks. The frequency of hypoglycemic attacks decline with age and hypoglycemia seldom develops after the age of ten. It is not known if the disease relapses spontaneously or if maturation and increased awareness of the symptoms diminish the frequency of the hypoglycemic periods.
5
Table 1. Common findings in children with idiopathic ketotic hypoglycemia
Author Year N Sex f/m Age at investigation(y, mean or range)
Birth weight (g, mean)
Race
Colle and Ullstrom 1964 8 3/5 3 np np Senior et al 1969 8 0/8 5.2 np np Grunt et al 1970 8 3/5 1.7 2477 np Pagliara et al 1972 8 3/5 3.5 np np Chaussain et al 1974 6 1/5 2-7 np np Haymond et al 1974 10 3/5 2.8 2937 np Dahlquist et al 1979 11 6/5 2.8 2550 np Saudubray et al 1981 6 np 1.5-9 np np Bodamer et al 2006 9 2/7 4.2 np np Huidekoper et al 2007 12 4/8 5.2 np np
np=not presented
2.2.2 Diagnosis of idiopathic ketotic hypoglycemia
The clinical diagnosis is made by identification of the three following criteria: 1. Presence of ketone bodies in plasma and urine. 2. Hypoglycemia as presented by Wipple et al [5]. 3. Exclusion of other endocrine and metabolic diseases. Despite the fact that the fasting tolerance test is trying and potentially harmful for the pediatric population it is still required for the diagnosis. The physiological change in hormones and metabolites developed during an extended fast are much needed for the correct diagnosis and thus outweigh the drawback. Tolerance tests which are less demanding are optimal when diagnosing metabolic and endocrine disorders and are preferable. Nevertheless, to be able to obtain results that can be conclusive for the diagnosis the clinical fasting tolerance test must be aiming towards hypoglycemia.
Despite idiopathic ketotic hypoglycemia exercise, fasting, pregnancy, enzyme deficiency and diabetes among other conditions, lead to elevated levels of ketone bodies. Ketosis can also be seen in patients with diabetes mellitus, and glucocorticoid and GH deficiency and in glycogen synthase deficiency [25, 32]. The ketogenic diet has previously been used as a tool for diagnosing idiopathic ketotic hypoglycemia, see below.
2.2.3 Potentially associated diseases
In the relatively small number of studies on children with idiopathic ketotic hypoglycemia there have been findings indicating that these children are more prone to develop cataract [33, 34]. The mechanisms behind the development of the cataract are not fully understood, but they might be explained by a swelling of the lens fibers [35]. The lens is highly dependent on glucose metabolism and longer periods of

6
elevated concentrations of glucose, as seen in diabetes mellitus may have adverse effects on the lens [36]. Cataract is also seen in patients suffering from asphyxia during childbirth, but this connection is part of the clinical picture of brain damage [37]. The development of cataract appears to be closely connected to the energy metabolism in the lens since the development is connected with diseases such as diabetes, galactosemia and galactokinase deficiency [38] The incidence of cataract in children with galactosemia is estimated to be as high as 50 %. A known risk factor is also congenital rubella [39]. Still, in about 10 %, the etiology of the development of cataract is known, although in the majority of the cases, the cause is unknown. An ophthalmic examination might be considered during the full investigation of children with idiopathic ketotic hypoglycemia.
The prevalence of allergic diseases might also be higher [40] among children with idiopathic ketotic hypoglycemia. Ten out of 18 patients with idiopathic ketotic hypoglycemia also had some form of allergy disease treated with diet elimination; bronchial asthma and atopic dermatitis were present in half of the cases. The allergic component in these children could be a consequence of nutritional influence during fetal life. In addition this may lead to a child with a suboptimal nutritional status and a concomitant vulnerability to fasting. Malnutrition is not an obvious finding among these children, but children with idiopathic ketotic hypoglycemia are more often lean or small [30, 41].
2.2.4 Differential diagnosis
2.2.4.1 GH deficiency
Plasma concentrations of GH vary during fasting as a response to the decreasing concentrations of glucose. GH deficiency is often present with hypoglycemia, and the diagnosis should always be ruled out when investigating children with hypoglycemia of unknown etiology. Deficiency of GH has been suggested to be involved in the mechanism of idiopathic ketotic hypoglycemia but repeated investigations have ruled out this explanation [42, 43].
2.2.4.2 Insufficient adrenergic response
The natural response to decreasing plasma glucose is excretion of catecholamine to trigger the gluconeogenetic pathway. An inadequate release of epinephrine has been one of the hypotheses for ketotic hypoglycemia in childhood leading to insufficient substrates for gluconeogenesis [44]. It has previously been shown that in a rather small population of children with ketotic hypoglycemia there was inadequate excretion of catecholamines in response to hypoglycemia [45]. However, no follow-up studies have confirmed these data and it might be regarded as a single observation of another biochemical mechanism of limited relevance to the understanding of idiopathic ketotic hypoglycemia.
In patients with diabetes mellitus repeated attacks of hypoglycemia may lead to the development of a syndrome called “hypoglycemia unawareness”. It is caused by a lowered threshold of catecholamine secretion, i.e. the response to mild hypoglycemia does not occur until the glucose concentration is even lower [46]. Symptoms of

7
hypoglycemia such as sweating, tremor, and weakness are not detected as early as in healthy individuals. The syndrome is worse in patients with frequent episodes of hypoglycemia.
2.2.4.3 Hyperinsulinemia
During infancy and childhood hyperinsulinemia is the most common cause of recurrent hypoglycemia [47]. The abnormal insulin secretion from the pancreas results in inhibition of lipolysis, and consequently the affected children present with low levels of fatty acids and ketone bodies in combination with hypoglycemia [48]. The hyperinsulinemic children are at high risk of brain damage since no alternative fuel such as ketone bodies is available.
2.2.4.4 Insufficient secretion of cortisol
Plasma cortisol levels follow a diurnal rhythm with high levels in the morning. Cortisol is an important counterregulatory hormone and hypoglycemia is common in hypocortisolism. Conversely, high cortisol plasma levels are expected during hypoglycemia and an inverse correlation between plasma cortisol and blood sugar during fasting has been demonstrated [42].
2.2.4.5 Inborn errors of metabolism associated with hypoglycemia
Diseases classified as inborn errors of metabolism often present with hypoglycemia in the neonatal or infancy period. Most of them are genetically inherited in a recessive order and less than 20 of the around 100 different diseases are treatable [49]. The diseases can be divided into three major groups. The first two include disorders involving complex molecules such as lysosomal and peroxisomal disorders, and disorders that lead to accumulation of toxic compounds (congenital urea cycle defects and sugar intolerances). The third group consists of diseases involved in energy production and utilization and usually presents with hypoglycemia. Diseases included in this latter group are glycogenosis, defects in gluconeogenesis, congenital lactic acidemias and disorders of fatty acid oxidation. Other common symptoms are failure to thrive, hyperlactacidemia, myopathy, arrhythmias, conduction defects and severe hypotonia [49].
2.2.4.5.1 Disorders of fatty acid oxidation,
Dietary fatty acids are oxidized by the liver to form ketone bodies, which can be used by other tissues than the liver. Common symptoms of fat oxidation disorders are recurrent hypoglycemia, cardiomyopathy, hypotonia, muscle weakness, retinopathy and cardiac arrhythmias [50]. Screening of newborns with tandem mass spectrometry makes early diagnosis and treatment possible for more than 30 diseases involving the metabolism of fatty acids and amino acids.
Medium-chain acyl-CoA dehydrogenase deficiency (MCAD) is the most common defect of fatty acid oxidation and the incidence is 1:80,000, predominantly in Caucasians in Northwestern Europe [51]. Children suffering from MCAD have an inability to break down medium-chained fatty acids, and accumulation of the compounds takes place in the liver and brain. Clinical symptoms are lethargy,
8
vomiting, hepatomegaly, respiratory arrest, seizures, apnea and cardiac arrest [52] and they are usually induced by catabolic stress. Failure to compensate for the hypoketotic hypoglycemia can lead to severe neurological damage. The mean age for presentation is 12 months, but in some cases the key feature hypoketotic hypoglycemia has been observed as early as 48 hours of life. In 85% of the cases in Western Europe the K304E mutation is identified [51]. Determination of urinary organic acid profiles and tandem mass spectrometry provide information for the diagnosis. As in all diseases of fatty acid oxidation the basic treatment is to prevent adipose tissue lipolysis [53] by providing sufficient amounts of glucose.
LCHAD, long-chain 3-hydroxyacyl-CoA dehydrogenase is an inherited disorder, usually seen within the first year of life. Children present with such symptoms as acute hypoketotic hypoglycemia, encephalopathy often in combination with cardiomyopathy and signs of liver disease of different severity, hepatomegaly, cirrhosis and liver failure [51]. As in MCAD a common mutation is responsible for approximately 87% of the cases in Western Europe [54]. When first described in 1989 the clinical prognosis was reported to be poor since nearly all patients died within the first acute presentation or during the following months. With early diagnosis and strict dietary treatment the outcome has improved, but the mortality and morbidity are still high [55].
2.2.4.5.2 Glycogen synthase defect
The classical symptoms of ketotic hypoglycemia such as hypoglycemia in combination with ketosis are very similar to type 0 glycogen storage disease (GSD0) [56]. The children with GSD0 are usually asymptomatic until the overnight feedings during infancy are discontinued, and then hyperketosis occurs in combination with hypoglycemia [25].
GSD0 is caused by deficiency of glycogen synthase in the liver, but not in muscle, fibroblasts, erythrocytes, or leucocytes [57]. The key findings in patients with GSD0 are ketotic hypoglycemia, drowsiness and fatigue in the mornings. Hepatomegaly is not present while short stature and elevated levels of lactate postprandially are common. Patients often go undiagnosed for several years due to mild symptoms, and because of the lack of new patients it was suggested that GSD0 was not compatible with life [25].
Only a small number of cases have been reported and, until recently the diagnosis was confirmed by determining of decreased hepatic glycogen by biopsy of the liver. Today mutation analysis of the GYS2 gene seems to have increased the frequency of early diagnosis. The disease is likely to be inherited in an autosomal recessive order. It can be distinguished from idiopathic ketotic hypoglycemia by the postprandial hyperlactatemia that is seen in children with GSD0.
2.2.4.5.3 SCOT and T2 deficiency
Children with Succinyl-CoA 3:ketoacid CoA transferase (SCOT) deficiency present with intermittent attacks of ketoacidosis [58], often following an intercurrent infection. Inability to utilize the increasing levels of ketone bodies leads to
9
ketoacidosis and if severe, unconsciousness and coma. In most cases, glucose concentrations are normal, but hypoglycemia may occur [59].
Acetoacetyl-CoA thiolase (T2) deficiency is a rare condition and the few cases identified typically presented with ketoacidosis around 15 months of age [60]. Recurrent episodes occur but the patients seem to be free from symptoms between the attacks. Neurological symptoms may be present but with increasing age the attacks seem to decrease in frequency and the long-term prognosis is good. SCOT and T2 deficiency are described in detail in section 2.3.1.2.
2.2.5 Proposed mechanism causing ketotic hypoglycemia
2.2.5.1 Decreased rate of glucose production
Since the first cases of idiopathic ketotic hypoglycemia were identified several biochemical mechanisms have been suggested to be responsible for the clinical picture. More recent publications [6, 24] have tried to verify the earlier proposed hypothesis by Senior [8], suggesting that a decreased rate of glucose production is most likely to cause idiopathic ketotic hypoglycemia.
In the study conducted by Bodamer et al 2006 nine children with ketotic hypoglycemia were compared with 11 child controls during a fasting tolerance test. During the last 4 hours glucose kinetics was measured using (6,6)-D2-glucose. A difference in hepatic glucose production was found between the two groups, however the mean values were not pathologically low. The conclusion drawn was that hypoglycemia developed due to an inadequate glucose production during fasting because young children have higher glucose oxidation rates.
In a very recent study by Huidekoper et al [6] 12 children who had previously been diagnosed with idiopathic ketotic hypoglycemia were reinvestigated. The investigation included a fasting tolerance test and only 5 of the children became hypoglycemic during the fasting period. The rate of glucose production (GPR) was measured both after 12 to 14 hours of fasting and at the time for hypoglycemia or at the end of the fast. After the overnight fast the GPR was found to be normal in all children, but the GPR decreased significantly as long as the fast proceeded. Moreover they found that the children with ketotic hypoglycemia had more pronounced decreases in GPR. The conclusion drawn was that these children have a limited fasting tolerance due to an inability to sustain a relatively high GPR.
2.2.5.2 Diminished capacity of gluconeogenesis
An adequate rate of glucose production is dependent on sufficient substrates, hence on gluconeogenetic precursors and the ability to maintain glycogenolysis. Younger children have less muscle and fat mass, and in combination with a higher body-to-brain ratio, glucose oxidation is higher in younger children [61]. Consequently they are more dependent on a well-functioned gluconeogenesis. Previous publications have suggested that children with idiopathic ketotic hypoglycemia have inadequate levels of alanine [28, 62].
10
2.2.6 Treatment of idiopathic ketotic hypoglycemia
Since the mechanism that causes idiopathic ketotic hypoglycemia is not completely understood there is no specific treatment available. The aim is to avoid repeated attacks of hypoglycemia, and thereby hinder the development of hypoglycemia unawareness. Treatment is dietary and carbohydrate-rich meals are the first recommendation. In some children an addition of cornstarch may be necessary, but ingestion of fat will not increase the risk of hypoglycemic episodes, as previously believed.
2.3 PHYSIOLOGICAL ROLES OF KETONE BODIES
The ketone bodies -hydroxybutyrate, acetoacetate and acetone are formed in the liver from fatty acids and also partly from the ketogenic amino acids, i.e. leucine and isoloeucine, Figure 2. Acetoacetate is an unstable compound and changes between acetone and -hydroxybutyrate due to the reversible reaction of -hydroxydehdrogenase. Acetone is volatile and is produced by spontaneous decarboxylation, and is identified by the fruity odor that may be present in the breath during severe ketosis [63]. -Hydroxybutyrate is chemically stable, is an analogue of lactic acid while acetoacetate is an analogue of pyruvic acid. Both are water-soluble and circulate in the blood stream as free molecules [64]. The major functions of ketone bodies are to provide energy, and together with the free fatty acids -hydroxybutyrate and acetoacetate are the most important energy compounds in several tissues during fasting. Ketone bodies are also important as substrates for the synthesis of lipids such as cholesterol in myelin [65]. Metabolization to form energy occurs when acetoacetate is broken down to acetyl-CoA by -oxidation.
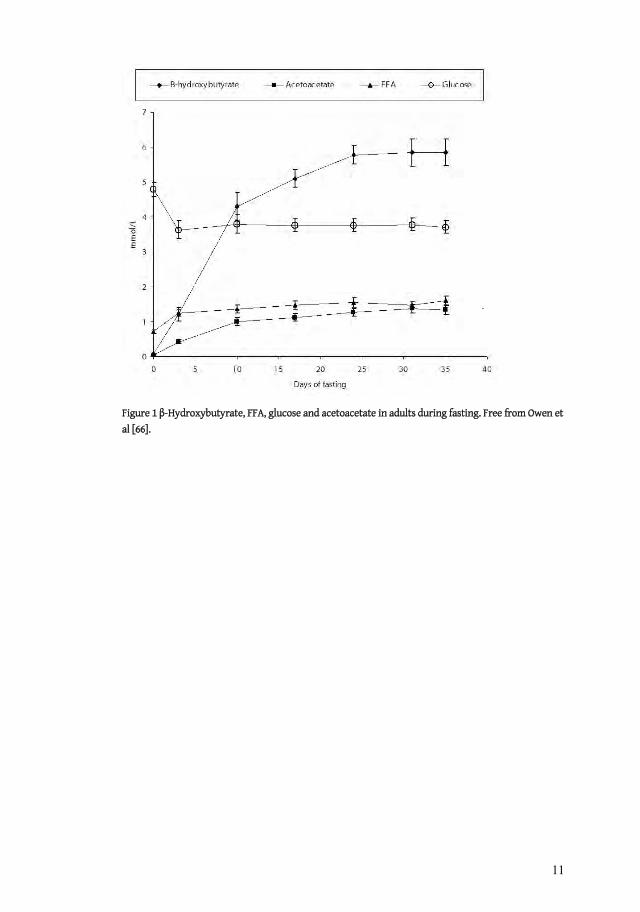
Physiological concentrations vary depending on several factors, particularly age and nutritional status, and values below 0.2 mmol/L after an overnight fast are considered normal in adults [66]. Children, pregnant women and exercising individuals have higher levels due to increased energy turnover and in children concentrations up to 1-2 mmol/L after 15 hours of fast are considered normal [67-71]. In adults, it takes 30-40 days of starvation to reach a plateau of 6 mmol/L for -hydroxybuyrate [72], in comparison to children who reach similar levels already after 24 hours of fasting, depending on age [68]. In situations where the production in the liver exceeds the demand ketonemia will develop, and if insufficient ketolysis or redistribution to other compartments occurs acidosis may develop.
11
Figure 1 -Hydroxybutyrate, FFA, glucose and acetoacetate in adults during fasting. Free from Owen et al [66].

12
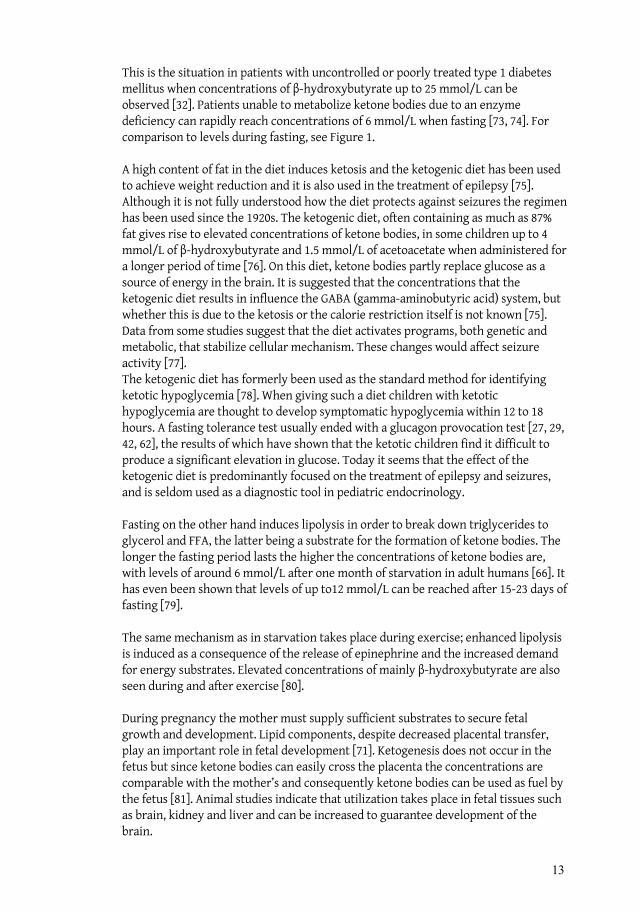
Figure 2 Overview of ketogenesis and ketolysis. From Mitchell et al [63].
12
Figure 2 Overview of ketogenesis and ketolysis. From Mitchell et al [63].
13
This is the situation in patients with uncontrolled or poorly treated type 1 diabetes mellitus when concentrations of -hydroxybutyrate up to 25 mmol/L can be observed [32]. Patients unable to metabolize ketone bodies due to an enzyme deficiency can rapidly reach concentrations of 6 mmol/L when fasting [73, 74]. For comparison to levels during fasting, see Figure 1.
A high content of fat in the diet induces ketosis and the ketogenic diet has been used to achieve weight reduction and it is also used in the treatment of epilepsy [75]. Although it is not fully understood how the diet protects against seizures the regimen has been used since the 1920s. The ketogenic diet, often containing as much as 87% fat gives rise to elevated concentrations of ketone bodies, in some children up to 4 mmol/L of -hydroxybutyrate and 1.5 mmol/L of acetoacetate when administered for a longer period of time [76]. On this diet, ketone bodies partly replace glucose as a source of energy in the brain. It is suggested that the concentrations that the ketogenic diet results in influence the GABA (gamma-aminobutyric acid) system, but whether this is due to the ketosis or the calorie restriction itself is not known [75]. Data from some studies suggest that the diet activates programs, both genetic and metabolic, that stabilize cellular mechanism. These changes would affect seizure activity [77]. The ketogenic diet has formerly been used as the standard method for identifying ketotic hypoglycemia [78]. When giving such a diet children with ketotic hypoglycemia are thought to develop symptomatic hypoglycemia within 12 to 18 hours. A fasting tolerance test usually ended with a glucagon provocation test [27, 29, 42, 62], the results of which have shown that the ketotic children find it difficult to produce a significant elevation in glucose. Today it seems that the effect of the ketogenic diet is predominantly focused on the treatment of epilepsy and seizures, and is seldom used as a diagnostic tool in pediatric endocrinology.
Fasting on the other hand induces lipolysis in order to break down triglycerides to glycerol and FFA, the latter being a substrate for the formation of ketone bodies. The longer the fasting period lasts the higher the concentrations of ketone bodies are, with levels of around 6 mmol/L after one month of starvation in adult humans [66]. It has even been shown that levels of up to12 mmol/L can be reached after 15-23 days of fasting [79].
The same mechanism as in starvation takes place during exercise; enhanced lipolysis is induced as a consequence of the release of epinephrine and the increased demand for energy substrates. Elevated concentrations of mainly -hydroxybutyrate are also seen during and after exercise [80].
During pregnancy the mother must supply sufficient substrates to secure fetal growth and development. Lipid components, despite decreased placental transfer, play an important role in fetal development [71]. Ketogenesis does not occur in the fetus but since ketone bodies can easily cross the placenta the concentrations are comparable with the mother’s and consequently ketone bodies can be used as fuel by the fetus [81]. Animal studies indicate that utilization takes place in fetal tissues such as brain, kidney and liver and can be increased to guarantee development of the brain.

14
Circulating levels of ketone bodies determines the rate of utilization and the rate of ketolysis follows the activity of the ketolytic enzymes [64, 82]. The heart has the highest capacity followed by the kidneys, brain, and skeletal muscle while no utilization of ketone bodies takes place in liver. Elevated concentrations of ketone bodies reduce the utilization of glucose, and consequently play the role of glucose sparers. During starvation as much as 60 % of the brain energy demand can be supplied by ketone bodies [83]. The rate of ketone body oxidation is estimated to be 129 g/24 hours and with an energy content of 4.5 kcal/g, a third of the daily caloric expenditure (1800 kcal) can be provided by ketone bodies [84]. Their function as an alternative energy supply when glucose is depleted is essential.
2.3.1 Inborn errors associated with ketone body metabolism
2.3.1.1 Ketogenesis
Hepatic ketogenesis is regulated in three steps; first, availability of substrates from the fat stores, depending on the actions of the hormone-sensitive lipase, secondly, concentrations of hepatic malonyl CoA and thirdly by mitochondrial HMG syntetase. The latter is the rate limiting step of ketogenesis and it is suggested that it also controls, to some extent, available substances from the -oxidation [63]. Additional enzymes involved in the ketogenesis are mitochondrial HMG CoA lyase, R- -hydroxybutyrate dehydrogenase and actoacetyl-CoA thiolase (T2).
Deficiency of mHMG-CoA synthetase is a rare condition and it can be concluded from the few cases published that the disease presents in childhood with hypoketotic hypoglycemia and dicarboxylic aciduria [85]. The deficiency prevents the formation from free fatty acids to ketones and thus interferes with energy supply to the brain during fasting. Nevertheless, no evidence of organ damage has been found and as long as prolonged fasting is avoided the disease appears to be harmless [86].
Patients with a nonfunctional HMG CoA lyase usually presents therewith with the first week of life and nearly always before the age of one. The severe hypoketotic hypoglycemia in combination with acidosis results in the patients being at high risk of developing neurological complications. The risk of epilepsy and mental retardation are much greater compared to other patients suffering from hypoglycemia with the same duration and severity. Urine analysis may confirm the diagnosis [87]. The patients also show Reye syndrome-like episodes with abnormal liver function tests and altered levels of consciousness.
Actoacetyl-CoA thiolase (T2) is involved in several steps of ketone body metabolism, mediating reactions both in the ketogenesis and ketolysis and also being involved in the catabolism of isoleucine [85, 88]. Deficiency of the enzyme is often connected with clinical signs of impaired ketolysis. The disease is described in more detail below.
-Hydroxybutyrate dehydrogenase mediates the step between -hydroxybutyrate and acetoacetate. There are no known pathological cases due to disturbances in this enzyme.
15
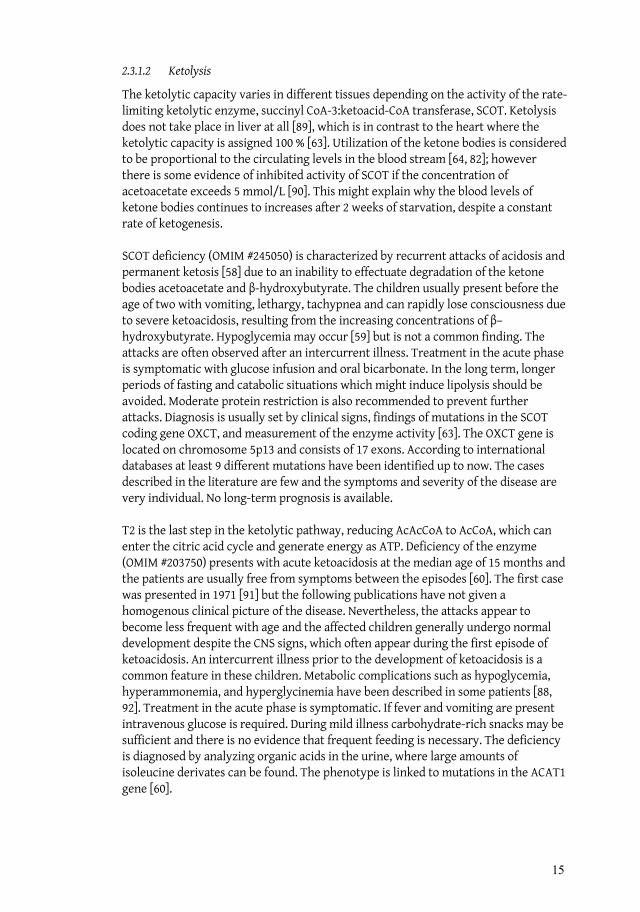
2.3.1.2 Ketolysis
The ketolytic capacity varies in different tissues depending on the activity of the rate-limiting ketolytic enzyme, succinyl CoA-3:ketoacid-CoA transferase, SCOT. Ketolysis does not take place in liver at all [89], which is in contrast to the heart where the ketolytic capacity is assigned 100 % [63]. Utilization of the ketone bodies is considered to be proportional to the circulating levels in the blood stream [64, 82]; however there is some evidence of inhibited activity of SCOT if the concentration of acetoacetate exceeds 5 mmol/L [90]. This might explain why the blood levels of ketone bodies continues to increases after 2 weeks of starvation, despite a constant rate of ketogenesis.
SCOT deficiency (OMIM #245050) is characterized by recurrent attacks of acidosis and permanent ketosis [58] due to an inability to effectuate degradation of the ketone bodies acetoacetate and -hydroxybutyrate. The children usually present before the age of two with vomiting, lethargy, tachypnea and can rapidly lose consciousness due to severe ketoacidosis, resulting from the increasing concentrations of –hydroxybutyrate. Hypoglycemia may occur [59] but is not a common finding. The attacks are often observed after an intercurrent illness. Treatment in the acute phase is symptomatic with glucose infusion and oral bicarbonate. In the long term, longer periods of fasting and catabolic situations which might induce lipolysis should be avoided. Moderate protein restriction is also recommended to prevent further attacks. Diagnosis is usually set by clinical signs, findings of mutations in the SCOT coding gene OXCT, and measurement of the enzyme activity [63]. The OXCT gene is located on chromosome 5p13 and consists of 17 exons. According to international databases at least 9 different mutations have been identified up to now. The cases described in the literature are few and the symptoms and severity of the disease are very individual. No long-term prognosis is available.
T2 is the last step in the ketolytic pathway, reducing AcAcCoA to AcCoA, which can enter the citric acid cycle and generate energy as ATP. Deficiency of the enzyme (OMIM #203750) presents with acute ketoacidosis at the median age of 15 months and the patients are usually free from symptoms between the episodes [60]. The first case was presented in 1971 [91] but the following publications have not given a homogenous clinical picture of the disease. Nevertheless, the attacks appear to become less frequent with age and the affected children generally undergo normal development despite the CNS signs, which often appear during the first episode of ketoacidosis. An intercurrent illness prior to the development of ketoacidosis is a common feature in these children. Metabolic complications such as hypoglycemia, hyperammonemia, and hyperglycinemia have been described in some patients [88, 92]. Treatment in the acute phase is symptomatic. If fever and vomiting are present intravenous glucose is required. During mild illness carbohydrate-rich snacks may be sufficient and there is no evidence that frequent feeding is necessary. The deficiency is diagnosed by analyzing organic acids in the urine, where large amounts of isoleucine derivates can be found. The phenotype is linked to mutations in the ACAT1 gene [60].
16
SCOT deficiency has several clinical similarities with T2 deficiency, which complicates the diagnosis. As mentioned above, several clinical conditions in childhood present with ketosis, among them idiopathic ketotic hypoglycemia. Inborn errors of ketone body metabolism should be kept in mind when investigating patients with abnormal findings in the ketone body turnover.
2.3.1.3 Monocarboxylate Transporters (MCT)
The monocarboxylate family (also known as the solute carrier family 16; SLC16) consists of 14 proton-linked membrane carriers designated to transport nonglucose substrates such as lactate, pyruvate and ketone bodies [93]. Only 5 of the 14 identified ones, MCT1, MCT2, MCT3, MCT4 and MCT6 have been shown to transport monocarboxylates [94]. The function of the remaining ones is still unclear. Originally the transport of pyruvate and lactate was believed to take place via diffusion. The ketone bodies are predominantly transported by MCT1, MCT2 and MCT4 (earlier called MCT3). MCT2 is expressed in the kidney and brain, MCT4 in skeletal muscle and the lung, testis, placenta, heart, leucocytes and chondrocytes while MCT1 is ubiquitous [93]. Several different MCTs can be expressed in the same tissue, and it has also been shown that the expression in various tissues can be altered during development.
The monocarboxylate substances appear to be of great importance especially for metabolism in the brain. During the development of rats, monocarboxylate transporters facilitate the transport of energy substrates, and this is most decisive for lactate [95] since the elevated concentrations provide the brain with energy during the first hours of life [96]. It has been shown that during the preweaning period ketone bodies in breast milk contribute energy substrates for the developing brain.
One of the few clinical condition connected with MCTs involves individuals with cryptic exercise intolerance [93]. These subjects suffer from muscle cramping and chest pain during exercise, which are caused by a reduced uptake of lactate in the erythrocytes. The diminished uptake of lactate was found to result from an amino acid substitution in MCT1. However, it is still not clear whether the identified mutation is responsible for this condition since expression of this mutant in Xenopus laevis did not result in any differences compared with the wild-type [93].
MCT8 is the transporter for thyroid hormones, which are absolutely necessary for organ development and particularly for the CNS. MCT8 (SLC16A2) mutations have been found in patient with X-linked mental retardation and elevated concentrations of T3 (3,3´,5´-triiodothyronine) [97]. Clinical symptoms are speech deficit, and axial and muscle hypotonia. In combination with the findings of low total and free T4
(3,3´,5,5´-tetraiodothyronine), an elevated T3 concentration and a moderate increase in TSH (thyroid stimulating hormone) the results indicate that MCT8 is most likely involved in the development of the CNS [94]. Knockout mice have been produced to increase the level of knowledge concerning the pathogenic mechanism in the MCT8-deficient patients [98].

17
MCT1, MCT2 and MCT4 are encoded by the genes SLC16A1, SLC16A7 and SLC16A3 respectively. Except for MCT1 no mutations in theses genes have been found so far.
18
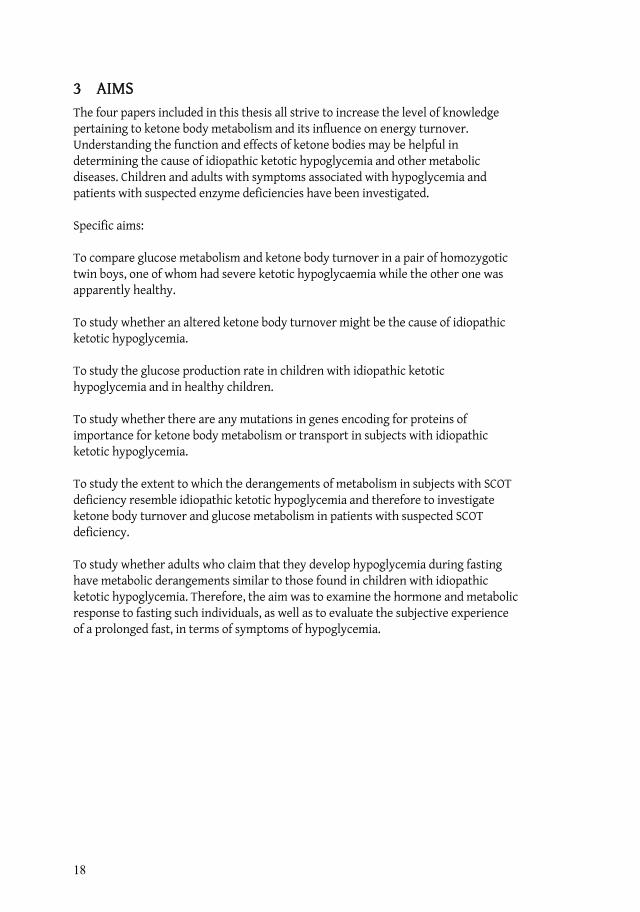
3 AIMS The four papers included in this thesis all strive to increase the level of knowledge pertaining to ketone body metabolism and its influence on energy turnover. Understanding the function and effects of ketone bodies may be helpful in determining the cause of idiopathic ketotic hypoglycemia and other metabolic diseases. Children and adults with symptoms associated with hypoglycemia and patients with suspected enzyme deficiencies have been investigated.
Specific aims:
To compare glucose metabolism and ketone body turnover in a pair of homozygotic twin boys, one of whom had severe ketotic hypoglycaemia while the other one was apparently healthy.
To study whether an altered ketone body turnover might be the cause of idiopathic ketotic hypoglycemia.
To study the glucose production rate in children with idiopathic ketotic hypoglycemia and in healthy children.
To study whether there are any mutations in genes encoding for proteins of importance for ketone body metabolism or transport in subjects with idiopathic ketotic hypoglycemia.
To study the extent to which the derangements of metabolism in subjects with SCOT deficiency resemble idiopathic ketotic hypoglycemia and therefore to investigate ketone body turnover and glucose metabolism in patients with suspected SCOT deficiency.
To study whether adults who claim that they develop hypoglycemia during fasting have metabolic derangements similar to those found in children with idiopathic ketotic hypoglycemia. Therefore, the aim was to examine the hormone and metabolic response to fasting such individuals, as well as to evaluate the subjective experience of a prolonged fast, in terms of symptoms of hypoglycemia.
19
4 MATERIAL AND METHODS
4.1 SUBJECTS
All patients enrolled in the studies have been recruited from Karolinska University Hospital, the DEMO (Diabetes, Endocrine, Metabolism and Obesity) pediatrics section, Stockholm, Sweden.
The children in Paper I II had all, except for one healthy twin, been referred to the clinic due to documented or suspected symptoms of hypoglycemia. They were enrolled in the study consecutively. Three of the originally 25 children were excluded due to puberty. There were no drop-outs. Healthy child controls in paper II were participants in a parallel study conducted in the DEMO section. The aim of that study was to compare absolutely healthy children with children of short stature combined with growth hormone levels within the gray zone between normal levels and levels clearly defined as GH deficiency.
The patients in Paper III were referred to the DEMO section for investigations prompted by permanent ketosis. The healthy volunteers participating in the same study were recruited through mouth-to-mouth contacts and freely volunteered to participate in the study.
In Paper IV the adult subjects were recruited from the medical program at Karolinska Institutet, Stockholm, Sweden. They participated on a voluntary basis and were declared free of any metabolic and endocrine disease at the time of the investigation.
All patients, care receivers and healthy subjects accepted the invitation and gave their informed consent to participate. All studies were approved by the Ethics Committee at Karolinska Institutet.
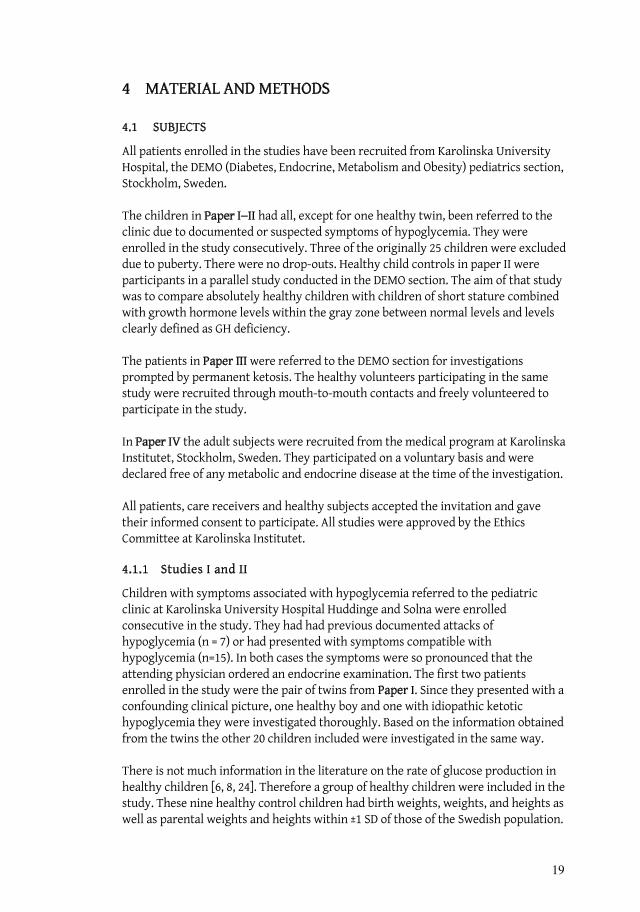
4.1.1 Studies I and II
Children with symptoms associated with hypoglycemia referred to the pediatric clinic at Karolinska University Hospital Huddinge and Solna were enrolled consecutive in the study. They had had previous documented attacks of hypoglycemia (n = 7) or had presented with symptoms compatible with hypoglycemia (n=15). In both cases the symptoms were so pronounced that the attending physician ordered an endocrine examination. The first two patients enrolled in the study were the pair of twins from Paper I. Since they presented with a confounding clinical picture, one healthy boy and one with idiopathic ketotic hypoglycemia they were investigated thoroughly. Based on the information obtained from the twins the other 20 children included were investigated in the same way.
There is not much information in the literature on the rate of glucose production in healthy children [6, 8, 24]. Therefore a group of healthy children were included in the study. These nine healthy control children had birth weights, weights, and heights as well as parental weights and heights within ±1 SD of those of the Swedish population.
20
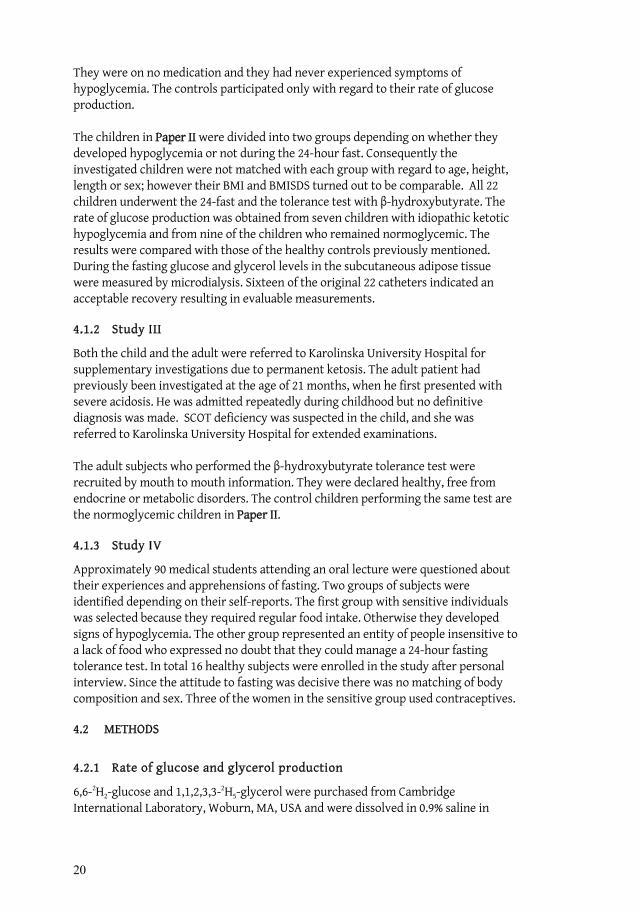
They were on no medication and they had never experienced symptoms of hypoglycemia. The controls participated only with regard to their rate of glucose production.
The children in Paper II were divided into two groups depending on whether they developed hypoglycemia or not during the 24-hour fast. Consequently the investigated children were not matched with each group with regard to age, height, length or sex; however their BMI and BMISDS turned out to be comparable. All 22 children underwent the 24-fast and the tolerance test with -hydroxybutyrate. The rate of glucose production was obtained from seven children with idiopathic ketotic hypoglycemia and from nine of the children who remained normoglycemic. The results were compared with those of the healthy controls previously mentioned. During the fasting glucose and glycerol levels in the subcutaneous adipose tissue were measured by microdialysis. Sixteen of the original 22 catheters indicated an acceptable recovery resulting in evaluable measurements.
4.1.2 Study III
Both the child and the adult were referred to Karolinska University Hospital for supplementary investigations due to permanent ketosis. The adult patient had previously been investigated at the age of 21 months, when he first presented with severe acidosis. He was admitted repeatedly during childhood but no definitive diagnosis was made. SCOT deficiency was suspected in the child, and she was referred to Karolinska University Hospital for extended examinations.
The adult subjects who performed the -hydroxybutyrate tolerance test were recruited by mouth to mouth information. They were declared healthy, free from endocrine or metabolic disorders. The control children performing the same test are the normoglycemic children in Paper II.
4.1.3 Study IV
Approximately 90 medical students attending an oral lecture were questioned about their experiences and apprehensions of fasting. Two groups of subjects were identified depending on their self-reports. The first group with sensitive individuals was selected because they required regular food intake. Otherwise they developed signs of hypoglycemia. The other group represented an entity of people insensitive to a lack of food who expressed no doubt that they could manage a 24-hour fasting tolerance test. In total 16 healthy subjects were enrolled in the study after personal interview. Since the attitude to fasting was decisive there was no matching of body composition and sex. Three of the women in the sensitive group used contraceptives.
4.2 METHODS
4.2.1 Rate of glucose and glycerol production
6,6-2H2-glucose and 1,1,2,3,3-2H5-glycerol were purchased from Cambridge International Laboratory, Woburn, MA, USA and were dissolved in 0.9% saline in

21
concentrations of 4.5 mg/ml and 1.2 mg/ml, respectively. The solutions were tested to confirm that they were pyrogene-free and sterile by Apoteket AB (Umeå, Sweden).
The rate of glucose production was measured in the children and in the adult subject in papers I, II and III, after an extended overnight fast (11-15 hours). Basal blood samples were drawn from a venous cannula and promptly thereafter a bolus dose of 6,6-2H2-glucose was administered during the first 5 minutes in the contralateral arm. In the children a constant rate infusion corresponding to 0.024-0.105 mg/kgbw/min then followed for 115 minutes. Blood samples were collected in ice-cold tubes every 10 minutes between 60 and 120 minutes. Plasma glucose was measured following centrifugation. The remaining plasma samples were stored at -70 °C until acetylation and analysis of isotope dilution by gas chromatography-mass spectrometry [99]. To determine the rate of glucose production in the adult subject in Paper III the constant rate infusion, 0.0375 mg/kgbw/min, was extended to 5 hours. Blood samples were collected every 10 minutes between 240 and 300 minutes.
The rate of glycerol production in the twin brothers in Paper I and in the adult patient in Paper III was determined following primed constant rate infusion of 1,1,2,3,3-2H5-glycerol corresponding to 0.30 mol/kgbw/min and 0.01
mol/kgbw/min, respectively. Blood samples were collected between 60 and 120 minutes in the two boys, and during 240 to 300 minutes in the adult subject. Plasma glycerol was measured following centrifugation. The remaining plasma samples were stored at -70 °C until acetylation and analysis of isotope dilution by gas chromatography-mass spectrometry [99].
4.2.2 Fasting tolerance test
The fasting tolerance test is a well-known method in endocrinology and is used routinely when diagnosing endocrine or metabolic disorders [67]. The aim is to resemble a clinical situation under safe conditions in order to follow the physiological response to the fast.
After a local anesthetic had been applied to the skin a cannula was inserted into the peripheral vein of both forearms. Starting after an evening meal from the hospital canteen venous blood samples were drawn every third or fourth hour. Hormones and metabolites involved in glucose homeostasis (GH, cortisol, glucagon, insulin, -hydroxybutyrate and lactate) were analyzed at the Department of Clinical Chemistry, Karolinska University Hospital. -hydroxybutyrate and acetoacetate were analyzed at the CMMS, Karolinska University Hospital and Sahlgrenska University Hospital by the method described by Wildenhoff and Li respectively [100, 101]. The subjects were only allowed to drink water during the test. Hospital staff supervised the subjects throughout the fasting test, and if severe hypoglycemia developed, a glucose solution (300 mg/mL) was kept in close vicinity to the subjects. If the subjects showed symptoms of hypoglycemia the fast was brought to an end. At termination final blood samples were drawn from all subjects and they were served drink and food.
22
4.2.3 Visual Analogue Scale, VAS
In Paper IV validations of the subjective experience related to the fasting were collected as long as the fast proceeded, i.e. 8 times during the day in connection with the blood sampling. The subjects were asked to fill out questionnaires about their experiences and sensations related to hypoglycemia. The following sensations were rated on a visual analogue scales ranging from 1 to 100: shakiness, tiredness, dizziness, weakness, irritation, cold sweat, headache and hunger. The questionnaires were collected immediately after they had been filled out to avoid interpersonal comparison.
4.2.4 Microdialysis
Microdialysis is a highly suitable technique for the pediatric population. Easily placed in the subcutaneous tissue, the catheter can remain in situ for a fairly long period even in very small children. This makes it possible to follow chemical changes in different tissues without additional blood sampling. Despite the fact that microdialysis was not developed primarily for the pediatric sector it has been found to be suitable even in neonatal intensive care [102, 103].
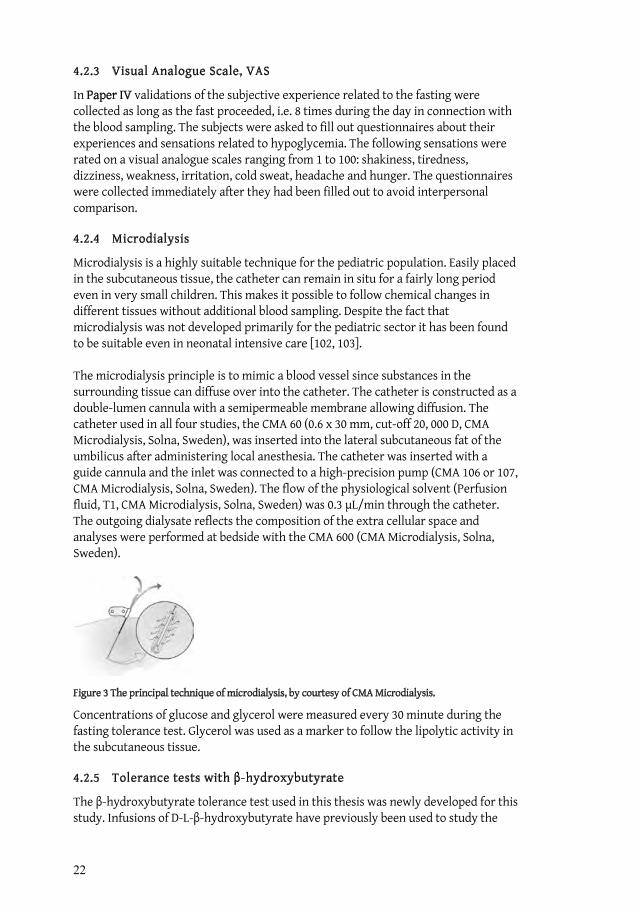
The microdialysis principle is to mimic a blood vessel since substances in the surrounding tissue can diffuse over into the catheter. The catheter is constructed as a double-lumen cannula with a semipermeable membrane allowing diffusion. The catheter used in all four studies, the CMA 60 (0.6 x 30 mm, cut-off 20, 000 D, CMA Microdialysis, Solna, Sweden), was inserted into the lateral subcutaneous fat of the umbilicus after administering local anesthesia. The catheter was inserted with a guide cannula and the inlet was connected to a high-precision pump (CMA 106 or 107, CMA Microdialysis, Solna, Sweden). The flow of the physiological solvent (Perfusion fluid, T1, CMA Microdialysis, Solna, Sweden) was 0.3 L/min through the catheter. The outgoing dialysate reflects the composition of the extra cellular space and analyses were performed at bedside with the CMA 600 (CMA Microdialysis, Solna, Sweden).
Figure 3 The principal technique of microdialysis, by courtesy of CMA Microdialysis.
Concentrations of glucose and glycerol were measured every 30 minute during the fasting tolerance test. Glycerol was used as a marker to follow the lipolytic activity in the subcutaneous tissue.
4.2.5 Tolerance tests with -hydroxybutyrate
The -hydroxybutyrate tolerance test used in this thesis was newly developed for this study. Infusions of D-L- -hydroxybutyrate have previously been used to study the

23
effects on glucose and free fatty acids [104]. It was previously believed that high levels of ketone bodies would induce hypoglycemia through an increased utilization of glucose [105] and the infusion of -hydroxybutyrate was therefore used with the same purpose, as was the administration of a ketogenic diet [78].
As previously mentioned, the concentrations of ketone bodies vary depending on several factors such as nutritional status, age and underlying disease. The optimal concentration of -hydroxybutyrate to administer was therefore hard to predict. Young children can present concentrations of 1-2 mmol/L after an overnight fast [68], while adults seldom reach over 0.2 mmol/L after the same fasting time. In patients with SCOT deficiency it is not uncommon for concentrations to reach 5 mmol/L [73, 106] and even higher when the fast is extended. During the tolerance test it was desirable to attain steady state during infusions in order to be able to evaluate the test properly. Very high concentrations of -hydroxybutyrate are known to cause metabolic acidosis. On the other hand the -hydroxybutyrate salt given in the infusion might cause metabolic alkalosis as well as a decreasing concentration of plasma potassium and therefore low concentrations of the substances were used initially. As both alkalosis and decreasing potassium levels were observed in the healthy volunteers these metabolic consequences of the -hydroxybutyrate infusion limited the amount of this substance given in this study.
D-L- -hydroxybutyrate was purchased through Apoteket AB, Stockholm, Sweden which also tested the substance for freedom from pyrogens and sterility. After basal samples i.e. -hydroxybutyrate, acetoacetate and insulin had been obtained, the infusion (1.5-2 mmol/kgbw/h) was given in a peripheral vein during 60 minutes. Samples were drawn continuously approximately every 10 to 15 minutes. The collecting tubes were placed on ice until sampling, and immediately after the blood was drawn the sample was centrifuged at 4 C and 3000 rpm for 10 minutes. Samples for –hydroxybutyrate were frozen at -20 C until analysis [100]. Blood samples for acetoacetate were frozen at -80 C and were analyzed within 5 days [101]. The patients remained in bed and were only allowed to drink water throughout the test.
4.2.6 Analysis of the SCOT and T2 enzyme activity
Fibroblasts from the patients in Paper III were grown from a skin biopsy specimen taken under local anesthesia from the forearm. Harvested cells were stored at -80ºC until SCOT and T2 activities were determined in the child, the adult patient, his parents and a group of 9 healthy controls, as previously described [22, 82].
4.2.7 Sequencing analysis
Venous blood samples from the patients and relatives were stored in –20 C and sequence analysis was performed on the OXCT, ACAT1, SLC16A1, SLC16A7 and SLC16A3 genes. Genomic DNA was purified using the QIAamp DNA Blood Mini Kit (Qiagen, Hilden, Germany), in the way recommended by the manufacturer. All exon information for the above mentioned genes was received from the website of the Sanger Institute [107]. The polymerase chain reaction (PCR) was used to amplify the exons of the genes. Primers were ordered from Sigma-Proligo, Evry Cedex, France.

24
The final content of 50 L was as follow: 50 ng of genomic DNA, 1 x buffer (Sigma-Aldrich, St Louis, MO, USA), 0.2 mM deoxy-NTP, 0.5 M of each sense or anti-sens primer, 1.5 U Taq Polymerase (Sigma-Aldrich, St Louis, MO, USA) and 1.5-2.5 mM MgCl2. The amplification was performed in a thermocycler (Biometra GmbH, Göttingen, Germany). The PCR products were purified using the Millipore Montage PCR device (Millipore, Billerica, MA, USA) and sequence reactions were performed using Big Dye terminator 1.1. sequencing chemistry (Applied Biosystems, Foster City, CA, USA). The analysis was carried out on an ABI 377 automated DNA sequencer.
4.2.8 Statistical methods
The Mann-Whitney test and the Wilcoxons´ test for matched pairs were used in paper II and IV. Analysis of variance, i.e. the general linear model (GLM) was used to compare blood samples (Paper IV) and the progressive rise in -hydroxybutyrate during the tolerance test (Paper II).
Logistic regression was used to examine how changes in hormones and metabolites over time can discriminate between the outcomes of hypoglycemic and normoglycemia in Paper II. The analysis also produces an estimate for cut-off values, i.e. a discriminating level for developing hypoglycemia.
In Paper IV the T-test was used to examine differences between individuals who can manage fasting versus individuals who experience symptoms of hypoglycemia when skipping meals, with regard to subcutaneous glycerol values. Glycerol values were derived as the absolute value of the difference between two consecutive measures. The VAS was evaluated using the Mann-Whitney test.
The level of p < 0.05 was used for statistical significance in all papers. Figures are presented as mean and SD when no stated otherwise.
25
5 RESULTS
5.1 PAPER I-II
In Paper I a pair of twins was investigated during a 24 hour fast, a tolerance test with -hydroxybutyrate and measurements of endogenous glucose production. The
ketone body turnover in the hypoglycemic twin boy suggested an alteration of ketone bodies as a cause of idiopathic ketotic hypoglycemia. In study II children with symptoms of hypoglycemia were enrolled to confirm this hypothesis.
Five of the 9 children who developed hypoglycemia during the fast were girls and 7 of the 9 patients had previously presented symptoms of allergic disease. The children in the hypoglycemic group were somewhat younger than the ones who remained normoglycemic and the control children. However the BMI and BMISDS were similar. The birth weight of all investigated children was within the normal range, except for the twin boys in Paper I, who were smaller, due to the duplex pregnancy.
5.1.1 Glucose production rate
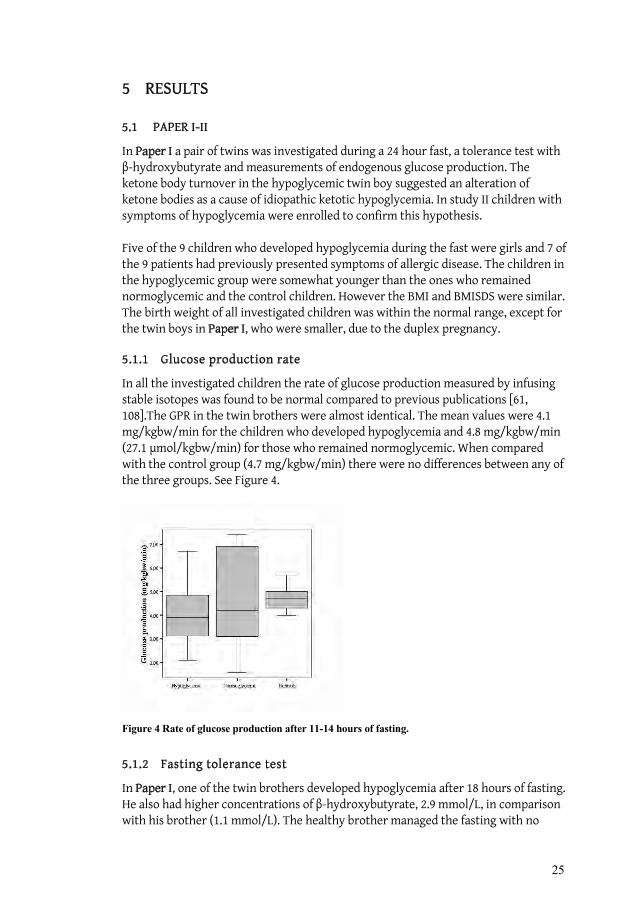
In all the investigated children the rate of glucose production measured by infusing stable isotopes was found to be normal compared to previous publications [61, 108].The GPR in the twin brothers were almost identical. The mean values were 4.1 mg/kgbw/min for the children who developed hypoglycemia and 4.8 mg/kgbw/min (27.1 mol/kgbw/min) for those who remained normoglycemic. When compared with the control group (4.7 mg/kgbw/min) there were no differences between any of the three groups. See Figure 4.
Figure 4 Rate of glucose production after 11-14 hours of fasting.
5.1.2 Fasting tolerance test
In Paper I, one of the twin brothers developed hypoglycemia after 18 hours of fasting. He also had higher concentrations of -hydroxybutyrate, 2.9 mmol/L, in comparison with his brother (1.1 mmol/L). The healthy brother managed the fasting with no
26
symptoms or laboratory findings of hypoglycemia. Furthermore, the increase in plasma -hydroxybutyrate preceded the development of hypoglycemia in the affected twin.
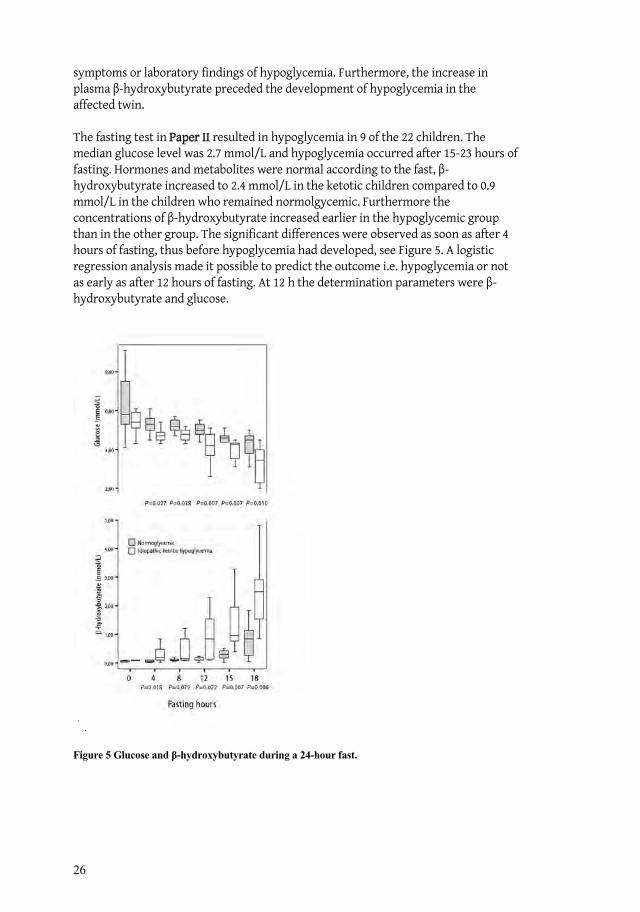
The fasting test in Paper II resulted in hypoglycemia in 9 of the 22 children. The median glucose level was 2.7 mmol/L and hypoglycemia occurred after 15-23 hours of fasting. Hormones and metabolites were normal according to the fast, -hydroxybutyrate increased to 2.4 mmol/L in the ketotic children compared to 0.9 mmol/L in the children who remained normolgycemic. Furthermore the concentrations of -hydroxybutyrate increased earlier in the hypoglycemic group than in the other group. The significant differences were observed as soon as after 4 hours of fasting, thus before hypoglycemia had developed, see Figure 5. A logistic regression analysis made it possible to predict the outcome i.e. hypoglycemia or not as early as after 12 hours of fasting. At 12 h the determination parameters were -hydroxybutyrate and glucose.
Figure 5 Glucose and -hydroxybutyrate during a 24-hour fast.
27
5.1.3 Tolerance test with -hydroxybutyrate
The twin boy who developed hypoglycemia during fasting had higher levels of -hydroxybutyrate during fasting, which rose to 16.6 mmol/L during the tolerance test, in comparison with his bother who reached a maximum concentration of 0.86 mmol/L. The differences in ketone body turnover were confirmed on retesting after seven months. The ketotic twin then had a maximum concentration of 5.0 mmol/L during the tolerance test, and his brother 1.3 mmol/L
When investigating children with previous symptoms of hypoglycemia in Paper II,the infusion of -hydroxybutyrate resulted in an increase in the plasma concentrations of -hydroxybutyrate after 30 minutes, and maximum concentrations were seen after 30-90 minutes, thus presenting a wide variation in the children. The mean values of the peak levels differed between the groups, but it must be kept in mind that two children in the ketotic group presented extremely high levels.
5.1.4 Sequencing analysis
No mutations were found in the OXCT and the ACAT1 genes in the children with idiopathic ketotic hypoglycemia. The only findings were previously described SNPs (single nucleotide polymorphism), found in healthy individuals and predominantly situated in the intron sequence without known function.
5.2 PAPER III
Patients with SCOT deficiency were studied to investigate to the extent to which the metabolic derangements mirror idiopathic ketotic hypoglycemia. Ketone body turnover and glucose metabolism were investigated by means of fasting, a tolerance test with -hydroxybutyrate and measurement of the rate of substrate production.
5.2.1 Measurement of rate of substrate production
The rate of glucose production was normal in both patients. In the adult patient the rate of glycerol production was also examined and was found to be within normal levels.
5.2.2 Fasting tolerance test
In both cases the fasting was terminated due to ketoacidosis as a result of the increasing levels of -hydroxybutyrate. The adult patient showed signs of motor restlessness as the pH decreased to 7.27. Blood samples collected continuously during the fast for determinations of metabolites and hormones were all normal except the levels of -hydroxybutyrate, which increased to 7.3 mmol/L and 5.8 mmol/L in the adult patient and child, respectively. In none of the patients the laboratory results or clinical signs indicate a reduced availability of energy substrates and they remained normoglycemic throughout the fast.
5.2.3 Tolerance test with -hydroxybutyrate
When infused with -hydroxybutyrate the adult patient showed a moderate rise in plasma concentration, similar to that of the healthy volunteers. In contrast, the child
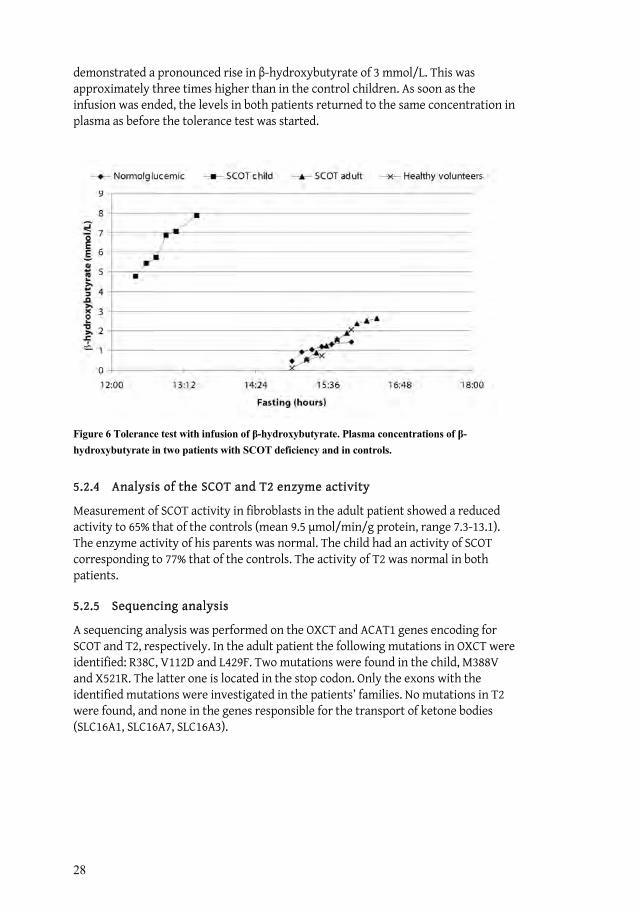
28
demonstrated a pronounced rise in -hydroxybutyrate of 3 mmol/L. This was approximately three times higher than in the control children. As soon as the infusion was ended, the levels in both patients returned to the same concentration in plasma as before the tolerance test was started.
Figure 6 Tolerance test with infusion of -hydroxybutyrate. Plasma concentrations of -hydroxybutyrate in two patients with SCOT deficiency and in controls.
5.2.4 Analysis of the SCOT and T2 enzyme activity
Measurement of SCOT activity in fibroblasts in the adult patient showed a reduced activity to 65% that of the controls (mean 9.5 mol/min/g protein, range 7.3-13.1). The enzyme activity of his parents was normal. The child had an activity of SCOT corresponding to 77% that of the controls. The activity of T2 was normal in both patients.
5.2.5 Sequencing analysis
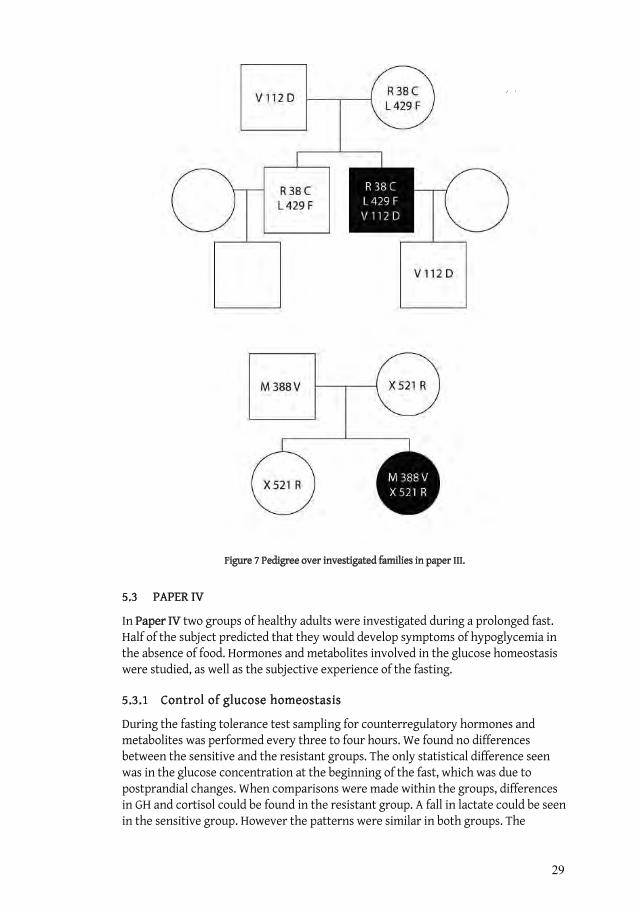
A sequencing analysis was performed on the OXCT and ACAT1 genes encoding for SCOT and T2, respectively. In the adult patient the following mutations in OXCT were identified: R38C, V112D and L429F. Two mutations were found in the child, M388V and X521R. The latter one is located in the stop codon. Only the exons with the identified mutations were investigated in the patients’ families. No mutations in T2 were found, and none in the genes responsible for the transport of ketone bodies (SLC16A1, SLC16A7, SLC16A3).
29
Figure 7 Pedigree over investigated families in paper III.
5.3 PAPER IV
In Paper IV two groups of healthy adults were investigated during a prolonged fast. Half of the subject predicted that they would develop symptoms of hypoglycemia in the absence of food. Hormones and metabolites involved in the glucose homeostasis were studied, as well as the subjective experience of the fasting.
5.3.1 Control of glucose homeostasis
During the fasting tolerance test sampling for counterregulatory hormones and metabolites was performed every three to four hours. We found no differences between the sensitive and the resistant groups. The only statistical difference seen was in the glucose concentration at the beginning of the fast, which was due to postprandial changes. When comparisons were made within the groups, differences in GH and cortisol could be found in the resistant group. A fall in lactate could be seen in the sensitive group. However the patterns were similar in both groups. The
30
concentrations of -hydroxybutyrate were fairly constant during the fast, 0.10 mmol/L after 15 hours. Then a slow increase could be observed, with 0.64 and 0.77 mmol/L at the end of the fast for the sensitive and the resistant group, respectively.
5.3.2 Subjective experience
The subjective experience during the fast was investigated by VAS. Among the 8 different sensations, it was only for irritation and shakiness that a significant difference could be seen between the two groups. Within the two groups there was an obvious change from the start to the termination of the fast. For all variables except cold sweat the sensitive individuals rated significantly higher when values from start to termination were compared. For the resistant group, it was only hunger that was increasing in the same manner. Thus, despite the similar concentrations of glucose, the subjective experience of the fasting differed between the groups.
31
6 GENERAL DISCUSSION
6.1 POPULATION AND PREVALENCE
Despite the fact that idiopathic ketotic hypoglycemia is considered to be the most common cause of hypoglycemia after infancy, [6-8] the number of children included in previous studies is surprisingly low. In total, approximately 70–80 patients have been described. As mentioned earlier, the symptoms of hypoglycemia might not be that pronounced and the incidence of idiopathic ketotic hypoglycemia is therefore hard to predict. The majority of the children investigated in these studies was recruited from the area surrounding Stockholm and might reflect the prevalence in a city with a Western lifestyle. It has been proposed that the most likely child to develop idiopathic ketotic hypoglycemia is a Caucasian boy. In Paper II all children were Caucasians; however, there were more females than males who developed hypoglycemia. More than 10% of the inhabitants of Stockholm are of non-Caucasian origin but none of the investigated children were of other national origin than Swedish. With the not so obvious symptoms in mind, it is possible that the frequency of idiopathic ketotic hypoglycemia is underestimated in the pediatric population. The clinical presentation with hypoglycemia and elevated concentrations of ketone bodies may also be a sign of enzyme deficiency or other metabolic inborn error, whereas SCOT and T2 deficiency must always be ruled out.
It has been suggested that children with idiopathic ketotic hypoglycemia are a decreasing entity. The reason for this could be more advanced and modern techniques that make a more specific diagnosis possible [26]. Additionally, the early screening program in infancy makes an early diagnosis of metabolic diseases possible. It seems that the long-term prognosis for idiopathic ketotic hypoglycemia is good. However, there are no follow-up studies available.
6.2 METHODOLOGICAL CONSIDERATIONS
6.2.1 Measurement of energy substrate turnover
In this thesis the tracer technique has been used to estimate the rate of glucose and glycerol turnover (Papers I–III). Stable isotopes are considered reliable, safe and nontoxic [109, 110] and studies have even been conducted on fetuses [111]. The drawbacks are the expensive analysis with gas chromatography-isotope ratio mass spectrometry and that stable isotopes have a relatively high natural background, which must be considered [112]. Yet, the safety and the possibility of obtaining accurate measurements from only small plasma samples make the technique attractive in the field of pediatrics.
The coefficient of variation (CV) in the measurements of glucose production rate is usually low and this was also seen in the measurements in Papers I–III. A CV up to 15% is usually acceptable [113]and the variation seen is most likely of biological, rather than methodological, origin since the methodology gives very high precision during repeated measurements [114]. The rate of glycerol production as an index of

32
lipolysis presents more variation due to irregular bursts of epinephrine. Sunehag et al. investigated reproducibility [108] and found that the rate of glucose production seems to be constant over time. Nonobese and obese children were investigated on two occasions, separated by 2–8 weeks. No differences in the rate of glucose production were found in the two investigations.
6.2.2 Measurements of ketone body kinetics
In Papers I–III ketone body levels were studied during fasting and a tolerance test with -hydroxybutyrate. This was done to test the hypothesis that emerged from the results for the twin boys, namely, that children with idiopathic ketotic hypoglycemia have a lowered level of utilization of ketone bodies. We also investigated two patients with a suspected SCOT deficiency, a disorder with a clinical picture similar to that of idiopathic ketotic hypoglycemia.
A -hydroxybutyrate tolerance test has previously been used (1.25 mmol/kg given during 15 minutes, calculated from available data) [104] with the aim to study the effect on glucose and fatty acids in children with ketotic hypoglycemia. However, the ketone body turnover was not studied. Infusions of -hydroxybutyrate have also been performed on adults [115], but with the aim of investigating the glomerular haemodynamics during acute ketosis. Approximately twice the amount of -hydroxybutyrate was given, compared to our investigation, and an increase of 1.9 mmol/L, in blood was then observed.
Despite the low concentrations of -hydroxybutyrate given during the tolerance test, side effects such as metabolic alkalosis and reduced potassium levels were seen in the adult subjects (Paper III). The concentrations given to the adults in the Danish study were higher than ours, and alkalosis was observed, but to a lesser extent than in our investigation. No other side effects were observed and the subjects were reported to be unaffected (personal communication) [115]. It is possible that increased doses of -hydroxybutyrate could discriminate better between normal and pathological ketone body turnover, but considering the risk of side effects, this was not ethically justified.
The results of the infusions showed that some of the children who developed hypoglycemia during the fasting also had an abnormal ketone body turnover, while in some of them there was no difference in the concentration compared to normoglycemic children. As will be discussed later, the -hydroxybutyrate tolerance test strengthens the hypothesis of an abnormal ketone body turnover in children with idiopathic ketotic hypoglycemia but it cannot be used alone as a diagnostic test. The fasting tolerance test must still be performed to discriminate between the children who can remain normoglycemic and those who cannot. However, despite the fact that the -hydroxybutyrate tolerance test is new and its sensitivity and specificity are still uncertain, we consider it to be a valuable tool when diagnosing idiopathic ketotic hypoglycemia.
The use of stable isotope tracers to investigate ketone body metabolism is an attractive option when no other reliable methods are available. The concentrations of
–hydroxybutyrate and acetoacetate vary under different physiological conditions,
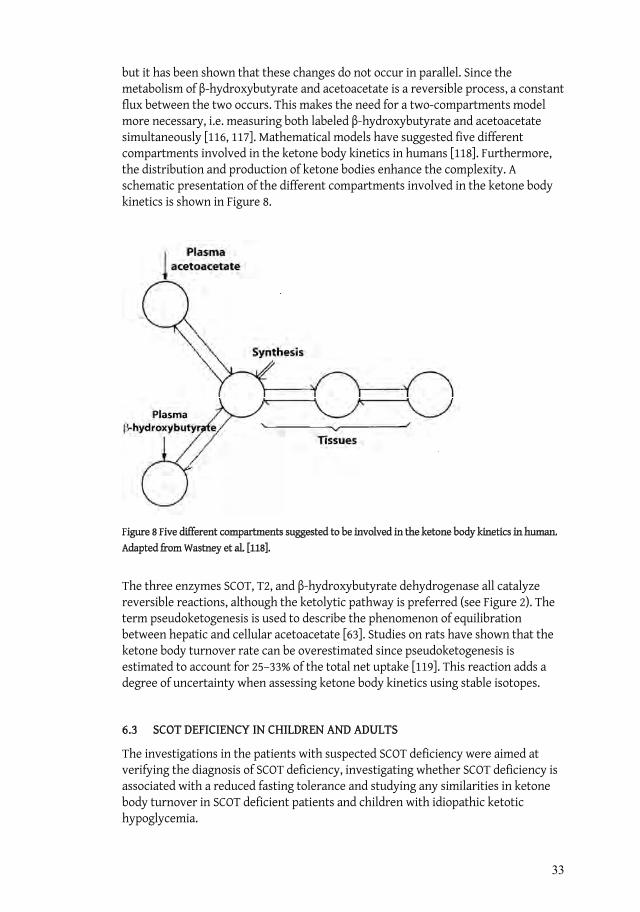
33
but it has been shown that these changes do not occur in parallel. Since the metabolism of -hydroxybutyrate and acetoacetate is a reversible process, a constant flux between the two occurs. This makes the need for a two-compartments model more necessary, i.e. measuring both labeled -hydroxybutyrate and acetoacetate simultaneously [116, 117]. Mathematical models have suggested five different compartments involved in the ketone body kinetics in humans [118]. Furthermore, the distribution and production of ketone bodies enhance the complexity. A schematic presentation of the different compartments involved in the ketone body kinetics is shown in Figure 8.
Figure 8 Five different compartments suggested to be involved in the ketone body kinetics in human. Adapted from Wastney et al. [118].
The three enzymes SCOT, T2, and -hydroxybutyrate dehydrogenase all catalyze reversible reactions, although the ketolytic pathway is preferred (see Figure 2). The term pseudoketogenesis is used to describe the phenomenon of equilibration between hepatic and cellular acetoacetate [63]. Studies on rats have shown that the ketone body turnover rate can be overestimated since pseudoketogenesis is estimated to account for 25–33% of the total net uptake [119]. This reaction adds a degree of uncertainty when assessing ketone body kinetics using stable isotopes.
6.3 SCOT DEFICIENCY IN CHILDREN AND ADULTS
The investigations in the patients with suspected SCOT deficiency were aimed at verifying the diagnosis of SCOT deficiency, investigating whether SCOT deficiency is associated with a reduced fasting tolerance and studying any similarities in ketone body turnover in SCOT deficient patients and children with idiopathic ketotic hypoglycemia.
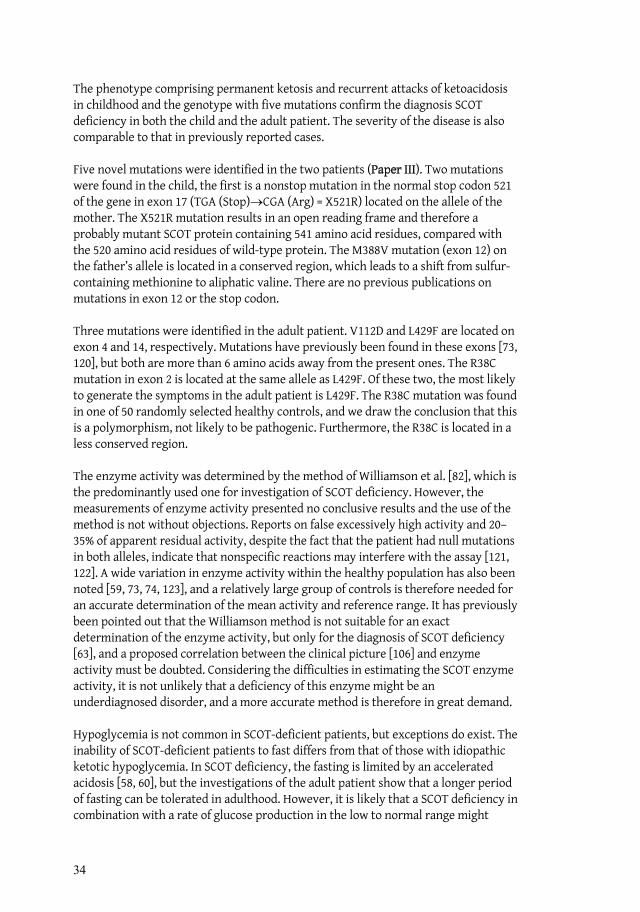
34
The phenotype comprising permanent ketosis and recurrent attacks of ketoacidosis in childhood and the genotype with five mutations confirm the diagnosis SCOT deficiency in both the child and the adult patient. The severity of the disease is also comparable to that in previously reported cases.
Five novel mutations were identified in the two patients (Paper III). Two mutations were found in the child, the first is a nonstop mutation in the normal stop codon 521 of the gene in exon 17 (TGA (Stop) CGA (Arg) = X521R) located on the allele of the mother. The X521R mutation results in an open reading frame and therefore a probably mutant SCOT protein containing 541 amino acid residues, compared with the 520 amino acid residues of wild-type protein. The M388V mutation (exon 12) on the father’s allele is located in a conserved region, which leads to a shift from sulfur-containing methionine to aliphatic valine. There are no previous publications on mutations in exon 12 or the stop codon.
Three mutations were identified in the adult patient. V112D and L429F are located on exon 4 and 14, respectively. Mutations have previously been found in these exons [73, 120], but both are more than 6 amino acids away from the present ones. The R38C mutation in exon 2 is located at the same allele as L429F. Of these two, the most likely to generate the symptoms in the adult patient is L429F. The R38C mutation was found in one of 50 randomly selected healthy controls, and we draw the conclusion that this is a polymorphism, not likely to be pathogenic. Furthermore, the R38C is located in a less conserved region.
The enzyme activity was determined by the method of Williamson et al. [82], which is the predominantly used one for investigation of SCOT deficiency. However, the measurements of enzyme activity presented no conclusive results and the use of the method is not without objections. Reports on false excessively high activity and 20–35% of apparent residual activity, despite the fact that the patient had null mutations in both alleles, indicate that nonspecific reactions may interfere with the assay [121, 122]. A wide variation in enzyme activity within the healthy population has also been noted [59, 73, 74, 123], and a relatively large group of controls is therefore needed for an accurate determination of the mean activity and reference range. It has previously been pointed out that the Williamson method is not suitable for an exact determination of the enzyme activity, but only for the diagnosis of SCOT deficiency [63], and a proposed correlation between the clinical picture [106] and enzyme activity must be doubted. Considering the difficulties in estimating the SCOT enzyme activity, it is not unlikely that a deficiency of this enzyme might be an underdiagnosed disorder, and a more accurate method is therefore in great demand.
Hypoglycemia is not common in SCOT-deficient patients, but exceptions do exist. The inability of SCOT-deficient patients to fast differs from that of those with idiopathic ketotic hypoglycemia. In SCOT deficiency, the fasting is limited by an accelerated acidosis [58, 60], but the investigations of the adult patient show that a longer period of fasting can be tolerated in adulthood. However, it is likely that a SCOT deficiency in combination with a rate of glucose production in the low to normal range might

35
result in fasting hypoglycemia. Hypoglycemia has been reported in some SCOT-deficient subjects [58, 124], but the rate of glucose production was not studied.
It was of particular interest to find out whether SCOT-deficient patients show any similarities in ketone body turnover with patients having idiopathic ketotic hypoglycemia. However, the investigations (fasting tolerance test, measurements of rate of glucose production and -hydroxybutyrate tolerance test) show that SCOT deficiency is not a subgroup of idiopathic ketotic hypoglycemia. This will be discussed further in section 6.4.3.
6.4 MECHANISM OF IDIOPATHIC KETOTIC HYPOGLYCEMIA
Hormonal insufficiencies, such as of cortisol, GH, and epinephrine, have been suggested as causes of idiopathic ketotic hypoglycemia but have been ruled out consistently [6, 24, 125]. There were no such findings in our material (Papers I–II). Disorders of fatty acid oxidation predominantly present with symptoms associated with liver failure, and GSD0 has a very distinct diurnal pattern of lactate and ketone bodies not present in our patients (Papers I–II). In fact, other endocrine and metabolic diseases would not satisfy the criteria of idiopathic ketotic hypoglycemia.
It has also been proposed that ketone bodies would induce hypoglycemia [105], the same toxic effect that was expected when using the ketogenic diet as a diagnostic test [126]. It is not unusual for patients suffering from inborn errors of metabolism to present symptoms associated with accumulation of toxic compounds [127].
6.4.1 Energy expenditure
Younger children are known to have a higher relative energy expenditure than older ones [128], and this results in more rapid drainage of energy substrates.
Bodamer et al. suggested that children with idiopathic ketotic hypoglycemia have a higher basal metabolic rate, as measured by indirect calorimetry, compared to adult subjects [24]. However, the respiratory quotients were similar in the groups. An increased basal metabolic rate, in combination with a comparable respiratory quotient, would indicate increased peripheral glucose utilization in children who develop hypoglycemia. Measurements of respiratory quotients may add valuable information and might be considered when investigating children with alterations in the ketone body turnover.
6.4.2 Rate of glucose production
Early publications suggested an intolerance to fasting as the cause of hypoglycemia in children with idiopathic ketotic hypoglycemia. A glucagon test was used to demonstrate that children with ketotic hypoglycemia had a reduced response to glucagon stimulation, indicating that the stored glycogen was more rapidly depleted [29, 30, 42]. The early depletion of glycogen has been attributed to an alteration in carbohydrate metabolism. Earlier oxidation of unspecific substrates, i.e. accelerated starvation has also been suggested as a possible mechanism [26]. However, a rapid
36
depletion of the glycogen reserve can be due to either smaller amounts of glucose substrates, as previously suggested [42], or a pronounced utilization as we propose in the present studies (Papers I–II).
The serum concentration of alanine has previously been found to be low in children with idiopathic ketotic hypoglycemia suggesting a defect in the gluconeogenic pathway and concomitant fasting intolerance [28, 62]. Chaussain et al. observed a significant decrease in alanine during fasting, but on comparing children with hypoglycemia, with those who did not develop hypoglycemia, no differences were found [42]. However, the reduced concentration of alanine is a natural consequence of hypoglycemia since all available gluconeogenic substrates, and especially alanine, which occurs early in the gluconeogenetic pathway, will be used.
During the last 35 years the dominant hypothesis concerning idiopathic ketotic hypoglycemia has been a lowered ability to maintain a sufficient rate of glucose production during fasting [8] and, until recently, no attempts have been made to elucidate this assumption.
In a recent publication Huidekoper et al. [6] investigated 12 children aged 2 to 11 years previously diagnosed with idiopathic ketotic hypoglycemia. They compared the rate of glucose production after 12–16 hours of fasting with that after 20–22 hours of fasting. They found a lowered rate of glucose production during the fast of up to 32% in the children who developed hypoglycemia, suggesting that this was the cause of the idiopathic ketotic hypoglycemia. The corresponding decrease in the controls was 18%. Interestingly, only 5 of the 12 children previously known to have idiopathic ketotic hypoglycemia developed hypoglycemia during the fasting. The mean rate of glucose production at the end of the fast was 4.52 mg/kg/min in the children with hypoglycemia and 3.56 mg/kg/min in those who remained normoglycemic. The decreased rate of glucose production during the fast might be significant, but the values obtained do not indicate an insufficient rate in any of the groups. It is possible that the children with idiopathic ketotic hypoglycemia initially had a higher rate of glucose production to cover a higher peripheral glucose utilization. Actually, the children who did not develop hypoglycemia had a lower rate of glucose production, but they were also older.
Bodamer et al. also support he same theory of reduced glucose production in children with idiopathic ketotic hypoglycemia [24]. In their study the rate of glucose production was investigated after a fasting test and, according to previously published guidelines [129], the fasting period of 8–24 hours was defined prior to the start. Nine children with idiopathic ketotic hypoglycemia and 11 controls were examined. The children were homogeneous in age, weight, height, and BMI and the mean length of the fast was 16 and 14.5 hours for the ketotic children and the controls, respectively. The rate of glucose production at the end of the fast was 3.84 ± 0.46 mg/kg/min in comparison with 6.6 ± 0.59 mg/kg/min for the controls.
Both Huidekoper and Bodamer propose that a low rate of glucose production could be the cause of idiopathic ketotic hypoglycemia and presented rates of glucose production that were lower in the children who developed hypoglycemia than in

37
those who did not. However, on interpreting data from the two studies, the glucose production in the hypoglycemic children was found to be lower than in the controls in the Bodamer study whereas the opposite was found in the Huidekoper study. There is no evidence of a pathologically low rate, instead, in both studies the values are comparable with those of healthy prepubertal children [108].
In Paper II, 7 of the 9 children with idiopathic ketotic hypoglycemia and 9 of the children who remained normoglycemic were investigated regarding the rate of glucose production. Additionally, 9 healthy control children were included in this part of the investigation. The rate of glucose production was measured after 11–15 hours of fasting, and a separate fasting tolerance test was used to distinguish children with idiopathic ketotic hypoglycemia from the others. The results were 4.08, 4.87, and 4.74 mg/kg/min, respectively, for the ketotic, normoglycemic, and control children. Thus, there was no difference despite that the ability to remain normoglycemic varied. Furthermore, mean value for the 18 children who were normoglycemic was 4.8 mg/kg/min, thus in the same range as for the children who developed hypoglycemia in the study by Huidekoper et al. It has been suggested that more accurate calculations of rate of glucose production are obtained when using the mean weight for age [6], especially in cases that deviate from the mean weight, such as with overweight individuals. In Paper II we used accurate weights, measured at time of the investigation. When recalculated in all 25 children in Paper II, using weights from growth charts, there was still no difference between the groups.
However, the basal rate of glucose production is declining during this period of life and the age of the subjects must therefore be considered. In previous reports the younger children predominantly develop hypoglycaemia [30]. The greatest relative energy demand occurs during the first year of life. The early work of Bier et al. based, however, on a very limited number of investigations, shows that the relative rate of glucose production decline gradually from birth to approximately 25 kg, an expected weight for a 6-year-old chid [61].
In the present study, there was a negative correlation between age and GPR among the normoglycemic children (Figure 9 recalculated from Paper II). Some children who got the diagnosis idiopathic ketotic hypoglycemia seem to have low levels of glucose production rate in relation to their age. On the other hand other children who developed ketotic hypoglycaemia had normal levels of glucose production. Thus, our results clearly indicate that a low rate of glucose production can not alone explain idiopathic ketotic hypoglycemia.
On the other hand, no children with idiopathic ketotic hypoglycemia had a production rate in the higher range for their age. It might be suggested that a low rate of glucose production may not be the cause of idiopathic ketotic hypoglycemia, but a higher rate of glucose production may serve as protection against hypoglycemia.
38
Figure 9 Correlation between age and the rate of glucose production in normoglycemic children (filled circles) r = -0.74 p < 0.01 . Open circles: children with idiopathic ketotic hypoglycemia r=-0.32 (ns).
The length of the fast seems to be an important factor when estimating the rate of glucose production. Both Hudiekoper and Bodamer determined the rate at the termination of the fast; however, the criteria for termination differed. In the Huidekoper study the fasting was ended if hypoglycemic symptoms occurred, the glucose concentration was below 2.5 mmol/L, or after 22 hour of fasting. In the study by Bodamer et al. a previous published protocol defined the criteria, i.e. the age of the child determined the length of the fast [129] and 24 hours was suggested to be the maximum length of the fast. In the Huidekoper study the rate of glucose production was measured throughout the fast, giving valuable results concerning the changes in the production rate over time. In Papers I–II the rate of glucose production was obtained after 14–16 hours of fasting and it can be questioned to which extent GPR at that time reflects the GPR when hypoglycaemia occurs. However, one of the children in Paper II developed hypoglycemia during the measurement and, despite that the rate of glucose production was 3.5 mg/kg/min, i.e., normal for age.
It might be suggested that the time of fasting should be extended for more than 24 hours in children older than 6 years to increase the sensitivity of the test. The capacity for fasting increases with age due to lower relative energy demands in adulthood, and it has been shown that adults can tolerate fasting up to one month [66].
6.4.3 Alterations in ketone body turnover
It is a long known fact that children, compared to adults, have higher concentrations of ketone bodies after an overnight fast primarily due to differences in the relative basal metabolic rate [32]. In Paper II, children with idiopathic ketotic hypoglycemia, compared to normoglycemic ones, presented elevated levels of -hydroxybutyrate

39
several hours before hypoglycemia developed; see Figure 5. This might be due either to an enhanced ketone body production or to a decreased degradation. A similar result can be seen in an earlier publication: higher and significantly increased concentrations of total ketone bodies several hours before the development of hypoglycemia [28].
In Paper II, a logistic regression analysis identified glucose and -hydroxybutyrate as predictors of hypoglycemia as early as after 12 hours of fasting. Shortening of the fasting tolerance test would be desirable, but is not possible since the difference after 12 hours, although statistically significant, is not sensitive or specific enough for diagnostic purposes.
The two patients with SCOT deficiency (Paper III) also performed the fasting tolerance test, and their inability to metabolize ketone bodies resulted in a progressive rise in -hydroxybutyrate to such an extent that acidosis developed, which was also the reason for termination of the fast. The results from the fasting tolerance test are presented in Figure 10. The patterns are similar for all subjects, although the child with SCOT deficiency had the most pronounced increase in -hydroxybutyrate. Nevertheless, neither the child nor the adult subject with SCOT deficiency presented any signs of hypoglycemia. This indicates that neither an elevated level nor reduced metabolism of ketone bodies causes idiopathic ketotic hypoglycemia without other additional factors.
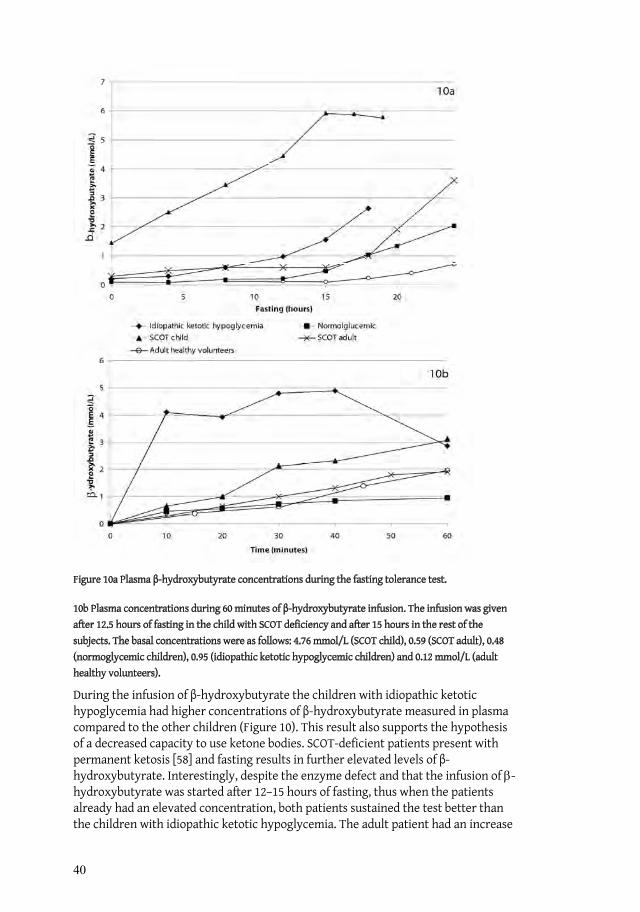
40
Figure 10a Plasma -hydroxybutyrate concentrations during the fasting tolerance test.
10b Plasma concentrations during 60 minutes of -hydroxybutyrate infusion. The infusion was given after 12.5 hours of fasting in the child with SCOT deficiency and after 15 hours in the rest of the subjects. The basal concentrations were as follows: 4.76 mmol/L (SCOT child), 0.59 (SCOT adult), 0.48 (normoglycemic children), 0.95 (idiopathic ketotic hypoglycemic children) and 0.12 mmol/L (adult healthy volunteers).
During the infusion of -hydroxybutyrate the children with idiopathic ketotic hypoglycemia had higher concentrations of -hydroxybutyrate measured in plasma compared to the other children (Figure 10). This result also supports the hypothesis of a decreased capacity to use ketone bodies. SCOT-deficient patients present with permanent ketosis [58] and fasting results in further elevated levels of -hydroxybutyrate. Interestingly, despite the enzyme defect and that the infusion of -hydroxybutyrate was started after 12–15 hours of fasting, thus when the patients already had an elevated concentration, both patients sustained the test better than the children with idiopathic ketotic hypoglycemia. The adult patient had an increase

41
in plasma -hydroxybutyrate in the same range as the healthy volunteers (Paper IV). This indicates that the mechanism causing the disturbed ketone body metabolism in children with idiopathic ketotic hypoglycemia is different from the enzymatic defect found in SCOT-deficient patients. This is also supported by the genetic studies. No mutations were found in the OXCT and ACAT1 gene in any of the children with idiopathic ketotic hypoglycemia.
The pattern seen during the -hydroxybutyrate tolerance test in the children with idiopathic ketotic hypoglycemia could be explained by an altered transport of ketone bodies into the tissues: see Figure 10 (Papers I-II). The transport mechanism is poorly understood, and our knowledge of the MCTs involved with ketone bodies is relatively new [130]. Today three MCTs are known to be involved in the transportation of ketone bodies and mutation analyses were performed in the corresponding genes in the patients with idiopathic ketotic hypoglycemia and SCOT deficiency. However, no mutations causing defective protein function were found. Thus, the mechanism causing the disturbed ketone body metabolism in subjects with idiopathic ketotic hypoglycemia remains to be identified.
The result of the tolerance test with -hydroxybutyrate implies that the utilization is lowered, but no conclusions can be drawn about the rate of production. We have not been able to measure the production and metabolism of ketone bodies directly. An investigation using stable isotopes with determinations of both -hydroxybutyrate and acetoacetate might possibly add valuable information, but, as previously mentioned we have not considered the method to be consistent enough for reliable evaluations of ketone body metabolism, at least not in our hands.
In summary, it seems clear that, in children with idiopathic ketotic hypoglycemia a disturbed metabolism of ketone bodies is present and is most likely of importance for the development of hypoglycemia. Elevated levels of ketone bodies during fasting is a natural course of event in children [68], but the high levels observed early on during the fast and before the occurrence of hypoglycemia, in combination with the higher levels of ketone bodies during the -hydroxybutyrate tolerance test in children with idiopathic ketotic hypoglycemia indicate that children with idiopathic ketotic hypoglycemia have a primary defect in their ketone body metabolism. However the normal fasting tolerance in subjects with SCOT deficiency indicates that a disturbed ketone body metabolism alone do not cause hypoglycemia. Conversely, a reduced availability of glucose or glucose substrates seems to be a prerequisite. Previous publications have unanimously shown that an intercurrent infection or a low energy intake precedes the attack [31] and a rate of glucose production in the lower normal range is probably also a prerequisite. Regardless of other factors such as a mild infection or decreased food intake, some of the children with symptoms of hypoglycemia will tolerate a fasting situation better due to a higher rate of glucose production. It may be suggested that the children in the normal to upper interval may be protected against hypoglycemia despite an inability to use ketone bodies.
42
6.4.4 Fetal programming
Two homozygotic twins were investigated in Paper I. The boys presented great differences in their ketone body turnover during fasting and the tolerance test with
-hydroxybutyrate. The results suggest that fetal nutrition and the impact on metabolic imprinting may also be involved in the development of idiopathic ketotic hypoglycemia.
During fetal life the fetus relies on the mothers energy supplies [71] and the fetal environment has consequences for lipid metabolism in adult life [131]. It has been shown that children born during intrauterine growth restriction (IUGR) who presented with hyperinsulinemia at birth later on developed ketotic hypoglycemia [7]. Among the first families investigated with ketotic hypoglycemia McQuarrie found a familial trait in spontaneous hypoglycemia [132].
Investigations on children born during starvation have linked fetal undernutrition to alterations in glucose regulation [133]. Studies on the process during in vitro fertilization (IVF) have shown that the culture medium is of great importance for the development of the cells [134].
Epigenetics is a term introduced in the 1940s and is used today to refer to chromatin and DNA modifications that are stable over cycles of cell division but do not involve changes in the underlying DNA sequence [135]. Histones are structures involved in the packaging of genomic DNA. Acetylation, methylation, phosphorylation, and ubiquitination are means by which epigenetic modification can take place. Some of the changes are reversible, while methylation is more stable and can affect the expression status of different regions of the genome. Methylation of DNA is suggested to result in silencing of the associated genes [136].
In Paper II birth weight of the participating children were obtained from the Swedish Medical Birth Register. None of the in total 9 children, except for the twin boys, had a birth weight that diverged from the expected. Thus, our results do not support the view that IUGR is of major importance for the development of idiopathic ketotic hypoglycemia.
6.5 LIMITATIONS
Idiopathic ketotic hypoglycemia and SCOT deficiency are not common features in the pediatric population and the number of participating patients in Papers I-III is rather small which limits the power of the findings. The loss of power also applies for Paper IV.
In Papers I-II, we have not performed direct measurements of ketone body production and metabolism. Nor did we perform any measurement in an attempt to determine basal metabolic rates in these children.
It might be argued that the measurements of the glucose production rate done in Papers I-III may not show the accurate situation since they were not performed during hypoglycemia or at the end of fasting. However, the test was performed after
43
12–15 hours of fasting. It would have been optimal to measure the rate of glucose production continuously during the last tertile of the fast, but it was not considered feasible.
6.6 IDIOPATHIC KETOTIC HYPOGLYCEMIA, COURSE OF CLINICAL EVENTS
A long-term follow-up is not available on children with idiopathic ketotic hypoglycemia and it is not known if the hypoglycemic periods have caused any neuronal damage. Nevertheless, in other respects, it seems that the long-term prognosis is good since the hypoglycemic tendency appears to disappear spontaneously around puberty [30, 31] and no cases after the teenage period have been reported. Why this is so, is not fully understood, but it could be due to a reduced relative brain energy demand when the brain-to-body ratio changes. An adaptation to the condition is also plausible, i.e. being more attentive to the physiological signals of a forthcoming hypoglycemia.
We still have contact with some of the hypoglycemic children investigated in Paper II. In conformity with earlier literature, it seems that the severe attacks of hypoglycemia have diminished, although some of the children still experience symptoms associated with the condition. It remains to be studied whether or not the disturbed ketone body metabolism identified in the children with idiopathic ketotic hypoglycemia in Paper II persists in adulthood.
The healthy volunteers in Paper IV were included in the study due to their subjective experience of fasting situations. None of them developed hypoglycemia, but still there was a difference between the groups regarding the sensations irritation and shakiness. It might be speculated that the glucose concentrations may not actually reach pathological levels, but that the decline, variation, and adrenergic response could be uncomfortable for some individuals.
6.7 GENERAL CONCLUSIONS
An integrated analysis of the results in this thesis indicates that the major prerequisite findings and factors for the development of idiopathic ketotic hypoglycemia can be summarized as in Figure 11.
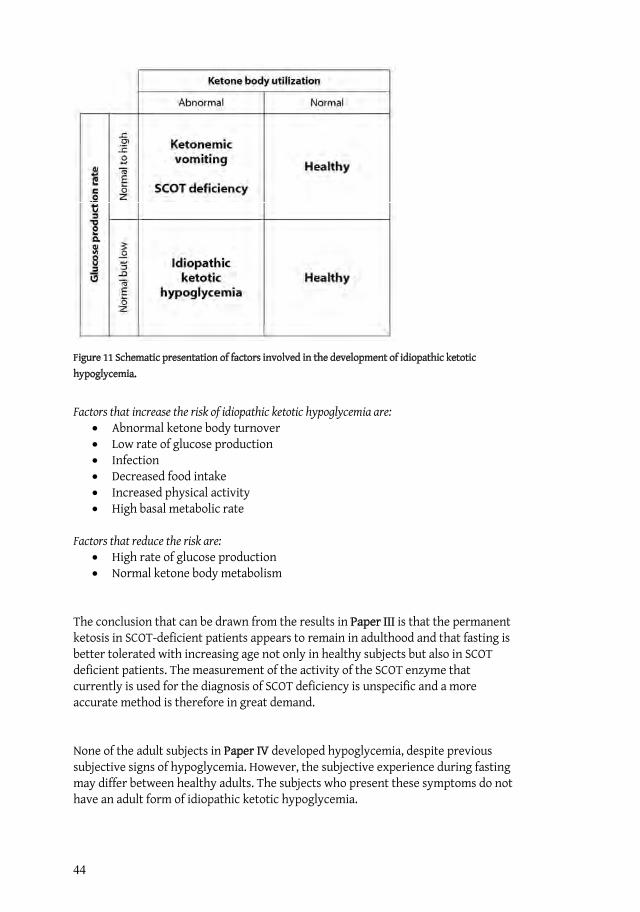
44
Figure 11 Schematic presentation of factors involved in the development of idiopathic ketotic hypoglycemia.
Factors that increase the risk of idiopathic ketotic hypoglycemia are: Abnormal ketone body turnover Low rate of glucose production Infection Decreased food intake Increased physical activity High basal metabolic rate
Factors that reduce the risk are: High rate of glucose production Normal ketone body metabolism
The conclusion that can be drawn from the results in Paper III is that the permanent ketosis in SCOT-deficient patients appears to remain in adulthood and that fasting is better tolerated with increasing age not only in healthy subjects but also in SCOT deficient patients. The measurement of the activity of the SCOT enzyme that currently is used for the diagnosis of SCOT deficiency is unspecific and a more accurate method is therefore in great demand.
None of the adult subjects in Paper IV developed hypoglycemia, despite previous subjective signs of hypoglycemia. However, the subjective experience during fasting may differ between healthy adults. The subjects who present these symptoms do not have an adult form of idiopathic ketotic hypoglycemia.
45
7 SAMMANFATTNING (SUMMARY IN SWEDISH) Bakgrund Den här avhandlingen har som främsta mål att försöka förstå mekanismerna bakom sjukdomen ”idiopatisk ketotisk hypoglukemi”. Detta är den vanligaste formen av symtomgivande låga blodsocker (hypoglykemi) bland barn. De första symptomen brukar uppträda efter de första sex levnadsmånaderna men före fem års ålder. Mellan attackerna med låga blodsocker är barnen helt friska. Barn med idiopatisk ketotisk hypoglykemi får lågt blodsocker och höga nivåer av ketonkroppar när de fastar. Anfallen med låga blodsocker brukar oftast uppträda på morgonen efter en tid med för lågt matintag.
Symtomen kan variera i svårighetsgrad från trötthet, illamående, huvudvärk till intensiva kräkningar, kramper och medvetslöshet. Eftersom symtomen varierar och ibland kan vara milda vet man inte hur vanligt förekommande tillståndet är. Trots att upprepade studier har gjorts på dessa barn så vet man inte vad det är som orsakar ketotisk hypoglukemi. Man har inte funnit några sjukliga störningar i hormonnivåer eller i ämnesomsättningen och diagnosen ställs utifrån kombinationen av låga blodsocker, avsaknad av andra störningar i ämnesomsättningen och höga nivåer i blod och urin av ketonkroppar.
Ketonkroppar bildas i levern när fettväv bryts ned och kan användas som extra energi när kroppens andra energikällor börjar sina. Denna möjlighet är speciellt viktig för barn eftersom dessa, jämfört med vuxna, har en snabbare energiomsättning och mindre möjlighet till lagring av energirika substanser. Det finns tre ketonkroppar. Två av dessa, -hydroxybutyrat och acetoacetat, cirkulerar med blodet medan aceton lämnar kroppen med andningsluften. Denna karaktäristiska syrliga fruktdoft som aceton ger upphov till kan man ibland känna i andedräkten på yngre barn efter en natts fasta. Ketonkropparna fördelas via blodet till olika organ och framför allt till hjärnan, som är det organ i kroppen som är mest känsligt för energibrist.
SyfteDet specifika syftet med denna avhandling var att undersöka omsättningen av ketonkroppar, förmågan att bilda glukos från kroppens övriga energireserver och förmågan att fasta hos barn och vuxna som har haft symptom på hypoglukemi eller en störning i nedbrytning av ketonkroppar.
Metod och resultat I den första artikeln undersökte vi ett par enäggstvillingar, där den ena hade ketotisk hypoglukemi och den andra var frisk trots att de är genetiskt identiska. De fastade i 24 timmar och deras förmåga att bryta ner ketonkroppar undersöktes när vi gav dem dropp med -hydroxybutyrat. Vi studerade även deras förmåga att bilda glukos under fasta. Underökningarna visade att den sjuka tvillingen, jämfört med hans bror, inte kunde utnyttja sina ketonkroppar. Vi undersökte även om det fanns några mutationer (ändringar i arvsanlaget) i de gener som styr nedbrytning och transport av ketonkroppar. Vi hittade inga mutationer hos tvillingarna. Deras förmåga att bilda

46
glukos var identiskt lika varför man kan dra slutsatsen att låg förmåga att bilda glukos inte är ensam förklaring till att idiopatisk ketotisk hypoglukemi utvecklas.
I den andra artikeln ville vi undersöka om en störd omsättning av ketonkroppar kan vara orsaken till ketotisk hypoglukemi. Tjugo barn som tidigare hade haft symptom på hypoglukemi fick göra samma undersökningar som tvillingarna. Nio av de sammanlagt 22 barnen (tvillingarna inräknade) fick hypoglukemi, och de 9 hade också en försämrad förmåga att använda sina ketonkroppar. Deras förmåga att bilda eget glukos var i det normala-låga intervallet och inga mutationer kunde hittas.
Ett av de enzymer (proteiner) som hjälper till med nedbrytningen av ketonkroppar heter succinyl CoA-3:ketoacid-CoA transferase (SCOT). I den tredje artikeln undersökte vi ett barn och en vuxen patient där man hade en misstanke om att det fanns ett fel i detta enzym. De båda patienternas symptom påminner mycket om de som barnen med ketotisk hypoglukemi har. De fastade men fick inte hypoglukemi. Däremot bildades det sura nedbrytningsprodukter som gjorde att fastan fick avslutas i förtid. Under fastan och när de fick dropp med -hydroxybutyrat visade det sig att de inte heller kunde bryta ner ketonkroppar. Deras egen glukosproduktion var normal. Hos de båda patienterna hittades fem mutationer i de gener som bestämmer hur SCOT-enzymet byggs upp. Med stor sannolikhet förklarar de funna mutationerna patienternas symptom. Dessa resultat visar att en nedsatt förmåga att utnyttja ketonkroppar inte ensamt leder till att man får lågt blodsocker vid fasta.
I den sista artikeln undersökte vi en grupp vuxna som upplevde att de fick symptom på hypoglukemi om de fastade. När vi jämförde dem med en kontrollgrupp under 24 timmars fasta så fick ingen av dem hypoglukemi. Tvärtom, blodsockernivåerna var helt lika när grupperna jämfördes. Deras nivåer av ketonkroppar var helt normala. Däremot så tyckte de att de blev mer irriterade och skakiga jämfört med kontrollerna.
Slutsats Resultatet från dessa studier tyder på att varken en låg egenproduktion av glukos eller en störd omsättning av ketonkroppar ensamt kan förklara varför vissa barn insjuknar i idiopatisk ketotisk hypoglukemi. Resultaten talar istället för att det är kombinationen av en störd omsättning av ketonkroppar och en glukosproduktion som är normal men i det låga normala intervallet som orsakar ketotisk hypoglukemi. Orsaken till den störda omsättningen av ketonkroppar är fortfarande okänd. Vuxna friska individer kan uppleva symtom på låga blodsocker trots att de egentligen har helt normala nivåer och en normal förmåga att fasta.
47
8 ACKNOWLEDGEMENTSFörst av allt vill jag tacka alla medverkande patienter, föräldrar och försökspersoner. Utan er medverkan och uthållighet så hade den här avhandlingen bara funnits till i mitt huvud. Speciellt tack till Jonathan och Fredrik Nilsson, ni som inspirerade mig till att forska inom just det här området.
Det är ett antal personer som bidragit till detta arbete, men jag vill framför allt tacka följande personer:
Professor Claude Marucs, min huvudhandledare. Tack för att du introducerade mig till forskningen och tack för allt jag lärt mig av dig under alla dessa år. Du har en otrolig förmåga att entusiasmera alla i din omgivning! Du kan alltid hitta det positiva i situationen, oavsett problematiken runt omkring. Vi har som du vet har helt olika tidsuppfattningar, men när vi väl ses så har du alltid ”eoner av tid”.
Min bihandledare sjukhuskemist Rolf Wibom, för din ständiga tillgånglighet, pålitlighet och pedagogiska diskussioner. Tack för tålmodiga förklaringar angående enzymaktivitet och för alla skratt.
Märta Fredriksson, sektreterare och projektkoordinator. Du är vår klippa och utan dig hade ingen utav oss kommit så värst långt. Tack för att du kan utföra det omöjliga vid den mest orimliga tidpunkt.
Professor Jan Gustafsson, för att du alltid är så tillmötesgående och för att du på ett pedagogiskt sätt delat med dig av din kunskap om stabila isotoper. Du har aldrig varit längre bort än ett telefonsamtal.
Mina medförfattare, Jens Eriksson, Elzbieta Petriczko och Deborah Frithiof. Tack till Jan Alm, för stor hjälp vid rekrytering av patienter, samt minst sagt livliga diskussioner om metabola rubbningar.
Gamla och nya kollegor på Barnendokrinlab B62. Det har varit så roligt att arbeta med er! Pernilla Danielsson, som har varit med från den allra första början, och följt alla turer under dessa år. Susanne Öhlin och Helén Zemack för att ni lärde mig vad man gör på ett lab. Speciellt Helén för att du har varit min förlängda arm när jag inte fysiskt har varit på lab. Tack till Gislea Nyberg, Aziz Elgadhi, Michaela Forssén för bra diskussioner och roligt sällskap på lab! Tack även till de övriga medarbetare i forskargruppen, Gunilla Morinder, Örjan Ekblom, Maria Westerståhl, Kerstin Ekbom, Tilda Hultkvist och Eva Flygare-Wallén
Jan Kowalski för ovärderlig hjälp gällande den mest ogenomträngliga disciplinen, statistiken.
Mats Blennow, som kom som en räddande ängel i sista sekunden. Utan dig hade jag inte kunnat disputera alls!

48
Alla sjuksköterskor och doktorer på DEMO, fram för allt endokrinsjuksköterskorna Jenny Gårdman, Christina Månsson, Jaana Roonkainen, Lotta Johansson och Åsa Lavett.
Jag vill även tacka Ulrika von Döbeln och personalen på CMMS, för givande diskussioner och för att jag har fått tillbringa tid på labbet.
Stort tack till familjen Hultman för visat intresse och stöd, Christina min externa mentor och Sofia, ständig lika positivt och ett stort stöd.
Agneta Wittlock, för all hjälp med pappersexercisen.
Per Nydert från Apoteket för att du har tagit dig tid att sätta mig in i farmakokinetiken.
CMA Microdialysis som alltid har intresserat sig för min forskning och varit behjälplig i olika sammanhang.
Isaac Austin för den snabba granskningen av språket.
Lisa You, min underbara syster som ställt upp och hjälpt sin okunniga syster med alla bilder och layout.
Min fantastiska familj och släkt som har följt min forskningskarriär under så lång tid, alltid med stort intresserade trots att ni inte alltid förstått vad jag hållit på med. Det är skönt att veta att ni alltid finns till hands!
Sist av allt vill jag tacka alla mina underbara och härliga vänner för ovärderligt stöd under denna tid. Tusen tack för alla uppmuntrande samtal och för alla behövliga middagar!
49
9 REFERENCES
1. Aynsley-Green, A., Hypoglycaemia in infants and children. Clin Endocrinol Metab, 1982. 11(1): p. 159-94.
2. Auer, R.N. and B.K. Siesjo, Hypoglycaemia: brain neurochemistry and neuropathology. Baillieres Clin Endocrinol Metab, 1993. 7(3): p. 611-25.
3. Elimam, A., et al., Diagnosis of hypoglycaemia: effects of blood sample handling and evaluation of a glucose photometer in the low glucose range. Acta Paediatr, 1997. 86(5): p. 474-8.
4. Lteif, A.N. and W.F. Schwenk, Hypoglycemia in infants and children.Endocrinol Metab Clin North Am, 1999. 28(3): p. 619-46, vii.
5. Thornton, P.S., Hypoglycemia, in Pediatric Endocrinology: The requisites in pediatrics, T.J. Moshang, Editor. 2005, Elsevier Mosby: Philadelphia. p. 37-59.
6. Huidekoper, H.H., et al., Fasting adaptation in idiopathic ketotic hypoglycemia: a mismatch between glucose production and demand. Eur J Pediatr, 2007.
7. Kochar, I.S. and K. Hussain, From hyperinsulinaemic hypoglycaemia to ketotic hypoglycaemia: the range of glucose abnormalities in patients born with intrauterine growth retardation. Eur J Pediatr, 2007. 166(10): p. 1003-7.
8. Senior, B., Ketotic hypoglycemia. A tale (tail) of Gauss? J Pediatr, 1973. 82(3): p. 555-6.
9. Koh, T.H., et al., Neural dysfunction during hypoglycaemia. Arch Dis Child, 1988. 63(11): p. 1353-8.
10. Lucas, A., R. Morley, and T.J. Cole, Adverse neurodevelopmental outcome of moderate neonatal hypoglycaemia. Bmj, 1988. 297(6659): p. 1304-8.
11. Gerich, J.E., et al., Hypoglycemia unawareness. Endocr Rev, 1991. 12(4): p. 356-71.
12. Service, F.J., Hypoglycemic disorders. N Engl J Med, 1995. 332(17): p. 1144-52.
13. Mitrakou, A., et al., Hierarchy of glycemic thresholds for counterregulatory hormone secretion, symptoms, and cerebral dysfunction. Am J Physiol, 1991. 260(1 Pt 1): p. E67-74.
14. Gregory, J.W. and A. Aynsley-Green, The definition of hypoglycaemia.Baillieres Clin Endocrinol Metab, 1993. 7(3): p. 587-90.
15. Horal, M., et al., Metabolic adaptation in IUGR neonates determined with microdialysis--a pilot study. Early Hum Dev, 1995. 42(1): p. 1-14.
16. Haymond, M.W., Hypoglycemia in infants and children. Endocrinol Metab Clin North Am, 1989. 18(1): p. 211-52.
17. Ryan, C.M., Does moderately severe hypoglycemia cause cognitive dysfunction in children? Pediatr Diabetes, 2004. 5(2): p. 59-62.
18. Hershey, T., et al., Frequency and timing of severe hypoglycemia affects spatial memory in children with type 1 diabetes. Diabetes Care, 2005. 28(10): p. 2372-7.
19. Warren, R.E. and B.M. Frier, Hypoglycaemia and cognitive function. Diabetes Obes Metab, 2005. 7(5): p. 493-503.
20. Rozance, P.J. and W.W. Hay, Hypoglycemia in newborn infants: Features associated with adverse outcomes. Biol Neonate, 2006. 90(2): p. 74-86.
21. Alkalay, A.L., et al., Brain imaging findings in neonatal hypoglycemia: case report and review of 23 cases. Clin Pediatr (Phila), 2005. 44(9): p. 783-90.
22. Sakazaki, H., et al., A new Japanese case of succinyl-CoA: 3-ketoacid CoA-transferase deficiency. J Inherit Metab Dis, 1995. 18(3): p. 323-5.
23. Ross, S.G. and H.W. Josephs, Observations on the metabolism of recurrent vomiting. Am J of Diseases of Child, 1924: p. 447-457.
24. Bodamer, O.A., et al., Glucose and leucine kinetics in idiopathic ketotic hypoglycaemia. Arch Dis Child, 2006. 91(6): p. 483-6.
25. Weinstein, D.A., et al., Hepatic glycogen synthase deficiency: an infrequently recognized cause of ketotic hypoglycemia. Mol Genet Metab, 2006. 87(4): p. 284-8.
50
26. Stanley, C.A., Parsing ketotic hypoglycaemia. Arch Dis Child, 2006. 91(6): p. 460-1.
27. Grunt, J.A., et al., Studies of children with ketotic hypoglycemia. Yale J Biol Med, 1970. 42(6): p. 420-38.
28. Haymond, M.W., I.E. Karl, and A.S. Pagliara, Ketotic hypoglycemia: an amino acid substrate limited disorder. J Clin Endocrinol Metab, 1974. 38(4): p. 521-30.
29. Colle, E. and R.A. Ullstrom, Ketotic hypoglycemia. The Journal of Pediatrics, 1964. 64(5): p. 632-50.
30. Dahlquist, G., et al., Ketotic hypoglycemia of childhood--a clinical trial of several unifying etiological hypotheses. Acta Paediatr Scand, 1979. 5(68): p. 649-56.
31. Daly, L.P., K.C. Osterhoudt, and S.A. Weinzimer, Presenting features of idiopathic ketotic hypoglycemia. J Emerg Med, 2003. 25(1): p. 39-43.
32. Mitchell, G.A., et al., Medical aspects of ketone body metabolism. Clin Invest Med, 1995. 18(3): p. 193-216.
33. Wets, B., et al., Cataracts and ketotic hypoglycemia. Ophthalmology, 1982. 89(9): p. 999-1002.
34. Wilson, W.A., Ocular findings in ketotic hypoglycemia. Trans Am Ophthalmol Soc, 1969. 67: p. 355-68.
35. Kinoshita, J.H., Mechanisms initiating cataract formation. Proctor Lecture.Invest Ophthalmol, 1974. 13(10): p. 713-24.
36. Carroll, P.B., et al., Rapid onset of severe retinopathy, cataracts and neuropathy in young patients with diabetes mellitus. Acta Paediatr, 1992. 81(4): p. 355-8.
37. Hull, D., Cataracts associated with metabolic disorders in infancy. Proc R Soc Med, 1969. 62(7): p. 694-6.
38. Endres, W. and Y.S. Shin, Cataract and metabolic disease. J Inherit Metab Dis, 1990. 13(4): p. 509-16.
39. Haargaard, B., et al., A nationwide Danish study of 1027 cases of congenital/infantile cataracts: etiological and clinical classifications.Ophthalmology, 2004. 111(12): p. 2292-8.
40. Matsubara, T., et al., Ketotic hypoglycemia in patients with allergic diseases.Pediatr Int, 2003. 45(6): p. 653-5.
41. Haymond, M.W. and A.S. Pagliara, Ketotic hypoglycaemia. Clin Endocrinol Metab, 1983. 12(2): p. 447-62.
42. Chaussain, J.L., et al., Glycemic response to 24-hour fast in normal children and children with ketotic hypoglycemia: II. Hormonal and metabolic changes. J Pediatr, 1974. 85(6): p. 776-81.
43. Pershad, J., K. Monroe, and J. Atchison, Childhood hypoglycemia in an urban emergency department: epidemiology and a diagnostic approach to the problem. Pediatr Emerg Care, 1998. 14(4): p. 268-71.
44. Broberger, O. and R. Zetterström, Hypoglycaemia with an inability to increase the epinephrine sectretion in insulin-induced hypoglycaemia. J Pediatr, 1961. 2(59): p. 215-222.
45. Christensen, N.J., Hypoadrenalinemia during insulin hypoglycemia in children with ketotic hypoglycemia. J Clin Endocrinol Metab, 1974. 38(1): p. 107-12.
46. Boyle, P.J. and J. Zrebiec, Physiological and behavioral aspects of glycemic control and hypoglycemia in diabetes. South Med J, 2007. 100(2): p. 175-82.
47. Hussain, K. and A. Aynsley-Green, Management of hyperinsulinism in infancy and childhood. Ann Med, 2000. 32(8): p. 544-51.
48. Aynsley-Green, A., et al., Practical management of hyperinsulinism in infancy.Arch Dis Child Fetal Neonatal Ed, 2000. 82(2): p. F98-F107.
49. Saudubray, J.M., et al., Clinical approach to inherited metabolic disorders in neonates: an overview. Semin Neonatol, 2002. 7(1): p. 3-15.
50. Roe, C.R., Inherited disorders of mitochondrial fatty acid oxidation: a new responsibility for the neonatologist. Semin Neonatol, 2002. 7(1): p. 37-47.
51. Olpin, S.E., Implications of impaired ketogenesis in fatty acid oxidation disorders. Prostaglandins Leukot Essent Fatty Acids, 2004. 70(3): p. 293-308.

51
52. Iafolla, A.K., R.J. Thompson, Jr., and C.R. Roe, Medium-chain acyl-coenzyme A dehydrogenase deficiency: clinical course in 120 affected children. J Pediatr, 1994. 124(3): p. 409-15.
53. Saudubray, J.M., et al., Recognition and management of fatty acid oxidation defects: a series of 107 patients. J Inherit Metab Dis, 1999. 22(4): p. 488-502.
54. Ijlst, L., et al., Common missense mutation G1528C in long-chain 3-hydroxyacyl-CoA dehydrogenase deficiency. Characterization and expression of the mutant protein, mutation analysis on genomic DNA and chromosomal localization of the mitochondrial trifunctional protein alpha subunit gene. J Clin Invest, 1996. 98(4): p. 1028-33.
55. den Boer, M.E., et al., Long-chain 3-hydroxyacyl-CoA dehydrogenase deficiency: clinical presentation and follow-up of 50 patients. Pediatrics, 2002. 109(1): p. 99-104.
56. Rutledge, S.L., et al., Case report: liver glycogen synthase deficiency--a cause of ketotic hypoglycemia. Pediatrics, 2001. 108(2): p. 495-7.
57. Gitzelmann, R., et al., Liver glycogen synthase deficiency: a rarely diagnosed entity. Eur J Pediatr, 1996. 155(7): p. 561-7.
58. Niezen-Koning, K.E., et al., Succinyl-CoA:acetoacetate transferase deficiency: identification of a new patient with a neonatal onset and review of the literature. Eur J Pediatr, 1997. 156(11): p. 870-3.
59. Baric, I., et al., A new case of succinyl-CoA:acetoacetate transferase deficiency: favourable course despite very low residual activity. J Inherit Metab Dis, 2001. 24(1): p. 81-2.
60. Fukao, T., C.R. Scriver, and N. Kondo, The clinical phenotype and outcome of mitochondrial acetoacetyl-CoA thiolase deficiency (beta-ketothiolase or T2 deficiency) in 26 enzymatically proved and mutation-defined patients. Mol Genet Metab, 2001. 72(2): p. 109-14.
61. Bier, D.M., et al., Measurement of "true" glucose production rates in infancy and childhood with 6,6-dideuteroglucose. Diabetes, 1977. 26(11): p. 1016-23.
62. Pagliara, A.S., et al., Hypoalaninemia: a concomitant of ketotic hypoglycemia. J Clin Invest, 1972. 51(6): p. 1440-9.
63. Mitchell, G.A. and T. Fukao, Inborn Errors of Ketone Body Metabolism, in The Metabolic & Molecular Bases of Inherited Disease, C.R. Scriver and A.L. Beaudet, Editors. 2001, The McGraw-Hill Companies Incorperated: New York. p. 2327-2356.
64. Balasse, E.O. and F. Fery, Ketone body production and disposal: effects of fasting, diabetes, and exercise. Diabetes Metab Rev, 1989. 5(3): p. 247-70.
65. Morris, A.A., Cerebral ketone body metabolism. J Inherit Metab Dis, 2005. 28(2): p. 109-21.
66. Owen, O.E., et al., Liver and kidney metabolism during prolonged starvation. J Clin Invest, 1969. 48(3): p. 574-83.
67. Bonnefont, J.P., et al., The fasting test in paediatrics: application to the diagnosis of pathological hypo- and hyperketotic states. Eur J Pediatr, 1990. 150(2): p. 80-5.
68. Saudubray, J.M., et al., Variation in plasma ketone bodies during a 24-hour fast in normal and in hypoglycemic children: relationship to age. J Pediatr, 1981. 98(6): p. 904-8.
69. Wolfsdorf, J.I., A. Sadeghi-Nejad, and B. Senior, Fat-derived fuels during a 24-hour fast in children. Eur J Pediatr, 1982. 138(2): p. 141-4.
70. Fery, F. and E.O. Balasse, Response of ketone body metabolism to exercise during transition from postabsorptive to fasted state. Am J Physiol, 1986. 250(5 Pt 1): p. E495-501.
71. Herrera, E., Lipid metabolism in pregnancy and its consequences in the fetus and newborn. Endocrine, 2002. 19(1): p. 43-55.
72. Cahill, G.F., Jr., Fuel metabolism in starvation. Annu Rev Nutr, 2006. 26: p. 1-22.
73. Fukao, T., et al., Patients homozygous for the T435N mutation of succinyl-CoA:3-ketoacid CoA Transferase (SCOT) do not show permanent ketosis.Pediatr Res, 2004. 56(6): p. 858-63.
52
74. Perez-Cerda, C., et al., A new case of succinyl-CoA: acetoacetate transferase deficiency. J Inherit Metab Dis, 1992. 15(3): p. 371-3.
75. Hartman, A.L., et al., The neuropharmacology of the ketogenic diet. Pediatr Neurol, 2007. 36(5): p. 281-92.
76. Huttenlocher, P.R., Ketonemia and seizures: metabolic and anticonvulsant effects of two ketogenic diets in childhood epilepsy. Pediatr Res, 1976. 10(5): p. 536-40.
77. Bough, K.J. and J.M. Rho, Anticonvulsant mechanisms of the ketogenic diet.Epilepsia, 2007. 48(1): p. 43-58.
78. DeVivo, D.C., A.S. Pagliara, and A.L. Prensky, Ketotic hypoglycemia and the ketogenic diet. Neurology, 1973. 23(6): p. 640-9.
79. Fery, F. and E.O. Balasse, Ketone body production and disposal in diabetic ketosis. A comparison with fasting ketosis. Diabetes, 1985. 34(4): p. 326-32.
80. Fery, F. and E.O. Balasse, Ketone body turnover during and after exercise in overnight-fasted and starved humans. Am J Physiol, 1983. 245(4): p. E318-25.
81. Herrera, E. and E. Amusquivar, Lipid metabolism in the fetus and the newborn.Diabetes Metab Res Rev, 2000. 16(3): p. 202-10.
82. Williamson, D.H., et al., Activities of enzymes involved in acetoacetate utilization in adult mammalian tissues. Biochem J, 1971. 121(1): p. 41-7.
83. Owen, O.E., et al., Brain metabolism during fasting. J Clin Invest, 1967. 46(10): p. 1589-95.
84. Reichard, G.A., Jr., et al., Ketone-body production and oxidation in fasting obese humans. J Clin Invest, 1974. 53(2): p. 508-15.
85. Kayser, M.A., Disorders of ketone production and utilization. Mol Genet Metab, 2006. 87(4): p. 281-3.
86. Zschocke, J., et al., The diagnosis of mitochondrial HMG-CoA synthase deficiency. J Pediatr, 2002. 140(6): p. 778-80.
87. Gibson, K.M., J. Breuer, and W.L. Nyhan, 3-Hydroxy-3-methylglutaryl-coenzyme A lyase deficiency: review of 18 reported patients. Eur J Pediatr, 1988. 148(3): p. 180-6.
88. Korman, S.H., Inborn errors of isoleucine degradation: a review. Mol Genet Metab, 2006. 89(4): p. 289-99.
89. Fukao, T., et al., Enzymes of ketone body utilization in human tissues: protein and messenger RNA levels of succinyl-coenzyme A (CoA):3-ketoacid CoA transferase and mitochondrial and cytosolic acetoacetyl-CoA thiolases. Pediatr Res, 1997. 42(4): p. 498-502.
90. Fenselau, A. and K. Wallis, Ketone body usage by mammals. Acetoacetate substrate inhibition of CoA transferase from various rat tissues. Life Sci, 1974. 15(4): p. 811-8.
91. Daum, R.S., et al., A "new" disorder of isoleucine catabolism. Lancet, 1971. 2(7737): p. 1289-90.
92. Leonard, J.V., B. Middleton, and J.W. Seakins, Acetoacetyl CoA thiolase deficiency presenting as ketotic hypoglycemia. Pediatr Res, 1987. 21(2): p. 211-3.
93. Halestrap, A.P. and D. Meredith, The SLC16 gene family-from monocarboxylate transporters (MCTs) to aromatic amino acid transporters and beyond. Pflugers Arch, 2004. 447(5): p. 619-28.
94. Visser, W.E., et al., Thyroid hormone transport by monocarboxylate transporters. Best Pract Res Clin Endocrinol Metab, 2007. 21(2): p. 223-36.
95. Nehlig, A., Cerebral energy metabolism, glucose transport and blood flow: changes with maturation and adaptation to hypoglycaemia. Diabetes Metab, 1997. 23(1): p. 18-29.
96. Dombrowski, G.J., Jr., K.R. Swiatek, and K.L. Chao, Lactate, 3-hydroxybutyrate, and glucose as substrates for the early postnatal rat brain.Neurochem Res, 1989. 14(7): p. 667-75.
97. Friesema, E.C., et al., Association between mutations in a thyroid hormone transporter and severe X-linked psychomotor retardation. Lancet, 2004. 364(9443): p. 1435-7.
98. Trajkovic, M., et al., Abnormal thyroid hormone metabolism in mice lacking the monocarboxylate transporter 8. J Clin Invest, 2007. 117(3): p. 627-35.
53
99. Diderholm, B., et al., Decreased maternal lipolysis in intrauterine growth restriction in the third trimester. Bjog, 2006. 113(2): p. 159-64.
100. Wildenhoff, K.E., A micro-method for the enzymatic determination of acetoacetate and 3-hydroxybutyrate in blood and urine. Scand J Clin Lab Invest, 1970. 25(2): p. 171-9.
101. Li, P.K., et al., Direct, fixed-time kinetic assays for beta-hydroxybutyrate and acetoacetate with a centrifugal analyzer or a computer-backed spectrophotometer. Clin Chem, 1980. 26(12): p. 1713-7.
102. Baumeister, F.A., A. Hack, and R. Busch, Glucose-monitoring with continuous subcutaneous microdialysis in neonatal diabetes mellitus. Klin Padiatr, 2006. 218(4): p. 230-2.
103. Hildingsson, U., et al., Microdialysis for metabolic monitoring in neonates after surgery. Acta Paediatr, 1996. 85(5): p. 589-94.
104. Loridan, L. and B. Senior, Effects of infusion of ketones in children with ketotic hypoglycemia. J Pediatr, 1970. 76(1): p. 69-74.
105. Neptune, E.M., junior, Changes in blood glucose during metabolism of betahydroxybutyrate. Am J Physiology, 1965. 187: p. 451-453.
106. Snyderman, S.E., C. Sansaricq, and B. Middleton, Succinyl-CoA:3-ketoacid CoA-transferase deficiency. Pediatrics, 1998. 101(4 Pt 1): p. 709-11.
107. Ensembl. Ensembl Human Exon View. 2007 2007 06 26 [cited; Available from: http://www.ensembl.org/Homo_sapiens/exonview?sscon=400&flanking=400&transcript=ENST00000196371&db=core&submit.x=45&submit.y=4.
108. Sunehag, A.L., et al., Glucose production, gluconeogenesis, and insulin sensitivity in children and adolescents: an evaluation of their reproducibility.Pediatr Res, 2001. 50(1): p. 115-23.
109. Rennie, M.J., An introduction to the use of tracers in nutrition and metabolism.Proc Nutr Soc, 1999. 58(4): p. 935-44.
110. Koletzko, B., et al., The use of stable isotope techniques for nutritional and metabolic research in paediatrics. Early Hum Dev, 1998. 53 Suppl: p. S77-97.
111. Chien, P.F., et al., Protein turnover in the human fetus studied at term using stable isotope tracer amino acids. Am J Physiol, 1993. 265(1 Pt 1): p. E31-5.
112. Kalhan, S.C., S.M. Savin, and P.A. Adam, Estimation of glucose turnover with stable tracer glucose-1-13C. J Lab Clin Med, 1977. 89(2): p. 285-94.
113. van Kempen, A.A., et al., Glucose production in response to glucagon is comparable in preterm AGA and SGA infants. Clin Nutr, 2005. 24(5): p. 727-36.
114. Bier, D.M., Stable isotopes in biosciences, their measurement and models for amino acid metabolism. Eur J Pediatr, 1997. 156 Suppl 1: p. S2-8.
115. Christensen, C.K., et al., Effect of 3-hydroxybutyrate infusion on urinary protein excretion in healthy man. Scand J Clin Lab Invest, 1986. 46(3): p. 239-43.
116. Avogaro, A., et al., Ketone body kinetics in vivo using simultaneous administration of acetoacetate and 3-hydroxybutyrate labelled with stable isotopes. Acta Diabetol Lat, 1990. 27(1): p. 41-51.
117. Beylot, M., et al., Determination of human ketone body kinetics using stable-isotope labelled tracers. Diabetologia, 1986. 29(2): p. 90-6.
118. Wastney, M.E., S.E. Hall, and M. Berman, Ketone body kinetics in humans: a mathematical model. J Lipid Res, 1984. 25(2): p. 160-74.
119. Fink, G., et al., Pseudoketogenesis in the perfused rat heart. J Biol Chem, 1988. 263(34): p. 18036-42.
120. Song, X.Q., et al., Succinyl-CoA:3-ketoacid CoA transferase (SCOT) deficiency: two pathogenic mutations, V133E and C456F, in Japanese siblings.Hum Mutat, 1998. 12(2): p. 83-8.
121. Fukao, T., et al., A 6-bp deletion at the splice donor site of the first intron resulted in aberrant splicing using a cryptic splice site within exon 1 in a patient with succinyl-CoA: 3-Ketoacid CoA transferase (SCOT) deficiency. Mol Genet Metab, 2006.
122. Fukao, T., et al., Identification of an Alu-mediated tandem duplication of exons 8 and 9 in a patient with mitochondrial acetoacetyl-CoA thiolase (T2) deficiency. Mol Genet Metab, 2007.
54
123. Pretorius, C.J., et al., Two siblings with episodic ketoacidosis and decreased activity of succinyl-CoA:3-ketoacid CoA-transferase in cultured fibroblasts. J Inherit Metab Dis, 1996. 19(3): p. 296-300.
124. Fukao, T., et al., Characterization of six mutations in five Spanish patients with mitochondrial acetoacetyl-CoA thiolase deficiency: effects of amino acid substitutions on tertiary structure. Mol Genet Metab, 2002. 75(3): p. 235-43.
125. Pollack, E.S. and C.V. Pollack, Jr., Ketotic hypoglycemia: a case report. J Emerg Med, 1993. 11(5): p. 531-4.
126. Kogut, M.D., M. Blaskovics, and G.N. Donnell, Idiopathic hypoglycemia: a study of twenty-six children. J Pediatr, 1969. 74(6): p. 853-71.
127. Rinaldo, P., D. Matern, and M.J. Bennett, Fatty acid oxidation disorders. Annu Rev Physiol, 2002. 64: p. 477-502.
128. Torun, B., Energy requirements of children and adolescents. Public Health Nutr, 2005. 8(7A): p. 968-93.
129. Morris, A.A., et al., Evaluation of fasts for investigating hypoglycaemia or suspected metabolic disease. Arch Dis Child, 1996. 75(2): p. 115-9.
130. Halestrap, A.P. and N.T. Price, The proton-linked monocarboxylate transporter (MCT) family: structure, function and regulation. Biochem J, 1999. 343 Pt 2: p. 281-99.
131. Barker, D.J., Fetal origins of coronary heart disease. Bmj, 1995. 311(6998): p. 171-4.
132. McQuarrie, I., Idiopathic spontaneously occurring hypoglycemia in infants; clinical significance of problem and treatment. AMA Am J Dis Child, 1954. 87(4): p. 399-428.
133. Ravelli, A.C., et al., Glucose tolerance in adults after prenatal exposure to famine. Lancet, 1998. 351(9097): p. 173-7.
134. Miles, H.L., P.L. Hofman, and W.S. Cutfield, Fetal origins of adult disease: a paediatric perspective. Rev Endocr Metab Disord, 2005. 6(4): p. 261-8.
135. Cutfield, W.S., et al., Could epigenetics play a role in the developmental origins of health and disease? Pediatr Res, 2007. 61(5 Pt 2): p. 68R-75R.
136. Cheung, P. and P. Lau, Epigenetic regulation by histone methylation and histone variants. Mol Endocrinol, 2005. 19(3): p. 563-73.
Related Documents


