www.nicsa.org | #WebinarWednesdays “Glocal" Distribution Strategies Wednesday, November 29 | 10:00am – 11:00am ET

Welcome message from author
This document is posted to help you gain knowledge. Please leave a comment to let me know what you think about it! Share it to your friends and learn new things together.
Transcript

www.nicsa.org | #WebinarWednesdays
“Glocal" Distribution Strategies
Wednesday, November 29 | 10:00am – 11:00am ET

www.nicsa.org | #WebinarWednesdays
Scott Brady - ModeratorVice President,
Head of Product
Development & Strategy
Columbia Threadneedle Investments, US
Diana MackayCEO
MackayWIlliams
Angelos GousiosDirector,
European Retail Research
Cerulli Associates Europe
Presenters

www.nicsa.org | #WebinarWednesdays
Confidential. Not for re-distribution.
Global Fund Distribution
By: Angelos Gousios, Director of European Retail Research
29 November, 2017

www.nicsa.org | #WebinarWednesdays
Global Distribution Landscape

www.nicsa.org | #WebinarWednesdays
Global Asset Management Industry Assets Under Management by
Region, 2012–2021E (US$ trillions)
U.S. marketshare gradually being eroded by Asia and Europe
60.366.2
72.3 75.479.3
84.389.2
94.5100.2
106.3
45.6%
44.6%
46.1%
47.7% 47.8%48.4%
49.0%49.5%
50.1%50.7%
44%
46%
48%
50%
52%
US$0
US$20
US$40
US$60
US$80
US$100
US$120
2012 2013 2014 2015 2016 2017E 2018E 2019E 2020E 2021E
Global Non-US (% of global)
50.1%
United States
Analyst Note: We have attempted to remove double-counting wherever data transparency allows us to do so. Some minor restatement occasionally
occurs between review periods. ¹Includes Canada, Latin America, and other assets.
Source: Cerulli Associates, The Cerulli Report - Global Markets 2017: How to Succeed Internationally
www.nicsa.org | #WebinarWednesdays
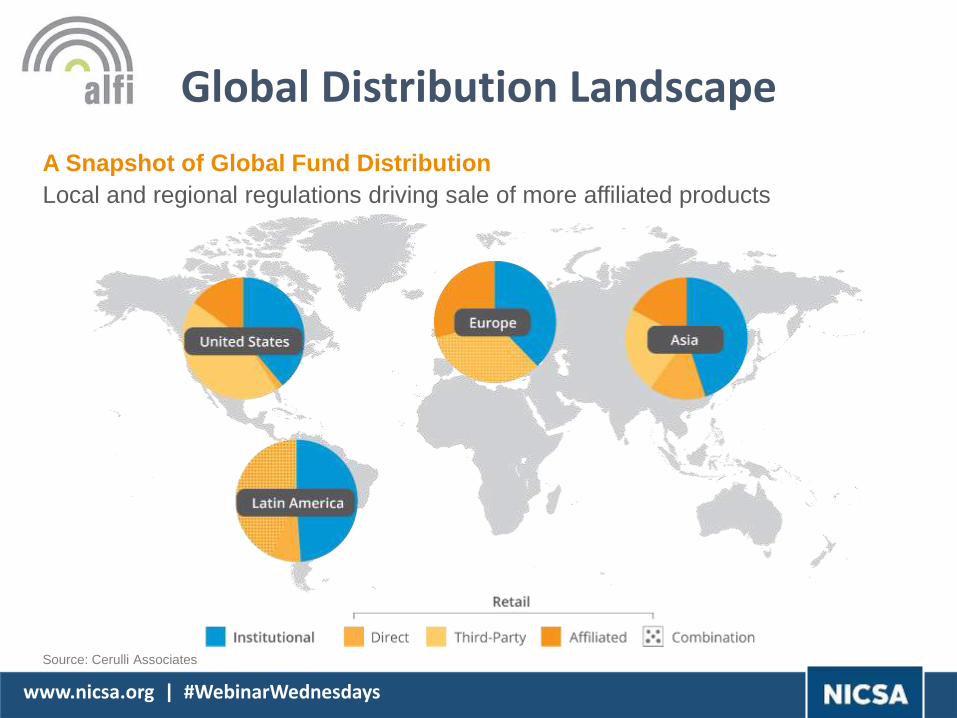
Local and regional regulations driving sale of more affiliated products
Source: Cerulli Associates
A Snapshot of Global Fund Distribution
Global Distribution Landscape
www.nicsa.org | #WebinarWednesdays
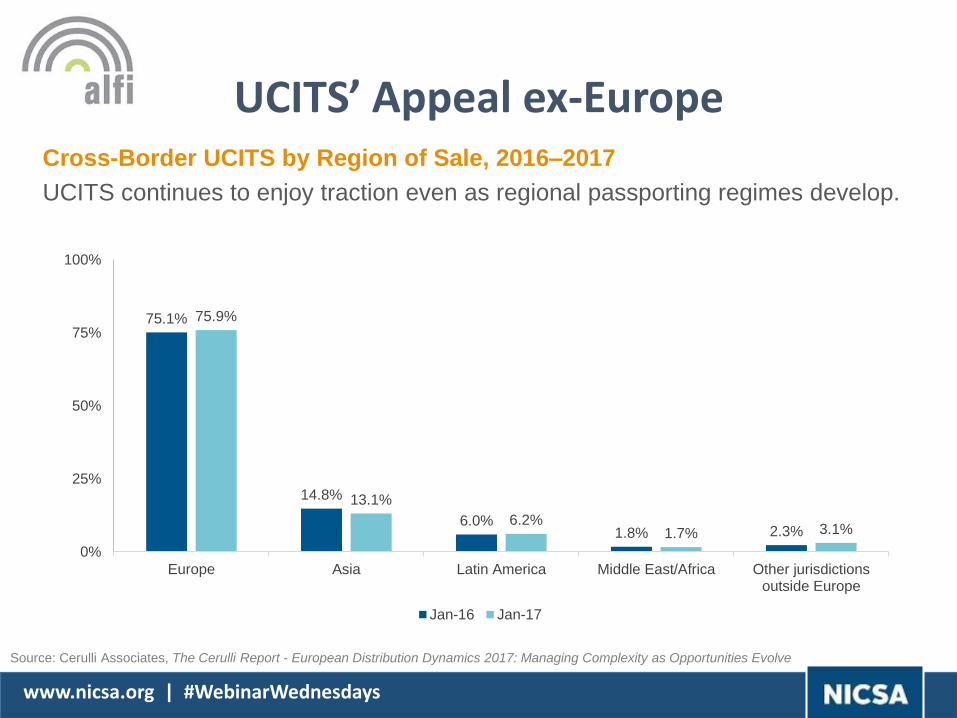
Cross-Border UCITS by Region of Sale, 2016–2017
UCITS continues to enjoy traction even as regional passporting regimes develop.
Source: Cerulli Associates, The Cerulli Report - European Distribution Dynamics 2017: Managing Complexity as Opportunities Evolve
75.1%
14.8%
6.0%1.8% 2.3%
75.9%
13.1%
6.2%1.7% 3.1%
0%
25%
50%
75%
100%
Europe Asia Latin America Middle East/Africa Other jurisdictionsoutside Europe
Jan-16 Jan-17
UCITS’ Appeal ex-Europe

www.nicsa.org | #WebinarWednesdays
Asia ex-Japan

www.nicsa.org | #WebinarWednesdays
Asia Ex-Japan Mutual Fund Assets Under Management by Country, 2012–2021E (US$
billions)
Source: Cerulli Associates, The Cerulli Report – Global Markets 2017: How to Succeed Internationally
Country 2012 2013 2014 2015 2016 2017E 2018E 2019E 2020E 2021E
CAGR2016-2021E
China 387.5 418.7 634.6 1,171.7 1,251.1 1,442.4 1,649.6 1,872.2 2,106.8 2,348.0 13.4%
Korea 158.0 153.9 166.1 180.0 178.7 186.3 195.7 205.9 217.2 229.9 5.2%
Taiwan 131.9 137.3 154.5 153.3 148.9 160.9 171.7 182.7 193.3 203.8 6.5%
India 109.5 119.5 152.2 184.6 236.9 291.7 341.6 399.0 465.2 539.8 17.9%
Hong Kong 93.8 108.1 123.5 122.7 130.9 144.8 159.1 174.6 189.9 204.1 9.3%
Singapore 36.7 48.0 56.4 58.5 60.3 64.3 68.6 73.6 79.1 85.3 7.2%
Total 917.4 985.5 1287.3 1870.8 2006.8 2290.4 2586.3 2908 3251.5 3610.9 12.5%
Asia ex-Japan

www.nicsa.org | #WebinarWednesdays
Asia Ex-Japan Mutual Fund Assets Under Management by Distribution
Channel, 2014–2016
Efforts underway to diversify fund distribution channels but banks likely to retain tight control
Analyst Note: 1Includes mutual fund sales through ILPs and direct sales.
Source: Cerulli Associates, The Cerulli Report - Asian Distribution Dynamics 2017: New Horizons Await—Venturing into Overseas Markets
17%24% 27%
48%41%
40%
15% 14% 12%
13% 15% 15%
7% 6% 6%
0%
20%
40%
60%
80%
100%
2014 2015 2016
Direct Banks Securities companies Independent financial advisors/Platforms Insurance companies(1)
Asia ex-Japan
www.nicsa.org | #WebinarWednesdays
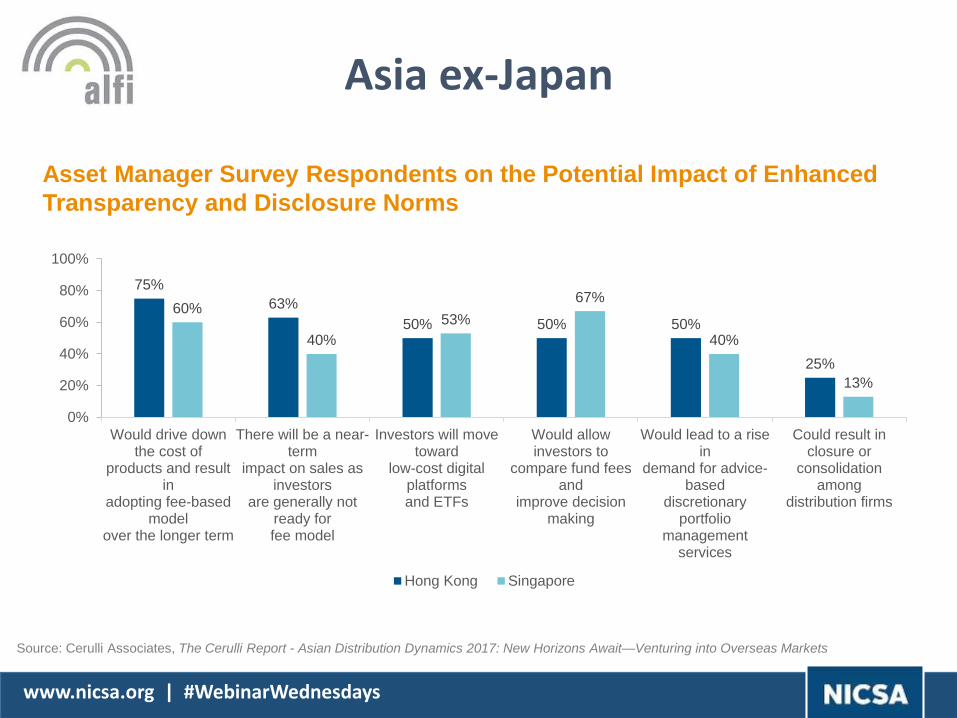
Asset Manager Survey Respondents on the Potential Impact of Enhanced
Transparency and Disclosure Norms
Source: Cerulli Associates, The Cerulli Report - Asian Distribution Dynamics 2017: New Horizons Await—Venturing into Overseas Markets
75%
63%
50% 50% 50%
25%
60%
40%
53%
67%
40%
13%
0%
20%
40%
60%
80%
100%
Would drive downthe cost of
products and resultin
adopting fee-basedmodel
over the longer term
There will be a near-term
impact on sales asinvestors
are generally notready forfee model
Investors will movetoward
low-cost digitalplatformsand ETFs
Would allowinvestors to
compare fund feesand
improve decisionmaking
Would lead to a risein
demand for advice-based
discretionaryportfolio
managementservices
Could result inclosure or
consolidationamong
distribution firms
Hong Kong Singapore
Asia ex-Japan

www.nicsa.org | #WebinarWednesdays
Asia Ex-Japan Exchange-Traded Fund Assets Under Management,
2012–2016 (US$ billions)
Analyst Note: Locally domiciled only.
Source: Cerulli Associates, The Cerulli Report - Asian Distribution Dynamics 2017: New Horizons Await—Venturing into Overseas Markets
23.4 23.1
36.4
66.2
52.1
12.216.1 16.3 17.9
20.8
4.5 4.3 5 6.2 8
2 1.5 2 2.65.1
26.424
35.1 34.9
29.2
1.5 1.3 1.5 1.5 1.6
$0
$20
$40
$60
$80
2012 2013 2014 2015 2016
China Korea Taiwan India Hong Kong Singapore
Asia ex-Japan
www.nicsa.org | #WebinarWednesdays
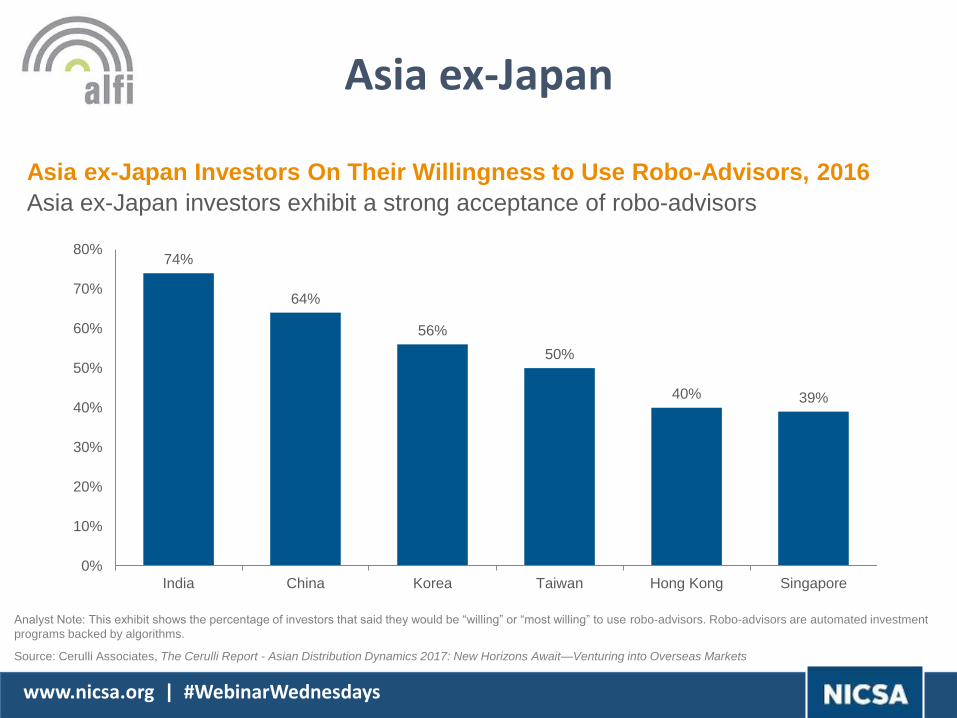
Asia ex-Japan Investors On Their Willingness to Use Robo-Advisors, 2016
Asia ex-Japan investors exhibit a strong acceptance of robo-advisors
Analyst Note: This exhibit shows the percentage of investors that said they would be “willing” or “most willing” to use robo-advisors. Robo-advisors are automated investment
programs backed by algorithms.
Source: Cerulli Associates, The Cerulli Report - Asian Distribution Dynamics 2017: New Horizons Await—Venturing into Overseas Markets
74%
64%
56%
50%
40% 39%
0%
10%
20%
30%
40%
50%
60%
70%
80%
India China Korea Taiwan Hong Kong Singapore
Asia ex-Japan
www.nicsa.org | #WebinarWednesdays
Europe –entering a new age of distribution
Diana Mackay, CEO MackayWilliams LLP
www.nicsa.org

www.nicsa.org | #WebinarWednesdays
Mapping out the European
landscape;
New dynamics in distribution;
Disruption
Agenda
www.nicsa.org | #WebinarWednesdays
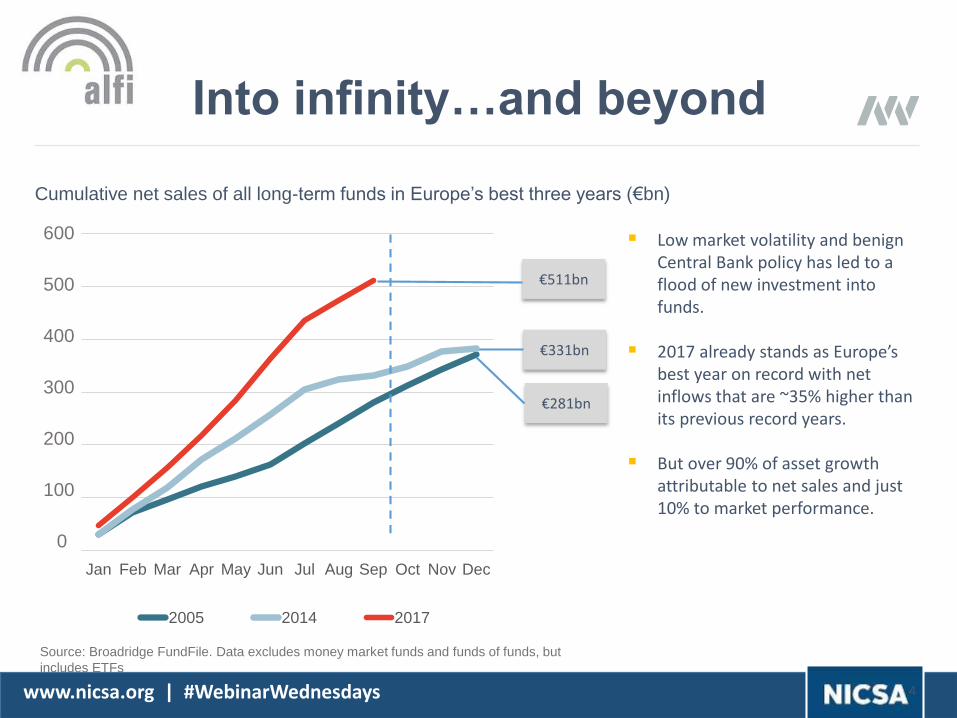
€331bn
Jan Feb Mar Apr May Jun Jul Aug Sep Oct Nov Dec
2005 2014 2017
€511bn
Into infinity…and beyond
Cumulative net sales of all long-term funds in Europe’s best three years (€bn)
Source: Broadridge FundFile. Data excludes money market funds and funds of funds, but
includes ETFs
4
200
300
400
500
600
100
0
€281bn
Low market volatility and benign Central Bank policy has led to a flood of new investment into funds.
2017 already stands as Europe’s best year on record with net inflows that are ~35% higher than its previous record years.
But over 90% of asset growth attributable to net sales and just 10% to market performance.
www.nicsa.org | #WebinarWednesdays
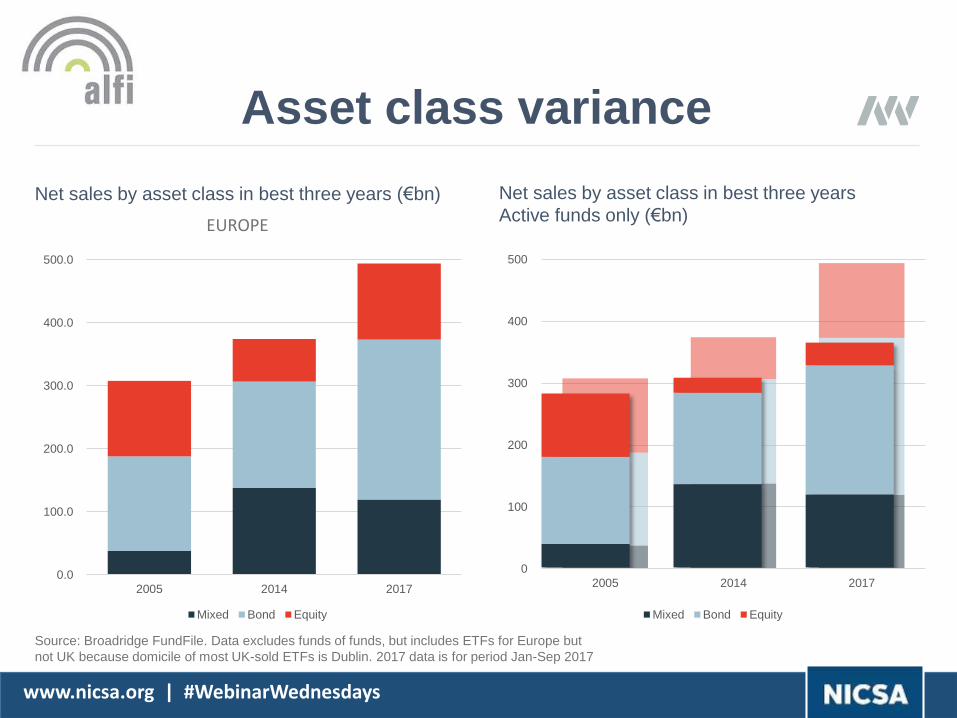
Asset class variance
Net sales by asset class in best three years (€bn)
EUROPE
Source: Broadridge FundFile. Data excludes funds of funds, but includes ETFs for Europe but
not UK because domicile of most UK-sold ETFs is Dublin. 2017 data is for period Jan-Sep 2017
Net sales by asset class in best three years
Active funds only (€bn)
0.0
100.0
200.0
300.0
400.0
500.0
2005 2014 2017
Mixed Bond Equity
0
100
200
300
400
500
2005 2014 2017
Mixed Bond Equity

www.nicsa.org | #WebinarWednesdays
A period of extraordinary sales growth
18
-100,000
0
100,000
200,000
300,000
400,000
500,000
600,000
700,000
800,000
2013
2014
2015
2016
2017
Mixed Asset Bond Equity
• Investors chase safety in bonds fuelled by central bank QE initiatives;
• Mixed assets outrun equities, boosted by demand for absolute return and diluted exposure to risk;
• Core active equity funds struggle to prove their added value.
5 yr cumulative monthly net sales by asset class (€m)
Source: MackayWilliams analysis of Broadridge FundFile data
Data excludes money market funds and funds of funds
€742bn
€631bn
€324bn

www.nicsa.org | #WebinarWednesdays
Taking account of the changing world
But … regulation is changing industry dynamics
Source: MackayWilliams
Impact of the financial crisis and Central
Bank policies to flood liquidity into markets,
and terminally low interest rates;
New mood of optimism amongst investors,
including mainstream consumers;
In Continental Europe, bank focus on
building profits rather than boosting cash
reserves;
Search for alpha or uncorrelated investment
options set against context of robust
provision of beta via low-cost passives.
www.nicsa.org | #WebinarWednesdays
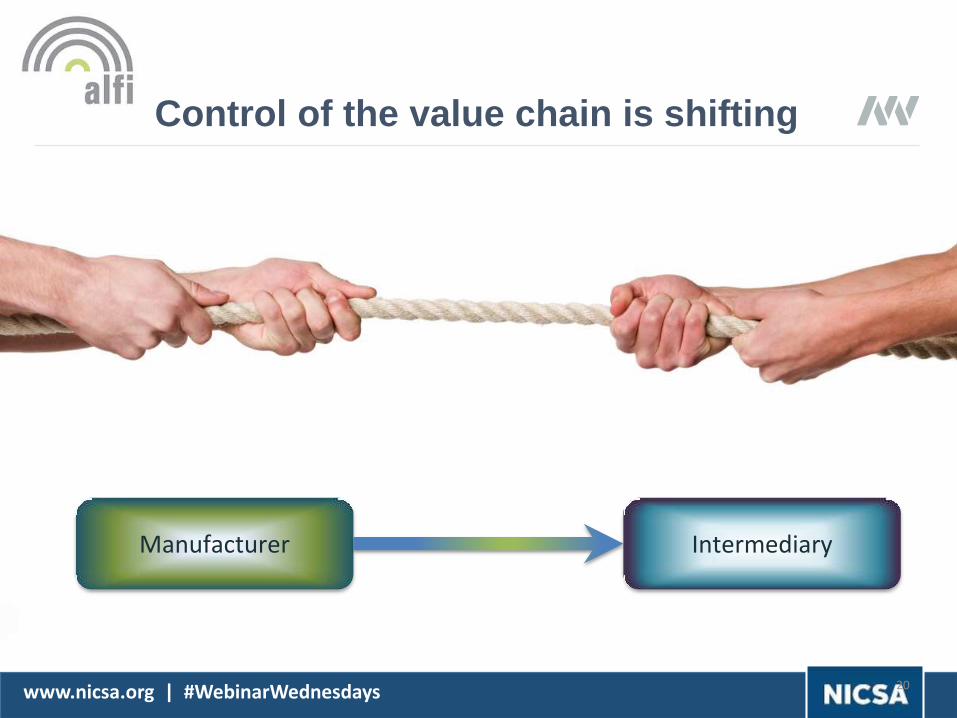
Control of the value chain is shifting
20
Manufacturer Intermediary

www.nicsa.org | #WebinarWednesdays
Apocalypse…
Passive will take over
Winner takes all, the squeezed middle and product proliferation
A race to the bottom on prices
Client engagement
Competition from newcomers

www.nicsa.org | #WebinarWednesdays
Threats – real or
imagined
www.nicsa.org | #WebinarWednesdays 23
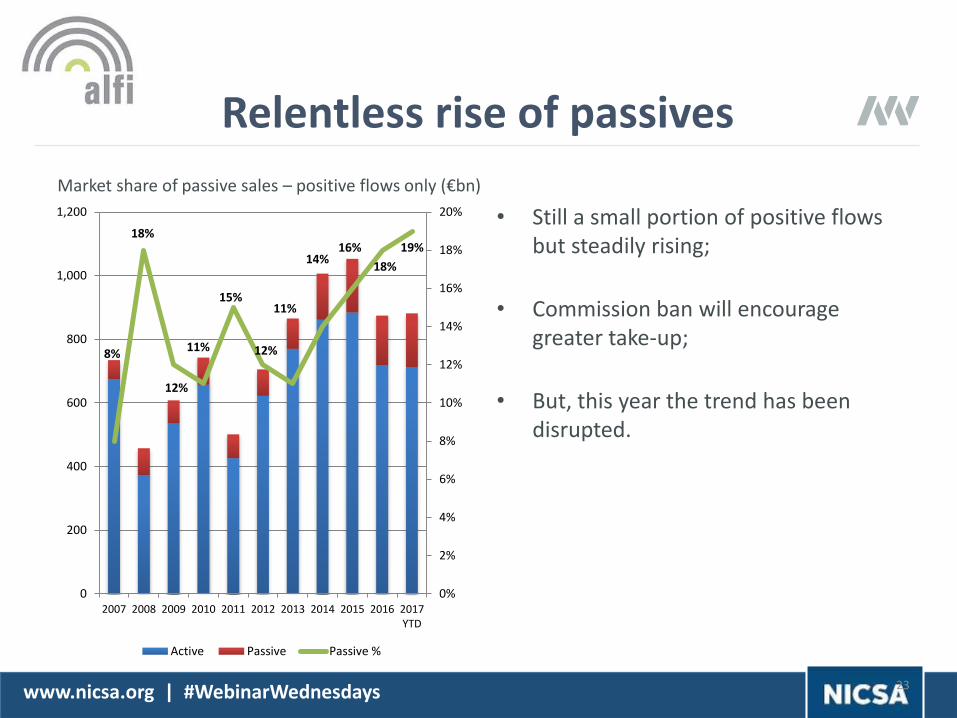
• Still a small portion of positive flows but steadily rising;
• Commission ban will encourage greater take-up;
• But, this year the trend has been disrupted.
8%
18%
12%
11%
15%
12%
11%
14%16%
18%
19%
0%
2%
4%
6%
8%
10%
12%
14%
16%
18%
20%
0
200
400
600
800
1,000
1,200
2007 2008 2009 2010 2011 2012 2013 2014 2015 2016 2017YTD
Active Passive Passive %
Market share of passive sales – positive flows only (€bn)
Relentless rise of passives

www.nicsa.org | #WebinarWednesdays
Net sales 2005 2014 2017
7 5 4Annual net sales of….. €10bn+
€0m+€1bn
73 83 79€1bn-€10bn
Number of groups in each net sales band – active funds only (€bn)
% sales taken by top fund
2005 2014 2017
1% 2% 7%
793 958 927
Winner takes all?

www.nicsa.org | #WebinarWednesdays
Race to the bottom on pricing
The move towards
passive investments is
creating downwards
pressure on fund prices
generally, but I expect
that good active
managers will be able to
demonstrate that they
can produce and
sustain their
performance over timeDiscretionary portfolio manager
Source: MackayWilliams, Fund Buyer Focus distributor interviews
The distributor discussion has shifted from
‘what retrocession are you offering?’ to ‘how do
you justify the fee that you want to charge?’.
Pricing pressure is being felt most in the
commoditised passive arena.
In active funds, demand is growing for access
to the lowest priced share class but good
performance outweighs fees.
Performance fees are generally disliked, but if
implemented they must be simple and easy to
explain to clients.

www.nicsa.org | #WebinarWednesdays
Client engagement
‘Selling’ advisory services will play an important role
for providers in the future, which is why we have to
concentrate, expand and broaden our expertise. I
hope for good co-operation with our fund providers
in terms of joint customer events and presentations
but also for an effective communication of
investment ideas.
Discretionary portfolio manager
Product is the traditional core of the asset management offer, butthe future is in operating as a service industry
Source: MackayWilliams, Fund Buyer Focus distributor interviews

www.nicsa.org | #WebinarWednesdays
Competition from newcomers
I have noticed that fund
companies are trying to
pursue new business
lines and cooperation
agreements rather than
just offer products. I
have come across
attempts to set up joint
wealth managements
and Robo-Advice.
Discretionary portfolio
manager
Source: MackayWilliams, Fund Buyer Focus distributor interviews
The rise of the trusted adviser and its
conversion to asset manager;
Attractions of robo-advice

www.nicsa.org | #WebinarWednesdays
Disruption

www.nicsa.org | #WebinarWednesdays
Changing product mix
Rotation – not from bond to equity but…
From developed markets to emerging markets;
From niche to generalist;
From single strategies to solutions;
From active to passive

www.nicsa.org | #WebinarWednesdays
Developed to emerging
Source: Broadridge FundFile. Data excludes funds of funds. Graphic based on ‘super-sector’ so
all EM-based sectors merged. 2017 data is for period Jan-Sep 2017
-50,000
0
50,000
100,000
150,000
200,000
250,000
300,000
350,000
400,000
2002 2004 2006 2008 2010 2012 2014 2016
Cumulative net sales history –Bond (€m)
Bonds Emerging Markets Bonds Global Currencies
-100,000
-50,000
0
50,000
100,000
150,000
200,000
250,000
300,000
2002 2004 2006 2008 2010 2012 2014 2016
Cumulative net sales history – Equities (€m)
Eq Europe Eq Global Eq Emerging Markets
EM Bond is Europe’s 16th largest sector but
ranks 3rd for net inflows EM Equity is Europe’s 6th largest sector but
ranks 11th for net inflows
Financial crisis Financial crisis

www.nicsa.org | #WebinarWednesdays
Single strategies to solutions
-200
0
200
400
600
800
1,000
1,200
DevelopedEquity
Outcomes Higher RiskBonds
Core Bonds EM and AsiaEquity
Other Theme Equity
Total net sales by style, Sep ‘07 – Aug ‘17 (€bn)
Source: MackayWilliams analysis of Broadridge FundFile data, excluding money market funds and funds of funds. ‘Outcomes’ consists of mixed asset, alternative,
and bonds global currencies sectors.
Many of the most popular
sectors of the past decade
focus on ‘outcomes’.
But the bond category has
also undergone an important
transformation, diversifying
into riskier areas.

www.nicsa.org | #WebinarWednesdays
Active to passive
Source: MackayWilliams analysis of Broadridge FundFile data. Data excludes money market funds and funds of funds
Asset class Active (€bn) Passive (€bn)
Equity -92 415
Bond 648 218
Mixed Asset 755 1
Equity Bond
-300
-200
-100
0
100
200
300
400
500
2007 2008 2009 2010 2011 2012 2013 2014 2015 2016 2017YTD
Active Passive
-300
-200
-100
0
100
200
300
400
500
600
700
2007 2008 2009 2010 2011 2012 2013 2014 2015 2016 2017YTD
Active Passive
Cumulative flows by asset class over the last 10 years (€bn)
Mixed asset funds unaffected by rotation

Q&AQUESTIONS & ANSWERS SESSION
www.nicsa.org | #WebinarWednesdays

Related Documents