This PDF is a selection from a published volume from the National Bureau of Economic Research Volume Title: Globalization in Historical Perspective Volume Author/Editor: Michael D. Bordo, Alan M. Taylor and Jeffrey G. Williamson, editors Volume Publisher: University of Chicago Press Volume ISBN: 0-226-06598-7 Volume URL: http://www.nber.org/books/bord03-1 Conference Date: May 3-6, 2001 Publication Date: January 2003 Title: Globalization and Capital Markets Author: Maurice Obstfeld, Alan M. Taylor URL: http://www.nber.org/chapters/c9587

Welcome message from author
This document is posted to help you gain knowledge. Please leave a comment to let me know what you think about it! Share it to your friends and learn new things together.
Transcript

This PDF is a selection from a published volume from theNational Bureau of Economic Research
Volume Title: Globalization in Historical Perspective
Volume Author/Editor: Michael D. Bordo, Alan M. Taylorand Jeffrey G. Williamson, editors
Volume Publisher: University of Chicago Press
Volume ISBN: 0-226-06598-7
Volume URL: http://www.nber.org/books/bord03-1
Conference Date: May 3-6, 2001
Publication Date: January 2003
Title: Globalization and Capital Markets
Author: Maurice Obstfeld, Alan M. Taylor
URL: http://www.nber.org/chapters/c9587

121
3.1 Global Capital Markets: Overview and Origins
At the turn of the twenty-first century, the merits of international finan-cial integration are under more forceful attack than at any time since the1940s. Even mainstream academic proponents of free multilateral com-modity trade, such as Bhagwati, argue that the risks of global financial in-tegration outweigh the benefits it affords. Critics from the left such asEatwell, more skeptical even of the case for free trade on current account,suggest that since the 1960s “free international capital flows” have been “as-sociated with a deterioration in economic efficiency (as measured by growthand unemployment)” (Eatwell 1997, 2).1
The resurgence of concerns over international financial integration is un-derstandable in light of the financial crises in Latin America in 1994–95,
Maurice Obstfeld is the Class of 1958 Professor of Economics at the University of Califor-nia–Berkeley and a research associate of the National Bureau of Economic Research. Alan M.Taylor is professor of economics at the University of California–Davis and a research associ-ate of the National Bureau of Economic Research.
Jay Shambaugh, Julian di Giovanni, and Miguel Fuentes provided superb research assis-tance. For assistance with data we thank Luis Bértola, Michael Bordo, Guillermo Bózzoli,Charles Calomiris, Gregory Clark, Niall Ferguson, Stephen Haber, Ian McLean, SatyenMehta, Chris Meissner, Leandro Prados de la Escosura, Jamie Reis, Gail Triner, MichaelTwomey, and Tarik Yousef. For editorial suggestions we thank Michael Bordo. We receivedhelpful comments from our discussant Richard Portes; from Marc Flandreau and other con-ference participants at Santa Barbara; from Michael Jansson, Lawrence Officer, and Rolf vomDorp; and from participants in seminars at Stanford Graduate School of Business, the Uni-versity of Southern California, the University of Oregon, the University of California–SanDiego, the Bank of Japan, King’s College, Cambridge, and Universidad Argentina de la Em-presa, Buenos Aires. Obstfeld acknowledges the financial support of the National ScienceFoundation, through a grant administered by the National Bureau of Economic Research.
1. See Bhagwati (1998) and Eatwell. For a skeptical perspective on the future prospects ofeconomic integration in general, see Rodrik (2000).
3Globalization and Capital Markets
Maurice Obstfeld and Alan M. Taylor

East Asia and Russia in 1997–98, and Argentina in 2001–02. Proponents offree trade in tangible goods have long recognized that its net benefits tocountries typically are distributed unevenly, creating domestic winners andlosers. But recent international financial crises have submerged entireeconomies and threatened their trading partners, inflicting losses allaround. International financial transactions rely intrinsically on the expec-tation that counterparties will fulfill future contractual commitments; theytherefore place confidence and possibly volatile expectations at centerstage.2 These same factors are present in purely domestic financial trades,of course; but oversight, adjudication, and enforcement all are orders ofmagnitude more difficult among sovereign nations with distinct nationalcurrencies than within a single national jurisdiction. Moreover, there is nonatural world lender of last resort, so international crises are intrinsicallyharder to head off and contain. Factors other than the threat of crises, suchas the power of capital markets to constrain domestically oriented eco-nomic policies, also have sparked concerns over greater financial openness.
The ebb and flow of international capital since the nineteenth century il-lustrates recurring difficulties, as well as the alternative perspectives fromwhich policymakers have tried to confront them. The subsequent sectionsof this paper are devoted to documenting these vicissitudes quantitativelyand explaining them. Economic theory and economic history together canprovide useful insights into events of the past and deliver relevant lessonsfor today. We argue that theories of how international capital mobility hasevolved must be understood within the framework of the basic policytrilemma constraining an open economy’s choice of monetary regime.
3.1.1 The Emergence of World Capital Markets
Prior to the nineteenth century, the geographical scope for internationalfinance was relatively limited compared to what was to come. Italian banksof the Renaissance financed trade and government around the Mediter-ranean, and as trade expanded within Europe, financial innovations spreadfarther north through the letters of credit developed at the ChampagneFairs and the new banks in North Sea ports such as Bruges and Antwerp.Later, London and Amsterdam became the key centers, and their curren-cies and financial instruments were the principal focus of market players. Asthe industrial revolution gathered force and radiated out from GreatBritain, the importance of international financial markets became more ap-parent in both the public and private spheres.3
In due course, the scope for such trades extended to other centers that de-veloped the markets and institutions capable of supporting international fi-nancial transactions, and whose governments were not hostile to such de-
122 Maurice Obstfeld and Alan M. Taylor
2. The vast majority of commodity trades also involve an element of intertemporal ex-change, via deferred or advance payment for goods, but the unwinding of the resulting cross-border obligations tends to be predictable.
3. See Cameron (1993); Neal (1990, 2000); Oppers (1993); Brezis (1995).

velopments. In the eastern United States, a broad range of centers includ-ing Boston, Philadelphia, and Baltimore gave way to what became the dom-inant center of national and international finance, New York. By the latenineteenth century, both France and Germany had developed sophisticatedand expanding international markets, well integrated into the networks ofglobal finance. Elsewhere in Europe and the New World similar markets be-gan from an embryonic stage, and eventually financial trading spread toplaces as far afield as Melbourne and Buenos Aires.4
As we shall discuss later, after 1870 these developments were to progresseven further. With the world starting to converge on the gold standard as amonetary system, and with technological developments in shipping (e.g.,steamships’ replacing sail; the Panama Canal) and communications (thetelegraph, transoceanic cables), the first global marketplace in capital, aswell as in goods and labor, took shape in an era of undisputed liberalism andvirtual laissez-faire.
Within finance, the technological and institutional developments weremany: the use of modern communications to transmit prices; the develop-ment of a very broad array of private debt and equity instruments, and thewidening scope for insurance activities; the expanding role of governmentbond markets internationally; and the more widespread use of forward andfutures contracts, and derivative securities. By 1900, the use of such instru-ments permeated the major economic centers of dozens of countriesaround the world, stretching from Europe, east and west, north and south,to the Americas, Asia, and Africa. The key currencies and instruments wereknown everywhere, and formed the basis for an expanding world commer-cial network, whose rise was equally meteoric. Bills of exchange, bond fi-nance, equity issues, foreign direct investments, and many other types oftransactions were by then quite common among the core countries, andamong a growing number of nations at the periphery.
Aside from haute finance, more and more day-to-day activities came intothe orbit of finance via the growth and development of banking systems inmany countries, offering checking and saving accounts as time passed. Thisin turn raised the question of whether banking supervision would be doneby the banks themselves or the government authorities, with solutions in-cluding free banking and “wildcat” banks (as in the United States), andchanging over time to include supervisory functions as part of a broadercentral monetary authority, the central bank. From what was once an eso-teric sector of the economy, the financial sector grew locally and globally totouch an ever-expanding range of activity.5
Globalization and Capital Markets 123
4. On the United States see Davis (1965) and Sylla (1975, 1998). On Europe see Kindleberger(1984). For a comprehensive discussion of the historical and institutional developments insome key countries where international financial markets made an impact at this time—theUnited Kingdom, the United States, Australia, Argentina, and Canada—see Davis and Gall-man (2001). On comparative financial deepening and sophistication see Goldsmith (1985).
5. On financial development, see chapter 8, by Rousseau and Sylla, in this volume.

Thus, the scope for capital markets to do good—or do harm—loomedlarger as time went by. As an ever-greater part of national and internationaleconomies became monetized and sensitive to financial markets, agents inall spheres—public and private, labor and capital, domestic and foreign—were affected. Who stood to gain or lose? What policies would emerge asgovernment objectives evolved? Would global capital markets proceed un-fettered or not? From the turn of the twentieth century, the unfolding his-tory of the international capital market has been of enormous import. Atvarious times the market has shaped the course of national and interna-tional economic development and swayed political interests in all mannerof directions. In terms of distribution and equality, it has made winners andlosers, although so often is the process misunderstood that the winners andlosers are often unclear, at the national and the global level. An aim of thispaper is to tell the history of what became a truly global capital market onthe eve of the twentieth century, and explore how it has influenced thecourse of events ever since.
3.1.2 Stylized Facts for the Nineteenth and Twentieth Centuries
Notwithstanding the undisputed record of technological advancementand economic growth over the long run, we must reject the temptations ofa simple linear history as we examine international capital markets andtheir evolution. It has not been a record of ever-more-perfectly functioningmarkets with ever-lower transaction costs and ever-expanding scope. Themid-twentieth century, on the contrary, was marked by an enormous reac-tion against markets, international as well as domestic, and against finan-cial markets in particular.6 Muted echoes of these same themes could beheard once again at the end of the twentieth century.
What do we already know about the evolution of global capital mobilityin the last century or more? Very few previous studies exist for the entire pe-riod and covering a sufficiently comprehensive cross-section of countries;but many authors have focused on individual countries and particularepochs, and from their work we can piece together a working set of hy-potheses that might be termed the conventional wisdom concerning theevolution of international capital mobility in the post-1870 era. The storycomes in four parts, and not coincidentally these echo the division of thetwentieth century into distinct international monetary regimes.7
The first period runs up to 1914. After 1870 an increasing share of theworld economy came into the orbit of the classical gold standard, and aglobal capital market centered on London. By 1880, quite a few countrieswere on gold, and by 1900 a large number. This fixed exchange rate system
124 Maurice Obstfeld and Alan M. Taylor
6. See Polanyi (1944).7. On this division of history see, in particular, Eichengreen (1996). Earlier surveys of the
progress of financial market globalization since the nineteenth century include Obstfeld andTaylor (1998), Bordo, Eichengreen, and Kim (1999), and Flandreau and Rivière (1999).

was for most countries a stable and credible regime, and functioned as a dis-ciplining or commitment device. Accordingly, interest rates across coun-tries tended to converge, and capital flows surged. Many peripheral coun-tries, not to mention the New World offshoots of western Europe, took partin an increasingly globalized economy in not only the capital market, butalso the goods and labor markets.8
In the second period, from 1914 to 1945, this global economy was de-stroyed. Two world wars and a Great Depression accompanied a rise in na-tionalism and increasingly noncooperative economic policymaking. Withgold-standard credibility broken by World War I, monetary policy becamesubject to domestic political goals, first as a way to help finance wartimedeficits. Later, monetary policy was a tool to engineer beggar-thy-neighbordevaluations under floating rates. As a guard against currency crises and toprotect gold, capital controls became widespread. The world economy wentfrom globalized to almost autarkic in the space of a few decades. Capitalflows were minimal, international investment was regarded with suspicion,and international prices and interest rates fell completely out of synchro-nization. Global capital (along with finance in general) was demonized, andseen as a principal cause of the world depression of the 1930s.9
In the third period, the Bretton Woods era (1945–71), an attempt to re-build the global economy took shape. Trade flows began a remarkable ex-pansion, and economic growth began its most rapid spurt in history world-wide. Yet fears formed in the interwar period concerning global capitalwere not easily dispelled. The International Monetary Fund (IMF) initiallysanctioned capital controls as a means to prevent currency crises and runs,and this lent some autonomy to governments by providing more power toactivist monetary policy. For twenty years, this prevailing philosophy heldfirm; and although capital markets recovered, they did so slowly. But by thelate 1960s global capital could not be held back so easily, and its workingseventually broke the compromise that had sustained the fixed exchange ratesystem.10
In the fourth and final period, the post–Bretton Woods floating-rate era,a different trend has been evident. Although fixed-rate regimes were reluc-tantly given up, and although some countries still attempt to maintain orcreate such regimes anew, the years from the 1970s to the 1990s have beencharacterized by a seeming increase in capital mobility. Generally speaking,
Globalization and Capital Markets 125
8. On the gold standard regime and late-nineteenth-century capital markets see, inter alia,Eichengreen (1996); Eichengreen and Flandreau (1996); Bordo and Kydland (1995); Bordoand Rockoff (1996); Edelstein (1982). On this first era of globalization in goods and factor mar-kets see Sachs and Warner (1995); Williamson (1996); O’Rourke and Williamson (1999); andchapters 1 (by Findlay and O’Rourke) and 2 (by Chiswick and Hatton) in this volume.
9. See Eichengreen (1992, 1996) and Temin (1989). In labor markets migrations collapsedand in goods markets trade barriers multiplied (Kindleberger 1986, 1989; Williamson 1995;James 2001).
10. On Bretton Woods see, for example, Bordo and Eichengreen (1993); Eichengreen (1996).

industrial-country governments no longer needed capital controls as a toolto help preserve a fixed exchange rate peg, since the peg was gone. As afloating rate could accommodate market developments, controls could belifted. This was encouraging to the flow of capital in all countries. In pe-ripheral countries, economic reforms reduced the transactions costs andrisks of foreign investment, and capital flows grew there, too—at least un-til the crises of the later 1990s reminded investors of the fragility of the fixed-rate regimes that tended to persist in the developing world. Increasingly, thesmaller peripheral countries that desire fixed exchange rates seek credibly togive up domestic monetary policy autonomy through currency boards oreven dollarization, whereas larger developing countries such as Mexico,Chile, and Brazil have opted for exchange rate flexibility coupled with in-flation targeting.
In the 1990s, the term globalization has became a catch-all to describe thephenomenon of an increasingly integrated and interdependent world econ-omy, one that exhibits supposedly free flows of goods, services, and capital,albeit not of labor. Yet for all the hype, economic history suggests we be alittle cautious in assessing how amazing this development really is. We willshow that a period of impressive global integration has been witnessed be-fore, at least for capital markets—at the turn of the twentieth century, justabout a hundred years ago. Of course, that earlier epoch of globalizationdid not endure. As the above discussion suggests, if we were roughly tosketch out the implied movements in capital mobility, we would chart anupswing from 1880 to 1914; this would be followed by a collapse to 1945, al-though perhaps with a minor recovery during the brief reconstruction ofthe gold standard in the 1920s, between the autarky of World War I and theDepression; we would then think of a gradual rise in mobility after 1945, be-coming faster after the demise of Bretton Woods in the early 1970s.
For illustrative purposes, let us make the tenuous assumption that inter-national capital mobility or global capital market integration could be mea-sured on a single parameter. Suppose we could plot that parameter overtime for the last century or so. We would then expect to see a time pathsomething like figure 3.1, where the vertical axis carries the mobility or in-tegration measure. It is reasonable, given the specific histories of varioussubperiods or certain countries, as contained in numerous fragments of thehistorical literature, to speak of capital mobility increasing or decreasing atthe times we have noted. Thus, the overall U-shaped trend line indicated bythe figure is probably correct.
However, without further quantification the usefulness of the stylizedview remains unclear. For one thing, we do not know if it accords with em-pirical measures of capital mobility. Moreover, even if we know the direc-tion of changes in the mobility of capital at various times, we cannot mea-sure the extent of those changes. Without such evidence, we cannot assesswhether the U-shaped trend path is complete: That is, have we now reached
126 Maurice Obstfeld and Alan M. Taylor

a degree of capital mobility that is above, or still below, that seen in the yearsbefore 1914? To address these questions requires more formal empiricaltesting, and that is one of the motivations for the quantitative analysis thatfollows.
3.1.3 The Trilemma: Capital Mobility, theExchange Rate, and Monetary Policy
We seek in this paper not only to offer evidence in support of the stylizedview of global capital market evolution, but also to provide an organizingframework for understanding that evolution and the forces that shaped theinternational economy of the late nineteenth and twentieth centuries. Giventhe stylized description, we must address the following question: What ex-plains the long stretch of high capital mobility that prevailed before 1914,the subsequent breakdown in the interwar period, and the very slow post-war reconstruction of the world financial system? The answer is tied up withone of the central and most visible areas in which openness to the worldcapital market constrains government power: the choice of an exchange rateregime.11
The macroeconomic policy trilemma for open economies (also known as
Globalization and Capital Markets 127
Fig. 3.1 Conjecture? A stylized view of capital mobility in modern historySource: Introspection.
11. This section draws on Obstfeld and Taylor (1998), who invoked the term “trilemma,” andObstfeld (1998).

the inconsistent trinity proposition) follows from a basic fact: An open cap-ital market deprives a country’s government of the ability simultaneously totarget its exchange rate and to use monetary policy in pursuit of other eco-nomic objectives. The trilemma arises because a macroeconomic policyregime can include, at most, two elements of the inconsistent trinity of threepolicy goals:
1. full freedom of cross-border capital movements2. a fixed exchange rate3. an independent monetary policy oriented toward domestic objectives
If capital movements are prohibited, in the case where element (1) is ruledout, a country on a fixed exchange rate can break ranks with foreign interestrates and thereby run an independent monetary policy. Similarly, a floatingexchange rate, in the case where element (2) is ruled out, reconciles freedomof international capital movements with monetary-policy effectiveness (atleast when some nominal domestic prices are sticky). But monetary policyis powerless to achieve domestic goals when the exchange rate is fixed andcapital movements free, the case where element (3) is ruled out, since inter-vention in support of the exchange parity then entails capital flows that ex-actly offset any monetary-policy action threatening to alter domestic inter-est rates.12
Our central proposition is that secular movements in the scope of inter-national lending and borrowing may be understood in terms of thistrilemma. Capital mobility has prevailed and expanded under circum-stances of widespread political support either for an exchange-rate-subordinated monetary regime (e.g., the gold standard), or for a monetaryregime geared mainly toward domestic objectives at the expense of ex-change rate stability (e.g., the recent float). The middle ground in whichcountries attempt simultaneously to hit exchange rate targets and domesticpolicy goals has, almost as a logical consequence, entailed exchange con-trols or other harsh constraints on international transactions.
It is this conflict among rival policy choices, the trilemma, that informsour discussion of the historical evolution of world capital markets in the
128 Maurice Obstfeld and Alan M. Taylor
12. The choice between fixed and floating exchange rates should not be viewed as dichoto-mous; nor should it be assumed that the choice of a floating-rate regime necessarily leads to auseful degree of monetary policy flexibility. In reality, the degree of exchange rate flexibility lieson a continuum, with exchange rate target zones, crawling pegs, crawling zones, and managedfloats of various other kinds residing between the extremes of irrevocably fixed and freely float-ing. The greater the attention given to the exchange rate, the more constrained monetary pol-icy is in pursuing other objectives. Indeed, the notion of a “free” float is an abstraction withlittle empirical content, as few governments are willing to set monetary policy without someconsideration of its exchange rate effects. Even under a free float, autonomy could be com-promised. If floating exchange rates are subject to persistent speculative shocks unrelated toeconomic fundamentals, and if policymakers are concerned to counter these movements, thenmonetary control will be compromised.
pages that follow, and helps make sense of the ebb and flow of capital mo-bility in the long run and in the broader political-economy context.
Of course, the trilemma is only a proximate explanation, in the sense thatdeeper sociopolitical forces explain the relative dominance of some policytargets over others. Cohen (1996, 274–75) usefully distinguishes four po-tential categories of explanation concerning the evolution of internationalfinancial integration. We paraphrase his categories by distinguishing expla-nations based upon
1. technological innovation, including resulting increases in marketcompetition;
2. policy competition among governments seeking to advance “state in-terest,” somehow defined;
3. domestic politics, including partisan rivalry and interest-group lobby-ing;
4. ideology and advances in economic knowledge.
We view explanations based on technology as secondary for the period ofinterest to us (starting in the latter part of the nineteenth century), as it fol-lows the deployment of transoceanic cable technology.13 The precise defini-tion of state interest may well reflect the domestic political power structure,so explanations of classes (2) and (3) need not be disjoint. Yet there may besituations in which there is a broad domestic consensus regarding certainpolicies as in the national interest. Similarly, ideology and the state ofknowledge can determine the policies that states pursue in seeking a givenperceived national interest. As will become clear in what follows, we regardexplanations along the lines of (2) and especially (3) as the “deep factors”behind movements in international financial integration, with a supportingrole for (4) as well.14 The central role of the trilemma is to constrain thechoice set within which the deep factors play their roles.
3.1.4 A Brief Narrative
The broad trends and cycles in the world capital market that we will doc-ument reflect changing responses to the fundamental trilemma. Before1914, each of the world’s major economies pegged its currency’s price interms of gold, and thus, implicitly, maintained a fixed rate of exchangeagainst every other major country’s currency. Financial interests ruled theworld of the classical gold standard and financial orthodoxy saw no alter-
Globalization and Capital Markets 129
13. We recognize, however, that technology- or policy-driven changes in the extent of goods-market integration might affect some measures of financial integration, as in the analysis ofObstfeld and Rogoff (2000).
14. Rajan and Zingales (2001) place interest-group politics at center stage in their theory ofdomestic financial market liberalization. They find a U-shaped evolution of domestic financialevolution reminiscent of the pattern for international integration that we document in this pa-per. While they seem to view international capital mobility as basically exogenous to the processof domestic liberalization, we would view the two as jointly determined by the deeper factors.

native mode of sound finance.15 Thus, the gold standard system met thetrilemma by opting for fixed exchange rates and capital mobility, sometimesat the expense of domestic macroeconomic health. Between 1891 and 1897,for example, the U.S. Treasury put the country through a harsh deflation inthe face of persistent speculation on the dollar’s departure from gold. Thesepolicies were hotly debated; the Populist movement agitated forcefullyagainst gold, but lost.16
The balance of political power began to shift only with the First WorldWar, which brought a sea change in the social contract underlying the indus-trial democracies. For a sample of industrial countries, figure 3.2 shows thePolity IV coding for “institutional democracy” as it evolved over the periodbracketing the First World War (the coding ranges from 0 to 11; see Marshalland Jaggers n.d. for details). Other than for the United States (which has aconstant score of 10 throughout the sample period, and is omitted from thefigure) there is clear evidence of a discrete increase in political openness inthe decade or so after 1918.17 Organized labor emerged as a political power,a counterweight to the interests of capital, as seen in the British labor unrestof the 1920s, which culminated in a general strike. Great Britain’s return togold in 1925 led the way to a restored international gold standard and a lim-ited resurgence of international finance, but weaknesses in the rebuilt systemhelped propagate a global depression after the 1929 U.S. downturn.
Following (and in some cases anticipating) Great Britain’s example,many countries abandoned the gold standard in the early 1930s and depre-ciated their currencies; many also resorted to trade and capital controls inorder to manage independently their exchange rates and domestic policies.Those countries in the “gold bloc,” which stubbornly clung to gold throughthe mid-1930s, showed the steepest output and price-level declines. James’s(2001, 189–97) account of French policymakers’ vacillation between con-trols and devaluation well illustrates the interaction between political pres-sures and the trilemma. Eventually, in the 1930s, all countries jettisonedrigid exchange rate targets and open capital markets in favor of domesticmacroeconomic goals.18
130 Maurice Obstfeld and Alan M. Taylor
15. See Bordo and Schwartz (1984); Eichengreen (1996).16. Frieden’s (1997) econometric evidence shows how financial interests promoted U.S. ad-
herence to gold, whereas those who would have gained from currency depreciation favored sil-ver. A similar debate over the monetary regime arose in Germany, where Prussian agricultureestate owners lobbied for relaxing the restraints of the gold standard (but were much more suc-cessful at getting tariff protection). See Gerschenkron (1943, 57n. 62).
17. The variable is composed of separate codings for the “competitiveness of political par-ticipation,” the “openness and competitiveness of executive recruitment,” and “constraints onthe chief executive.” We do not plot the variable during periods of political interruption ortransition. These data are comparable to the Polity III source used to construct the index ofglobal democratization presented by Niall Ferguson in the panel discussion that concludes thisvolume.
18. See Eichengreen and Sachs (1985); Temin (1989); Eichengreen (1992); Bernanke andCarey (1996); Obstfeld and Taylor (1998).

These decisions reflected the shift in political power solidified by the FirstWorld War. They also signaled the beginnings of a new consensus on therole of economic policy that would endure through the inflationary 1970s.As an immediate consequence, however, the Great Depression discreditedgold-standard orthodoxy and brought Keynesian ideas about macroeco-
Globalization and Capital Markets 131
Fig. 3.2 Institutional democracy, Polity IV scoresSource: Marshall and Jaggers (n.d.).

nomic management to the fore. It also made financial markets and financialpractitioners unpopular. Their supposed excesses and attachment to goldbecame identified in the public mind as causes of the economic calamity. Inthe United States, the New Deal brought a Jacksonian hostility toward east-ern (read: New York) high finance back to Washington. Financial marketswere more closely regulated, and the Federal Reserve was brought underheavier Treasury influence. Similar reactions occurred in other countries.
Changed attitudes toward financial activities and economic managementunderlay the new postwar economic order negotiated at Bretton Woods,New Hampshire, in July 1944. Forty-four allied countries set up a systembased on fixed, but adjustable, exchange parities, in the belief that floatingexchange rates would exhibit instability and damage international trade. Atthe center of the system was the IMF. The IMF’s prime function was as asource of hard-currency loans to governments that might otherwise have toput their economies temporarily into recession to maintain a fixed ex-change rate. Countries experiencing permanent balance-of-paymentsproblems had the option of realigning their currencies, subject to IMF ap-proval.19
Importantly, the IMF’s founders viewed its lending capability as prima-rily a substitute for, not a complement to, private capital inflows. Interwarexperience had given the latter a reputation as unreliable at best and, atworst, as a dangerous source of disturbances. Broad, encompassing con-trols over private capital movement, perfected in wartime, were expected tocontinue. The IMF’s Articles of Agreement explicitly empowered countriesto impose new capital controls. Articles VIII and XIV of the IMF agree-ment did demand that countries’ currencies eventually be made convert-ible—in effect, freely saleable to the issuing central bank, at the official ex-change parity, for dollars or gold. But this privilege was to be extended onlyif the country’s currency had been earned through current account transac-tions. Convertibility on capital account, as opposed to current-accountconvertibility, was not viewed as mandatory or desirable.
Unfortunately, a wide extent even of current-account convertibility tookmany years to achieve, and even then it was often restricted to nonresidents.In the interim, countries resorted to bilateral trade deals that required bal-anced or nearly balanced trade between every pair of trading partners. IfFrance had an export surplus with Great Britain, and Great Britain a sur-plus with Germany, then Great Britain could not use its excess deutschemarks to obtain dollars with which to pay France. Germany had very fewdollars and guarded them jealously for critical imports from the Americas.Instead, each country would try to divert import demand toward countrieswith high demand for its goods, and to direct its exports toward countrieswhose goods were favored domestically.
132 Maurice Obstfeld and Alan M. Taylor
19. On the Bretton Woods system, see Bordo and Eichengreen (1993).

Convertibility gridlock in Europe and its dependencies was endedthrough a regional multilateral clearing scheme, the European PaymentsUnion (EPU). The clearing scheme was set up in 1950 and some countriesreached de facto convertibility by mid-decade. But it was not until 27 De-cember 1958 that Europe officially embraced convertibility and ended theEPU. Although most European countries still chose to retain extensive cap-ital controls (Germany being the main exception), the return to convertibil-ity, important as it was in promoting multilateral trade growth, also in-creased the opportunities for disguised capital movements. These mighttake the form, for example, of misinvoicing, or of accelerated or delayedmerchandise payments. Buoyant growth encouraged some countries in fur-ther financial liberalization, although the United States, worried about itsgold losses, raised progressively higher barriers to capital outflow over the1960s. Eventually, the Bretton Woods system’s very successes hastened itscollapse by resurrecting the trilemma.20
Key countries in the system, notably the United States (fearful of slowergrowth) and Germany (fearful of higher inflation), proved unwilling to ac-cept the domestic policy implications of maintaining fixed rates. Even thelimited capital mobility of the early 1970s proved sufficient to allow furiousspeculative attacks on the major currencies, and after vain attempts to re-store fixed dollar exchange rates, the industrial countries retreated to float-ing rates early in 1973. Although viewed at the time as a temporary emer-gency measure, the floating-dollar-rate regime is still with us thirty yearslater.
Floating exchange rates have allowed the explosion in international fi-nancial markets experienced over the same three decades. Freed from oneelement of the trilemma—fixed exchange rates—countries have been ableto open their capital markets while still retaining the flexibility to deploymonetary policy in pursuit of national objectives. No doubt the experiencegained after the inflationary 1970s in anchoring monetary policy to avoidprice instability has helped to promote ongoing financial integration. Per-haps for the first time in history, countries have learned how to keep infla-tion in check under fiat monies and floating exchange rates.
There are several potentially valid reasons, however, for countries to stillfix their exchange rates—for example, to keep a better lid on inflation or tocounter exchange-rate instability due to financial market shocks. Such ar-guments may find particular resonance, of course, in developing countries.However, few countries that have tried to fix have succeeded for long; even-tually, exchange rate stability tends to come into conflict with other policyobjectives, the capital markets catch on to the government’s predicament,and a crisis adds enough economic pain to make the authorities give in. Inrecent years only a very few major countries have observed the discipline of
Globalization and Capital Markets 133
20. See Triffin (1957); Einzig (1968); Bordo and Eichengreen (2001).

fixed exchange rates for at least five years, and most of those were rather spe-cial cases.21
The European Union members that maintained mutually fixed ratesprior to January 1999 were aided by market confidence in their own plannedsolution to the trilemma, a near-term currency merger. Developing coun-tries have generally not fared so well. Even Hong Kong, which operates acurrency board supposedly subordinated to maintaining the Hong Kong–U.S. dollar peg, suffered repeated speculative attacks in the Asian crisis pe-riod. Another currency-board experiment, Argentina, held to its 1:1 dollarexchange rate from April 1991 for a remarkable stint of more than ten years.To accomplish that feat, the country relied on IMF and private credit and,despite episodes of growth, endured levels of unemployment higher thanmany countries could tolerate. It suffered especially acutely after Brazilmoved to a float in January 1999. Three years later Argentina’s political andeconomic arrangements disintegrated in the face of external default (De-cember 2001) and currency collapse (January–February 2002).
For most larger countries, the trend toward greater financial opennesshas been accompanied—inevitably, we would argue—by a declining re-liance on pegged exchange rates in favor of greater exchange rate flexibility.Some countries have opted for a different solution, however, adopting ex-treme straitjackets for monetary policy in order to peg an exchange rate. Ifmonetary policy is geared toward domestic considerations, capital mobilityor the exchange rate target must go. If, instead, fixed exchange rates and in-tegration into the global capital market are the primary desiderata, mone-tary policy must be subjugated to those ends.
The details of this argument require a book-length discourse (Obstfeldand Taylor 2003), which allows a full survey of the empirical evidence andthe historical record, but we can already pinpoint the key turning points(see table 3.1). The Great Depression stands as the watershed here, in thatit was caused by an ill-advised subordination of monetary policy to an ex-change rate constraint (the gold standard), which led to a chaotic time oftroubles in which countries experimented, typically noncooperatively, withalternative modes of addressing the fundamental trilemma. Interwar expe-rience, in turn, discredited the gold standard and led to a new and fairly uni-versal policy consensus. The new consensus shaped the more cooperativepostwar international economic order fashioned by Harry Dexter Whiteand John Maynard Keynes, but implanted within that order the seeds of itsown eventual destruction a quarter-century later. The global financialnexus that has evolved since then rests on a solution to the basic open-economy trilemma quite different than that envisioned by Keynes orWhite—one that allows considerable freedom for capital movements andgives the major currency areas freedom to pursue internal goals, but largelyleaves their mutual exchange rates as the equilibrating residual.
134 Maurice Obstfeld and Alan M. Taylor
21. See Obstfeld and Rogoff (1995).

3.1.5 Summary
As always, we have to consider the potential costs and benefits of inter-national capital mobility for the national participants. Clearly, the ability tolend or borrow represents, trivially, a loosening of constraints relative to aperfectly closed economy. In this dimension, at least, open trade in finan-cial markets offers unambiguous gains relative to a closed economy. Suchtrades permit insurance and the smoothing of shocks, and allow capital toseek out its highest rewards, implying the usual gains-from-trade results.
However, in other ways, international financial mobility raises concerns,particularly for policymakers attached to certain policy goals that may beinconsistent with the free flow of capital across international boundaries. Inaddition, the risks of financial and balance-of-payments crises—some ofthem self-fulfilling crises unrelated to “fundamentals”—may represent fur-ther obstacles to the adoption of free capital markets.
Although these are very much contemporary issues in world capital mar-kets, the questions they raise can be traced back to the very founding of in-ternational financial markets centuries ago during the Renaissance. Then,too, advanced forms of financial asset trades developed very quickly, some-times as a response to Church-imposed constraints such as usury proscrip-tions. Financial innovation was subject to suspicion from various quarters,both public and private. Thus, calls for the regulation and restriction of fi-nancial market activity have been with us since the earliest days.
Despite these fears, by the late nineteenth century a succession of tech-nological breakthroughs, and a gradual institutional evolution, had posi-tioned many nations in a newly forming international capital market. Thisnetwork of nations embraced modern financial instruments and operatedvirtually free of controls on the part of governments. Under the gold stan-dard monetary regime, this flourishing global market for capital reached atleast a local peak in the decades just prior to World War I.
The subsequent history of the twentieth century showed that this seem-ingly linear path toward ever more technological progress and institutionalsophistication in a liberal world order could indeed be upset. Two global
Globalization and Capital Markets 135
Table 3.1 The Trilemma and Major Phases of Capital Mobility
Sacrifices Countries Choose toResolve Trilemma
Activist Capital Fixed Era Policies Mobility Exchange Rate Notes
Gold standard Most Few Few Broad consensusInterwar Few Several Most Capital controls, especially in Central
(when off gold) Europe and Latin AmericaBretton Woods Few Most Few Broad consensusFloat Few Few Many Some consensus, except currency
boards, dollarization, etc.

wars and a depression led the world down an autarkic path. Conflicting pol-icy goals and democratic tensions often put the interests of global capital ata low premium relative to other objectives. Activist governments appealedto capital controls to sidestep the discipline of external markets, invokingmonetary policy as a tool of macroeconomic control.
These events demonstrate the power of the macroeconomic policytrilemma to account for many of the ups and downs in global capital mar-ket evolution in the twentieth century. In the next section, we match up thesestylized facts with details from the quantitative and institutional record, soas to better document the course of events. It is a remarkable history with-out which today’s economic, financial, political, and institutional land-scape cannot be fully understood.
3.2 Evidence
In theory and practice, the extent of international capital mobility canhave profound implications for the operation of individual and globaleconomies. With respect to theory, the applicability of various classes ofmacroeconomic models rests on many assumptions, and not the least im-portant of these are axioms linked to the closure of the model in the capitalmarket. The predictions of a theory and its usefulness for policy debates canrevolve critically on this part of the structure.
The importance of these issues for policy is not surprising at all, and a mo-ment’s reflection on practical aspects of macroeconomic policy choice under-scores the impact that capital mobility can have on the efficacy of various in-terventions: Trivially, if capital is perfectly mobile, this dooms to failure anyattempts to manipulate local asset prices to make them deviate from globalprices, including the most critical macroeconomic asset price, the interest rate.Thus, the feasibility and relevance of key policy actions cannot be judged, ab-sent some informed position on the extent to which local economic conditionsare in any way separable from global conditions. This means an empiricalmeasure of market integration is implicitly, although rarely explicitly, a nec-essary adjunct to any policy discussion. Although recent globalization trendshave brought this issue to the fore, this paper shows how the experience oflonger-run macroeconomic history can clarify and inform these debates.
In attacking the problem of measuring market integration, economistshave no universally recognized criterion to turn to. For example, imaginethe simple expedient of examining price differentials: Prices would be iden-tical in two identical neighboring economies, being determined in each bythe identical structures of tastes, technologies, and endowments; but if thetwo markets were physically separated by an infinitely high transaction-costbarrier one could hardly describe them as being integrated in a single mar-ket, as the equality of prices was merely a chance event. Or consider look-ing at the size of flows between two markets as a gauge of mobility; this isan equally flawed criterion, for suppose we now destroyed the barrier be-
136 Maurice Obstfeld and Alan M. Taylor

tween the two economies just mentioned, and reduced transaction costs tozero. We would then truly have a single integrated market, but because, oneither side of the barrier, prices were identical in autarky, there would be noincentive for any good or factor to move after the barrier disappeared.
Thus, convergence of prices and movements of goods are not unambigu-ous indicators of market integration. One could run through any number ofother putative criteria for market integration, examining perhaps the levelsor correlations of prices or quantities, and find essentially the same kind ofweakness: All such tests may be able to evaluate market integration, butonly as a joint hypothesis test where some auxiliary assumptions are neededto make the test meaningful.
Given this impasse, a historical study such as the present paper is poten-tially valuable in two respects. First, we can use a very large array of datasources covering different aspects of international capital mobility over thelast 100 years or more. Without being wedded to a single criterion, we canattempt to make inferences about the path of global capital mobility with abattery of tests, using both quantity and price criteria of various kinds. Aslong as important caveats are kept in mind about each method, especiallythe auxiliary assumptions required for meaningful inference, we can essaya broad-based approach to the evidence. Should the different methods alllead to a similar conclusion we would be in a stronger position than if wesimply relied on a single test.
Historical work offers a second benefit in that it provides a natural set ofbenchmarks for our understanding of today’s situation. In addition to themany competing tests for capital mobility, we also face the problem that al-most every test is usually a matter of degree, of interpreting a parameter ora measure of dispersion or some other variable or coefficient. We face thetypical empirical conundrums (how big is big? or how fast is fast?) in plac-ing an absolute meaning on these measures.
A historical perspective allows a more nuanced view, and places all suchinferences in a relative context: When we say that a parameter for capitalmobility is big, this is easier to interpret if we can say that by this we meanbigger than a decade or a century ago. The historical focus of this paper willbe directed at addressing just such concerns.22 We examine the broadestrange of data over the last 100-plus years to see what has happened to thedegree of capital mobility in a cross-section of countries.23
Globalization and Capital Markets 137
22. But note that, again, auxiliary assumptions will be necessary, and the caveats will be con-sidered along the way; for example, what if neighboring economies became exogenously moreor less identical over time, but no more or less integrated in terms of transaction costs?
23. Given the limitations of the data, we will frequently be restricted to looking at betweena dozen and twenty countries for which long-run macroeconomic statistics are available, andthis sample will be dominated by today’s developed countries, including most of the Organi-zation for Economic Cooperation and Development (OECD) countries. However, we alsohave long data series for some developing countries such as Argentina, Brazil, and Mexico;and in some criteria, such as our opening look at the evolution of the stock of foreign invest-ments, we can examine a much broader sample.

The empirical work begins by looking at quantity data, focusing onchanges in the stocks of foreign capital over a century or more.24 Subse-quent empirical sketches focus on price-based criteria for capital market in-tegration, looking at nominal interest arbitrage, real interest rate conver-gence, and equity returns.
3.2.1 Gross Stocks of Foreign Capital
In this section we examine the extant data on foreign capital stocks to getsome sense of the evolution of the global market. We seek some measure ofthe size of foreign investment globally that is appropriately scaled and con-sistent over time.
Although the concept is simple, the measurement is not. Perhaps the sim-plest measure of the activity in the global capital market is obtained bylooking at the total stock of overseas investment at a point in time. Supposethat the total asset stock in country or region i, owned by country or regionj, at time t is Aijt . Included in here is the domestically owned capital stockAijt . Of interest are two concepts: What assets of country j reside overseas,and what liabilities of country i are held overseas?
A relatively easy hurdle to surmount concerns normalization of the data;foreign investment stocks are commonly measured at a point in time in cur-rent nominal terms, in most cases U.S. dollars. Obviously, the growth ofboth the national and international economies might be associated with anincrease in such a nominal quantity, as would any long-run inflation. Thesetrends would have nothing to do with market integration per se. To over-come this problem, we elected to normalize foreign capital at each point intime by some measure of the size of the world economy, dividing through bya denominator in the form of a nominal size index.
A seemingly ideal denominator, given that the numerator is the stock offoreign-owned capital, would probably be the total stock of capital,whether financial or real. The problem with using financial capital mea-sures is that they have greatly multiplied over the long run as financial de-velopment has expanded the number of balance sheets in the economy,thanks to the rise of numerous financial intermediaries.25 This trend, inprinciple, could happen at any point in time without any underlying changein the extent of foreign asset holdings. The problem with using real capitalstocks is that data construction is fraught with difficulty.26
138 Maurice Obstfeld and Alan M. Taylor
24. Elsewhere we have examined flows of foreign capital, and more refined quantity criteriausing the correlations of saving and investment over the long run (Obstfeld and Taylor 1998,2003).
25. See Goldsmith (1985).26. Only a few countries have reliable data from which to estimate capital stocks. Most of
these estimates are accurate only at benchmark censuses, and in between census dates they relyon combinations of interpolation and estimation based on investment-flow data and depreci-ation assumptions. Most of these estimates are calculated in real (constant price) rather thannominal (current price) terms, which makes them incommensurate with the nominally mea-
Given these problems we chose a simpler and more readily available mea-sure of the size of an economy, namely the level of output Y measured incurrent prices in a common currency unit.27 Over short horizons, unless thecapital-output ratio were to move dramatically, the ratio of foreign capitalto output should be adequate as a proxy measure of the penetration of for-eign capital in any economy. Over the long run, difficulties might arise if thecapital-output ratio has changed significantly over time—but we have littlefirm evidence to suggest that it has.28 Thus, as a result of these long-run dataconstraints, our analysis focuses on capital-to-GDP ratios of the forms
(1) Foreign Assets-to-GDP Ratioit � ∑j�i
�A
Yj
i
i
t
t� and
(2) Foreign Liabilities-to-GDP Ratioit � ∑j�i
�A
Yi
i
j
t
t�.
However, even with the concept established, measurement is still prob-lematic in the case of the numerator. It is in fact very difficult to discover theextent of foreign capital in an economy using both contemporary and his-torical data. For example, the IMF has always reported balance-of-payments flow transactions in its International Financial Statistics. It isstraightforward for most of the recent postwar period to discover the an-nual flows of equity, debt, or other forms of capital account transactionsfrom these accounts. Conversely, it was only in 1997 that the IMF began re-porting the corresponding stock data, namely, the international investmentposition of each country. These data are also more sparse, beginning in 1980for fewer than a dozen countries, and expanding to about thirty countriesby the mid-1990s.
The paucity of data is understandable, since the collection burden forthese data is much more significant: Knowing the size of a bond issue in asingle year reveals the flow transaction size; knowing the implications forfuture stocks requires, for example, tracking each debt and equity item andits fluctuating market value over time, and maintaining an aggregate ofthese data. The stock data are not simply a temporal aggregate of flows: The
Globalization and Capital Markets 139
sured foreign capital data. At the end of the day, we would be unlikely to find more than a hand-ful of countries for which this technique would be feasible for the entire twentieth century, andcertainly nothing like global coverage would be possible even for recent years.
27. For the GDP data we rely on Maddison’s (1995) constant price 1990 U.S. dollar estimatesof output for the period from 1820. These figures are then “reflated” using a U.S. price defla-tor to obtain estimates of nominal U.S. dollar “world” GDP at each benchmark date. This ap-proach is crude, since, in particular, it relies on a purchasing power parity assumption. Ideallywe would want historical series on nominal GDP and exchange rates, to estimate a common(U.S. dollar) GDP figure at various historical dates.
28. But for exactly the reasons just mentioned, since we have no capital stock data for manycountries, it is hard to form a sample of capital-output ratios to see how these differ across timeand space. The conventional wisdom is that the capital-output ratio ranges from three to fourfor most countries, although perhaps lower in capital-scarce developing countries.

stock value depends on past flows; capital gains and losses; any retirementsof principal or buybacks of equity; defaults and reschedulings; and a hostof other factors. Not surprisingly, accurate data of this type are hard to as-semble.29 Just as the IMF has had difficulty doing so, so too have economichistorians. Looking back over the nineteenth and twentieth centuries anexhaustive search across many different sources yields only a handful ofbenchmark years in which estimates have been made, an effort that drawson the work of dozens of scholars in official institutions and numerousother individual efforts.30
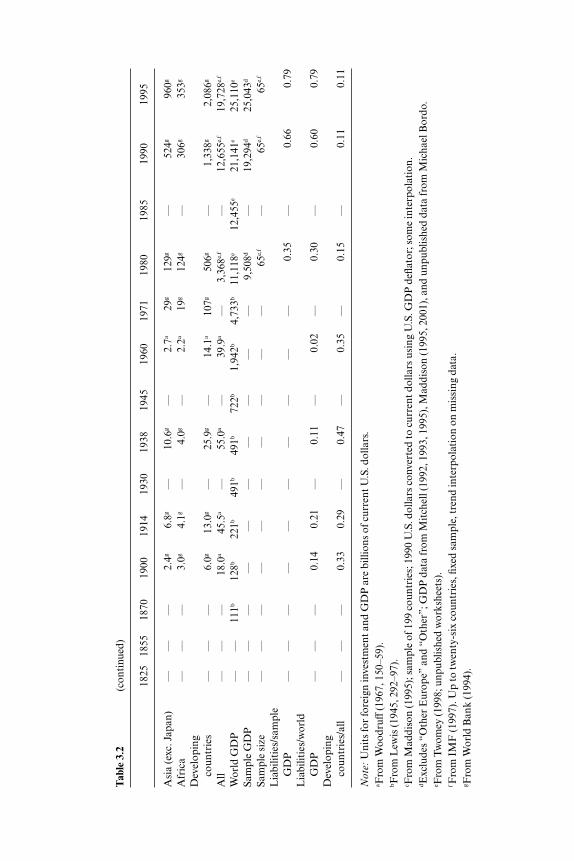
It is based on these efforts that we can put together a fragmentary, but stillpotentially illuminating, historical description in table 3.2 and figure 3.3.Displayed here are nominal foreign investment and output data for majorcountries and regions, grouped according to assets and liabilities. Manycells are empty because data are unavailable, but where possible, summarydata have been derived to illustrate the ratio of foreign capital to output,and the share of various countries in foreign investment activity.
What do the data show? On the asset side it is immediately apparent thatfor all of the nineteenth century, and until the interwar period, the Britishwere rightly termed the “bankers to the world”; at its peak, the British shareof total global foreign investment was almost 80 percent. This is far abovethe recent U.S. share of global foreign assets, a mere 22 percent in 1995, andstill higher than the maximum U.S. share of 50 percent circa 1960. The onlyrivals to the British in the early nineteenth century were the Dutch, who ac-cording to these figures held perhaps 30 percent of global assets in 1825.This comes as no surprise given what we know of Amsterdam’s early pre-eminence as the first global financial center before London’s rise to domi-nance in the eighteenth and nineteenth centuries. By the late nineteenthcentury both Paris and Berlin had also emerged as major financial centers,and, as their economies grew and industrialized, French and German hold-ings of foreign capital rose significantly, each eclipsing the Dutch position.
In this era the United States was a debtor rather than a creditor nation,and was only starting to emerge as a major lender and foreign asset holderafter 1900. European borrowing from the United States in World War I thensuddenly made the United States a big creditor. This came at a time when shewas ready, if not altogether willing, to assume the mantle of “banker to theworld,” following Great Britain’s abdication of this position under the bur-den of war and recovery in the 1910s and 1920s.31 But the dislocations of theinterwar years were to postpone the United States’ rise as a foreign creditor,
140 Maurice Obstfeld and Alan M. Taylor
29. An important new source, however, is Lane and Milesi-Ferretti (2001). See below.30. See, for example, Paish (1914), Feis (1931), Lewis (1938), Rippy (1959), Woodruff (1967),
and Twomey (2000). Twomey, following Feinstein (1990), favors the estimates of Paish and theother aforementioned authors, versus the downward revisions to pre-1914 British overseas in-vestment proposed by Platt (1986).
31. This Anglo-American transfer of hegemonic power is discussed by Kindleberger (1986)and by Bordo, Edelstein, and Rockoff (1999). Gallarotti (1995) challenges the view that GreatBritain acted as a monetary hegemon up to 1914.

Tab
le 3
.2Fo
reig
n C
apit
al S
tock
s
1825
1855
1870
1900
1914
1930
1938
1945
1960
1971
1980
1985
1990
1995
Ass
ets
Uni
ted
Kin
gdom
0.5a
0.7a
4.9a
12.1
a19
.5a
18.2
a22
.9c
14.2
a26
.4a
—55
1d85
7d1,
760d
2,49
0d
Fra
nce
0.1a
—2.
5a5.
2a8.
6a3.
5a3.
9c—
——
268d
428d
736d
1,10
0d
Ger
man
y—
——
4.8a
6.7a
1.1a
0.7c
—1.
2a—
247d
342d
1,10
0d1,
670d
The
Net
herl
ands
0.3a
0.2a
0.3a
1.1a
1.2a
2.3a
4.8c
3.7a
27.6
a—
99d
178d
418d
712d
Uni
ted
Stat
es0.
0a0.
0a0.
0a0.
5a2.
5a14
.7a
11.5
c15
.3a
63.6
a—
775d
1,30
0d2,
180d
3,35
0d
Can
ada
——
—0.
1a0.
2a1.
3a1.
9c—
——
92d
129d
227d
302d
Japa
n—
——
——
—1.
2c—
——
160d
437d
1,86
0d2,
720d
Oth
er E
urop
e—
——
——
—4.
6c—
——
503d
715d
1,77
7d2,
855d
Oth
er—
——
——
—6.
0c2.
0a5.
9a—
94d
123d
214d
337d
All
0.9a
0.9a
7.7a
23.8
a38
.7a
41.1
a52
.8c
35.2
a14
7.7a
—2,
800d
4,50
8d10
,272
d15
,536
d
Wor
ld G
DP
——
111b
128b
221b
491b
491b
722b
1,94
2b4,
733b
11,1
18e
12,4
55e
21,1
41e
25,1
10e
Sam
ple
GD
P—
—16
f43
f76
f14
9f18
2f27
3f67
1f—
7,80
6d9,
705d
17,2
50d
21,9
56d
Sam
ple
size
——
4f7f
7f7f
7f7f
7f—
25d
25d
25d
25d
Ass
ets/
sam
ple
GD
P—
—0.
470.
550.
510.
280.
260.
120.
18—
0.36
0.46
0.60
0.71
Ass
ets/
wor
ld G
DP
——
0.07
0.19
0.18
0.08
0.11
0.05
0.06
—0.
250.
360.
490.
62U
nite
d K
ingd
om/a
ll0.
560.
780.
640.
510.
500.
440.
430.
400.
21—
0.20
0.19
0.17
0.16
Uni
ted
Stat
es/a
ll0.
000.
000.
000.
020.
060.
360.
220.
430.
51—
0.28
0.29
0.21
0.22
Lia
bilit
ies
Eur
ope
——
—5.
4a12
.0a
—10
.3a
—7.
6a—
1,45
7d2,
248d
5,40
5d8,
592d
Nor
th A
mer
ica
——
—2.
6a11
.1a
—13
.7a
—12
.5a
—68
4d1,
412d
2,83
0d4,
681d
Aus
tral
ia a
nd N
ew
Zea
land
——
—1.
6a2.
0a—
4.5a
—2.
2a—
71d
118d
216d
318d
Japa
n—
——
0.1a
1.0a
—0.
6a—
0.3a
—14
7d30
7d1,
530d
1,97
0d
Lat
in A
mer
ica
——
—2.
9g8.
9g—
11.3
g—
9.2a
57g
250g
—50
5g76
8g
(con
tinu
ed)
Tab
le 3
.2(c
onti
nued
)
1825
1855
1870
1900
1914
1930
1938
1945
1960
1971
1980
1985
1990
1995
Asi
a (e
xc. J
apan
)—
——
2.4g
6.8g
—10
.6g
—2.
7a29
g12
9g—
524g
960g
Afr
ica
——
—3.
0g4.
1g—
4.0g
—2.
2a19
g12
4g—
306g
353g
Dev
elop
ing
coun
trie
s—
——
6.0g
13.0
g—
25.9
g—
14.1
a10
7g50
6g—
1,33
8g2,
086g
All
——
—18
.0a
45.5
a—
55.0
a—
39.9
a—
3,36
8e,f
—12
,655
e,f
19,7
28e,
f
Wor
ld G
DP
——
111b
128b
221b
491b
491b
722b
1,94
2b4,
733b
11,1
18e
12,4
55e
21,1
41e
25,1
10e
Sam
ple
GD
P—
——
——
——
——
—9,
508d
—19
,294
d25
,043
d
Sam
ple
size
——
——
——
——
——
65e,
f—
65e,
f65
e,f
Lia
bilit
ies/
sam
ple
GD
P—
——
——
——
——
—0.
35—
0.66
0.79
Lia
bilit
ies/
wor
ld
GD
P—
——
0.14
0.21
—0.
11—
0.02
—0.
30—
0.60
0.79
Dev
elop
ing
coun
trie
s/al
l—
——
0.33
0.29
—0.
47—
0.35
—0.
15—
0.11
0.11
Not
e:U
nits
for
fore
ign
inve
stm
ent a
nd G
DP
are
bill
ions
of c
urre
nt U
.S. d
olla
rs.
a Fro
m W
oodr
uff(1
967,
150
–59)
.bF
rom
Lew
is (1
945,
292
–97)
.c F
rom
Mad
diso
n (1
995)
; sam
ple
of 1
99 c
ount
ries
; 199
0 U
.S. d
olla
rs c
onve
rted
to c
urre
nt d
olla
rs u
sing
U.S
. GD
P d
eflat
or; s
ome
inte
rpol
atio
n.dE
xclu
des
“Oth
er E
urop
e” a
nd “
Oth
er”;
GD
P d
ata
from
Mit
chel
l (19
92, 1
993,
199
5), M
addi
son
(199
5, 2
001)
, and
unp
ublis
hed
data
from
Mic
hael
Bor
do.
e Fro
m T
wom
ey (1
998;
unp
ublis
hed
wor
kshe
ets)
.f F
rom
IM
F (1
997)
. Up
to tw
enty
-six
cou
ntri
es, fi
xed
sam
ple,
tren
d in
terp
olat
ion
on m
issi
ng d
ata.
g Fro
m W
orld
Ban
k (1
994)
.

and New York’s pivotal role as a financial center. After 1945, however, theUnited States decisively surpassed Great Britain as the major internationalasset holder, a position that has never since been challenged.32
Globalization and Capital Markets 143
Fig. 3.3 Foreign capital stocksSource: Table 3.2.
32. Of course, this is the gross foreign investment position, not the net position. The UnitedStates is also now the world’s number-one debtor nation, in both gross and net terms, havingbecome a net debtor for the first time since the First World War in the late 1980s.
How big were nineteenth century holdings of foreign assets? In 1870 weestimate that foreign assets were just 7 percent of world gross domesticproduct (GDP), but this figure rose quickly, to just below 20 percent in theyears 1900–14 at the zenith of the classical gold standard. During the inter-war period, the collapse was swift, and foreign assets were only 8 percent ofworld output by 1930, 11 percent in 1938, and just 5 percent in 1945. Sincethis low point, the ratio has climbed, to 6 percent in 1960, 25 percent in1980, and then climbing dramatically to 62 percent in 1995. Thus, the 1900–14 ratio of foreign investment to output in the world economy was notequaled again until 1980, but has now been approximately tripled.
An alternative measure recognizes the incompleteness of the data sources:For many countries we have no information on foreign investments at all,so a zero has been placed in the numerator, although that country’s outputhas been included in the denominator as part of the world GDP estimate.This is an unfortunate aspect of our estimation procedure, and makes theabove ratio likely an underestimate, or lower bound, for the true ratio of for-eign assets to output. One way to correct this is to include in the denomi-nator only the countries for which we actually have data on foreign invest-ment in the numerator.33 This procedure yields an estimate we term the ratioof foreign assets to sample GDP. This is likely an overestimate, or upperbound, for the true ratio, largely because in historical data, if not in con-temporary sources, attention in the collection of foreign investment datahas usually focused on the principal players, that is, the countries that havesignificant foreign asset holdings.34
Given all these concerns, does the ratio to sample GDP evolve in a verydifferent way? No, but the recent upswing is not as pronounced using thisalternative measure. The two ratios are very close after 1980. But before1945 they are quite far apart: From 1870 to 1914, the sample of seven coun-tries has a foreign asset to GDP ratio of over 50 percent, far above the worldfigure of 7 to 20 percent. By this measure we only surpassed the 1914 ratioas recently as 1990, and narrowly even then.
Clearly, these seven major creditors were exceptionally internationally di-versified in the late nineteenth century in a way that no group of countriesis today. By this reckoning, in countries like today’s United States, we stillhave yet to see a return to the extremely high degree of international port-
144 Maurice Obstfeld and Alan M. Taylor
33. That sample of countries is much less than the entire world, as we have noted. Until 1960,it includes only the seven major creditor countries noted in table 3.2; after 1980, we rely on theIMF sample from which we can identify up to thirty countries with foreign investment andGDP data.
34. That is, we are probably restricted in these samples to countries with individually highratios of foreign assets to GDP. For example, in the rest of Europe circa 1914, we would be un-likely to find countries with portfolios as diversified internationally as those of the British,French, Germans, and Dutch. If we included those other countries it would probably bring ourestimated ratio down. However, in the 1980s and 1990s IMF data, the problem is much less se-vere since we observe many more countries, and both large and small asset holders.

folio diversification seen in, say, Great Britain in the 1900–14 period, a his-torical finding that places in historical perspective the ongoing interna-tional diversification puzzle.35
Is the picture similar for liabilities as well as assets? Essentially, yes. Thedata are much more fragmentary here, with none in the nineteenth century,when the information for the key creditor nations was perhaps simpler tocollect than data for a multitude of debtors. Even so, we have some esti-mates running from 1900 to the present at a few key dates. The ratio of lia-bilities to world GDP follows a path very much like that of the asset ratio,which is reassuring: They are each approximations built from different datasources at certain time points, although, in principle, they should be equal.Again, the ratio reaches a local maximum in 1914 of 21 percent, collapsingin the interwar period to 11 percent in 1938, and just 2 percent in 1960. By1980 it had exceeded the 1914 level and stood at 30 percent. By 1995, the ra-tio was 79 percent.
To summarize, data on gross international asset positions seem broadlyconsistent with the idea of a U shape in the evolution of international capi-tal mobility since the late nineteenth century, although it is less clear howwe should compare the degree of diversification attained by some countriesthen with today’s apparently significant, albeit declining, home bias in for-eign asset holdings. Figuring whether too much or too little diversificationexisted at any point must remain conjectural, and conclusions would hingeon a calibrated and estimated portfolio model applied historically. This iscertainly an object for future research. However, unless the global economyhas dramatically changed in terms of the risk-return profile of assets andtheir global distribution, we have no prior reason to expect the efficient de-gree of diversification to have changed. For the present we can just say that,unless such a massive change did occur in the 1914–45 period, and unless itwas then promptly reversed in the 1945–90 period, we cannot explain thetime path of foreign capital stocks seen in table 3.2 and figure 3.3 except asa result of a dramatic decline in capital mobility in the interwar period, anda very slow recovery of capital mobility thereafter.
There is another important dimension of international asset stock datathat we have not yet discussed: the evolution of net stocks, that is, the be-havior of longer term development flows, as distinct from diversificationflows. The literature on the Feldstein-Horioka (1980) paradox alerts us tothe possibility that gross flows are orders of magnitude above net flows. Wepostpone discussion of that issue until later.
3.2.2 Real Interest Rate Convergence
A fundamental property of fully integrated international capital marketsis that investors are indifferent on the margin between any two activities to
Globalization and Capital Markets 145
35. On the international diversification puzzle see Lewis (1999).

which they allocate capital, regardless of national location. Internationalreal interest rate equality would hold in the long run in a world where cap-ital moves freely across borders and technological diffusion tends to drive aconvergence process for national production possibilities.36
One basic indication of internationally integrated financial marketstherefore would be the statistical stationarity of long-term real interest diff-erentials. We investigate this property using long-term real interest rate dataconstructed from the Global Financial Data database. For a nominal inter-est rate it we use the monthly series on long-term government bond yields,which applies to bonds of maturities of seven years or longer. For inflation�t � (Pt�12 – Pt ) /Pt we use the ex post twelve-month forward rate of changeof the consumer price index. The ex post real interest rate is then calculatedas rt � it – �t , and for now we make the standard assumption that this isequal to the ex ante real rate plus a white-noise stationary forecast error. Wefocus on real long-term bond yields because these are most directly relatedto financing costs for capital investments, and hence to the expected mar-ginal yield on investment. It is the latter variable we would like to be able tomeasure directly in order to evaluate the international mobility of capital.37
We consider three countries in our sample, relative to the United Statesas a base country. They are Great Britain, France, and Germany. We shouldnote that the series are as consistent as they can be given the changing typesof domestic bonds issued by the various countries over the last century, al-though maturities do change at several points for some countries. There area few exceptions, such as the British consol, which has a continuous time se-ries. We also note that prior to 1914 most countries have only annual priceindices, meaning that our derived inflation series will also consist of annualobservations, the exceptions being the United States and Great Britain. Forthe other two countries, we construct monthly series of ex post real interestrates by matching monthly nominal interest rates within a year t with the re-alized inflation rate between years t � 1 and t. Of course, in measuring long-term real interest rates, we would like to proxy long-term inflation expecta-tions, but that cannot be done reliably. Thus we follow earlier empiricalstudies in utilizing a relatively short-horizon inflation measure notwith-standing the longer term of the corresponding nominal interest rates.
The real interest rate differential for three countries is shown in figure 3.4.This differential is calculated as r̃t � rt – rUS,t . This is the first time real inter-
146 Maurice Obstfeld and Alan M. Taylor
36. We focus on long-term real interest rates here because these rates are most closely linkedto the cost of long-lived capital, because the slow mean reversion in real exchange rates makesit difficult to discern expected exchange rate changes in short-term data, and because risk pre-mia can be reduced over long horizons if long-run purchasing power parity holds.
37. For recent data, there is substantial evidence that international real interest rate differ-entials on short-term bonds are I(0); see, for example, Meese and Rogoff (1988) and Edisonand Melick (1999).

est rates over more than a century have been analyzed for this set of coun-tries at such high frequency, so it is of interest to start by evaluating somegeneral features of the data. The most striking impression conveyed by thefigure is that differentials have varied widely over time, but have stayed rel-atively close to a zero mean. That is, the series appears to have been sta-tionary over the very long run, and even in shorter subperiods.
The figures also reveal some of the changing coherence of real interest
Globalization and Capital Markets 147
Fig. 3.4 Long-term real interest differentialsNotes: See text. The differential is calculated relative to the United States as r̃t � rt – rUS,t .

rates in the subperiods. To avoid noisy data from nonmarket periods, thewartime years (1914–18, 1939–45) have been omitted, as has the Germanhyperinflation period (1919–23). Again we can focus on the four differentsubperiods that correspond to the four different monetary regimes: the goldstandard (1890–1914), the interwar period (1921–38), Bretton Woods andthe brief transitional period prior to generalized floating (1951–73), and thefloat (1974–2000).38
Allowing for the annual inflation data used before 1914, we can see thatreal interest differentials became somewhat more volatile in the interwar pe-riod, with a larger variance (this is less obvious in the German case becausethe hyperinflation period has been omitted). There is a decline in thisvolatility after 1950, and perhaps very little change between the pre-1974period and the float. The latter observation may seem surprising, exceptthat it is consistent with observations that, aside from nominal and real ex-change rate volatility, there is little difference in the behavior of macro fun-damentals between fixed and floating rate regimes, at least for developedcountries (e.g., Baxter and Stockman 1989).
With no real interest rate divergence apparent, these figures provideprima facie evidence that real interest rates in developed countries havebeen cointegrated over time, where the differentials between countries ap-pear stationary. A formal test of this hypothesis appears in table 3.3, wherewe apply two stationarity tests to the data for the period as a whole, as wellas in various subperiods. The first test is the traditional augmented Dickey-Fuller (ADF) unit root test, and the second is the Dickey-Fuller generalizedleast squares (DFGLSu) test, one of a family of enhanced point-optimaland asymptotically efficient unit root tests recently proposed.39 This tablealso reports a broader set of tests for the recent float, for an expandedsample including the Group of Seven (G7) plus the Netherlands, for com-parison with the contemporary literature.
Where the null is rejected at the 1 percent level, the results show conclu-sively that the real interest differential has no unit root over the long run.Changes in the variances of series over time, of the kind evident in the pre-ceding figures, may distort unit root tests (Hamori and Tokihisa 1997).However, the hypothesis of a unit root can be rejected in almost all cases atthe 1 percent level in all periods except for the recent float. With respect tothe recent float, the evidence against a unit root is stronger over the second
148 Maurice Obstfeld and Alan M. Taylor
38. For the purpose of the present empirical analysis we begin our floating-rate period inearly 1974 to be consistent with other empirical literature on the real interest rate–real ex-change rate nexus. However, most historians would place the end of the Bretton Woods systemin August 1971, the month the U.S. official gold window was shut.
39. See Elliott, Rothenberg, and Stock (1996) and Elliott (1999). We use the DFGLSu testfrom the latter, which allows for the initial observation to be drawn from the unconditionalmean of the series. The RATS code for this procedure is available online at [http://www.estima.com].

Table 3.3 Stationarity Tests: Long-Term Real Interest Differentials
Starting Date Ending Date ADF DFGLSu
A. Historical epochsGreat Britain 1890:1 2000:7 –4.30*** –5.54***France 1890:1 2000:7 –6.05*** –6.36***Germany 1890:1 2000:7 –4.64*** –5.14***
Great Britain 1890:1 1913:12 –1.38 –3.44***France 1890:1 1913:12 –3.18** –4.36***Germany 1890:1 1913:12 –3.86*** –3.70***
Great Britain 1921:1 1938:12 –3.59*** –4.01***France 1921:1 1938:12 –2.39 –4.31***Germany 1921:1 1938:12 –2.42 –2.84**
Great Britain 1951:1 1973:2 –5.09*** –5.37***France 1951:1 1973:2 –3.81*** –3.34***Germany 1951:1 1973:2 –3.32** –3.51***
B. Recent floatGreat Britain 1974:2 2000:8 –2.42 –3.75***The Netherlands 1974:2 2000:8 –2.75* –2.57*France 1974:2 2000:8 –2.70* –2.52*Germany 1974:2 2000:8 –2.82* –2.73*Italy 1974:2 2000:8 –2.52 –2.87**Japan 1974:2 2000:8 –2.20 –2.52*Canada 1974:2 2000:8 –3.71*** –3.15**
Great Britain 1974:2 1986:3 –2.61* –2.82**The Netherlands 1974:2 1986:3 –1.28 –1.19France 1974:2 1986:3 –2.21 –1.77Germany 1974:2 1986:3 –1.77 –1.64Italy 1974:2 1986:3 –2.56 –2.89**Japan 1974:2 1986:3 –1.50 –1.72Canada 1974:2 1986:3 –1.92 –1.93
Great Britain 1986:4 2000:7 –2.01 –2.62*The Netherlands 1986:4 2000:7 –2.61* –2.37France 1986:4 2000:7 –2.25 –2.50*Germany 1986:4 2000:7 –3.34** –2.83**Italy 1986:4 2000:7 –2.54 –2.55*Japan 1986:4 2000:7 –2.43 –2.55*Canada 1986:4 2000:7 –0.86 –2.28
Notes: See text. ADF is the augmented Dickey Fuller t-statistic; DFGLSu is the Dickey-Fullergeneralized least-squares test (the test of Elliott 1999). The critical values are, respectively,(–3.43, –2.86, –2.57) for the ADF test, and (–3.28, –2.73, –2.46) for the DFGLSu test. Lag se-lection was via the Lagrange multiplier criterion with a maximum of twelve lags.***Significant at the 1 percent level.**Significant at the 5 percent level.*Significant at the 10 percent level.

subperiod (1986–2000) than over the first (1974–86). The above findings re-fer to the more powerful DFGLSu test, which rejects the null more fre-quently than the standard ADF test.
This indication of a stationary long-term real interest differential, espe-cially insofar as it applies to the recent period of floating industrial-countryexchange rates, contradicts much of the empirical literature producedthrough the mid-1990s. Why do we find more evidence of stationarity thanearlier researchers, such as Meese and Rogoff (1988) and Edison and Pauls(1993)? We note that previous authors had shorter samples and used testsof relatively low power, such as the ADF test.
Indeed, our data and methods are consistent with earlier findings: If weswitch to the Meese-Rogoff sample of February 1974 to March 1986, anduse the ADF test as they did, then we replicate their conclusions exactly (asshown in the penultimate panel of the table). Even if we switch to theDFGLSu test on the same data, we can reject the null in only two out ofseven cases. The results for the post-1986 sample show similar problems,even though for the post-1974 period as a whole we can always reject thenull40 at the 10 percent level or higher.
These findings, which are supportive of stationarity in recent long-termreal interest differentials, are consistent with another strand in the literaturethat finds support for international real interest rate equalization at longerhorizons (Fujii and Chinn 2000). We conclude that earlier analyses of re-cent data were hampered by the low power of unit root tests on samples ofsmall span.41
3.2.3 Exchange-risk-free Nominal Interest Parity
Perhaps the most unambiguous indicator of capital mobility is the rela-tionship between interest rates on identical assets located in different finan-
150 Maurice Obstfeld and Alan M. Taylor
40. Edison and Melick (1999, 97) find mixed results on the stationarity of Canadian, Ger-man, and Japanese long-term real interest differentials against the United States, but nonethe-less base their econometric analysis of real interest parity on the assumption that all real in-terest differentials are stationary.
41. A more stringent test would examine the validity of long-term real interest parity. A fo-cus on long-term real rather than nominal interest rate parity seems preferable because withmean reverting real exchange rates, it is easier to proxy long-run expected real exchange ratesthan the corresponding nominal exchange rates. Meese and Rogoff (1988) rejected a version ofreal interest parity based on the maintained assumption of an underlying sticky-price ex-change rate model. More supportive is the recent long-run panel cointegration study by Mac-Donald and Nagayasu (2000) of fourteen OECD countries relative to the United States. Thestatistical methodology of that work, however, assumes that long-term real interest differen-tials are nonstationary. Chortareas and Driver (2001) implement a similar approach using aseventeen-country panel of OECD countries versus the United States; their conclusions aresimilar to those of MacDonald and Nagayasu. Chortareas and Driver report mixed results fortests on the stationarity of long-term real interest differentials. One issue pervading all of thework in this area is the effect of alternative proxies for long-term inflation expectations. Theproxies that are chosen often differ across authors, affecting some results. A systematic dis-cussion of these differences lies beyond the scope of this paper.

cial centers.42,43 The great advantage of comparing onshore and offshore in-terest rates such as these is that relative rates of return are not affected bypure currency risk. For much of the period we study here, a direct onshore-offshore comparison is impossible. However, the existence of forward ex-change instruments allows us to construct roughly equivalent measures ofthe return to currency-risk-free international arbitrage operations.
Using monthly data on forward exchange rates, spot rates, and nominalinterest rates for 1921 to the latter half of 2001, we assess the degree of in-ternational financial-market integration by calculating the return to cov-ered interest arbitrage between financial centers. For example, a Londonresident could earn the gross sterling interest rate 1 � it
∗ on a London loanof one pound sterling. Alternatively, he or she could invest the same cur-rency unit in New York, simultaneously covering the exchange risk by sell-ing dollars forward. The investor would do this in three steps: Buy et dollarsin the spot exchange market (where et is the spot price of sterling in dollarterms); next, invest the proceeds for a total of et (1 � it ), where it is the nom-inal dollar interest rate; and finally, sell that sum of dollars forward for et
(1 � it ) /ft in sterling (where ft , the forward exchange rate, is the price of for-ward sterling in terms of forward dollars). The net gain from borrowing inLondon and investing in New York,
(3) �e
ft
t� (1 � it ) � (1 � i i
∗),
is zero when capital mobility is perfect and the interest rates and forwardrate are free of default risk. The left-hand side of the preceding expressionrepresents a price of present pounds sterling in terms of future pounds ster-ling (i.e., of pounds dated t in terms of pounds dated t � 1), but it can beviewed as the relative price prevailing in the New York market, that is, as akind of offshore interest rate. Thus, our test, in effect, examines the equal-ity of the onshore sterling interest rate i∗ with the offshore New York rateso defined. We perform a similar calculation for German mark interest di-fferentials between London (considered as the offshore center) and Ger-many (onshore), thereby gauging the difference between implicit mark in-terest rates in London and the rates prevailing near the same time inGermany.
For pre-1920 data, we examine a related but distinct measure based oncurrent New York prices of sterling for (two-months) future delivery, as inObstfeld and Taylor (1998). The parallel Germany-London arbitrage cal-culation before 1920, corresponding to the preceding New York-London
Globalization and Capital Markets 151
42. See the discussion in Obstfeld (1995), for example.43. This section draws heavily on Obstfeld and Taylor (1998) for the case of Great Britain,
but adds new data on Germany for comparison. After our 1998 paper was published, we be-came aware of a similar 1889–1909 U.S.-U.K. interest rate comparison contained in Calomirisand Hubbard (1996).

comparison, is based on London prices for German marks to be deliveredthree months in the future. Forward exchange contracts of the kind com-mon after 1920 were not prevalent before then (except in some exceptionalfinancial centers; see Einzig 1937), so we instead base our pre-1920 com-parison of onshore and offshore interest rates on the most widely traded in-strument, one for which prices were regularly quoted in the major financialcenters’ markets, the long bill of exchange. Long bills could be used to coverthe exchange risk that might otherwise be involved in interest-rate arbi-trage.44
To see how such a transaction would work, let bt denote the date-t dollarprice in New York of £1 deliverable in London after sixty days, and et thespot New York price of sterling.45 One way to purchase a future pound de-liverable in London would be through a straight sterling loan, at price 1/(1 �it∗), where it
∗ is the London sixty-day discount rate. An alternative would beto purchase in New York a bill on London, at a price in terms of currentsterling of bt /et . With perfect and costless international arbitrage, these twoprices of £1 to be delivered in London in the future should be the same.
Perkins (1978) observed that the series (e/b) – 1 defines the sterling inter-est rate in American financial markets, that is, the offshore sterling rate inthe United States. This series may be compared with the London rate i∗, aswe did in our 1998 paper, to gauge the degree of cross-border financial in-tegration; that is, we calculate the differential
�b
et
t
� � (1 � i t∗)
before 1920.Perkins’s (1978) primary aim was to modify earlier series of dollar-
sterling spot rates derived by Davis and Hughes (1960), who applied U.S.rather than U.K. interest rates to the dollar prices of long sterling bills in or-der to infer a series of sight exchange rates. Perkins argued that the sight billrate should be derived by multiplying the (lower) long bill rate by a sterling,not a dollar, interest factor, and subsequent scholars have followed him; see,for example, the judgment of Officer (1996, 69). From a theoretical point ofview, the verdict is clear: The relative price of current and future sterling de-fines a sterling nominal interest rate, in the present case, the offshore NewYork rate that we compare to London rates.
The upper panel of figure 3.5 is based on monthly differences betweensterling rates in New York and in London from 1870 to 2001, where wesimply splice together the 1870–1919 numbers based on time bill rates with
152 Maurice Obstfeld and Alan M. Taylor
44. Margraff (1908, 37) speaks explicitly of the need to cover interest arbitrage through theexchange market.
45. In fact, such bills were payable after sixty-three days due to a legal grace period of threedays, an institutional fact we account for in the calculations below (Haupt 1894, 429).

the subsequently available covered interest differentials. Differential returnsare calculated as annual rates of accrual.46
Globalization and Capital Markets 153
Fig. 3.5 Exchange-risk-free nominal interest differentials since 1870: A, U.S.-U.K.;B, U.K.-GermanySources: See text.Notes: Annual samples of monthly data, percent per annum.
46. The U.S.-U.K. comparison is based on the data described in Obstfeld and Taylor (1998,361n. 7), with the following amendments. From January 1975 to August 2001, the Londonsterling interest rate i is the three-month bank bill middle rate, from Datastream. From Janu-ary 1981 to August 2001, the New York dollar interest rate i is the discount rate on ninety-daybankers’ acceptances, from Datastream. Finally, from January 1981 to August 2001 spot and

The figure broadly supports other indicators of the evolution of capitalmobility. Differentials are relatively small and steady under the pre-1914gold standard, but start to open up during World War I. They stay quitelarge in the early 1920s. Differentials diminish briefly in the late 1920s, butwiden sharply in the early 1930s. There are some big arbitrage gaps in thelate 1940s through the mid-1950s—including a sharp spike in volatility atthe time of the 1956 Suez crisis.47 But these shrink starting in the late 1950sand early 1960s, only to open up again in the late 1960s as sterling’s 1967 de-valuation initiates a period of foreign exchange turmoil, culminating in theunraveling of the Bretton Woods system in the early 1970s. Interest differ-entials have become small once again since the disappearance of U.K. cap-ital controls around 1980. The differentials appear even smaller now thanbefore 1914.48
Indeed, for the 1870–1914 data we observe a tendency, quite systematicalbeit declining over time, for New York sterling rates to exceed London
154 Maurice Obstfeld and Alan M. Taylor
three-month forward dollar-sterling exchange rates come from Datastream. All of these newdata are end-of-month observations.
For the U.K.-German comparison, data are monthly averages up until January 1981 andend of month thereafter, as follows. Exchange rates: From October 1877 to July 1914 we usethe month-average spot Mark-sterling exchange rate from the National Bureau of EconomicResearch (NBER) macrohistory database, series 14106. London sterling prices for three-month bills on Berlin are “money” rates taken from the “Course of Exchange” table in TheEconomist. From January 1921 to September 1931 we average the weekly spot and three-month forward exchange rates listed by Einzig (1937). From May 1955 to December 1980, spotexchange rates are from The Economist through 1957 and thereafter from Datastream. For-ward exchange rates are from the London Times (May 1955–October 1958), from The Econo-mist subsequently through 1964, then from the London Times through 1975, and, finally, start-ing January 1976, from Datastream. U.K. three-month interest rate: Open market three-monthdiscount rate, NBER series 13016, through September 1931. Data from 1955 to 1974 comefrom the Federal Reserve banking database (and are similar to the well-known Capie-Webberseries). Starting in January 1975 we use the U.K. interbank (money market) three-monthmiddle rate of interest. German three-month interest rate: From October 1877 through Sep-tember 1931, where observations are available, we use the Berlin private open market discountrate for prime bankers’ acceptances given as NBER series 13018. The German three-monthmoney market rate for 1955–59 is an average of monthly high and low rates taken fromMonthly Report of the Deutsche Bundesbank and thereafter, through end-1980, comes from theIMF’s International Financial Statistics. Subsequent data are from Datastream, the three-month “dead middle” money market rate.
47. See Klug and Smith (1999) for a fascinating empirical study of the Suez crisis. The pa-per includes a discussion of daily covered arbitrage differentials from 1 June 1956 to 31 Janu-ary 1957.
48. We alert the reader to several potential problems with our calculations and data. First,as we have already stressed above and indeed stressed quite clearly in Obstfeld and Taylor(1998), the two measures of market integration that we calculate refer to different arbitragepossibilities before and after 1920. Second, some forward transactions appear at different ma-turities in our data set. Third, most data are observed at or near end-of-month, but some dataare averages of weekly numbers. Averaging has the effect of dampening measured volatility.Fourth, data from World War II reflect rigidly administered prices and have no capital mobil-ity implications. Fifth, the data used are not closely aligned for time of day (and even differ asto day in some cases), so that some deviations from parity may be exaggerated. The purpose ofthe exercise, however, is merely to convey a broad sense of the trend in integration, not to pur-sue a detailed hunt for small arbitrage possibilities.

rates. In arguing in favor of a sterling discount rate for valuing long sterlingbills traded in the United States, Perkins (1978) demonstrated a tendencyfor the implicit offshore sterling interest rate (e/b) – 1 to converge towardbank rate toward the end of the nineteenth century (see his fig. 2, p. 399).Our figure 3.5, however, compares the New York offshore sterling interestrate with the London money-market rate of discount, which tended to besomewhat below bank rate. Were we to use bank rate as the London inter-est rate in the figure, much of the pre-1914 gap would be eliminated. Giventhat the U.S. data consist of prices of high-quality paper (such as bank bills),however, comparisons with bank rate are probably inappropriate. As Spald-ing (1915, 49) observes: “Bank Rate, as is well known, is usually higher thanmarket rate; therefore if ordinary trade bills are remitted [to London] from[abroad], to find the long exchange, interest will be calculated at our BankRate, as trade paper is not considered such a good security as bank bills.”49
Officer (1996, 69) concurs, although on different grounds: “Whereas theBank Rate was set by the Bank of England, the money-market rate was atrue competitive price. . . . The money-market rate of discount is the bettermeasure.”
If it is impermissible to compare the sterling interest rate in New Yorkwith bank rate in London, how, then, can we explain the systematic positiveinterest gap in favor of New York before 1914? Much if not all of the gapcan be explained as an artifact of the procedure we have used to extract theoffshore interest rate from the observations on sight and time bill prices.
Continuing our focus on the New York–London comparison of sterlinginterest rates, we notice that the published money-market discount rate forLondon is quoted as a “pure” relative price of future in terms of presentsterling. In contrast, as practitioners’ textbooks of the period make amplyclear, in determining the price to be paid for a long bill of exchange on Lon-don, purchasers would factor in not only the spot exchange rate and theLondon market discount rate, but, in addition, commissions, profit mar-gins, and, importantly, the stamp duty (0.05 percent of the bill’s face value)payable to the British government. These factors made bill prices lower thanthey would have been if they simply were equal to the spot exchange ratediscounted by the pure New York sterling rate of interest.
Margraff (1908, 121) estimates that for a ninety-day bill, the total of suchfactors amounted to 0.125 percent of face value. For a sixty-day bill, thatcharge would represent about 75 basis points in annualized form; Escher(1918, 81–82), published a decade later, cites a very slightly smaller number.By subtracting that “tax” from the pre-1914 differentials plotted in the topof figure 3.5, we see that the apparent average excess return in New York dis-appears.
Indeed, the average return becomes negative for 1890–1914, so that 75
Globalization and Capital Markets 155
49. See also the summary table in Margraff (1908, 112).

basis points in additional costs may well be an overestimate for the entireprewar period. Suggestive of declining costs is the tendency shown in thefigure for the average bias to decline over time. Perkins (1978, 400–01) ar-gues that U.S. foreign exchange dealers of the period were able to exploitmarket power to inflate their commissions. Certainly such market power de-clined through 1914 as markets evolved, and Officer’s (1996, 75) data onbrokers’ commissions supports this view.50 Of course, a process of marketintegration increases competition and drives commissions down. Thus,leaving aside the portion due to the stamp tax, the size of the New York–London discrepancy is to some degree a reflection of financial market seg-mentation and its secular decline evidence of a process of progressive inte-gration.
The lower panel of figure 3.5 shows the difference between the implicitmark interest rate in London and the one prevailing in Germany. Again, theU-shaped evolution of capital mobility is evident over our entire sample pe-riod. Before 1914, the former, offshore, rate is calculated on the basis ofninety-day prime bills of exchange on Berlin traded in London. The resultsare remarkably consistent with those for New York–London.
In particular, we again observe a systematic but secularly declining excessreturn in London prior to 1914. The explanation is essentially the same asin the New York–London comparison above. Germany levied a stamp dutyon bills at the same rate as Britain’s (0.05 percent; see Haupt 1894, 164, orMargraff 1908, 133). Margraff’s estimates of concomitant costs suggest thatfor a ninety-day bill on Berlin, about 40 basis points should be subtractedfrom the annualized sight bill premium 4 � ([e/b] – 1) to ascertain the trueLondon mark rate of interest. On the assumption that some costs declineover time, with 40 basis points an average for the prewar period as whole,that cost adjustment brings the offshore and onshore mark rates roughlyinto line.51
While the cost and tax considerations we have described potentially elim-inate the pre-1914 upward bias in our estimated series of offshore interestrates, other financial transaction costs would, as usual, create no-arbitragebands around the point of onshore-offshore interest rate equality. One wayto evaluate the evolution of capital mobility through time would be to esti-mate over different eras what Einzig (1937, 25) calls “transfer points,” thatis, the minimum return differential necessary to induce arbitrage opera-tions. Keynes and Einzig agreed that during the interwar period, at least a50 basis point covered differential would be needed to induce arbitrage.
156 Maurice Obstfeld and Alan M. Taylor
50. Country-risk-type arguments cannot easily rationalize the pre-1920 interest differentialin favor of New York, as we pointed out earlier in Obstfeld and Taylor (1998, 361n. 6). The rea-son is that both of the two transactions we compare entail future payment in the same place,London. This is not the case in the post-1920 covered interest arbitrage calculations.
51. Flandreau and Rivière (1999) focus on a London-Paris comparison for 1900–14. Theirresults are entirely consistent with the data that we show in figure 3.5, including a systematicexcess of the London franc interest rate over that in Paris. Their rationale for the differential isapparently different from ours, although they do not include details of their derivation.

That is, they suggested a no-arbitrage band of �50 basis points. Applyingnonlinear estimation techniques including a threshold autoregression(TAR) methodology to weekly interwar data on dollar-sterling covered re-turn differentials, Peel and Taylor (2002) confirm that a no-arbitrage bandclose to �50 basis points did appear to prevail, as Keynes and Einzigclaimed. Only outside this range did arbitrage forces push spot and forwardexchange rates toward conformity with the band.
A detailed investigation is beyond the scope of this paper, but a first passat the data using the TAR methodology of Obstfeld and Taylor (1997) issuggestive. For the dollar-sterling exchange between June 1925 and June1931, we calculate a band of inaction of �60 basis points, very close to thePeel-Taylor estimate given that we are using coarser, monthly data. For thecorresponding interwar sterling-mark exchange our estimated band is �91basis points wide. On 1880–1914 differentials, in contrast, we find (aftersubtracting a constant mean differential) bands of only �19 basis points forNew York–London and �35 basis points for London-Berlin. By way ofcomparison, Clinton (1988) suggests that covered interest differentials inthe mid-1980s needed to reach just �6 basis points to become economicallysignificant. Balke and Wohar (1998) produce an estimate 50 percent higherfor the 1974–93 period. We suspect that a more careful analysis of pre-1914differentials, one taking account of the upward trend in market integration,would reduce our estimated transaction cost bands for the early twentiethcentury. Accordingly, the degree of integration among core money marketsachieved under the classical gold standard must be judged as truly impres-sive compared to conditions over the following half-century or more.
The Great Depression, perhaps as part of a much broader interwar phaseof disintegration, therefore stands out as an event that transformed theworld capital market and left interest arbitrage differentials higher andmore volatile than ever before.
3.2.4 Equity Returns
It is interesting to ask whether the long-run evidence on the U shape ofcapital market integration extends to other criteria, and other markets suchas equities. Over the long run, global equity markets have evolved at a verydifferent rate than global bond markets, for example. Government bondsfrom core countries have generally traded in financial centers in the last 100years, but for long spans of time, emerging-market debt was very difficult toplace in the private sector, and most went through multilateral intermedi-aries. Similarly, international trade in equities, although quiescent in themiddle of the century, grew substantially in core countries after the liftingof capital controls in the 1970s and 1980s, and by the 1990s several emerg-ing equity markets were involved as well.
Does quantitative evidence exist to verify this narrative? Quantity dataare harder to find at a disaggregated level. Breaking down foreign invest-ment into its components is an enormous historical task, and few have at-
Globalization and Capital Markets 157

tempted it in the quest for long-run comparable series across many coun-tries (but see Twomey 2000). We will not attempt to press further here. In-stead, we will examine price evidence to see what changing patterns of eq-uity returns might tell us about globalization.
There is certainly some debate about the indicators of equity returns inthe long run and what they tell us about globalization. Jorion and Goetz-mann (1999) find that most of the world’s stock markets have exhibitedfairly low real returns over the long run in the last century, around 1 per-cent, with the exception of the United States, which has yielded around 4percent annually since 1921. These figures caution that U.S. exceptionalismmight extend to stock market returns also, and cast doubt on the general,global truth of the equity premium puzzle. The authors also note that sur-vivorship bias likely afflicts the United States and many other markets in thecore countries for which data exist. In many emerging markets, stock priceshave fluctuated wildly and many series break down at critical historicaljunctures and during wars, limiting our ability to compare like with like.
In this section we take a fresh look at long-run equity returns using datasimilar to those employed by Jorion and Goetzmann (1999), the Global Fi-nancial Data source. We ask two questions not addressed by previous au-thors: To what extent have stock returns (measured in a common currency,the U.S. dollar) diverged or converged over time, and to what extent have thetime series correlations of returns across countries changed over time? Wethen consider what the answers may have to say about globalization.
Figure 3.6 shows summary statistics for a sample of up to twenty-twocountry stock price indices based on annual U.S. dollar-denominated re-turns since 1880.52 The bottom chart indicates that the sample size dimin-ishes markedly prior to 1950, evidence of the survivorship problem. We usu-ally have twenty countries in the sample after that date, but in the interwarperiod the sample size is about a dozen, and before 1920 between five andten. A wide line traces out the sample size for a limited set of core countries,the G7. For this group there is a more consistent sample size over time, al-though only three series before 1920.
The middle panel shows the standard deviation of returns across time,calculated for a centered moving window of ten-year length and encom-passing the largest sample possible.53 Again, the thin line is the full sample,the wide line the G7. As a description of the coherence of the returns in G7equity markets this figure is strikingly consistent with the U-shape hypoth-esis and the underlying arbitrage arguments. Returns showed relativelylittle dispersion prior to 1914, but larger gaps opened up in the interwar pe-riod. This dispersion reached a peak around 1945 or 1950, but has been
158 Maurice Obstfeld and Alan M. Taylor
52. Since dividend data are not available for the entire sample, the calculated returns arebased on equity price changes only.
53. Specifically, we plot ten-year averages of the cross-sectional standard deviations of re-turns.
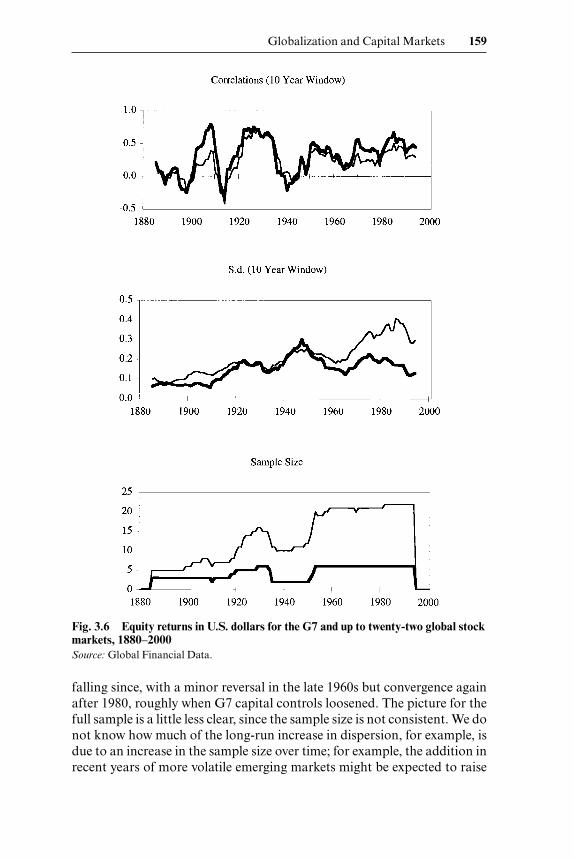
falling since, with a minor reversal in the late 1960s but convergence againafter 1980, roughly when G7 capital controls loosened. The picture for thefull sample is a little less clear, since the sample size is not consistent. We donot know how much of the long-run increase in dispersion, for example, isdue to an increase in the sample size over time; for example, the addition inrecent years of more volatile emerging markets might be expected to raise
Globalization and Capital Markets 159
Fig. 3.6 Equity returns in U.S. dollars for the G7 and up to twenty-two global stockmarkets, 1880–2000Source: Global Financial Data.

the variance. But for the post-1950 period, when the sample is stable, thetrends are quite similar to those in the G7, although the returns are muchless coherent than for the G7 in the 1970s and 1980s, a period in which cap-ital controls were much tighter in the periphery than in the core. It is alsoapparent that in the 1990s, the emerging markets have seen a much largerdecline in dispersion, at a time when economic reforms generally reducedbarriers to capital mobility, and emerging market portfolio investment grewrapidly.
Finally, the top panel explores a second measure of coherence of stockprices across countries, based on the average correlation of annual dollar re-turns with that on the U.S. market, again calculated for a centered movingwindow of ten-year length and encompassing the largest sample possible,and where the thin line is the average for the full sample and the wide linefor the G7. The correlations show clear disconnects between markets dur-ing times of well-known autarky, such as the two world wars. Periods ofhigh correlation also appear more recently and before 1914 (although onlyjust before). Although the noisiness of the correlations is quite large, thismuch, at least, is consistent with the U-shape story. What is not consistentwith the story is the large spike in cross-country correlations in the 1920sand 1930s. Why should this be so, in what was an era of supposedly fairlylow capital mobility?
One answer has been provided already by Eichengreen and Sachs (1985,fig. 5), who show that the interwar patterns may simply reflect commonshocks associated with going on and off the gold standard. To follow theirexample, consider the 1929 to 1935 period. Countries that stayed on goldlike France and Germany did endured a brutal downturn in prices and out-put, whereas countries that devalued did not. This has been empiricallyverified for wider samples such as Latin America (Campa 1990). It isconsistent with monetary explanations of recovery that build on boththe debt-deflation logic of Fisher and the expected-real-interest-rate chan-nel emphasized by Mundell, not to mention the conventional Keynesiantransmission mechanism (Temin 1989; Romer 1992; Eichengreen 1992;Bernanke and Carey 1996).
What did this mean for stock markets? In a world of nonneutral money,devaluers would be able to drive up Tobin’s q by restoring positive invest-ment expectations. Eichengreen and Sachs (1985) found a statistically sig-nificant correlation between the change in q and the change in the exchangerate (relative to gold parity) in a sample of nine countries from 1929 to 1935.We replicate and extend their analysis in figure 3.7. This figure shows thatthe correlation holds true in a wider sample of eighteen countries.
These results imply that we must therefore be cautious about interpretingan increased correlation among markets as evidence of globalization per se.Instead, certain high correlations might simply be a result of commonshocks among a group of countries, in this case countries experiencing, and
160 Maurice Obstfeld and Alan M. Taylor
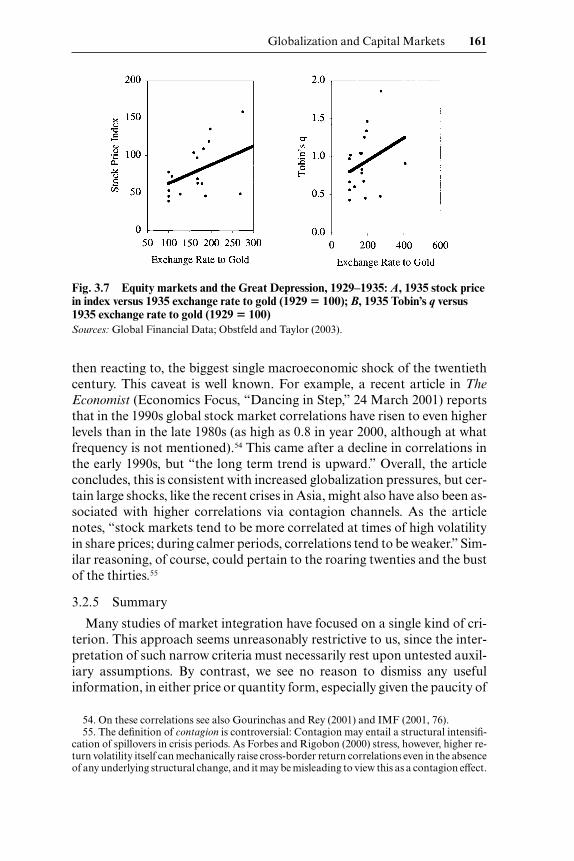
then reacting to, the biggest single macroeconomic shock of the twentiethcentury. This caveat is well known. For example, a recent article in TheEconomist (Economics Focus, “Dancing in Step,” 24 March 2001) reportsthat in the 1990s global stock market correlations have risen to even higherlevels than in the late 1980s (as high as 0.8 in year 2000, although at whatfrequency is not mentioned).54 This came after a decline in correlations inthe early 1990s, but “the long term trend is upward.” Overall, the articleconcludes, this is consistent with increased globalization pressures, but cer-tain large shocks, like the recent crises in Asia, might also have also been as-sociated with higher correlations via contagion channels. As the articlenotes, “stock markets tend to be more correlated at times of high volatilityin share prices; during calmer periods, correlations tend to be weaker.” Sim-ilar reasoning, of course, could pertain to the roaring twenties and the bustof the thirties.55
3.2.5 Summary
Many studies of market integration have focused on a single kind of cri-terion. This approach seems unreasonably restrictive to us, since the inter-pretation of such narrow criteria must necessarily rest upon untested auxil-iary assumptions. By contrast, we see no reason to dismiss any usefulinformation, in either price or quantity form, especially given the paucity of
Globalization and Capital Markets 161
Fig. 3.7 Equity markets and the Great Depression, 1929–1935: A, 1935 stock pricein index versus 1935 exchange rate to gold (1929 � 100); B, 1935 Tobin’s q versus1935 exchange rate to gold (1929 � 100)Sources: Global Financial Data; Obstfeld and Taylor (2003).
54. On these correlations see also Gourinchas and Rey (2001) and IMF (2001, 76).55. The definition of contagion is controversial: Contagion may entail a structural intensifi-
cation of spillovers in crisis periods. As Forbes and Rigobon (2000) stress, however, higher re-turn volatility itself can mechanically raise cross-border return correlations even in the absenceof any underlying structural change, and it may be misleading to view this as a contagion effect.

historical data in certain quarters. Thus, we have opted for a broad batteryof tests to try to cut down the possible set of explanations that could ac-count for the empirical record, and so, by a process of elimination, work to-ward a set on controlled conjectures concerning the evolution of the globalcapital market.
The preceding section succinctly conveys the benefits we think this kindof approach can deliver. Our quantity-based tests delivered a certain set ofstylized facts, and the price-based tests another set of facts. Combining thetwo, and introducing evidence on convergence and divergence in other eco-nomic phenomena such as living standards and demography, we claim thereis overwhelming support for the notion that the major long-run changes inthe degree of global capital mobility have taken the form of changes in theimpediments to capital flows, rather than any encouragement or discour-agement to flows arising from structural shifts within the economies them-selves. That is not to discount the fact that such changes have occurred, andare no doubt important at the margin; but it is an assertion that the virtualdisappearance of foreign capital flows and stocks in midcentury, and the ex-plosion in price differentials, can be explained only by an appeal to changesin arbitrage possibilities as permitted by two major constraining factors incapital market operations: technology and national economic policies.
From this point, it is a short step to the conclusion that a full accountingof the phenomena at hand must rest on a detailed political and institutionalhistory. Clearly, technology is a poor candidate for the explanation of thetwentieth-century collapse of capital mobility. In the 1920s and 1930s, theprevailing financial technologies were not suddenly forgotten by marketparticipants: Indeed some technologies, such as futures markets for foreignexchange, came to fruition in those decades. Technological evolution wasnot smooth and linear, but as we have already noted, was at least unidirec-tional, and, absent any other impediments, would have implied an uninter-rupted progress toward an ever more tightly connected global marketplace.
Such was not allowed to happen, of course. Rather, the shifting forces ofnational economic policies, as influenced by the prevailing economic theo-ries of the day, loomed large during and after the watershed event of thetwentieth century, the economic and political crisis of the Great Depres-sion. Understanding the macroeconomic and international economic his-tory of the last century in these terms, and the changes it wrought for theoperation of the global capital market, is a long and complex story, a nar-rative that properly accompanies the empirical record presented in this pa-per, and we take up some of the political economy dimensions of that storyin the section that follows.
3.3 Political Economy
We have thus far amassed evidence that international capital mobilityhas experienced two major swings over the course of the twentieth century:
162 Maurice Obstfeld and Alan M. Taylor

a pronounced decline during the interwar years and a recovery in the laterpostwar years. The timing is hard to pin down precisely, and, indeed, surelyvaried by country and by the type of capital movements being considered.
Taking this as given, we now must ask why capital mobility followed thispath, and what corroborative evidence we can assemble to buttress an ac-count of these events that incorporates the forces of political economy. Westart first with the downturn in capital mobility after 1914.
3.3.1 The Downturn
The conventional macrohistorical account of the collapse of capitalmobility after 1914 focuses on the trilemma, as we have noted, (Eichen-green 1996; Obstfeld and Taylor 1998). The literature suggests that the ma-jor political economy forces at work during this period were increasingpressure for macroeconomic activism, particularly from newly or better-enfranchised groups such as the working classes. If fixed exchange rateswere to be maintained, then capital mobility would have to be compro-mised, at least on some occasions. Maintenance of capital mobility insteadwould preclude an exchange rate target. Either option would raise uncer-tainty for investors.
It is believed that prior to 1914, gold standard orthodoxy had been a sinequa non for access to global capital markets on favorable terms. A firststudy by Bordo and Rockoff (1996) found that adherence to gold standardrules acted as a “seal of approval” for sovereign debt. Gold standard coun-tries had lower country risk, measured by the bond spread in London overthe British consol.56 Accordingly, evidence of a new political dynamic after1914 might be seen in a changing relationship between country risk andgold after the gold standard was reconstituted starting in 1925. With therules of the game in question after World War I, investors might havedoubted whether the announcement of a gold standard commitment alonewould signal credibility. In addition, public solvency indicators, such asdebt-GDP ratios, or inflation, might be seen as having a bigger impact oninternational bond spreads under the reconstituted gold standard than be-fore. Do such doubts manifest themselves in the data?
There is no uniform and comprehensive study of bond spreads acrossthese two eras that would allow us definitively to answer this question, buta second study by Bordo, Edelstein, and Rockoff (1999) came to a conclu-sion that was surprising, even by the authors’ own admission. Lookingsolely at 1920s bonds they found continued evidence that the gold standardremained a seal of approval, lowering bond spreads significantly, at leastwhen a country stuck to its prewar parity. Devaluers were not so lucky withtheir bond spreads, since for them, the impact of being on gold was small
Globalization and Capital Markets 163
56. Clemens and Williamson (2000), however, find no statistically significant gold standardeffect on the shares of British capital flows to various foreign recipients during 1870–1913. Itremains to reconcile the apparently conflicting message of the price and quantity data.

and statistically insignificant. Such a conclusion challenged the conven-tional wisdom that the interwar gold standard was a pale and less credibleshadow of its predecessor.
These are two pioneering studies but, for comparative work acrossregimes, they are not ideal. Unfortunately, they cannot be merged togetherinto a consistent picture because of differences in the methods and data em-ployed. The former study looked at long-term government bonds in the sec-ondary market, and examined their yield to maturity; the latter examinednew issues and their yield at the moment of flotation only. The former studytherefore had complete time series, whereas the latter had a small samplethat was often interrupted by missing data in years when no issues tookplace—a not uncommon event in the 1920s, and one that could raise a po-tential sample-selection issue. Finally, the former studied prices in London,the latter prices in New York, a switch that could be defended as the hege-monic center of global capital markets shifted across the Atlantic aroundthis time, and one that allowed the use of Cleona Lewis’ (1938) data on newissues for the 1920s.
To overcome the differences between these studies, we reexamine thequestion of what determined bond spreads in the pre-1914 and interwaryears using a much larger database that allows us to view a consistent set ofdata for a larger sample of countries from 1870 to 1940. In the Global Fi-nancial Data source and other primary sources we found the yields to ma-turity of government bonds traded in London for this entire period, and wefocus on more than twenty countries, some in the core and some in the pe-riphery, to see how their country risk evolved. This allows us to focus on thesame market and the same type of risk measure across both eras. To isolatethe effects of default risk, our spreads over London are exclusively forbonds denominated in gold or in sterling.
Figure 3.8 offers an overview of the data. The mean bond spread for thecore and periphery subsamples is presented in the top and bottom panels,respectively, and each is surrounded by a measure of dispersion, a bandequal to �2 standard deviations. The units are percentage points and thescales are deliberately the same on the two charts.57
164 Maurice Obstfeld and Alan M. Taylor
57. Country risk is calculated as the spread between the country’s long bond, denominatedin hard currency or gold (the external London bond), and the British consol. The core and em-pire countries are Australia, Canada, Denmark, Germany, India, New Zealand, Norway,South Africa, Sweden, and the United States. The periphery countries are Argentina, Austria(or Austria-Hungary, before World War I), Brazil, Chile, Egypt, Finland, Greece, Hungary(after World War I), India, Italy, Japan, Mexico, Portugal, Spain, Turkey, and Uruguay. Thereare occasional missing data, due to the fact that bonds are recorded by Global Financial Data(GFD) in domestic currency (paper) only or are not recorded at all. Notable gaps are Ar-gentina (1935–40), Austria (1933–40), Chile (1934–40), Denmark (1870–1918), Finland(1870–1910), Greece (1927–40), Mexico (1933–40), Sweden (1933–40), Uruguay (1934–40),and several countries around the time of World War I (1914–18). We supplement the GFDsource as follows: For Argentina we use improved data from della Paolera (1988) and Naka-mura and Zarazaga (2003). For the United States (1870–1914) we follow Bordo and Rockoff

The differences between the two subsamples are very striking: The core hadmuch smaller country risk than the periphery, as expected. Core countries
Globalization and Capital Markets 165
Fig. 3.8 London bond spreads, core and periphery, 1870–1940Source: Global Financial DataNotes: See footnote 57.
(1996), who use Calmoiris’ adjusted gold rate, since at this time government bonds bore silverrisk. For interwar Belgium, Denmark, Finland, France, Italy, Norway, Portugal, Sweden,Turkey, and Uruguay, GFD does not report gold or sterling bonds, so we collected new inter-war-yield data on London sterling or gold bonds from Investor’s Monthly Manual, The Times,The Wall Street Journal, and The Economist. For further details see Obstfeld and Taylor (forth-coming).

usually had interest rates within 1 or 2 percentage points of Great Britain’s.The periphery could have spreads as large as 10 percentage points, which wastantamount to having a bond in default in many cases. But the figures alsoshow some similarities, once we normalize for this scale difference: Both coreand periphery experienced a convergence in bond spreads up to 1914, andthen a good deal of volatility in the interwar years, when spreads widened.
The gradual convergence of bond spreads warns us that a simple static“on and off ” gold indicator is unlikely to capture the full dynamics of evolv-ing country risk in this period. Intuitively, these figures hint at high levels ofpersistence or serial correlation in bond spreads, and it is easy to imaginewhy. Bond spreads are a function of reputation, which, in capital marketsas in any other repeated game, cannot be built overnight. Instead, there isan “I know what you did last summer” effect: One’s reputation in the previ-ous period is likely to have substantial explanatory power in deciding one’sreputation today. Beyond this, levels of public indebtedness were relevantfor at least some countries. A general concern is that macroeconomic vari-ables correlated with gold standard adherence might be responsible for theapparent pre-1914 benefits of going on gold, or might mask such benefitsafter the First World War. Before the war, countries on gold may have hadmore disciplined fiscal policies, lower public debt, and hence more favor-able treatment by the bond markets. On the other hand, perhaps countriesthat inflated away their public debts in the early or mid-1920s would havebeen unlikely to rejoin gold at parity, making high public debts and a returnto gold at prewar parity positively correlated variables. In these circum-stances, omitting macrocontrols could lead us to overestimate the prewarbenefit of gold standard adherence and underestimate the postwar benefitof returning to gold at the prewar par.58
Following Bordo and Rockoff (1996), we investigate the relationship be-tween the dependent variable country risk, measured by the bond spreadover London, SPREADit � YIELDit – YIELDUK,t , and selected macroeco-nomic policy variables that could play a role for country i and time t. Onesuch variable is gold standard adherence, measured by two dummy vari-ables: GSPARit , which takes the value 1 if on date t country i is on gold at
166 Maurice Obstfeld and Alan M. Taylor
58. Flandreau, Le Cacheux, and Zumer (1998) argue that a major factor driving the evidentconvergence of bond spreads after the early 1890s and through 1914 is worldwide inflation re-sulting from gold discoveries, a factor that caused both an unexpected reduction in countries’ratios of public debt to nominal GDP and a more widespread adherence to the gold standard.For the pre-1914 period, Flandreau, Le Cacheux, and Zumer investigate borrowing spreadsover London using an all-European country sample different from that of Bordo and Rockoff(1996) and an econometric specification encompassing the public debt ratio to GDP as well asgold standard adherence. They report benefits from gold standard adherence on the order of35–55 basis points. They also find a positive effect of public debt on borrowing spreads. (Bordoand Rockoff included the public deficit in their estimating equation but found little effect.) Itis possible in principle that some of the benefits ascribed by Bordo and Rockoff to gold stan-dard adherence before 1914 can be accounted for by a tendency of association with more mod-erate real public debt levels, a point that provides a strong rationale for including the debt asan explanatory variable.

the 1913 parity, and GSDEVit , which takes the value 1 if the country is ongold at a devalued parity after 1913. Monetary policy reputation is proxiedby the lagged inflation rate, INFLi,t–1. As a final macroexplanatory variable,we examine the effects of lagged public debt levels, measured by the ratio ofdebt to output, PUBDGDPi,t–1. We also include country fixed effects to cap-ture constant but unmeasured political, economic, institutional, or geo-graphic features of individual countries (e.g., location on the periphery).
Like Bordo and Rockoff (1996), we also find it necessary to account forglobal interest rate shocks that affect spreads in all markets in a given year.To do this, following the logic of the “international capital asset pricingmodel,” we include (with a country-specific slope, or ) a measure of mar-ket risk in the form of SPREADW,t � YIELDWORLD,t – YIELDUK,t , wherethis term is the (1913 GDP-weighted) average world spread on the “saferate” (London) for the countries in the sample at time t.59,60
Using pooled annual data for a large sample of countries, the basic re-gression equation is then of the form
(4) SPREADit � i � i SPREADW,t � �Xit � uit
where
Xit � � �GSPARit
GSDEVit
PUBDGDPi,t�1
INFLi,t�1
Globalization and Capital Markets 167
59. We experimented with other ways to control for time-specific asset market shifts, such assimple time dummies, but the results appear robust.
60. Bond spread series as described in footnote 57.Gold standard adherence data are from Meissner (2001) and Obstfeld and Taylor (forth-
coming), available for all countries in all years. Other variables are available for only a subsetof years and countries, and this restricts the sample in our econometric tests accordingly.
Central-government public debt data (mostly starting in 1880) come from Bordo and Jo-nung (1996) for a sample of fourteen countries consisting of Belgium, Canada, Denmark, Fin-land, France, Germany, Italy, Japan, the Netherlands (starting 1900), Norway, Sweden,Switzerland (starting 1913), the United Kingdom, and the United States. For those countries,the same source has data on nominal GDP. After 1914, we augment our other public debt datawith the total central government debts reported by United Nations (1948); and we use thenominal GDP figures from Obstfeld and Taylor (2003) or GFD. Additional sources for debtwere as follows. Argentina: della Paolera (1988). Australia: Barnard (1987). Austria-Hungary:Niall Ferguson, based on data collected by Marc Flandreau (unpublished). Brazil: IBGE(1990) and Levy (1995). Chile: Mamalakis (1978–89). Egypt: Niall Ferguson, based onCrouchley (1938). India: Reserve Bank of India (1954). New Zealand: Lloyd Prichard (1970).Portugal: Valério (2001). Spain: Barciela and Carreras (1989). Turkey: Tezel (1986). Uruguay:unpublished data from Reto Bertoni, kindly provided by Luis Bértola, and based on the offi-cial data from Anuarios Estadísticos. Debts relative to nominal GDP were calculated usingnominal GDP data from Mitchell (1992, 1993, 1995), collated or augmented by Bordo andSchwarz (1997) and GFD, interpolated or supplemented by other sources as follows. Ar-gentina: della Paolera and Ortiz (1995). Austria-Hungary: Niall Ferguson, based on data col-lected by Marc Flandreau (unpublished). Egypt: Yousef (forthcoming). France: Jones and Ob-stfeld (2001). India: Goldsmith (1983). New Zealand: Hawke (1975) and Lineham (1968).Portugal: Nunes, Mata, and Valério (1989). Spain: Prados (2002). Uruguay: Bértola (1998)and Bertino and Tajam (2000).

is the vector of explanatory variables. (We also tried interacting debt and in-flation with a dummy variable equal to 1 for the periphery countries, not in-cluding regions of the British Empire, to capture the possibly different risktreatment of established versus emerging markets, but the results were in-significant and are therefore not reported.)61 The main question we ask iswhether 1914 was a watershed—that is, if the interwar gold standard di-ffered from its predecessor. Accordingly, we investigate this relationship onprewar (1870–1913) and interwar (1925–31) samples.
In tables 3.4 and 3.5 we report results for the prewar (1870–1913, usingDecember yields) and interwar (1925–31, using June yields) periods. Since
168 Maurice Obstfeld and Alan M. Taylor
We also tried using deficit-to-GDP ratios, following Bordo and Rockoff (1996), but, likethem, we found deficit ratios to be statistically insignificant in preliminary testing.
Inflation data are based on consumer (or GDP) price indices taken from Obstfeld and Taylor(2003), Bordo and Schwarz (1997), and GFD, supplemented by other sources above or as fol-lows. Argentina: Irigoin (2000); Cortés Conde (1989); and from della Paolera and Ortiz (1995).Austria-Hungary: Schulze (2000). Chile: Braun et al. (2000). Egypt: Yousef (forthcoming). In-dia: Goldsmith (1983). New Zealand: an implicit deflator of GDP, based on nominal GDP asabove, and real GDP from Maddison (1995). Portugal: Nunes, Mata, and Valério (1989).
We are unable to make our pre-1914 analysis of spread-debt relationships comparable withthat of Flandreau, Le Cacheux, and Zumer (1998), as their data set, which comprises a differ-ent country sample than ours, has not been made available. Besides apparently covering thecountries in our prewar sample, excluding Argentina, Australia, New Zealand, and the UnitedStates, Flandreau and colleagues’ sample adds public debt data for Switzerland and some ad-ditional “European peripheral” countries. Judging from the 1892 data from Haupt (1894)graphed by Dornbusch (1998), the European peripheral countries had significant public debtsrelative to GDP.
61. The core and empire countries are Australia, Belgium, Canada, Denmark, France, Ger-many, India, the Netherlands, New Zealand, Norway, South Africa, Sweden, Switzerland, andthe United States. The periphery countries are Argentina, Austria, Brazil, Chile, Finland,Greece, Hungary, Italy, Japan, Mexico, Portugal, Spain, and Uruguay. See figure 3.8.
Table 3.4 Country Risk and the Gold Standard, 1870–1913
OLS AR1
N 563 546Adjusted R2 0.68 0.84Mean of dependent variable 1.72 1.70Standard error of dependent variable 1.52 1.51Standard error of estimate 0.86 0.60Durbin-Watson statistic 0.59 1.37
GS –0.39 (0.16) –0.50 (0.19)PUBDGDP(t – 1) –0.05 (0.14) 0.06 (0.22)INFL(t – 1) 0.69 (0.48) 0.75 (0.03)� — 0.75 (0.03)
Sources: See text and footnotes 57 and 60.Notes: The dependent variable is SPREAD as in figure 3.8. Standard errors appear in paren-theses. Country fixed effects (i ) and betas (i ) are not reported. The seventeen countries inthe unbalanced panel are Argentina, Australia, Austria-Hungary, Brazil, Canada, Chile,Egypt, India, Italy, Japan, New Zealand, Norway, Portugal, Spain, Sweden, the United States,and Uruguay. There are some missing data. In the AR1 model a common autoregressive pa-rameter � applies to all countries.
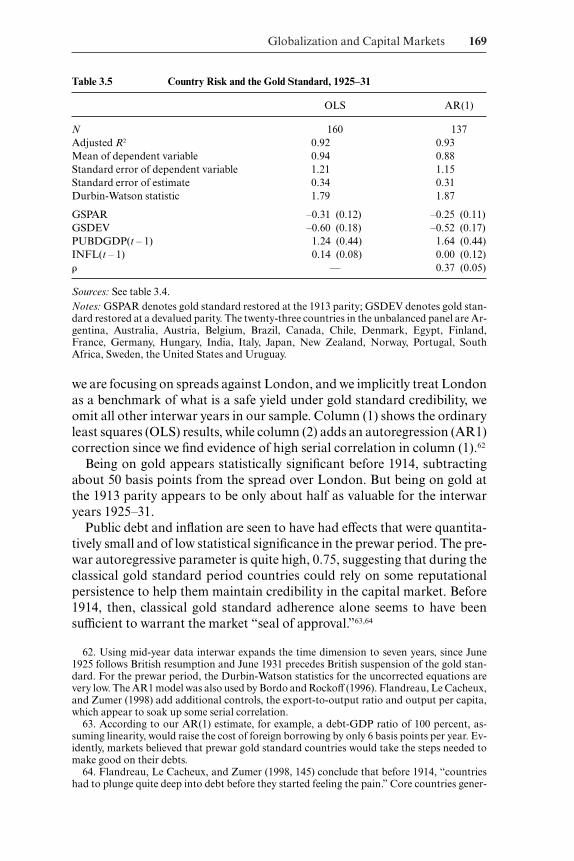
Globalization and Capital Markets 169
Table 3.5 Country Risk and the Gold Standard, 1925–31
OLS AR(1)
N 160 137Adjusted R2 0.92 0.93Mean of dependent variable 0.94 0.88Standard error of dependent variable 1.21 1.15Standard error of estimate 0.34 0.31Durbin-Watson statistic 1.79 1.87
GSPAR –0.31 (0.12) –0.25 (0.11)GSDEV –0.60 (0.18) –0.52 (0.17)PUBDGDP(t – 1) 1.24 (0.44) 1.64 (0.44)INFL(t – 1) 0.14 (0.08) 0.00 (0.12)� — 0.37 (0.05)
Sources: See table 3.4.Notes: GSPAR denotes gold standard restored at the 1913 parity; GSDEV denotes gold stan-dard restored at a devalued parity. The twenty-three countries in the unbalanced panel are Ar-gentina, Australia, Austria, Belgium, Brazil, Canada, Chile, Denmark, Egypt, Finland,France, Germany, Hungary, India, Italy, Japan, New Zealand, Norway, Portugal, SouthAfrica, Sweden, the United States and Uruguay.
we are focusing on spreads against London, and we implicitly treat Londonas a benchmark of what is a safe yield under gold standard credibility, weomit all other interwar years in our sample. Column (1) shows the ordinaryleast squares (OLS) results, while column (2) adds an autoregression (AR1)correction since we find evidence of high serial correlation in column (1).62
Being on gold appears statistically significant before 1914, subtractingabout 50 basis points from the spread over London. But being on gold atthe 1913 parity appears to be only about half as valuable for the interwaryears 1925–31.
Public debt and inflation are seen to have had effects that were quantita-tively small and of low statistical significance in the prewar period. The pre-war autoregressive parameter is quite high, 0.75, suggesting that during theclassical gold standard period countries could rely on some reputationalpersistence to help them maintain credibility in the capital market. Before1914, then, classical gold standard adherence alone seems to have beensufficient to warrant the market “seal of approval.”63,64
62. Using mid-year data interwar expands the time dimension to seven years, since June1925 follows British resumption and June 1931 precedes British suspension of the gold stan-dard. For the prewar period, the Durbin-Watson statistics for the uncorrected equations arevery low. The AR1 model was also used by Bordo and Rockoff (1996). Flandreau, Le Cacheux,and Zumer (1998) add additional controls, the export-to-output ratio and output per capita,which appear to soak up some serial correlation.
63. According to our AR(1) estimate, for example, a debt-GDP ratio of 100 percent, as-suming linearity, would raise the cost of foreign borrowing by only 6 basis points per year. Ev-idently, markets believed that prewar gold standard countries would take the steps needed tomake good on their debts.
64. Flandreau, Le Cacheux, and Zumer (1998, 145) conclude that before 1914, “countrieshad to plunge quite deep into debt before they started feeling the pain.” Core countries gener-

It is important to note that this pattern does not hold for the interwar pe-riod. For that era, the market seems to have been more discerning in itsscrutiny of all borrowers’ public debt data (although inflation remainsunimportant). In these samples we also find somewhat weaker evidence ofreputational persistence (as measured by the autoregressive parameter of0.37), perhaps further evidence of the fragile credibility associated with theinterwar gold standard where markets seemed to discount reputation.
Our estimates suggest that an interwar increase in public debt equivalentto 10 percentage points of GDP could raise spreads by 12 to 16 basis points.By this measure, the sensitivity of bond spreads to debt was much larger af-ter the war than before.
These findings may help us to understand why many policymakers in the1920s and 1930s so feared the market response to unbalanced public bud-gets, notwithstanding the countercyclical case for fiscal expansion (James2001). In this period, being on gold was not, in itself, enough to soothe mar-kets.
A noteworthy finding in the 1925–31 results of table 3.5 is that returningto gold at a devalued parity is estimated to have fully twice the beneficialeffect of returning at prewar parity, very much contrary to the Bordo-Edelstein-Rockoff empirical result. This finding supports the theoreticalview of Drazen and Masson (1994) that policymakers may hurt rather thanenhance their credibility through policies that appear tough in the shortterm but are too draconian to be sustained for long. It also shows that in-terwar markets could forgive the expropriation of prior bondholders, pro-vided the current economic fundamentals looked sustainable.
One concern about the results of table 3.5 is that they may conflate thebenefits countries gained when they returned to gold with the spread effectsof the dire circumstances in which countries left gold (never to return) priorto Great Britain’s own departure in September 1931. Our on-gold dummycaptures the complement of the set of all dates on which a country was ongold. Thus, we may overstate the case for gold by viewing the effects of thegathering Great Depression simply as a market response to gold abandon-ment.
To address such an overstatement we add a third dummy, GSOFF, whichtakes a value of 1 for years in which a country was off gold following a priorinterwar resumption. Table 3.6 reports the results of estimation. In these re-gressions, the effect of returning to gold at par is wiped out, whereas theeffect of returning at devalued parity, although smaller than in table 3.5(around 40 basis points now), remains significant. Being forced off of goldraised spreads by 50–60 basis points, and the effect is highly significant.
170 Maurice Obstfeld and Alan M. Taylor
ally had public debt levels at which, according to the authors, “markets did not inflict massivepunishments.” Unlike in our sample, as we have noted, those authors do find that debt raisedspreads before 1914.

These results are not surprising. Primary exporting countries such as Ar-gentina, Australia, and Uruguay returned to gold at par only to be forcedoff in 1929–30 amid sharply higher external borrowing costs. The signifi-cant negative coefficient on GSPAR in table 3.5 mainly reflects the fact thatthese countries enjoyed lower external borrowing costs before the onset ofthe Depression. (For the same reason, estimating over the truncated period1925–30 attenuates the effect of GSPAR.) Both the Drazen-Masson effectand the importance of public debt remain, however, in table 3.6, so thesemay be regarded as robust features of the interwar capital market.
In Obstfeld and Taylor (forthcoming), we explore a different specifica-tion, but our main conclusions do not change very much. Accounts of theGreat Depression (such as Kindleberger 1986) emphasize the role of ad-verse terms of trade shocks in forcing primary exporters to leave gold priorto Great Britain’s own 1931 departure. Thus, we add the terms of trade asan explanatory variable in our equation but omit GSOFF. We also allow forthe spread effects of countries’ default statuses. The most notable changefrom the preceding results is a decline in the prewar “good housekeeping”effect to roughly 25 basis points, an estimate that remains highly statisti-cally significant. The terms of trade are a significant determinant of spreadsbetween the wars but not prior to 1914.
To recapitulate: Unlike Bordo, Edelstein, and Rockoff (1999), we findvery different behavior of bond spreads in relation to the gold standard overthe interwar period 1925–31 as compared to the pre-1914 period. This maybe ascribed mainly to differences in concept (use of around-secondary-market bond yields in London versus new issues in New York) and differ-ences in macroeconomic control variables (government debt rather thandeficit). Of these features in our empirical approach, the first, at least, seems
Globalization and Capital Markets 171
Table 3.6 Country Risk and the Gold Standard, 1925–31
OLS AR(1)
N 160 137Adjusted R2 0.93 0.93Mean of dependent variable 0.94 0.88Standard error of dependent variable 1.21 1.15Standard error of estimate 0.33 0.30Durbin-Watson statistic 1.77 1.71
GSPAR –0.02 (0.15) 0.04 (0.13)GSDEV –0.45 (0.18) –0.37 (0.17)GSOFF 0.53 (0.17) 0.58 (0.17)PUBDGDP(t – 1) 1.08 (0.43) 1.41 (0.42)INFL(t – 1) 0.14 (0.08) 0.04 (0.10)� — 0.40 (0.05)
Sources: See table 3.5.Notes: GSOFF denotes gold standard suspension after interwar resumption.

necessary if we are to make comparisons on an equal footing with Bordoand Rockoff (1996).
Before 1914, we find that the gold standard did indeed confer a “seal ofapproval,” with macrofundamentals such as public debt and inflation mat-tering little. For the interwar period, a return to gold after devaluation (asin the case of France) seemed more credible, notwithstanding the argu-ments that led Great Britain and other countries to return to gold at par; in-deed, returning at par yielded small benefits at best. Moreover, for core andperiphery countries alike, high public debts were punished, suggesting thatpolicymakers’ room for maneuver was further curtailed.
Our results both on the drop in spreads associated with going on gold,and on markets’ differential response to public debt prewar versus interwar,suggest that the interwar gold standard was indeed seen as different and lesscredible than its pre-1914 predecessor. It remains fully to reconcile these re-sults with findings such as those of Hallwood, MacDonald, and Marsh(1996) that indicate a highly credible gold standard during the late 1920s, atleast in the short term. Perhaps the bond markets adopted a longer per-spective under which protracted adherence to unchanging gold paritiesseemed less probable than short-term adherence.
3.3.2 The Upturn
After the immediate post–World War II dislocations, the world economybegan to reconstitute its severed linkages, a process both promoting andpromoted by the return of some degree of durable prosperity and peace.Postwar policymakers, through the IMF, successive multilateral trade lib-eralization rounds, current account currency convertibility, and other mea-sures, successfully promoted growing world trade. By the late 1960s, thevery success of these initiatives in forging trading linkages among countriessimultaneously made capital flows across borders ever more difficult to con-tain. As a result, the trilemma reemerged with full force, and on a globalscale, in the early 1970s. The Bretton Woods system, initially designed for aworld of tightly controlled capital movements, blew apart. The major in-dustrial countries retreated to floating exchange rates.
While initially viewed as a temporary expedient, floating rates have re-mained a durable feature of the international financial landscape. Floatingrates helped reconcile the social demand for domestic macroeconomic sta-bilization with the interest of the business community for open marketsin goods and assets. Some episodes of exchange rate misalignment haveprompted calls for renewed protection and even capital account restric-tions. Some of these calls have been accommodated, but usually not in theform of across-the-board restrictions on international transactions.
Other forces have also helped to promote liberalization. In Europe, thepolitical and economic rationales for a large single market have promptedongoing financial liberalization; at the same time, the political (and, someargue, economic) imperative of stable exchange rates has pushed toward the
172 Maurice Obstfeld and Alan M. Taylor

logical conclusion of a single currency, the euro. Other regions, likewise,have opted for fixed exchange rates, either by some form of ultrahard peg oroutright dollarization, in either case bending to the trilemma by giving upmonetary policy autonomy.
Since the late 1980s, the drive toward capital account liberalization in thedeveloping world is probably the most striking pattern in the evolution ofglobal capital markets. Clearly one element has been the widespread failurein the periphery of populist policies adopted in the 1980s and earlier. Reac-tions to those failures gave free-market ideologies a greater influence. On alarger scale, the collapse of the Soviet empire in the late 1980s also high-lighted the advantages of the capitalist model. The resulting decline in ColdWar tensions certainly held out the promise of greater fluidity in private in-ternational capital. Whether exchange rates float or are fixed, there is muchgreater openness to private financial flows on the periphery than in the1980s. In part a reflection of U.S. business interests, American administra-tions have pushed developing economies to liberalize on capital account; insome cases, liberalization ran far ahead of domestic financial systems’ ab-sorptive capacities, and clashed with national exchange rate policies. Theresulting contradictions helped spark the developing-country currencycrises of the latter 1990s. To attract productive capital from the industrialworld remains a prime goal on the periphery, however, and that requiresmarket-oriented reforms, stable macropolicies, and transparency in gover-nance and legal systems.
There is, however, one critical dimension in which pre-1914 internationalcapital flows differ sharply in nature from what we see today, with impor-tant implications for the periphery; to see this we return to the distinctionbetween net and gross international asset stocks. A cursory glance at thedata reveals that this problem is very serious in recent decades but was rel-atively unimportant in the pre-1914 era of globalization. The reason issimple: In the late nineteenth century the principal flows were long-term in-vestment capital, and virtually unidirectional at that. There was one notableexception, the United States, where both inflows and outflows were large.But in most cases key creditor nations, principally Great Britain but alsoFrance and Germany, engaged in the financing of other countries’ capitalaccumulation, and in doing so, developed enormous one-way positions intheir portfolios.
For example, circa 1914 the scale of Argentine assets in Great Britain’sportfolio was very large, but the converse holding of British assets by Ar-gentines was trivial by comparison. Thus, the nineteenth century was an eraof one-way asset shifts, leading to great portfolio diversification by the prin-cipal creditor-outflow nations like Great Britain, but relatively little diver-sification by the debtor-inflow nations. To a first approximation, the grossasset and liability positions were very close to net in that distant era. The1980s and 1990s are obviously very different: For example, the UnitedStates became in this period the world’s largest net debtor nation. While ac-
Globalization and Capital Markets 173

counting for the biggest national stock of gross foreign liabilities, however,the United States also held the largest stock of gross foreign assets.
Our earlier discussion of the gross stock data, and our inferences con-cerning the recovery of foreign assets and liabilities in the world economyafter 1980, therefore need considerable modification to take into accountthis problem. Indeed, it is a significant problem for all of the countries con-cerned: The ranking of countries by foreign assets in the IMF data is veryhighly correlated with the ranking by foreign liabilities. Countries such asGreat Britain, Japan, Canada, Germany, and the Netherlands are all bigholders of both foreign assets and liabilities. Strikingly, when we net out thedata the result is that, since 1980, the net foreign asset position (or liability)positions in the world economy have remained very low indeed, as indicatedby figure 3.9. Unlike the gross stocks, the net stocks have increased little,and if we trust the asset data rather more (arguably more of the net assetdata are collected in richer industrial countries with better accountingmethods), then the picture is one of relative decline in the size of net foreigncapital stocks relative to GDP.
Thus, for all the suggestion that we have returned to the pre-1914 type ofglobal capital market, here is one major qualitative difference between thenand now. Today’s foreign asset distribution is much more about asset swap-
174 Maurice Obstfeld and Alan M. Taylor
Fig. 3.9 Foreign capital stocks: Net versus grossSource: IMF.
ping by rich countries—diversification—than it is about the accumulationof large one-way positions—a critical component of the development pro-cess in poorer countries in standard textbook treatments. It is thereforemore about hedging and risk sharing than it is about long-term finance andthe mediation of saving supply and investment demand between countries.In the latter sense, we have never come close to recapturing the heady timesof the pre-1914 era, when a creditor like Great Britain could persist foryears in satisfying half of its accumulation of assets with foreign capital, ora debtor like Argentina could similarly go on for years generating liabilitiesof which one-half were taken up by foreigners. Instead, still to a very greatextent today, a country’s net wealth will depend, for accumulation, on theprovision of financing from domestic rather than foreign sources (Feldsteinand Horioka 1980).
An interesting, and closely related, insight also follows from looking atthe share of less developed countries (LDCs) in global liabilities. This is nowat an all-time low. In 1900, LDCs in Asia, Latin America, and Africa ac-counted for 33 percent of global liabilities; in the 1990s, only 11 percent (fig.3.3). The global capital market of the nineteenth century centered on Eu-rope, especially London, extended relatively more credit to LDCs than doestoday’s global capital market. Is this surprising? There are various interpre-tations for this observation. One is that capital markets are biased now, orwere biased in the past; for example, did Great Britain, as an imperialpower, favor LDCs within her orbit with finance? Or, today, does the globalcapital market fail in the sense that there are insufficient capital flows toLDCs, and an excess of flows among developed countries? These are hardclaims to prove, as market failure could be a cause, as could a host of otherfactors including institutions and policies affecting the marginal product ofcapital in different locations. Of course, this result just follows from the factthat many of the top asset holders also figure in the top liability holders, andmost of them are developed OECD countries.
Figure 3.10 illustrates both the periphery’s need to draw on industrialcountry savings, and an important dimension in which the globalization ofcapital markets remains behind the level attained under the classical goldstandard. In the last great era of globalization, the most striking character-istic is that foreign capital had its biggest impact (relative to receiving regionGDP) in capital-scarce poor countries, although it also moved to somericher countries. The richer countries were the settler economies where cap-ital was attracted by abundant land, and the poor countries were placeswhere capital was attracted by abundant labor.65
Globalized capital markets are back, but with a difference: Capital trans-actions seem to be mostly a rich-rich affair, a process of “diversification fi-nance” rather than “development finance.” The high-impact creditor-
Globalization and Capital Markets 175
65. On the broad distribution of foreign capital then, see Twomey (2000).

debtor country pairs involved are more rich-rich than rich-poor, and today’sforeign investment in the poorest developing countries lags far behind thelevels attained at the start of the last century. In other words, we see againthe paradox noted by Lucas (1990), of capital failing to flow to capital-poorcountries, places where we would presume the marginal product of capitalto be very high. The figure may also understate the failure in some ways: Acentury ago, world income and productivity levels were far less divergentthan they are today, so it is all the more remarkable that so much capital wasdirected to countries at or below the 20 percent and 40 percent income lev-els (relative to the United States). Today, a much larger fraction of theworld’s output and population is located in such low-productivity regions,but a much smaller share of global foreign investment reaches them.66
As we have noted, capital is discouraged from entering poorer countriesby a host of factors, and some of these were less relevant a century ago. Cap-ital controls persist in many regions. The risks of investment may be per-ceived differently after a century of exchange risks, expropriations, and de-faults. Domestic policies that distort prices, especially of investment goods,may result in returns too low to attract any capital. These conditions make
176 Maurice Obstfeld and Alan M. Taylor
Fig. 3.10 Did capital flow to poor countries? 1913 versus 1997Sources: The 1913 stock data are from Woodruff (1967) and Royal Institute of InternationalAffairs (1937); incomes are from Maddison (1995). The 1997 data are from Lane and Milesi-Ferretti (2001), based on the stocks of inward direct investment and portfolio equity liabili-ties.
66. See Clemens and Williamson (2000) for a detailed analysis of the determinants of Britishcapital export before 1914.

a difficult situation much worse. Poorer countries must draw on foreign cap-ital to a greater extent than they do at present if they are to achieve an ac-ceptable growth in living standards. This is a fundamental reason that re-form and liberalization in the developing world, despite the setbacks of thelate 1990s, are likely to continue, albeit hopefully with due regard to thepainful lessons learned in the recent past.
References
Balke, N. S., and M. E. Wohar. 1998. Nonlinear dynamics and covered interest rateparity. Empirical Economics 23:535–59.
Barciela, C., and A. Carreras. 1989. Estadisticas historicas de España: Siglos XIX–XX (Spanish historical statistics: Nineteenth and twentieth centuries). Madrid:Fundación Banco Exterior.
Barnard, A. 1987. Government finance. In Australians: Historical statistics, ed. W.Vamplew, 254–85. Broadway, New South Wales: Fairfax, Syme, and Weldon.
Baxter, M., and A. C. Stockman. 1989. Business cycles and the exchange-rateregime: Some international evidence. Journal of Monetary Economics 23 (May):377–400.
Bernanke, B. S., and K. Carey. 1996. Nominal wage stickiness and aggregate supplyin the Great Depression. Quarterly Journal of Economics 111 (August): 853–83.
Bertino, M., and H. Tajam. 2000. El PBI de Uruguay 1900–55. Montevideo.Bértola, L. 1998. El PBI uruguayo 1870–1936 y otras estimaciones (Uruguayan
GDP 1870–1936 and other estimations). Montevideo: Facultad de Ciencias So-ciales. Mimeograph.
Bhagwati, J. N. 1998. The capital myth. Foreign Affairs 77 (May-June): 7–12).Bordo, M. D., M. Edelstein, and H. Rockoff. 1999. Was adherence to the gold stan-
dard a “Good Housekeeping Seal of Approval” during the interwar period?NBER Working Paper no. 7186. Cambridge, Mass.: National Bureau of Eco-nomic Research, June.
Bordo, M. D., and B. Eichengreen, eds. 1993. A retrospective on the Bretton Woodssystem: Lessons for international monetary reform. Chicago: University of Chi-cago Press.
———. 2001. The rise and fall of a barbarous relic: The role of gold in the interna-tional monetary system. In Money, capital mobility, and trade: Essays in honor ofRobert A. Mundell, ed. R. Dornbusch, M. Obstfeld, and G. Calvo, 53–121. Cam-bridge, Mass.: MIT Press.
Bordo, M. D., B. Eichengreen, and J. Kim. 1999. Was there really an earlier period ofinternational financial integration comparable to today? In The implications of theglobalization of world financial markets, ed. S. Lee, 27–75. Seoul: Bank of Korea.
Bordo, M. D., and L. Jonung. 1996. Monetary regimes, inflation, and monetary re-form: An essay in honor of Axel Leijonhufvud. In Inflation, institutions, and in-formation: Essays in honor of Axel Leijonhufvud, ed. D. Vaz and K. Velupillai,157–244. London: Macmillan.
Bordo, M. D., and F. E. Kydland. 1995. The gold standard as a rule: An essay in ex-ploration. Explorations in Economic History 32:423–64.
Bordo, M. D., and H. Rockoff. 1996. The gold standard as a “Good HousekeepingSeal of Approval.” Journal of Economic History 56 (June): 389–428.
Globalization and Capital Markets 177
Bordo, M. D., and A. J. Schwartz. 1997. Monetary policy regimes and economicperformance: The historical record. NBER Working Paper no. 6201. Cambridge,Mass.: National Bureau of Economic Research, September.
———. Eds. 1984. A retrospective on the classical gold standard, 1821–1931.Chicago: University of Chicago Press.
Braun, J., M. Braun, I. Briones, J. Díaz, R. Lüders, and G. Wagner. 2000. EconomiaChilena 1810–1995: Estadísticas históricas (The Chilean economy 1810–1995:Historical statistics). Documento de Trabajo no. 187. Pontificia UniversidadCatólica de Chile, Instituto de Economia, January.
Brezis, E. S. 1995. Foreign capital flows in the century of Britain’s industrial revolu-tion: New estimates, controlled conjectures. Economic History Review 48 (Febru-ary): 46–67.
Calomiris, C. W., and R. G. Hubbard. 1996. International adjustment under theclassical gold standard: Evidence for the United States and Britain, 1879–1914.In Modern perspectives on the gold standard, ed. T. Bayoumi, B. Eichengreen, andM. P. Taylor, 189–217. Cambridge: Cambridge University Press.
Cameron, R. E. 1993. A concise economic history of the world: From paleolithic timesto the present. New York: Oxford University Press.
Campa J. M. 1990. Exchange rates and economic recovery in the 1930s: An exten-sion to Latin America. Journal of Economic History 50 (September): 677–82.
Chortareas, G. E., and R. L. Driver. 2001. PPP and the real exchange rate–real in-terest rate differential puzzle revisited: Evidence from non-stationary panel data.London: Bank of England. Photocopy, June.
Clemens, M., and J. G. Williamson. 2000. Where did British foreign capital go? Fun-damentals, failures, and the Lucas paradox 1870–1913. NBER Working Paperno. 8028. Cambridge, Mass.: National Bureau of Economic Research, December.
Clinton, K. J. 1988. Transactions costs and covered interest arbitrage: Theory andevidence. Journal of Political Economy 96 (April): 358–70.
Cohen, B. J. 1996. Phoenix risen: The resurrection of global finance. World Politics48:268–96.
Cortés Conde, R. 1989. Dinero, deuda y crisis: evolución fiscal y monetaria en la Ar-gentina, 1862–90. Buenos Aires: Editorial Sudamericana.
Crouchley, A. E. 1938. The economic development of modern Egypt. London: Long-mans Green.
Davis, L. E. 1965. The investment market, 1870–1914: The evolution of a nationalmarket. Journal of Economic History 25:355–99.
Davis, L. E., and R. E. Gallman. 2001. Evolving financial markets and internationalcapital flows: Britain, the Americas, and Australia, 1865–1914. Japan-U.S. CenterSanwa Monographs on International Financial Markets. Cambridge: CambridgeUniversity Press.
Davis, L. E., and J. R. T. Hughes. 1960. A Dollar-Sterling Exchange, 1803–1895.Economic History Review 13 (August): 52–78.
della Paolera, G. 1988. How the Argentine economy performed during the interna-tional gold standard: A reexamination. Ph.D. diss. University of Chicago.
della Paolera, G., and J. Ortiz. 1995. Dinero, intermediación financiera y nivel de ac-tividad en 110 años de historia económica Argentina (Money, financial interme-diation, and level of activity in 110 years of Argentine economic history). Docu-mentos de Trabajo no. 36. Universidad Torcuato Di Tella, December.
Dornbusch, R. 1998. Discussion. Economic Policy 26 (April): 149–52.Drazen, A., and P. R. Masson. 1994. Credibility of policies versus credibility of pol-
icymakers. Quarterly Journal of Economics 109 (August): 735–54.Eatwell, J. 1997. International financial liberalization: The impact on world develop-
178 Maurice Obstfeld and Alan M. Taylor

ment. United Nations Development Program Discussion Paper no. 12. NewYork: United Nations.
Edelstein, M. 1982. Overseas investment in the age of high imperialism. New York:Columbia University Press.
Edison, H. J., and W. R. Melick. 1999. Alternative approaches to real exchangerates and real interest rates: Three up and three down. International Journal of Fi-nance and Economics 4:93–111.
Edison, H. J., and B. D. Pauls. 1993. A re-assessment of the relationship betweenreal exchange rates and real interest rates: 1974–1990. Journal of Monetary Eco-nomics 31 (April): 165–87.
Eichengreen, B. J. 1992. Golden fetters: The gold standard and the Great Depression,1919–1939. Oxford: Oxford University Press.
———. 1996. Globalizing capital: A history of the international monetary system.Princeton, N.J.: Princeton University Press.
Eichengreen, B. J., and M. Flandreau. 1996. The geography of the gold standard. InCurrency convertibility: The gold standard and beyond, ed. J. Braga de Macedo,B. J. Eichengreen, and J. Reis, 113–43. London: Routledge.
Eichengreen, B. J., and J. Sachs. 1985. Exchange rates and economic recovery in the1930s. Journal of Economic History 45 (December): 925–46.
Einzig, P. 1937. The theory of forward exchange. London: Macmillan.———. 1968. Leads and lags: The main cause of devaluation. London: Macmillan.Elliott, G. 1999. Efficient tests for a unit root when the initial observation is drawn
from its unconditional distribution. International Economic Review 40 (August):767–83.
Elliott, G., T. J. Rothenberg, and J. H. Stock. 1996. Efficient tests for an autoregres-sive unit root. Econometrica 64:813–36.
Escher, F. 1918. Elements of foreign exchange. 8th ed. New York: Bankers Publish-ing Company.
Feinstein, C. K. 1990. Britain’s overseas investments in 1913. Economic History Re-view 43 (May): 288–96.
Feldstein, M., and C. Horioka. 1980. Domestic savings and international capitalflows. Economic Journal 90 (June): 314–29.
Feis, H. 1931. Europe, the world’s banker, 1870–1914: An account of European foreigninvestment and the connection of world finance with diplomacy before the war. NewHaven, Conn.: Yale University Press.
Flandreau, M., J. Le Cacheux, and F. Zumer. 1998. Stability without a pact?Lessons from the European gold standard, 1880–1914. Economic Policy 26(April): 115–62.
Flandreau, M., and C. Rivière. 1999. La grande “retransformation”? L’intégrationfinancière internationale et contrôles de capitaux, 1880–1996 (The great “re-transformation”? International financial integration and capital controls, 1880–1996). Économie Internationale 78:11–58.
Forbes, K., and R. Rigobon. 2000. Contagion in Latin America: Definitions, mea-surement, and policy implications. NBER Working Paper no. 7885. Cambridge,Mass.: National Bureau of Economic Research, September.
Frieden, J. A. 1997. Monetary populism in nineteenth-century America: An openeconomy interpretation. Journal of Economic History 57 (June): 367–95.
Fujii, E., and M. Chinn. 2000. Fin de siècle real interest parity. NBER Working Pa-per no. 7880. Cambridge, Mass.: National Bureau of Economic Research, Sep-tember.
Gallarotti, G. M. 1995. The anatomy of an international monetary regime: The clas-sical gold standard 1880–1914. New York: Oxford University Press.
Globalization and Capital Markets 179

Gerschenkron, A. 1943. Bread and democracy in Germany. Berkeley and Los Ange-les: University of California Press.
Goldsmith, R. W. 1983. The financial development of India, 1860–1977. New Haven,Conn.: Yale University Press.
———. 1985. Comparative national balance sheets: A study of twenty countries,1688–1978. Chicago: University of Chicago Press.
Gourinchas, P. O., and H. Rey. 2001. Stocks and monies. Princeton University. Un-published manuscript.
Hallwood, C. P., R. MacDonald, and I. W. Marsh. 1996. Credibility and funda-mentals: Were the classical and interwar gold standards well-behaved targetzones? In Modern perspectives on the gold standard, ed. T. Bayoumi, B. Eichen-green, and M. P. Taylor, 129–61. Cambridge: Cambridge University Press.
Hamori, S., and A. Tokihisa. 1997. Testing for a unit root in the presence of a vari-ance shift. Economics Letters 57:245–53.
Haupt, O. 1894. Arbitrages et parités (Arbitrage and parities). 8th ed. Paris: Li-brairie Truchy.
Hawke, G. R. 1975. Income estimation from monetary data: Further explorations.Review of Income and Wealth 21:301–07.
IBGE (Fundação Instituto Brasileiro de Geografia e Estatística). 1990. Estatísticashistóricas do Brasil: séries econômicas, demográficas e sociais de 1550 a 1988 (His-torical statistics of Brazil: Economic, demographic, and social statistics from1550 to 1988). Rio de Janeiro: IBGE.
International Monetary Fund. 1997. International financial statistics. Washington,D.C.: September.
———. 2001. World economic outlook. Washington, D.C.: IMF, October.Irigoin, M. A. 2000. Finance, politics, and economics in Buenos Aires 1820s–1860s:
The political economy of currency stabilization. Ph.D. diss., London School ofEconomics.
James, H. 2001. The end of globalization: Lessons from the Great Depression. Cam-bridge: Harvard University Press.
Jones, M. T., and M. Obstfeld. 2001. Saving and investment under the gold stan-dard. In Money, capital mobility, and trade: Essays in honor of Robert A. Mundell,ed. G. Calvo, R. Dornbusch, and M. Obstfeld, 303–63. Cambridge: MIT Press.
Jorion P., and W. N. Goetzmann. 1999. Global stock markets in the twentieth cen-tury. Journal of Finance 54 (June): 953–80.
Kindleberger, C. P. 1984. A financial history of Western Europe. London: GeorgeAllen and Unwin.
———. 1986. The world in depression, 1929–1939. Rev. ed. Berkeley: University ofCalifornia Press.
———. 1989. Commercial policy between the wars. In The Cambridge economic his-tory of Europe, ed. P. Mathias and S. Pollard. Cambridge: Cambridge UniversityPress.
Klug, A., and G. W. Smith. 1999. Suez and sterling, 1956. Explorations in EconomicHistory 36 (July): 181–203.
Lane, P., and G.-M. Milesi-Ferretti. 2001. The external wealth of nations: Measuresof foreign assets and liabilities for industrial and developing countries. Journal ofInternational Economics 55 (December): 243–62.
Levy, M. B. 1995. The Brazilian public debt: Domestic and foreign, 1824–1913. InThe public debt in Latin America in historical perspective, ed. R. Liehr, 209–54.Frankfurt am Main: Vervuert.
Lewis, C. 1938. America’s stake in international investments. Washington, D.C.:Brookings Institution.
180 Maurice Obstfeld and Alan M. Taylor

———. 1945. Debtor and creditor countries: 1938, 1944. Washington, D.C.: TheBrookings Institution.
Lewis, K. K. 1999. Trying to explain home bias in equities and consumption. Jour-nal of Economic Literature 37 (June): 571–608.
Lineham, B. T. 1968. New Zealand’s gross domestic product, 1918–38. NewZealand Economic Papers 2:16.
Lloyd Prichard, M. F. 1970. An economic history of New Zealand to 1939. Auckland:Collins.
Lucas, R. E., Jr. 1990. Why doesn’t capital flow from rich to poor countries? Amer-ican Economic Review 80 (May): 92–96.
MacDonald, R., and J. Nagayasu. 2000. The long-run relationship between real ex-change rates and real interest rate differentials: A panel study. IMF Staff Papers47 (November): 116–28.
Maddison, A. 1995. Monitoring the world economy. Paris: Organization for Eco-nomic Cooperation and Development.
———. 2001. The world economy: A millennial perspective. Development CentreStudies. Paris: Organization for Economic Cooperation and Development.
Mamalakis, M. J. 1978–89. Historical statistics of Chile, 6 vols. Westport, Conn.:Greenwood Press.
Margraff, A. W. 1908. International exchange: Its terms, parts, operations, and scope.3rd ed. Chicago: Privately printed.
Marshall, M. G., and K. Jaggers. N.d. Polity IV project: Political regime characteris-tics and transitions, 1800–1999. Dataset Users’ Manual. College Park: Universityof Maryland, Center for International Development and Conflict Management.
Meese, R. A., and K. Rogoff. 1988. Was it real? The exchange rate–interest differ-ential relation over the modern floating-rate period. Journal of Finance 43 (Feb-ruary): 933–48.
Meissner, C. 2001. A new world order: Explaining the emergence of the classicalgold standard. University of California–Berkeley. Photocopy.
Mitchell, B. R. 1992. International historical statistics: Europe, 1750–1988. NewYork: Stockton Press.
———. 1993. International historical statistics: The Americas, 1750–1988. NewYork: Stockton Press.
———. 1995. International historical statistics: Africa, Asia, and Oceania, 1750–1988. New York: Stockton Press.
Nakamura, L. I., and C. E. J. M. Zarazaga. 2003. Banking and finance, 1900–35. InArgentina: Essays in the new economic history, ed. G. della Paolera and A. M. Tay-lor. Cambridge: Cambridge University Press. Forthcoming.
Neal, L. 1990. The rise of financial capitalism: International capital markets in theAge of Reason. Cambridge: Cambridge University Press.
———. 2000. How it all began: The monetary and financial architecture of Europeduring the first global capital markets, 1648–1815. Financial History Review 7(October): 117–40.
Nunes, A. B., E. Mata, and N. Valério. 1989. Portuguese economic growth 1833–1985. Journal of European Economic History 18:291–330.
Obstfeld, M. 1995. International capital mobility in the 1990s. In Understanding in-terdependence: The macroeconomics of the open economy, ed. P. B. Kenen, 201–61.Princeton, N.J.: Princeton University Press.
———. 1998. The global capital market: Benefactor or menace? Journal of Eco-nomic Perspectives 12 (Fall): 9–30.
Obstfeld, M., and K. Rogoff. 1995. The mirage of fixed exchange rates. Journal ofEconomic Perspectives 9 (Fall): 73–96.
Globalization and Capital Markets 181
———. 2000. The six major puzzles in international macroeconomics: Is there acommon cause? In NBER macroeconomics annual 2000, ed. B. S. Bernanke andK. Rogoff, 339–90. Cambridge: MIT Press.
Obstfeld, M., and A. M. Taylor. 1997. Nonlinear aspects of goods-market arbitrageand adjustment: Heckscher’s commodity points revisited. Journal of the Japaneseand International Economies 11 (December): 441–79.
———. 1998. The Great Depression as a watershed: International capital mobilityin the long run. In The defining moment: The Great Depression and the Americaneconomy in the twentieth century, ed. M. D. Bordo, C. D. Goldin, and E. N. White,353–402. Chicago: University of Chicago Press.
———. 2003. Global capital markets: Integration, crisis, and growth. Japan-U.S.Center Sanwa Monographs on International Financial Markets. Cambridge:Cambridge University Press. Forthcoming.
———. Forthcoming. Sovereign risk, credibility, and the gold standard: 1870–1913versus 1925–31. Economic Journal.
Officer, L. H. 1996. Between the dollar-sterling gold points: Exchange rates, parity,and market behavior. Cambridge: Cambridge University Press.
Oppers, S. E. 1993. The interest rate effect of Dutch money in eighteenth-centuryBritain. Journal of Economic History 53 (March): 25–43.
O’Rourke, K. H., and J. G. Williamson. 1999. Globalization and history: The evolu-tion of a nineteenth-century Atlantic economy. Cambridge: MIT Press.
Paish, G. 1914. Export of capital and the cost of living. The Statist (Supplement, 14February): i–viii.
Peel, D. A., and M. P. Taylor. 2002. Covered interest rate arbitrage in the inter-warperiod and the Keynes-Einzig conjecture. Journal of Money, Credit, and Banking34 (February): 51–75.
Perkins, E. H. 1978. Foreign interest rates in American financial markets: A revisedseries of dollar-sterling exchange rates, 1835–1900. Journal of Economic History38 (June): 392–417.
Platt, D. C. M. 1986. Britain’s investment overseas on the eve of the First World War:The use and abuse of numbers. New York: St. Martin’s.
Polanyi, K. 1944. The great transformation. New York: Rinehart.Prados de la Escosura, L. 2002. El progreso económico de España, 1850–2000
(Spain’s economic progress, 1850–2000). Madrid: Universidad Carlos III. Photo-copy.
Rajan, R. G., and L. Zingales. 2001. The great reversals: The politics of financial de-velopment in the twentieth century. University of Chicago, Graduate School ofBusiness. Photocopy.
Reserve Bank of India. 1954. Banking and monetary statistics of India. Bombay: Re-serve Bank of India.
Rippy, J. F. 1959. British investments in Latin America, 1822–1949: A case study inthe operations of private enterprise in retarded regions. Minneapolis: University ofMinnesota Press.
Rodrik, D. 2000. How far will international economic integration go? Journal ofEconomic Perspectives 14 (Winter): 177–86.
Romer, C. D. 1992. What ended the Great Depression? Journal of Economic History52 (December): 757–84.
Royal Institute of International Affairs. 1937. The problem of international invest-ment. London: Oxford University Press.
Sachs, J. D., and A. Warner. 1995. Economic reform and the process of global inte-gration. Brookings Papers on Economic Activity, Issue no. 1:1–118. Washington,D.C.: Brookings Institution.
182 Maurice Obstfeld and Alan M. Taylor

Schulze, M.-S. 2000. Patterns of growth and stagnation in the late 19th century Hab-sburg economy. European Review of Economic History 4:311–40.
Spalding, W. F. 1915. Foreign exchange and foreign bills in theory and practice. Lon-don: Sir Isaac Pitman and Sons.
Sylla, R. E. 1975. The American capital market, 1846–1914: A study of the effects ofpublic policy on economic development. New York: Arno.
———. 1998. U.S. securities markets and the banking system, 1790–1840. FederalReserve Bank of St. Louis Review 80 (3): 83–98.
Temin, P. 1989. Lessons from the Great Depression. Cambridge: MIT Press.Tezel, Y. S. 1986. Cumhuriyet döneminin ıktisadi tarihi, 1923–50. 2nd ed. Ankara:
Yurt Yayınları. Triffin, R. 1957. Europe and the money muddle: From bilateralism to near-
convertibility, 1947–1956. New Haven, Conn.: Yale University Press.Twomey, M. J. 1998. Patterns of foreign investment in Latin America in the twenti-
eth century. In Latin America and the world economy since 1800, ed. J. H.Coatsworth and A. M. Taylor. Cambridge: Harvard University Press.
———. 2000. A century of foreign investment in the third world. London: Routledge.United Nations. 1948. Public debt 1914–1946. Lake Success, N.Y.: United Nations
Publications.Valério, N., ed. 2001. Estatisticas históricas portuguesas (Portuguese historical sta-
tistics). Lisbon: Instituto Nacional de Estatística.Williamson, J. G. 1995. The evolution of global labor markets since 1830: Back-
ground evidence and hypotheses. Explorations in Economic History 32 (April):141–96.
———. 1996. Globalization, convergence, and history. Journal of Economic History56 (June): 277–306.
Woodruff, W. 1967. Impact of Western man: A study of Europe’s role in the worldeconomy 1750–1960. New York: St. Martin’s.
World Bank. 1994. World data 1994: World Bank indicators on CD-ROM. Wash-ington, D.C.: World Bank.
Yousef, T. Forthcoming. Egypt’s growth performance under economic liberalism,1885–1945: A reassessment using new GDP estimates. Review of Income andWealth.
Comment Richard Portes
The key assertion of this paper is that the extent of globalization or inte-gration of capital markets since the second half of the nineteenth centuryhas followed a clear pattern: a remarkable rise of capital market globaliza-tion from (say) 1860 to 1914, then a sharp fall in World War I, followed bya trough lasting over fifty years, then a strong new upsurge to the presentday. The paper offers a hypothesis to explain this pattern: the “trilemma”and national policy responses to it. A subsidiary theme is the shift from cap-
Globalization and Capital Markets 183
Richard Portes is professor of economics at the London Business School, president of theCentre for Economic Policy Research, and a research associate of the National Bureau of Eco-nomic Research.

ital flows as development finance in the first period of globalization to cap-ital flows as portfolio diversification across industrial countries in the sec-ond globalization era.
There is no attempt to test the trilemma hypothesis, even to confront itwith alternatives. The main effort is to assemble wide-ranging evidence thatthe pattern itself was very general and observable in both quantities (cross-border capital flows) and prices (interest rates, equity returns).
There are alternative drivers of capital mobility that may suggest at leastsome qualifications to the trilemma hypothesis. It is not clear whether someare consistent with the historically observed oscillation that is documentedhere, nor whether they are truly exogenous, as the trilemma-based forcescould claim to be.
Consider first information and communications technology (ICT).Many regard that as the primary force behind the global integration of cap-ital markets in the past two decades. One could say this recent ICT revolu-tion has only one parallel historically, the invention of the telegraph andthen the telephone pre-1914—with no such impetus in the interwar period,but on the other hand, no breakdown of the technology either. So thatmight get us somewhere in explaining the two waves of globalization, but itdoes not have anything to say about the interwar trough. The same could besaid of financial market technology itself—there was a remarkable devel-opment of financial instruments in the first wave of globalization, and againin the past two decades, but of course no “technological regress” that couldbe responsible for the interwar period.
The enforcement of international contracts is essential for financial inte-gration. Pre-1914, this was ensured by imperial structures and gunboatdiplomacy. They offered a political and legal framework sufficient to sup-port development finance from rich to poor countries and the accumulationof large net foreign asset positions in unreliable environments. That frame-work disintegrated in the First World War, and only from the late 1960s on-ward did we get adequate substitutes: the Paris Club, the London Club,IMF conditionality, and overall U.S. geopolitical hegemony that often ex-erted pressure on debtors to meet their contractual obligations.
International financial instability—in particular, volatility and wideswings in exchange rates—is a deterrent to financial integration. Indeed,many would say that the first era of globalization was underpinned by thegold standard and British hegemony. Yet although the dollar peg, gold ex-change standard established at Bretton Woods was instrumental in main-taining monetary discipline and low inflation, and American hegemony re-placed the British role, the period 1945–70 nevertheless did not see a majoradvance in international financial integration. Financial globalization tookoff again after the Bretton Woods exchange rate mechanism broke down.And in view of the crises of 1982, 1995, 1997, and 1998, it is hard to see theIMF as the guarantor of stability. This may help, however, to explain why
184 Maurice Obstfeld and Alan M. Taylor
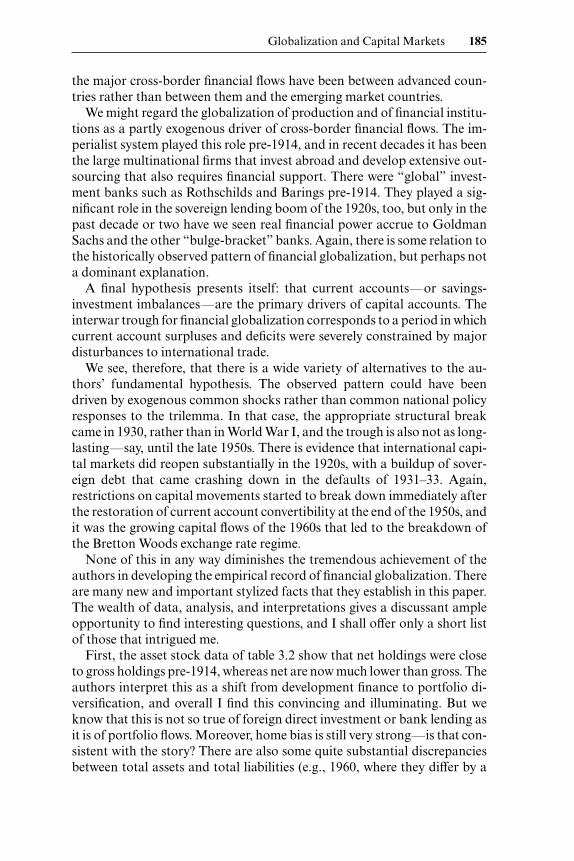
the major cross-border financial flows have been between advanced coun-tries rather than between them and the emerging market countries.
We might regard the globalization of production and of financial institu-tions as a partly exogenous driver of cross-border financial flows. The im-perialist system played this role pre-1914, and in recent decades it has beenthe large multinational firms that invest abroad and develop extensive out-sourcing that also requires financial support. There were “global” invest-ment banks such as Rothschilds and Barings pre-1914. They played a sig-nificant role in the sovereign lending boom of the 1920s, too, but only in thepast decade or two have we seen real financial power accrue to GoldmanSachs and the other “bulge-bracket” banks. Again, there is some relation tothe historically observed pattern of financial globalization, but perhaps nota dominant explanation.
A final hypothesis presents itself: that current accounts—or savings-investment imbalances—are the primary drivers of capital accounts. Theinterwar trough for financial globalization corresponds to a period in whichcurrent account surpluses and deficits were severely constrained by majordisturbances to international trade.
We see, therefore, that there is a wide variety of alternatives to the au-thors’ fundamental hypothesis. The observed pattern could have beendriven by exogenous common shocks rather than common national policyresponses to the trilemma. In that case, the appropriate structural breakcame in 1930, rather than in World War I, and the trough is also not as long-lasting—say, until the late 1950s. There is evidence that international capi-tal markets did reopen substantially in the 1920s, with a buildup of sover-eign debt that came crashing down in the defaults of 1931–33. Again,restrictions on capital movements started to break down immediately afterthe restoration of current account convertibility at the end of the 1950s, andit was the growing capital flows of the 1960s that led to the breakdown ofthe Bretton Woods exchange rate regime.
None of this in any way diminishes the tremendous achievement of theauthors in developing the empirical record of financial globalization. Thereare many new and important stylized facts that they establish in this paper.The wealth of data, analysis, and interpretations gives a discussant ampleopportunity to find interesting questions, and I shall offer only a short listof those that intrigued me.
First, the asset stock data of table 3.2 show that net holdings were closeto gross holdings pre-1914, whereas net are now much lower than gross. Theauthors interpret this as a shift from development finance to portfolio di-versification, and overall I find this convincing and illuminating. But weknow that this is not so true of foreign direct investment or bank lending asit is of portfolio flows. Moreover, home bias is still very strong—is that con-sistent with the story? There are also some quite substantial discrepanciesbetween total assets and total liabilities (e.g., 1960, where they differ by a
Globalization and Capital Markets 185
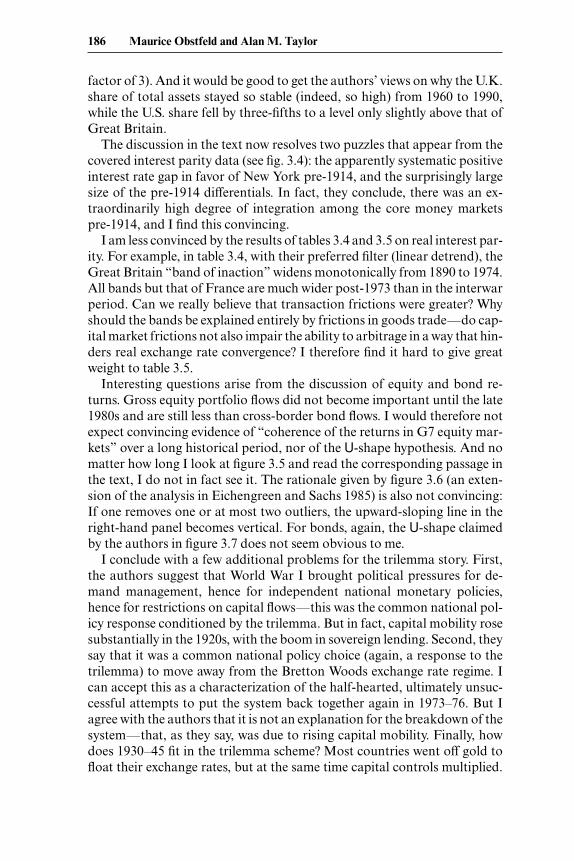
factor of 3). And it would be good to get the authors’ views on why the U.K.share of total assets stayed so stable (indeed, so high) from 1960 to 1990,while the U.S. share fell by three-fifths to a level only slightly above that ofGreat Britain.
The discussion in the text now resolves two puzzles that appear from thecovered interest parity data (see fig. 3.4): the apparently systematic positiveinterest rate gap in favor of New York pre-1914, and the surprisingly largesize of the pre-1914 differentials. In fact, they conclude, there was an ex-traordinarily high degree of integration among the core money marketspre-1914, and I find this convincing.
I am less convinced by the results of tables 3.4 and 3.5 on real interest par-ity. For example, in table 3.4, with their preferred filter (linear detrend), theGreat Britain “band of inaction” widens monotonically from 1890 to 1974.All bands but that of France are much wider post-1973 than in the interwarperiod. Can we really believe that transaction frictions were greater? Whyshould the bands be explained entirely by frictions in goods trade—do cap-ital market frictions not also impair the ability to arbitrage in a way that hin-ders real exchange rate convergence? I therefore find it hard to give greatweight to table 3.5.
Interesting questions arise from the discussion of equity and bond re-turns. Gross equity portfolio flows did not become important until the late1980s and are still less than cross-border bond flows. I would therefore notexpect convincing evidence of “coherence of the returns in G7 equity mar-kets” over a long historical period, nor of the U-shape hypothesis. And nomatter how long I look at figure 3.5 and read the corresponding passage inthe text, I do not in fact see it. The rationale given by figure 3.6 (an exten-sion of the analysis in Eichengreen and Sachs 1985) is also not convincing:If one removes one or at most two outliers, the upward-sloping line in theright-hand panel becomes vertical. For bonds, again, the U-shape claimedby the authors in figure 3.7 does not seem obvious to me.
I conclude with a few additional problems for the trilemma story. First,the authors suggest that World War I brought political pressures for de-mand management, hence for independent national monetary policies,hence for restrictions on capital flows—this was the common national pol-icy response conditioned by the trilemma. But in fact, capital mobility rosesubstantially in the 1920s, with the boom in sovereign lending. Second, theysay that it was a common national policy choice (again, a response to thetrilemma) to move away from the Bretton Woods exchange rate regime. Ican accept this as a characterization of the half-hearted, ultimately unsuc-cessful attempts to put the system back together again in 1973–76. But Iagree with the authors that it is not an explanation for the breakdown of thesystem—that, as they say, was due to rising capital mobility. Finally, howdoes 1930–45 fit in the trilemma scheme? Most countries went off gold tofloat their exchange rates, but at the same time capital controls multiplied.
186 Maurice Obstfeld and Alan M. Taylor

The problem was in fact the debt defaults of 1931–33, then the approach ofwar.
All this makes me eager to read the authors’ forthcoming book, whichwill expand on these and other issues in the historical development of cap-ital markets.
Reference
Eichengreen, B. J., and J. Sachs. 1985. Exchange rates and economic recovery in the1930s. Journal of Economic History 45 (December): 925–46.
Globalization and Capital Markets 187

Related Documents