University Of Khartoum Faculty of Engineering Department of Chemical Engineering Global warming Case Study: Carbon Dioxide Emissions from Cement Industry in Atbara A Thesis Submitted in Partial Fulfillment of the Requirement for the Degree of Master of Science in Chemical Engineering. By: Nuraz Ahmed Mahmoud Awad B.Sc. (hon), Chemical Engineering, U of K, 1999 Supervisor: Dr. Kamal Eldin Eltayeb Sept 2008

Welcome message from author
This document is posted to help you gain knowledge. Please leave a comment to let me know what you think about it! Share it to your friends and learn new things together.
Transcript

University Of Khartoum
Faculty of Engineering
Department of Chemical Engineering
Global warming
Case Study: Carbon Dioxide Emissions from
Cement Industry in Atbara
A Thesis Submitted in Partial Fulfillment of the Requirement for
the Degree of Master of Science in Chemical Engineering.
By:
Nuraz Ahmed Mahmoud Awad B.Sc. (hon), Chemical Engineering, U of K, 1999
Supervisor:
Dr. Kamal Eldin Eltayeb
Sept 2008

I
Dedication
I dedicate this research to the most important two people to me, the
people whose entire life was devoted and made available to be what
I am and to achieve what I have successfully achieved. With all my
love and appreciation, I dedicate this research to my parents,
Ahmed Mahmoud Awad and Fatimah Dyab.
To my sisters; Amani, Amal, Dalia and Rania and to my only
beloved brother Ayman, I dedicate this research to them as they
have inspired and helped me with all the support I needed
throughout my life. Indeed, their significance and existence in my
life added a new flavor to it, without them, I could have not been
what I am now.
To my only love, and love forever, my husband Ibrahim, I dedicate
this research to him as his endless support and wise suggestive
inputs were a major significant factor to the success and completion
of this research paper.
I finally conclude by dedicating this research paper to my children;
the light that I see the world through, and the ambition that I
portray the future with; Ahmed, Amal and Yousif.
II
Acknowledgement
I would like to express my gratitude to all those who gave me the
possibility to complete this thesis. Specifically, I want to thank the
Department of Chemical Engineering in University of Khartoum for
facilitating and providing the required materials and the talented
staff throughout the Masters degree to do the necessary research
work and to use its facilities to complete required tasks. I have
furthermore to thank my father, mother, sisters and brother whose
spiritual help was a significant factor for a successful completion for
my research.
I am deeply indebted to my supervisor Dr. Kamal AlDeen AlTayeb
whose help, stimulating suggestions and encouragement helped me
in all the time of research for and writing for this thesis.
Especially, I would like to give my special thanks to my husband
Ibrahim whose patient love enabled me to complete this work.
My former colleagues from the Department of Chemical
Engineering supported me in my research work. I want to thank
them for all their help, support, interest and valuable hints.
Especially I am obliged to my wonderful freinds Mona Ali Badi and
Abubakr Abdalla Basheer and also I would like to thanks
Abdelgabar Malla for his geart help.

III
Abstract
The objective of this research is to explore the contributions of
cement industry to global warming with special reference to the
flourishing and rapidly growing Cement industry in Sudan.
International agreements were discussed and mathematical models
for the representation of climate change were developed. As a case study,
emissions of Carbon dioxide from Atbara cement factory were calculated
and analyzed through collection of the necessary information on the
productivity of the factory, fuel types and the properties of raw materials
used in cement production. Molecular weights, used carbon fuel
combustion equations and calcinations processes were utilized in the
calculation of CO2 emissions. The second method has been used for
recalculation with the assumption of pre-heaters addition and the
utilization of fuel alternatives.
The results obtained revealed that, using natural gas, five stage pre-
heaters and raw materials with low organic subestances contributes the
best to the positive performance.
The study recommended continuing dissemination of global
warming and climate change culture and information to different
concerned parties. To reduce the influence and contribution of cement
industry to global warming, it is recommended to add a pre-heater to
kilns, use natural gas as an alternative fuel instead of furnace, develop
alternative cement to replace the costly and pollutant Portland cement. It
is also recommended to look for ways and means to minimize carbon
dioxide emission or through absorption and use of absolute ethanol or
blend thereof.

IV
مستخلص
ةفى االنبعاث الحرارى من خالل دراس األسمنتةاعن صةاستكشاف مساهم الىالبحثيهدف
واحتراق الوقود مع الترآيز على ةانبعاث غاز ثانى اآسيد الكربون الناتج عن عمليات الكلسن
.صناعة االسمنت السودانية المتسارعة النمو
مجال آما تم التطرق واختيار نماذج رياضية فى الة محتوى االتفاقيات العالميةتمت مناقش
وقود و ال آمية ثانى اآسيد الكربون المنبعثة من احتراق و حساب .لمحاآاة عملية التغير المناخى
هالزمة عن انتاج المصنع ونوع الوقود ومحتوالوذلك بجمع المعلومات اكلسنة العمليات
. عطبرة آدراسة حالة أسمنتمصنع -تسمن األة صناع ومواصفات الخام المستخدم فىيالحرار
اجريت نفس آما . باستخدام االوزان الجزيئية ونسبة الكربون ومعادالت االحتراق والكلسنةوذلك
).pre-heaters( أوليعند اضافة مسخن ة بافتراض استخدام بدائل الوقود الحسابات السابق
مقارنة يد الكربوندة غاز ثانى اآس من زيايقللاوضحت نتائج البحث ان استخدام الغاز الطبيعي
مواد استخدام و )pre-heaters( أولية ات آما ان اضافة مسخنمع بعض أنواع الوقود األخرى
غاز ثانى عاثب ان يقلل من يقلل من استهالك الوقود وبالتالى خالية من المواد العضويةهخام شب
.يد الكربوناآس
السهام فى لمختلف الجهات وذلك لئة واالحتباس الحرارى ثقافة البي بمواصلة بثاوصت الدراسة
للفرنأولي واضافة مسخن آما اوصت بأن يتم استخدام الغاز الطبيعى آوقود .تقليل االنبعاثات
والبحث عن طرق وانتاج اسمنت مخلوط بدًال من البورتالندى فى الحاالت التى تستدعى ذلك
إلى الحد األدنى عن طريق االمتصاص أو استعمال المنبعث يد الكربون ثانى اآس من لتقليل
. االيثانول المطلق أو خلطه منه

V
Table of content
Dedication I Acknowledgment II Abstract III Abstract (Arabic) V Table of Contents VI List of Tables VIII List of Figures VIII List of Abbreviations IX
Chapter 1. Introduction 1.1 General 1 1.2 Objectives 3 1.2.1General objectives 3 1.2.2 Specific objective 3
Chapter 2. Literature Review 2.1 Relationship between Climate Change and Weather 4 2.2 The History of the Earth temperatures change 4 2.3 Factors Affecting Earth’s Climate 7 2.4 Greenhouse Gases Effect 9 2.5 Human Activities Contribution to Climate Change 13 2.6 International actors in global warming 16 2.7 Kyoto Protocol 20 2.8 Carbon Emissions Climbing 22 2.9 Global Warming Solutions 28 2.9.1 Electricity end-use Efficiency 29 2.9.2 Other end-use Efficiency 29 2.9.3 Passenger Vehicle and Other Transport Efficiency 30 2.9.4 Renewable Technologies 30 2.9.5 Carbon capture and storage (CCS) 31 2.10 The Cement Industry and Global Warming 32 2.10.1 Portland Cement Production Process 33 2.10.2 Row materials 35 2.10.3 Fuels 36 2.10.4 Kiln 36 2.10.5 Pre-heater 38
Chapter 3. Materials & Methods 3.1 Mathematical Modeling of Global Climate 40
VI
3.1.1 A Simple Global Temperature 40 3.1.2 Global Energy Balance for Climate Change: 43 3.2 Case study on Cement industry 46 3.2.1 The study area 46 3.2.2 Methods & tools used in the case study 46 3.2.3 Procedure of study 47
Chapter 4. Results & Discussions 4.1 Mathematical modeling 49 4.2 Atbara cement factory: 49 4.2.1Calculation of CO2 emission from calcinations 50 4.2.2 Calculation of CO2 emission from combustion of
fuels 51
4.2.3 Alternative fuels 53 4.2.4 Calculation of CO2 emission from fuel incase of
adding five stage Pre-heater 55
Chapter 5. Conclusions & Recommendations 5.1 Conclusions 60 5.2 Recommendations 61 References 62 Appendixes 64

VII
List of tables
Table 2.1 Carbon Emissions from Fossil Fuel Burning……… 23 Table 2.2. Change in Greenhouse Gas Emissions from 1990 to
2004……………………………………………….. 26
Table 4.1. Comparison for Different CO2-Emitting-Sources…. 51 Table 4.2. Comparison for Different CO2-Emitting-Sources.. 58
List of figures
Figure 2.1 Global Warming Data…………………………… 6 Figure 2.2. An idealized Model of Greenhouse Effect……… 10 Figure 2.3 Keeling Curve…………………………………… 13 Figure 2.4 Greenhouse Gases Changes……………………... 14 Figure 2.5 Carbon Emissions from Fossil Fuel……………... 24 Figure 3.1 Global Average Energy Flows between Space,
the Atmosphere, and the Earth Surface…………. 45
VIII
List of abbreviations
GHGs greenhouse gases ppm parts per million IPCC Intergovernmental Panel on Climate Change CFC chlorofluorocarbons WMO World Meteorological Organization IMO International Meteorological Organization UNEP United Nations Environment Programme IPCC Intergovernmental Panel on Climate Change UNFCCC UN Framework Convection on Climate Change WG1 IPCC Working Group I WG2 IPCC Working Group II WG3 IPCC Working Group III TFI Task Force on National Greenhouse Gas Inventories IPCC-NGGIP IPCC National Greenhouse Gas Inventories Programme TGICA Task Group on Data and Scenario Support for Impacts
and Climate Analysis TGCIA Task Group on Scenarios for Climate and Impacts
Assessment DDC IPCC Data Distribution Centre GCMs global climate models CCS Carbon Capture and Storage PHP preheating and pre-calcinations kilns

Global Warming Chapter 1
1
1. Introduction 1.1 General
Sometimes, it is hard to define global warming in a fancy way or with the
usage of scientific terminologies since it is a problem that, every person should be
award of. However, the best way to define it is to point toward it and prove its
existence. The problem of global warming is sensed and seen in every part of the
planet. The melting of the glaciers, the rising of the sea levels, the drying of the
forests, the destruction of the wildlife, and the overall heating of the planet are all
indicating factors to global warming. Simply stated, all the results of these factors
are called global warming. It is causing a set of changes to the Earth’s climate, or
long-term weather patterns that varies from place to place. As the Earth spins each
day, the new heat swirls with it, picking up moisture over the oceans, rising here,
settling there. It is changing the rhythms of climate that all living things have come
to rely upon.
Is the global warming real or it just has been exaggerated? The easiest and
the most straightforward answer to the addressed question are to look up past
records about the temperature measurements. Dramatic changes in the overall
temperature have been found. Examining the sediments could be another way to
test its truth. Sediments preserve all these bits and pieces, which contain a wealth
of information about what was in the air and water when they fell. Scientists reveal
this record by inserting hollow tubes into the mud to collect sediment layers going
back millions of years. Moreover, trees store information about the climate in the
place where they live. Each year, trees grow thicker and form new rings. In warmer
and wetter years, the rings are thicker. Old trees and wood can tell us about
conditions hundreds or even several thousands of years ago.

Global Warming Chapter 1
2
For a direct look at the atmosphere of the past, scientists drill cores through
the earth's polar ice sheets. Tiny bubbles trapped in the gas are actually pieces of
the earth's past atmosphere, frozen in time. That's how the concentrations of
greenhouse gases are known since the industrial revolution are higher than they've
been for hundreds of thousands of years. Computer models help scientists to
understand the Earth's climate, or long-term weather patterns. Models also allow
scientists to make predictions about the future climate. Basically, models simulate
how the atmosphere and oceans absorb energy from the sun and transport it around
the globe.
Global warming has been causing the most controversial debates nowadays
from the political standpoint as well as the economic standpoint. Surprisingly
enough, presidential candidates in the United States of America have been using it
as a winning token when running for the presidency such as Al Gore, who let the
masses know about global warming in his documentary “The Inconvenient Truth”.
This research work is shaded light into the global warming problem, its historical
background, its effects and causes, present scientific results, and list solutions in
order to overcome the problem.

Global Warming Chapter 1
3
1.2 Objectives
1.2.1 General objective
• To study different international agreements concerning the climate change
and CO2 emission with respect to cement industry.
1.2.2 Specific objectives
• Investigate the influence and contribution of Atbra cement industry on the
climatic changes and environment.
• Propose research plans to minimize CO2 emission from Cement industries.
• Review and simulate the mathematical modeling of climatic change.

Global Warming Chapter 2
4
2. Literature Review
2.1 General
People always confuse between climate and weather. Simply stated,
climate can be thought of as a long-term average weather. Observations can
show that there have been changes in weather, and its statistics of changes in
weather over time that identify climate change, while weather and climate are
closely related, there are important differences. A major difference between
weather and climate is that weather is unpredictable phenomenon due to its
chaotic nature, whereas climate is a much more manageable issue. A major
limiting factor to the predictability of weather beyond several days is a
fundamental dynamical property of the atmosphere, nevertheless, meteorologists
are able to predict the weather successfully several days into the future using
physics-based concepts that controls how the atmosphere moves, warms, cools,
rains, snows, and evaporates water. [1]
2.2 The History of the Earth temperatures change
It has been mentioned previously in other sections of this paper that the
overall temperature of Earth has been changing, a good question to ponder upon
perhaps would be; how is that happening? By this question, it is meant to present
some statistical, historical data along with a small discussion.
Surface temperatures have increased by about 0.74oC over the past
hundred years, and that is between 1906 and 2005 as indicated in the figure
below, Figure 2.1. However, this warming has been neither steady nor the same
in different seasons or in different locations. There was not much overall change
from 1850 to about 1915, aside from ups and downs associated with natural

Global Warming Chapter 2
5
variability but which may have also partly arisen from poor sampling. For the
most part, warming in the last century has occurred in two phases; phase one was
from the 1910s to the 1940s with an average of 0.35oC followed by a slight
cooling of 0.1oC, phase two was warmer than phase one and it was from the
1970s to the end of 2006 with an average of 0.55oC. An increasing rate of
warming has taken place over the past 25 years, and the last 12 years have been
recorded to be the warmest so far. Warming, particularly since the 1970s, has
generally been greater over land than over the oceans. Seasonally, warming has
been slightly greater in the winter hemisphere.
Above the surface, the atmosphere is divided into four horizontal layers;
troposphere, stratosphere, mesosphere, and thermosphere. The troposphere and
stratosphere are characterized by decreasing temperature. Mesosphere and
thermosphere are characterized by decreasing temperature. The troposphere is
usually very turbulent place; that is, there are strong vertical air movements that
lead to rapid and complete mixing. This mixing is good for air quality since it
rapidly disperses pollutants. Above the troposphere is a stable layer of very dry
air called the stratosphere. Pollutants that find their way into the stratosphere
may remain there for many years before they eventually drift back into the
troposphere, where they can be more easily diluted and ultimately removed by
settling or precipitation in the stratosphere, short wavelength ultraviolet energy is
absorbed by ozone O3 and Oxygen O2, causing the air to be heated. The resulting
temperature inversion is what causes the stratosphere to be so stable. The
troposphere and stratosphere combined account for about 99.9% of the mass of
the atmosphere. Together they extend only about 50 km above the surface of the
Earth, a distance equal to less than one percent of Earth’s radius. Since 1950s,
the most reliable sets of data show that the troposphere has warmed at a slightly
greater rate than the surface, while the stratosphere has cooled markedly since

Global Warming Chapter 2
6
1979. This agrees with the physical expectations and most model results, which
demonstrate the role of increasing greenhouse gases in tropospheric warming
and stratospheric cooling; ozone depletion also contributes substantially to
stratospheric cooling. The figure below represents a graphical explanation in
support with the discussion above.
Figure 2.1 Global Warming Data [4]

Global Warming Chapter 2
7
The top graph shows the annual global mean observed temperature represented
by the black dots along with simple fits to the data. The left hand axis shows
anomalies relative to the 1961 to 1990 average and the right hand axis shows the
estimated actual temperature in oC. Linear trend fits to the last 25 (yellow), 50
(orange), 100 (purple) and 150 years (red) are shown, and correspond to 1981 to
2005, 1956 to 2005, 1906 to 2005, and 1856 to 2005, respectively. Note that for
shorter recent periods, the slop is greater, indicating accelerated warming.
Patterns of linear global temperature trends from 1979 to 2005 estimated at the
surface (bottom left), and for the troposphere (bottom right) from the surface to
about 10 km altitude, from satellite records. Grey areas indicate incomplete data.
[2]
2.3 Factors Affecting Earth’s Climate
From a scientific prospective, the climate can be considered as a system,
and like any other system, it consists of components and there exist factors that
influence its performance. The climate system is a very complex one whose
components are very interactive. The components of the climate system include,
but not limited to, the atmosphere, land surface, snow and ice, oceans and other
bodies of water, and living things. For the most part, the atmospheric component
of the climate system characterizes the climate. As mentioned previously,
climate is defined as average weather, therefore, it could be redefined as the
mean and the variability of temperature, precipitation and wind over a period of
time, this period of time is classically known to be 30 years. The factors that
affect the climate system are in two categories; internal dynamics of the system
itself, and external factors. The external factors are called forcing and include
natural phenomena such as volcanic eruptions and solar variations, as well as
human-induced changes in atmospheric composition.

Global Warming Chapter 2
8
The climate system is dominated by the solar radiation, i.e. radiation
balance of earth. There are three main ways in which this radiation balance can
be altered; First, by changing the incoming solar radiation, such as changes in
Earth’s orbit or in the Sun itself, second, by changing the fraction of solar
radiation that is reflected called ‘albedo’, an example for that would be changes
in cloud cover, atmospheric particles or vegetation, and the third way is by
altering the long wave radiation from Earth back toward space, and one way this
could be achieved by changing the greenhouse gas concentrations.
The external factors, or the forcing, are responded via a variety of
feedback mechanisms. The response varies from factor to another and could be
either direct or indirect. These feedback mechanisms can either amplify or
diminish the effects of a change in climate forcing. If a feedback mechanism
were amplifying, it would be called a positive feedback; otherwise, it is a
negative feedback. For example, as rising concentrations of greenhouse gases
warm Earth’s climate, snow and ice begin to melt. This melting reveals darker
land and water surfaces that were beneath the snow and ice, and these darker
surfaces absorb more of the Sun’s heat, causing more warming, which causes
more melting, and so on, in a self-reinforcing cycle. This feedback loop, known
as the ‘ice-albedo feedback’, amplifies the initial warming caused by rising
levels of greenhouse gases. On the other hand, increasing on CO2 concentration
causes more radiative forcing, which would increase the Earth’s surface
temperature. As the temperature goes up, water vapor could mean more cloud
ness, and that could cause an increase in the albedo. Increasing the albedo
reduces the solar energy reaching the Earth and would tend to offset the original
warming, and this is caused a negative feedback (diminishing). Detecting,
understanding, and accurately quantifying climate feedbacks have been the focus

Global Warming Chapter 2
9
of a great deal of research by scientists unraveling the complexities of Earth’s
climate.
2.4 Greenhouse Gases Effect
The sun, as the dominant thermal energy source, radiates energy at very
short wavelengths. One third of the energy emitted by the sun gets reflected back
to the earth without losing any of its portions. However, the remaining two-thirds
of the energy is absorbed by the surface. In order to balance the absorbed
incoming energy, intuitively enough, the Earth must, on average, radiate the
same amount of energy back to space. Due to the fact that the Earth is much
colder than the Sun, the radiation from the Earth’s surface happens with longer
wavelengths than that of the Sun. Much of this thermal radiation emitted by the
land and ocean are absorbed by the atmosphere, including clouds, and reradiated
back to Earth. This is called the greenhouse effect. As a result, this warms the
surface of the planet. Without the greenhouse effect, the temperature of the Earth
would have been much colder than the freezing point of water. Thus, natural
greenhouse makes Earth livable. However, the problem arises when things go
beyond natural. Human activities, such as burning of fossil fuels and clearing of
forests, have largely intensified the greenhouse effect, causing the global
warming. Figure 2.2 shows a schematic for an idealized model of the natural
greenhouse effect [3].

Global Warming Chapter 2
10
Figure 2.2. An idealized Model of Greenhouse Effect [3]
Scientists have known about the greenhouse effect since 1824, when
Joseph Fourier calculated that the Earth would be much colder if it had no
atmosphere. This greenhouse effect is what keeps the Earth's climate livable.
Without it, the Earth's surface would be an average of about 60 degrees
Fahrenheit cooler. In 1895, the Swedish chemist Svante Arrhenius discovered
that humans could enhance the greenhouse effect by making carbon dioxide, a
greenhouse gas. He kicked off 100 years of climate research that has given a
sophisticated understanding of global warming. Levels of greenhouse gases
(GHGs) have gone up and down over the Earth's history, but they have been
fairly constant for the past few thousand years. Global average temperatures
have stayed fairly constant over that time as well, until recently. Through the

Global Warming Chapter 2
11
burning of fossil fuels and other (GHG) emissions, humans are enhancing the
greenhouse effect and warming Earth.
Scientists often use the term "climate change" instead of global warming.
This is because as the Earth's average temperature climbs, winds and ocean
currents move heat around the globe in ways that can cool some areas, warm
others, and change the amount of rain and snow falling. As a result, the climate
changes differently in different areas.
The dominant gases that make up the composition of the atmosphere are
nitrogen comprising 78% and oxygen comprising 21% of the dry atmosphere
composition. Despite their large composition percentages, they have no
greenhouse effect. The main contributors to greenhouse effect are molecules that
are more complex and much less common. Water vapor being the most
important greenhouse gas causes 36 – 70% of the greenhouse effect (not
including clouds). Carbon dioxide (CO2) is the second important greenhouse gas
that causes 9 – 26%. Methane (CH4) causes 4 – 9%, ozone 3 – 7%. Some others
naturally occurring gases contribute very small fractions of greenhouse gases
effect; one of these nitrous oxide (N2O), is increasing in concentration owing to
human activity such as agriculture. [4]
The atmospheric concentrations of CO2 and CH4 have increased by 31%
and 149% respectively since the beginning of the industrial revolution in the
mid-1700s. These levels are considerably higher than at any time during the last
650,000 years, the period for which reliable data has been extracted from ice
cores. From less direct geological evidence it is believed that CO2 values this
high were last attained 20 million years ago. Fossil fuel burning has produced
about three-quarters of the increase in CO2 from human activity over the past 20
years. Most of the rest is due to land-use change, in particular deforestation. [4]

Global Warming Chapter 2
12
The present atmospheric concentration of CO2 is about 383 parts per
million (ppm) by volume. Future CO2 levels are expected to rise due to ongoing
burning of fossil fuels and land-use change. The rate of rise will depend on
uncertain economic, sociological, technological, and natural developments, but
may be ultimately limited by the availability of fossil fuels. The
Intergovernmental Panel on Climate Change (IPCC) special report on emissions
scenarios gives a wide range of future CO2 scenarios, ranging from 541 to 970
ppm by the year 2100. Fossil fuel reserves are sufficient to reach this level and
continue emissions past 2100, if coal, tar sands or methane clathrate are
extensively used. [4]
Figure 2.3 below represents a graphical representation of the atmospheric
CO2 concentration measured in a 50 year interval. The curve in the graph is
known as the Keeling curve and is an essential piece of evidence of the man-
made increases in greenhouse gases that are believed to be the cause of global
warming (as a side note, the Keeling curve was named after Charles Keeling
who was the first person to make frequent regular measurements of the
atmospheric (CO2) concentration). [4]
The graph shows the rapid change of CO2 concentration during the
indicated time period. From the graph, two patterns could be observed; the red
curve shows the average monthly concentrations, and blue curve is a moving 12
month average that represents an annual fluctuation in CO2 levels. These
fluctuations could be attributed to the seasonal variations in carbon dioxide
uptake by land plants. Since many more forests are concentrated in the Northern
Hemisphere, more carbon dioxide is removed from the atmosphere during
Northern Hemisphere summer than Southern Hemisphere summer. [4]

Global Warming Chapter 2
13
Figure 2.3 Keeling Curve [5]
2.5 Human Activities Contribution to Climate Change
Human activities results in emissions of four principal greenhouse gases:
CO2, methane CH4, nitrous oxide N2O, and the halocarbons (a group of gases
containing fluorine, chlorine and bromine). These gases accumulate in the
atmosphere, causing concentrations to increase with time. Significant increases
in all of these gases have occurred in the industrial era. Figure 2.4 demonstrates
how the greenhouse gases have been changing over the years.

Global Warming Chapter 2
14
Figure 2.4 Greenhouse Gases Changes [7]
All of these increases are attributed to human activities.
1) CO2 has increased from fossil fuel use in transportation, building
heating and cooling and the manufacture of cement and other goods.
Deforestation releases CO2 and reduces its uptake by plants. CO2 is
also released in natural processes such as the decay of plant matter.
2) Methane has increased as a result of human activities related to
agriculture, natural gas distribution and landfills. Methane is also
released from natural processes that occur, for example, in wetlands.
Methane concentrations are not currently increasing in the atmosphere
because growth rates decreased over the last two decades.
3) Nitrous oxide is also emitted by human activities such as fertilizer use
and fossil fuel burning. Natural processes in soils and the oceans also
release N2O.

Global Warming Chapter 2
15
4) Halocarbon gas concentrations have increased primarily due to human
activities. Natural processes are also a small source. Principle
halocarbons include the chlorofluorocarbons (e.g., CFC-11 and CFC-
12), which were used extensively as refrigeration agents and in other
industrial processes before their presence in the atmosphere was found
to cause stratospheric ozone depletion. The abundance of
chlorofluorocarbon gases is decreasing as a result of international
regulations designed to protect the ozone layer.
5) Ozone is a greenhouse gas that is continually produced and destroyed
in the atmosphere by chemical reactions. In the troposphere, human
activities have increased ozone through the release of gases such as
carbon monoxide, hydrocarbons and nitrogen oxide, which chemically
react to produce ozone. As mentioned above, halocarbons released by
human activities destroy ozone in the stratosphere and have caused the
ozone hole over Antarctica.
6) Water vapor is the most abundant and important greenhouse gas in the
atmosphere. However, human activities have only a small direct
influence on the amount of atmospheric water vapor. Indirectly,
humans have the potential to affect water vapor substantially by
changing climate. For example, a warmer atmosphere contains more
water vapor. Human activities also influence water vapor through CH4
emissions, because CH4 undergoes chemical destruction in the
stratosphere, producing a small amount of water vapor.
7) Aerosols are small particles present in the atmosphere with widely
varying size, concentration and chemical composition. Some aerosols
are emitted directly into the atmosphere while others are formed from
emitted compounds. Aerosols contain both naturally occurring

Global Warming Chapter 2
16
compounds and those emitted as a result of human activities. Fossil
fuel and biomass burning have increased aerosols containing sulphure
compounds, organic compounds and black carbon (soot). Human
activities such as surface mining and industrial processes have
increased dust in the atmosphere. Natural aerosols include mineral dust
released from the surface, sea salt aerosols, biogenic emissions from
the land and oceans and sulphate and dust aerosols produced by
volcanic eruptions.
The differences in radiative forcing estimates between the present day
and the start of the industrial era for solar irradiance changes and
volcanoes are both very small compared to the differences in radiative
forcing estimated to have resulted from human activities. As a result, in
today’s atmosphere, the radiative forcing from human activities is
much more important for current and future climate change than the
estimated radiative forcing from changes in natural processes. [5]
2.6 International acts in global warming
• World Meteorological Organization (WMO): The World Meteorological
Organization is an intergovernmental organization with a membership of
188 Member States and Territories. It originated from the International
Meteorological Organization (IMO), which was founded in 1873.
Established in 1950, WMO became the specialized agency of the United
Nations for meteorology (weather and climate)
• United Nations Environment Programme (UNEP): The United Nations
Environment Programme (UNEP) was created in 1972 in order to initiate
and catalyzes environmental action and awareness at all levels of society

Global Warming Chapter 2
17
worldwide, following the United Nations Conference on the Human
Environment held in Stockholm.
• Intergovernmental Panel on Climate Change (IPCC): The
Intergovernmental Panel on Climate Change is a scientific body tasked to
evaluate the risk of climate change caused by human activity. The panel
was established in 1988 by WMO and UNEP. The IPCC has been the
main contributor to the global warming as far as studies and analyses are
concernced. The IPCC does not carry out research, nor does it monitor
climate or related phenomena. The main activity of the IPCC is publishing
special reports on topics relevant to the implementation of the UN
Framework Convection on Climate Change (UNFCCC). (The UNFCCC is
an international treaty that acknowledges the possibility of harmful
climate change; implementation of the UNFCCC led eventually to the
Kyoto Protocol.) A detailed discussion about the IPCC main roles as well
as its working groups is followed in a later section. [6]
The main activity of the IPCC, as mentioned previously, is to provide in
regular intervals Assessment Reports of the state of knowledge on climate
change. The latest one is "Climate Change 2007", the Fourth IPCC
Assessment Report that has three working groups and a task force;
The IPCC Working Group I (WG1):
It assesses the physical scientific aspects of the climate system and
climate change. Its latest report "Climate Change 2007 - The Physical
Science Basis" was launched on 2 February 2007 in Paris. The report
includes information on changes in greenhouse gases and aerosols in the
atmosphere and the extent to which they affect climate. It provides details
of recent changes in air, land and ocean temperatures, rainfall, glaciers and
ice sheets and considers a large amount of new satellite and other data that

Global Warming Chapter 2
18
have not been assessed previously. A paleoclimatic perspective considers
the Earth's past cold and warm periods and the understanding of climate
processes that can be gained from these. New information on feedbacks
arising from the interaction of climate change with the biosphere and
geochemistry is also considered. The most recent climate models are
evaluated in detail, as is their use to explain observed climate change in
terms of different driving factors. Projections of future climate change
using climate models are considered broadly and cover near term climate
change, the degree to which this is 'committed' due to past increases in
greenhouse gases, and a range of potential longer-term climate changes.
Patterns of future climate change are considered both globally and
regionally. [7]
The IPCC Working Group II (WG2):
The IPCC Working Group II assesses the vulnerability of socio-economic
and natural systems to climate change, negative and positive consequences
of climate change, and options for adapting to it. Its latest report "Climate
Change 2007 - Impacts, Adaptation and Vulnerability" was launched on 6
April 2007 in Paris. The report assesses the latest scientific, environmental
and socio-economic literature on "Impacts, Adaptation and Vulnerability".
It provides a comprehensive analysis of how climate change is affecting
natural and human systems, what the impacts will be in the future and how
far adaptation and mitigation can reduce these impacts. It also takes into
consideration the inter-relationship between adaptation and mitigation, and
the relationship between climate change and sustainable development. The
report contains chapters on specific systems and sectors (water resources;
ecosystems; food & forests; coastal systems; industry; human health) and

Global Warming Chapter 2
19
regions (Africa; Asia; Australia & New Zealand; Europe; Latin America;
North America; Polar Regions; Small Islands).[8]
The IPCC Working Group III (WG3):
The IPCC WG3 assesses options for mitigating climate change through
limiting or preventing greenhouse gas emissions and enhancing activities
that remove them from the atmosphere. Its latest report, "Climate Change
2007 - Mitigation of Climate Change" was launched on 4 May 2007 in
Bangkok. After describing the GHGs emission trends, the report analyses
mitigation options for the main economic sectors in the near-term;
between now and 2030, providing an in-depth analyses of the costs and
benefits of different approaches. It further evaluates long-term mitigation
strategies for various stabilization levels, paying special attention to
implications of different short-term strategies for achieving long-term
goals. Cross-sectorial matters such as synergies, co-benefits and trade-offs
are taken into consideration. The report, oriented at assessing the solutions
to respond to climate change, considers the policy measures and
instruments available to governments and industries to mitigate climate
change. It also addresses the significant relationship between mitigation
and sustainable development. [9]
The Task Force on National Greenhouse Gas Inventories (TFI) :
It was established by the IPCC to oversee the IPCC National Greenhouse
Gas Inventories Programme (IPCC-NGGIP). It latest Report is called
“2006 IPCC Guidelines for National Greenhouse Gas Inventories”.
Other IPCC activities:
Task Group on Data and Scenario Support for Impacts and Climate
Analysis (TGICA). The Task Group on Data and Scenario Support for
Impacts and Climate Analysis (TGICA) aims to facilitate wide availability

Global Warming Chapter 2
20
of climate change related data and scenarios for climate analysis and
impacts, adaptation, vulnerability, and mitigation research. The TGICA
does not develop itself any emission, climate, or other types of scenarios,
nor does it make any decisions regarding the choice of scenarios in the
preparation of the IPCC reports. It does not undertake any modeling or
research. The Task Group, previously called Task Group on Scenarios for
Climate and Impacts Assessment (TGCIA), was established to facilitate
co-operation between the climate modeling and climate impacts
assessment communities. One of the main activities of the TGICA is the
coordination and oversight of the IPCC Data Distribution Centre (DDC),
which provides consistent data sets such as results from climate change
experiments, i.e. data from global climate models (GCMs) produced by
different modeling centers, observed climate datasets, observed
environmental data including concentrations of CO2 and other greenhouse
gases, and socio-economic scenario information. The information
available on the DDC is accompanied by documentation and guidance
material on how the climate scenarios and baseline data can be used in
impacts and adaptation assessments. The Task Group is composed of
experts in climatology; climate modeling; physical, social, and economic
impacts; adaptation; emissions scenarios; and integrated assessment. [10]
2.7 Kyoto Protocol
The Kyoto Protocol is an agreement made under the United Nations
Framework Convection on Climate Change (UNFCCC). Countries that ratify
this protocol commit to reduce their emissions of CO2 and five other greenhouse
gases, or engage in emissions trading if they maintain or increase emissions of
these gases.
Global Warming Chapter 2
21
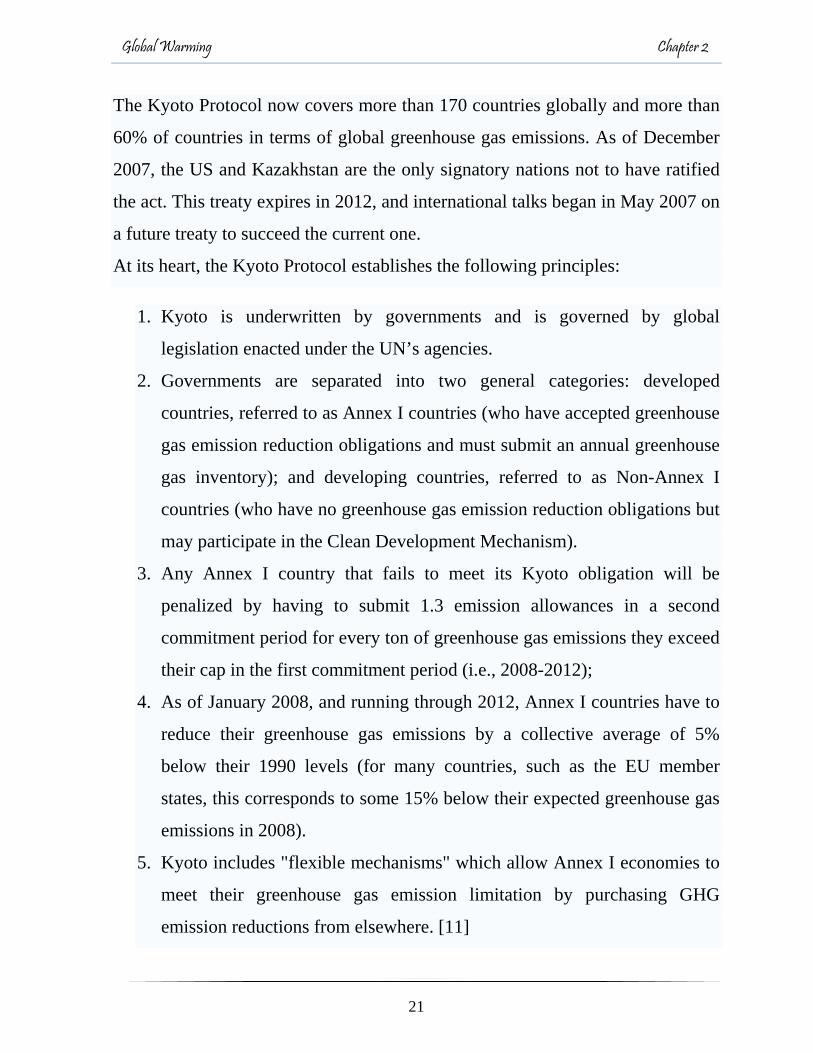
The Kyoto Protocol now covers more than 170 countries globally and more than
60% of countries in terms of global greenhouse gas emissions. As of December
2007, the US and Kazakhstan are the only signatory nations not to have ratified
the act. This treaty expires in 2012, and international talks began in May 2007 on
a future treaty to succeed the current one.
At its heart, the Kyoto Protocol establishes the following principles:
1. Kyoto is underwritten by governments and is governed by global
legislation enacted under the UN’s agencies.
2. Governments are separated into two general categories: developed
countries, referred to as Annex I countries (who have accepted greenhouse
gas emission reduction obligations and must submit an annual greenhouse
gas inventory); and developing countries, referred to as Non-Annex I
countries (who have no greenhouse gas emission reduction obligations but
may participate in the Clean Development Mechanism).
3. Any Annex I country that fails to meet its Kyoto obligation will be
penalized by having to submit 1.3 emission allowances in a second
commitment period for every ton of greenhouse gas emissions they exceed
their cap in the first commitment period (i.e., 2008-2012);
4. As of January 2008, and running through 2012, Annex I countries have to
reduce their greenhouse gas emissions by a collective average of 5%
below their 1990 levels (for many countries, such as the EU member
states, this corresponds to some 15% below their expected greenhouse gas
emissions in 2008).
5. Kyoto includes "flexible mechanisms" which allow Annex I economies to
meet their greenhouse gas emission limitation by purchasing GHG
emission reductions from elsewhere. [11]

Global Warming Chapter 2
22
2.8 Carbon Emissions Climbing
Though economic growth slowed throughout much of the world during
2001, world carbon emissions from burning fossil fuels continued to increase,
exceeding 6.5 billion tons. As a result of the consistent growth of emissions, the
atmospheric concentration of CO2 has increased from the preindustrial level of
280 parts per million (ppm) to today's 370 ppm, a 32% increase. In the last 20
years, the atmospheric concentration of CO2 has increased with a rate of 1.5 ppm
a year that has not been reached before.
In 1950, carbon emissions reached to 1.6 billion tons. By 1977, the rate
has tripled to 4.9 billion tons. In 2000, carbon emissions approached 6.5 billion
tons, a quadrupling in just 50 years. Table 2.1 and Figure 2.6 represent a
tabulated data for the carbon emissions from fossil fuel burning from 1950 until
2001 along with its accompanying graph respectively.

Global Warming Chapter 2
23
Year Million Tons of Carbon Year Million Tons of Carbon
1950 1612 1976 4776 1951 1748 1977 4910 1952 1774 1978 4962 1953 1817 1979 5249 1954 1838 1980 5177 1955 2013 1981 5004 1956 2146 1982 4959 1957 2236 1983 4942 1958 2295 1984 5113 1959 2423 1985 5274 1960 2535 1986 5436 1961 2550 1987 5558 1962 2652 1988 5774 1963 2798 1989 5879 1964 2952 1990 5939 1965 3087 1991 6025 1966 3243 1992 5922 1967 3347 1993 5914 1968 3518 1994 6050 1969 3728 1995 6182 1970 3997 1996 6327 1971 4143 1997 6419 1972 4305 1998 6401 1973 4538 1999 6366 1974 4545 2000 6480 1975 4518 2001 6553
Table 2.1. Carbon Emissions from Fossil Fuel Burning [10]

Global Warming Chapter 2
24
0
1000
2000
3000
4000
5000
6000
7000
1950 1960 1970 1980 1990 2000 2010
Years
Mill
ion
Tons
Figure 2.6 Carbon Emissions from Fossil Fuel [12]
Seventy five percent of emissions from human activities are due to the
combustion of fossil fuels; the remaining 25% is caused by changes in land use,
mainly deforestation. The consumption of Global energy is projected to rise 60%
during the next 20 years. Coal use is expected to increase by 45%, oil
consumption by 58% and natural gas by 93%, according to the U.S. Department
of Energy. Since coal consumption has actually declined by 6% since its peak in
1996, however, there is reason to believe its use will either continue to decline or
increase less than projected. However, even if coal consumption stays steady
over the next 20 years, the current level of emissions from all fossil fuels is
simply too high. The increasing use of fossil fuels will only exacerbate changes
in global climate.
According to the IPCC, by 2100, the concentrations of CO2 will be in the
range of 650 to 970 ppm— more than double or triple preindustrial levels. As
a consequence, the global average surface temperature will likely rise between
1.4 and 5.8oC between 1990 and 2100, an unprecedented rate of increase.

Global Warming Chapter 2
25
Carbon emissions are produced by possibly four major sectors; electricity
generation being responsible for the largest share contributing 42%.
Transportation generates 24% of global emissions. Industrial processes account
for 20%, and residential and commercial uses produce the remaining 14%. The
United States contributes the largest share in producing carbon emissions with
24% of the global total. China is responsible for 14%, and Russia accounts for
6%. Japan and India are each responsible for 5% of world emissions.
As a result of the increasing carbon emissions, various policy measures
have been introduced to resolve the issue. The most prominent is the Kyoto
Protocol mentioned previously. However, to be enforced, 55 countries
representing 55 percent of emissions from industrial and former Eastern bloc
nations must ratify the treaty. As of early June 2002, 74 countries responsible for
35.8 percent of global GHG emissions have ratified the protocol, including Japan
and all nations of the European Union. But with the United States and Australia
refusing to ratify, the likelihood that it will enter into force is considerably
diminished. Table 2.2 below is a list of the change in greenhouse gas emissions
from 1990 to 2004 for some countries that are part of the climate change
convention as reported by the United Nations.

Global Warming Chapter 2
26
Country
Change in
greenhouse gas
emissions (1990 -
2004) excluding
LULUCF
Change in
greenhouse gas
emissions (1990 -
2004) excluding
LULUCF
EU Assigned
Objective for
2012
Treaty
Obligation
2008 - 2012
Germany -17% -18.20% -21% -8%
Canada +27% +62.20% N/A -6%
Australia +25% +5.20% N/A +8%
Spain +49% +50.40% +15% -8%
United States +16% +21.10% N/A -7%*
Norway +10% -18.70% N/A +1%
New Zealand +21% +17.90% N/A 0%
France -0.80% -6.10% 0% -8%
Greece +27% +25.30% +25% -8%
Ireland +23% +22.70% +13% -8%
Japan +6.50% +5.20% N/A -6%
United
Kingdom -14% -14.80% -12.50% -8%
Portugal +41% +28.90% +27% -8%
EU-15 -0.80% -2.60% N/A -8%
Table 2.2. Change in Greenhouse Gas Emissions from 1990 to 2004 [10]

Global Warming Chapter 2
27
Comparing total greenhouse gas emissions in 2004 to 1990 levels, the US
emissions were up by 16%, with irregular fluctuations from one year to another
but a general trend to increase At the same time, the European Union group of 23
(EU-23) Nations had reduced their emissions by 5%. In addition, the EU-15
group of nations (a large subset of EU-23) reduced their emissions by 0.8%
between 1990 and 2004, while emission rose 2.5% from 1999 to 2004. Part of
the increases for some of the European Union countries is still in line with the
treaty, being part of the cluster of countries implementation. As of the end of
2006, the United Kingdom and Sweden were the only EU countries on pace to
meet their Kyoto emissions commitments by 2010. While United Nation
statistics indicate that, as a group, the 36 Kyoto signatory countries can meet the
5% reduction target by 2012, most of the progress in greenhouse gas reduction
has come from the stark decline in Eastern European countries' emissions after
the fall of communism in the 1990s.
Since the US did not ratify the treaty, the emissions targets are not a treaty
obligation. However, as an alternative, the United States passed an act called
"Clear Skies" that requires a decline in carbon emissions per unit of economic
output (known as carbon intensity), but not overall carbon emissions. The
disadvantage of the proposal is that economic growth cannot be achieved without
significant carbon emission increases; thus "Clear Skies" will not fundamentally
alter the U.S. emissions trajectory. The U.S. economy has consistently improved
its carbon intensity, yet emissions have continued to increase. According to the
American Council for an Energy-Efficient Economy, the carbon intensity of the
U.S. economy was cut by 17% between 1990 and 2000, yet total emissions
increased during that time by 14% due to a 39% increase in economic activity.
The Kyoto Protocol, even if implemented, is only a first step. According
to the IPCC, stabilizing atmospheric levels of CO2 at 450 ppm would require

Global Warming Chapter 2
28
fossil fuel emissions to drop below 1990 levels within a few decades, and
eventually to decline to a small fraction of current levels. Regardless of the
ultimate fate of the Kyoto Protocol, other policy initiatives show promise.
Decreasing or eliminating government subsidies to fossil fuels, which total $300
billion annually worldwide, can move the energy economy away from heavy
reliance on carbon-intensive fossil fuels. Decreasing taxes on income while
instituting or increasing carbon taxes would constructively align economic and
environmental goals. Increasing funding for further research and development of
clean energy technologies can also help move the world from a carbon-based and
toward a hydrogen-based energy system. Finally, stabilizing human population
sooner rather than later will help reduce future emissions. [12]
2.9 Global Warming Solutions
In this section, one addresses some proposed solutions to resolve the issue
of global warming. The solutions to climate change could have a significant
impact in the long run or in the short run. They are some limitations that might
hinder the implications or the usage of such solutions. These limitations include,
but not limited to, cost, economy, difficulty to implement, and results. The
solutions explained in this section are using electricity end-use efficiency, other
end-use efficiency, passenger vehicle and other transport efficiency, renewable
technologies, and most importantly Carbon Capture and Storage (CCS). If we
get started today one can tackle this problem and decrease the unpleasant
outcomes that await us if we do nothing because the cost of inaction could be
devastatingly high. [13]

Global Warming Chapter 2
29
2.9.1 Electricity end-use Efficiency
It has been repeatedly mentioned that CO2 is one of the major greenhouse
gases that causes an increase in global temperature. As previously noted,
electricity generation is responsible for about 42% of CO2 emission, the largest
share. Therefore, to start off, using electricity end-use efficiency approach would
be the first option to think when speaking about global warming solutions.
Worldwide, industry uses about 50% of all electricity and buildings
consume almost as much (45%). Technologies to significantly improve
electricity efficiency exist for virtually all buildings and industrial end-uses. For
industry, the greatest savings in electricity can often be achieved by process
changes that require less energy input to produce a final product rather than by
retrofits of existing processes. Examples of some technologies for buildings
include efficiency improvements for residential appliances, lighting, air
conditioners, heating systems, and thermal integrity of building envelopes. In the
United States, the average new refrigerator consumes half as much electricity as
a comparable refrigerator purchased twenty years ago. In Japan, the efficiency
improvement has been even greater (fourfold), primarily because the older
refrigerators were much less efficient that U.S. models. The doubling of
refrigerator efficiency in the United States was due to using foam instead of
fiberglass insulation, thicker insulation, more efficient motors and compressors,
and larger heat exchangers. [14]
2.9.2 Other end-use Efficiency
End use offers the greatest near-term potential for large increases in
efficiency and avoids GHG emissions or net reductions in GHG emissions. Some
of the technologies that could be implemented to improve other end-use

Global Warming Chapter 2
30
efficiency include solar water heating, geothermal heat pump and electro-
technologies.
2.9.3 Passenger Vehicle and Other Transport Efficiency
The most efficient machines for converting energy to rotary motion are
electric motors, as used in electric vehicles. However, electricity is not a primary
energy source so the efficiency of the electricity production has also to be taken
into account. Currently railway trains can be powered using electricity, delivered
through an additional running rail, overhead catenary system or by onboard
generators used in disel-electric locomotives as common on the UK rail network.
Pollution produced from centralised generation of electricity is emitted at a
distant power station, rather than "on site". Some railways, such as the French
SNCF and Swiss federal railways derive most, if not 100% of their current, from
hydroelectric or nuclear power stations, therefore atmospheric pollution from
their rail networks is very low. This was reflected in a study by AEA
Technology between a Eurostar train and airline journeys between London and
Paris, which showed the trains on average emitting 10 times less CO2, per
passenger, than planes, helped in part by French nuclear generation which,
however, creates its own radioactive waste which air flight does not. So only
comparing CO2 is misleading. This can be changed using more renewable
sources for electric generation. [15]
2.9.4 Renewable Energy (Fuels)
The United States currently relies heavily on coal, oil, and natural gas for
its energy. Fossil fuels are non-renewable, that is, they draw on finite resources
that will eventually dwindle, becoming too expensive or too environmentally

Global Warming Chapter 2
31
damaging to retrieve. In contrast, renewable energy resources – such as wind and
solar energy-are constantly replenished and will never run out.
Most renewable energy comes either directly or indirectly from the sun.
Sunlight, or solar energy, can be used directly for heating and lighting homes
and other building, for generating electricity, and for hot water heating, solar
cooling, and a variety of commercial and industrial uses.
The sun’s heat also drives the winds, whose energy is captured with wind
turbines. Then, the winds and the sun’s heat cause water to evaporate. When this
water vapor turns into rain or snow and flows downhill into rivers or streams, its
energy can be captured using hydroelectric power.
Along with the rain and snow, sunlight causes plants to grow. The organic
matter that makes up those plants is known as biomass. Biomass can be used to
produce electricity, transportation fuels, or chemicals. The use of biomass for
any of these purposes is called bio-energy. Hydrogen also can be found in many
organic compounds, as well as water. It’s the most abundant element on the
Earth. But it does not occur naturally as a gas. It is always combined with other
elements, such as with oxygen to make water. Once separated from another
element, hydrogen can be burned as a fuel or converted into electricity. [16]
2.9.5 Carbon capture and storage (CCS)
CCS is an approach to mitigate global warming by capturing CO2 from
large point sources such as fossil fuel power plants and storing it instead of
releasing it into the atmosphere. Technology for large scale capture of CO2 is
already commercially available and fairly well developed. CCS applied to a
modern conventional power plant could reduce CO2 emissions to the atmosphere
by approximately 80-90% compared to a plant without CCS. Capturing and
compressing CO2 requires much energy and would increase the fuel needs of a
Global Warming Chapter 2
32
plant with CCS by about 11-40%. These and other system costs are estimated to
increase the cost of energy from a new power plant with CCS by 21-91%. These
estimates apply to purpose-built plants near a storage location: applying the
technology to preexisting plants far from a storage location will be more
expensive.
Storage of the CO2 is envisaged either in deep geological formations, or in
the form of mineral carbonate. In the case of deep ocean storage, there is a risk
of greatly increasing the problem of ocean acidification, a problem that also
stems from the excess of carbon dioxide already in the atmosphere and oceans.
Geological formations are currently considered the most promising sequestration
sites, and these are estimated to have a storage capacity of at least 2000 Gt
(gigatonne) CO2 (currently, 30 Gt per year of CO2 is emitted due to human
activities). IPCC estimates that the economic potential of CCS could be between
10% and 55% of the total carbon mitigation effort until year 2100. [17]
2.10 The Cement Industry and Global Warming
Greenhouse gas emissions, especially carbon dioxide (CO2) are mainly
associated with fuel combustion and with the de-carbonation of limestone, which
in its pure form is 44 percent CO2 by weight, for these the cement industry is an
important contributor to global warming.
The cement industry is faced with the challenge of reducing the large
amounts of carbon dioxide emitted during the production of ordinary Portland
cement. Although improvements can be made to the existing process, these
would not bring about significant reductions in carbon dioxide.

Global Warming Chapter 2
33
2.10.1 Portland Cement Production Process
The cement manufacturing process involves four distinct stages, and these are
outlined below:
Step 1 - Quarrying
The raw material for cement manufacture is a rock mixture which is about
80% limestone (which is rich in CaCO3) and 20% clay or shale (a source of
silica, alumina and Fe2O3).
These are quarried and stored separately. The lime and silica provide the
main strength of the cement, while the iron reduces the reaction temperature and
gives the cement its characteristic grey color.
Step 2 - Raw material preparation
The steps involved here depend on the process used. There are two main
cement Manufacturing processes currently used: the dry process and the wet
process. The dry process uses more energy in grinding but less in the kiln and the
wet process has lower overheads than the dry process. The two processes are
discussed separately below.
The dry process:
The quarried clay and limestone are crushed separately until nothing
bigger than a tennis ball remains. Samples of both rocks are then sent off to the
laboratory for mineral analysis. If necessary, minerals are then added to either
the clay or the limestone to ensure that the correct amounts of aluminum, iron
etc. is present. The clay and limestone are then fed together into a mill where the
rock is ground until more than 85% of the material is less than 90µm in diameter.
The wet process:
The clay is mixed to a paste in a wash mill - a tank in which the clay is
pulverized in the Presence of water. Crushed lime is then added and the whole
mixture further ground. Any material which is too coarse is extracted and
Global Warming Chapter 2
34
reground. The slurry is then tested to ensure that it contains the correct balance
of minerals, and any extra ingredients blended in as necessary.
Step 3 - Clinkering
This is the step which is characteristic of Portland cement. The finely
ground material is dried, heated (to enable the sintering reactions to take place)
and then cooled down again. While it is being heated various chemical reactions
take place to form the major mineral constituents of Portland cement.
The powder from the dry process doesn't contain much moisture, so can be
dried in a pre-heater tower. As it falls through the tower (which takes 30
seconds) it is heated from 70 to 800oC. The moisture evaporates, up to 20% of
the de-carbonation (loss of CO2) occurs and some intermediate phases such as
CaO•Al2O3 begin to appear. The mixture is then fed into the kiln.
The slurry from the wet process contains too much moisture to be
successfully dried in a pre-heater tower. Instead, the slurry is fed directly into the
kiln where it is formed into dry balls by the heat and rotation of the kiln. Because
of this extra role of the kiln, wet process kilns are generally longer than dry
process kilns. The kilns used in both processes are inclined on a shallow angle
and lined with heat-resistant bricks.
Step 4 - Cement milling
To produce the final product the clinker is mixed with gypsum
(CaSO4•2H2O), which is added as a set retarded, and ground for approximately
30 minutes in large tube mills. The cement flows from the inlet to the outlet of
the mill (a rotating chamber), being first ground with 60 mm then 30 mm
diameter steel balls. The first grinding breaks up the material and the second
grind it to a fine powder. The amount of grinding is governed by the volume of
cement fed into the mill: the greater the volume the coarser the grind. This has
practical limits, with too much cement clogging up the mill and not enough

Global Warming Chapter 2
35
actually increasing the particle size. The particle size is measured by laser
diffraction analysis, and the quantity of material entering the mill adjusted
accordingly. Over time the charge (steel grinding balls) wear out, so when they
reach a certain size they fall through a sieve and then are replaced. The rotating
mill generates significant quantities of energy and water is added to both the inlet
and outlet ends of the mill to cool the product and the mill itself. [18]
2.10.2 Raw materials
Cement is a manufactured product made by blending different raw
materials and firing them at a high temperature in order to achieve prices
chemicals proportion of lime, silica, alumina and iron in the finished product,
known as cement clinker. Cement is therefore essentially a mixture of calcium
silicates and smaller amounts of calcium aluminates that react with water and
cause the cement to set.
The requirement for calcium is met by using high calcium limestone and
clay, mudstone or shale as the source of most of the silica and alumina. Finished
cement is produced by finely grinding together around 95% clinker with 5%
gypsum which helps to retard the setting time of cement.
The quality of cement clinker is directly related to the chemistry of raw
materials used around 80-90% of raw material for the kiln feed is limestone.
Clayey raw material accounts for between 10-15%, although the precise amount
will vary. Magnesium carbonate, which may be present in limestone, is the main
undesirable impurity. The level of magnesia (MgO) in the clinker should not
exceed 5% and many producers favor a maximum of 3%, this rules out dolomite
limestone for cement manufacture. Other deleterious materials include excessive
alkalis (sodium oxide, Na2O or soda and potassium oxide, K2O) witch would be
Global Warming Chapter 2
36
unacceptable because of durability problems with concrete (due to reaction of
alkalis with some siliceous aggregates to form a swelling get).
Portland cement is the most widely produced cement. The term 'Portland
cement' was created because of the presumed resemblance of the set material to
Portland stone, the well-known natural building stone. Other varieties include
rapid hardening, low heat, sulfate resisting, and low-alkali cements. In addition,
blended cements are produced by finely grinding Portland cement clinker with
other constituents, such as blast furnace slag, natural Pozzlanas, silica fume
metakaoline, siliceous fly ash, calcareous fly ash, limestone fines and shale. [19]
2.10.3 Fuels
The most commonly used fuel in the cement industry is coal (black coal
and lignite); however the lower cost of petroleum coke (pet–coke) has resulted in
increased use of this fuel type. Coal and pet–coke generate higher emissions of
greenhouse gases (GHG) than fuel oil and natural gas. In addition, high sulfur
content in the fuel (characteristic of petcock) may create problems, including
mainly sulfur buildup on rings in the kiln. Use of waste fuel as an alternative to
traditional fuel is increasingly common in the cement industry, however related
air emission concerns should be considered. Pollution abatement measures may
be necessary to ensure that no toxic emissions are generated from the firing of
waste in cements kilns. Adequate monitoring should be conducted when waste
fuels are being fired at cement plants. [20]
2.10.4 Kiln
In industrialized countries the predominant type of kiln used is the rotary
kiln, which basically consists of a tube with a diameter of up to 6 meters. The
tube is installed at an angle of 3-4O, and rotates about twice a minute to improve

Global Warming Chapter 2
37
homogenization. Raw materials are fed to the top and move towards the flame at
the bottom of the kiln. The length of short kilns can be up to 65-120m. Long
kilns can get as large as 200m (Hendricks et al., 1998). The kiln can be equipped
with a pre-heater, in which the raw meal is preheated with waste heat from the
kiln.
For new plants and major upgrades, good international practice for the
production of cement clinker involves the use of a dry process kiln with
multistage preheating and precalcination (PHP\ kilns). PHP kilns are the most
common kiln used in the cement manufacturing industry. They have the lowest
heat consumption (due to the high heat recovery from kiln gas in the cyclones,
and the low kiln heat losses), and no water to evaporate (compared to wet kiln
which uses slurry), while also offering the highest Production capacity. [20]
The aim of the zone enlargement is the extension of the material's
residence decrease the gas velocity for better heat transfer from the kiln gas to
the material. However, this causes different transportation times resulting in
irregular material passage, thus impairing the kiln's operation.
Types of rotary kilns:
a. Straight rotary kilns
b. Rotary kiln with enlarged burning zone
c. Rotary kiln with enlarged calcining zone
d. Rotary kiln with enlarged calcining and burning zone
e. Rotary kiln with enlarged drying calcining and burning zone (wet process
kiln)
f. Rotary kiln with enlarged drying or preheating zone (long dry process or
wet process kiln). [21]

Global Warming Chapter 2
38
2.10.5 Pre-heater
New developments in precalciners and preheated is important for reducing
carbon dioxide in combustion process. The pre-heater must achieve a transfer of
heat from the pyroprocessing system exhaust gases to the incoming raw meal in
preparation for the energy intensive decarbonation process to occur in the
calciner With the dynamic environmental regulations constantly becoming more
and stricter, equipment suppliers must develop combustion methods to keep pace
with the newly imposed limits. Multi-staged combustion, at least for now, offers
a relatively low cost approach to meeting the accepted emission
A type of pre-heater that is especially suitable for the dry kiln is the
suspension pre-heater, consisting of multiple preheating stages. The higher the
number of stages is, the larger the energy savings compared to a kiln without
pre-heater. An option to further reduce energy consumption is the application of
a precalciner in between the kiln and the pre-heater. The precalciner basically
consists of a separate burner chamber is dissociated before it enters the kiln. [22]
The preheated tower dominates the landscape, rising more than 200 feet.
The tower supports a series of vertical cyclone chambers through which the raw
meal passes one its way to the kiln. Hot exit gases rising from the kiln heat the
material as it swirls through the cyclones.
Some pre-heaters contain a furnace or precalciner at the bottom of the pre-
heater tower just before the kiln. Material from the last stage cyclone enters the
precalciner along with hot combustion air and fuel. As much as 95% of
calcinations-the removal of carbon dioxide from raw materials-takes place here.
From the pre-heater, the material now enters the kiln at the upper or feed
end. It slides and tumbles down the kiln through progressively hotter zones
toward the flame. Remaining carbon dioxide in the raw materials is driven off,
and the intense heat triggers other chemical reactions.
Global Warming Chapter 2
39
Low presser-loss suspension pre-heater
This suspension pre-heater uses a low pressure-loss cyclone developed to
reduce the temperature of the waste heat, and the energy required for firing by
converting NSP four-stage cyclones to five or six-stage
Conversion of a suspension pre-heater to a five-stage cyclone
Many NSP cement plants have a four-stage configuration. In this case, the
waste heat from the cement plant is recovered for waste heat power generation.
With a five-stage cyclone. [21]
Global Warming Chapter 3
40
3. Materials & Methods
3.1 Mathematical Modeling of Global Climate:
3.1.1 A Simple Global Temperature:
In order to predict future impacts of anthropogenic changes in the
environment, there is a need to develop mathematical models that explain the
past. However, it is a difficult task to come up with a good mathematical model
that demonstrates fully the climate change phenomenon and predicts the impacts
of changes in key environmental parameters. Such mathematical models range
between simple to complex calculations, three dimensional general circulation
models (GCMs), which attempt to predict climate on original, seasonal, and
annual basis. The most sophisticated to these models can take weeks to run on a
supercomputer.
The simplest starting point for modeling climate begins with models that
focus on factors influencing the single variable temperature. Obviously, other
factors such as precipitation patterns, winds and storms, ocean currents, soil
moisture, sea ice, glacial cover, and so forth, are exceedingly important, but they
are more difficult to approach with a simple model. For simplicity, the global
temperature model that will be obtained in this section is not a function of
location or time.
The average annual intensity of heat that the sun provides to the Earth, S,
was measured to be 1370 W/m2. A simple way to calculate the total rate at which
energy hits the Earth is to note that all of the flux passing through a “hoop”
having a radius equal to that of the Earth, and placed normal to the incoming
radiation, strikes the Earth’s surface. Therefore, Equation 3.1 gives the total rate
at which solar energy strikes the earth 2RSRate π= (3.1)

Global Warming Chapter 3
41
Where S is the solar constant taken to be 1370 W/m2, R is the radius of the Earth
given in meters. Out of the total of the solar energy received from the Sun, some
of it is reflected back into space (albedo), and since the reflection is assumed to
be complete, this reflected fraction of the energy does not contribute to the
heating of the Earth or its atmosphere. The fraction of the albedo is now
estimated to be 31 percent. What is not reflected is assumed to be absorbed.
Equations 3.2 and 3.3 illustrate how the reflected and absorbed energies are
calculated respectively,
απ 2 ReflectedEnergy RS= (3.2)
)1( AbsorbedEnergy 2 απ −= RS (3.3)
Where α is the Earth’s albedo.
We know that there is no heat transfer from the Earth to space by
conduction or convection; so, the only way for the Earth to get rid of energy is
by radiation. To get a complete picture of the energy balance equation, we need
to consider the rate at which the Earth sends energy back to space. For
simplicity, couple of assumptions were made to carry on deriving the
mathematical model for the energy balance equation; these assumptions are;
• The Earth is modeled as a blackbody (emissivity = 1).
• The temperature is isothermal (uniform throughout).
• Steady-state condition (Earth’s temperature is not changing with time).
For a blackbody with surface area A and absolute temperature Te, the total
rate at which radiant energy is emitted is given by the Stefan-Boltzmann law of
radiation. The law states that the rate at which an object radiates energy is
proportional to its surface area times its absolute temperature raised to the fourth
power, Equation 3.4. 424E eTRπσ= (3.4)

Global Warming Chapter 3
42
Where,
E = total blackbody emission rate (W)
σ = the Stefan-Boltzmann constant = 5.67×10⁻⁸ W/m2 K4
Te = absolute temperature (K)
At steady state, using Equations 3.3 and 3.4 to produce 3.5. 422 4)1( eTRRS πσαπ =− (3.5)
Solving Equation 3.5 for Te
( ) 41
41
⎥⎦⎤
⎢⎣⎡ −
=σαSTe (3.6)
Substituting appropriate values into Equation 3.6 yields the following absolute
temperature
( ) C 19- K 254K W/m1067.54
31.01 W/m1370 o4
1
428
2
==⎥⎦
⎤⎢⎣
⎡××
−= −eT
The actual temperature of the Earth should be 288 K. However, the mathematical
model presented above says that the temperature of the Earth is 254K.
Calculating the percentage error from Equation 3.7 yields the following
%12100288
254288100 Actual
Model- Actual Error Percentage =×−
=×= (3.7)
There is a need to find an explanation for why the Earth is fortunately not that
cold. The key factor that makes the theoretical model differ so much from reality
is that it does not account for interactions between the atmosphere and the
radiation that is emitted from the Earth’s surface. That is, it does not include the
greenhouse effect. Thus, since the actual temperature of the Earth is 288 K and
the temperature obtained from Equation 3.6 is 254 K, there for the greenhouse
effect adds 34oC of warming to the surface of the Earth.

Global Warming Chapter 3
43
3.1.2 Global Energy Balance for Climate Change:
To build on our mathematical model, let us consider the Earth, its
atmosphere, and out space as three separate regions. Normalizing energy flows
between these regions by expressing them in terms of rates per unit of surface
area of the Earth. Therefore, normalizing Equation 3.1 yields the following
22
2
W/m34244Earth of Area Surface
RadiationSolar Incoming===
SRRS
ππ (3.8)
Since the albedo is 31 percent, the amount of incoming radiation reflected back
into space per square meter of the Earth’s surface is
απ
απ44Earth of Area Surface
ReflectedEnergy Solar 2
2 SR
RS== (3.9)
22 W/m10731.0W/m342 =×=
Of this 107 W/m2, it is estimated that 77 W/m2 are reflected off the atmosphere
itself, while the remaining 30 W/m2 are reflected off the Earth’s surface. The
solar radiation that is not reflected is absorbed by the Earth and its atmosphere.
Calling that absorbed energy Qabs gives
)1(44
)1(Q 2
2
abs απ
απ−=
−=
SR
RS (3.10)
22 W/m235)31.01( W/m342 =−×=
Of that 235 W/m2, 67 W/m2 are absorbed by the atmosphere and the remaining
168 W/m2 are absorbed by the surface of the Earth.
Assuming that the global temperatures are independent on time, i.e. they
are unchanging with time, hence, the rate at which the Earth and its atmosphere
receive energy from space must be equal to the rate at which energy is being
returned to space. The 107 W/m2 of reflected energy is already balanced; that is,
107 W/m2 hits the earth/atmosphere and 107 W/m2 is reflected back into space so
this energy can be can ignored for now. The Earth and its atmosphere absorb the
remaining 235 W/m2, so the same amount must be radiated back into space. By

Global Warming Chapter 3
44
assuming the temperature of the surface is actually 254K as found by the model,
the Earth would radiate 235 W/m2, which is just enough to balance the incoming
energy. It is known, however, that greenhouse gases would absorb most of the
outgoing 235 W/m2, so the required energy would not realize. Therefore, to force
enough energy through the atmosphere to create necessary balance, the
temperature of the Earth’s surface must be higher than 254K.
If one treats the Earth as a blackbody as previously mentioned, Equation
3.4 can be used to estimate the rate at which energy is radiated from the Earth’s
surface toward the atmosphere. With the surface of Earth at 288K, it will radiate
the following amount per unit of surface area
42
42
44
Earth of Area SurfaceSurfaceby RadiatedEnergy
ss T
RTR σ
ππσ
== (3.11)
24428 W/m390)K288(KW/m1067.5 =××= −
Of the 390 2W/m , only 40 2W/m passes directly through that atmosphere, and the
remaining 350 2W/m is absorbed by greenhouse gases in the atmosphere. The
atmosphere then radiates 324 2W/m back to the surface.
There is also heat transfer from the surface to the atmosphere by
convective heating and by evaporation and condensation of water. Convection
transfers 240 2W/m to the atmosphere, while condensation of water vapor
provides 78 2W/m of latent heat. All of these energy flows are shown in Figure
3.1. If this model is internally self-consistent, the rate of energy gain should be
equal to the rate of energy loss in each of the three regions: space, the
atmosphere, and the Earth’s surface. Consider the following checks:
Rate of energy gain = Rate of energy loss
Earth’s surface: 168 + 324 + 30 = 522
78 + 24 + 30 + 390 = 522
Atmosphere: 67 + 78 + 24 + 350 = 519

Global Warming Chapter 3
45
165 + 30 + 324 = 519
Space: 107 + 165 + 30 + 40 = 342
So the model shows the necessary balances
Figure 3.1. Global Average Energy Flows between Space, the Atmosphere, and
the Earth Surface. (4)

Global Warming Chapter 3
46
3.2 Case Study: Cement industry
3.2.1 The study area
Atbara Cement Corporation:
Atbara Cement Corporation was founded in 1974 as a privately owned
corporation under the name of Atbara Portland Cement. The company is located
2.5 kilometers north of Atbara Nile Bridge, which is located east of the Nile
River, between the road that connects the two cities of Atbara and Aldamar and
between the railroads that connects the Nile river district with the capital city, the
factory under study runs and functions under the following operating condition;
1,000 tons of Portland cement per day, which is equivalent to an annual
production of 240,000 tons provided that the factory is not under normal
manufacturing and production process while undergoing maintenance and during
holidays and vacations.
3.2.2 Methods and tools used in the case study:
The cement industry being responsible for great portion of all man-made
emissions of CO2, therefore it is important to put great efforts to monitor and
decrease CO2 emissions .Energy savings and GHG emissions reductions in the
cement industry can be realized through energy-efficiency retrofits, increased
use of blended cements, substitution of fuels, use of waste heat for power
generation, and structural shifts (closing older shaft kilns and building modern
rotary kilns).
This study focus on the following issues:
Fuels
Fossil fuels used in the product from clinker represent the second largest
contribution of carbon dioxide cement from ordinary Portland, Fuels may

Global Warming Chapter 3
47
be classified as solid, liquid, or gaseous, all three are employed in cement
Industry .
Three fuels were selected for the study, because they are common used in
Sudan, and they are:
1. Heavy fuel oil
2. Coal
3. Natural gas
Kilns and Pre-heaters
The predominant type of kiln used in the cement industry is the rotary
kilns, the study focus on the dry straight rotary kilns which commonly
used. The kiln can be equipped with a pre-heater, in which the raw meal is
preheated with waste heat from the kiln. A type of pre-heater that is
especially suitable for the dry kiln is the suspension pre-heater, consisting
of multiple preheating stages, in this study five stage pre-heater will be
discuss.
Raw materials
Limestone is the essential and primary material for manufacturing and
production purposes. Its quarry located west of the Nile River and is
approximately 20 kilometers away from the western side of the river.
The dominant raw materials in Mahager Atbara for cement manufacture
are a rock mixture which is about 80% limestone (Which is rich in CaCO3)
and 20% clay or shale (a source of silica, alumina and Fe2O3).

Global Warming Chapter 3
48
3.2.3 Procedure of study:
1. Collect and gather the essential information and data about the production
of the factory, fuel types and quantity being used, and the characteristics
and properties of the raw limestone, CaCO3.
2. Using the molecular weights from the calcinations chemical equations,
calculate the amount of the carbon dioxide, CO2, resulting from the process
of calcinations in the dry rotary kiln.
CaCO3 + Heat → CaO + CO2
3. Knowing the amount of C ,calorific value and molecular weight in the
fuel, then calculate the amount of carbon dioxide, CO2, that is produced
from the combustion of the furnace fuel (the fuel that is used in the dry
rotary kiln),
4. Knowing the amount of C, calorific value and molecular weight in the
fuel, then calculate the amount of carbon dioxide, CO2 that is produced
from the combustion of the coal fuel (the alternative fuels).
5. Knowing the amount of C, calorific value and molecular weight in the
fuel, then calculate the amount of carbon dioxide, CO2 that is produced
from the combustion of the natural gas fuel, (the alternative fuels).
6. Calculate the amount of CO2 emitted from each type of fuels mentioned
above in step 3 when 5-stage-preheater is used.
7. Gather and tabulate carbon dioxide emission results for comparison.

Global Warming Chapter 4
49
4. Results & Discussions
4.1 Mathematical modeling:
Among the models investigated, it was found that, the mathematical model
developed by Gibert M. Masters. is the suitable for simulating the climate
change of the world. The assumption made of considering the world and its
atmosphere and out space as three separate regions seems to be logical.
4.2 Atbarah cement factory:
The following information was collected from Atbara cement factory
authorities:
• Production per day of Portland cement = 1000 ton.
• Production per year of Portland cement = 240,000 ton.
• Production 1 ton of cement consuming 1.6 ton of Row material.
• Concentration of calcium carbonate (CaCO3) in the raw material = 80%.
• The fuel used is the Heavy Fuel Oil = 9,800 kcal/ kg = 9,800,000 kcal /ton
and 86% of carbon.
• Production 1 ton of cement consume 1,250,000 kcal.
Assumptions made:
• Ideal combustion process during which a fuel is burnt completely.
(complete fuel combustion)
This case needs sufficient Oxygen and heat to covert all the carbon to carbon
dioxide,
• Neglect of non-significant impurities contents that has no effect on global
warming (related to air pollution)

Global Warming Chapter 4
50
• Calculation made on daily production based on 240 working day per year
taking into consideration maintenance and vacations
4.2.1Calculation of CO2 emission from calcinations:
Calculation of Carbon dioxide released during calcinations, CO2 is
released as a by-product which occurs in the upper, cooler end of the kiln, or a
precalciner, and results in the conversion of carbonates to oxides. The simplified
stoichiometric relationship is as follows:
CaCO3 + Heat → CaO + CO2
Producing 1 ton of cement need 1.6 ton of row material which contain 80%
CaCO3, that's mean the total amount of calcium carbonate is:
CaCO3 = 1.6 * 0.8 = 1.280 ton
The molecular weight
CaCO3 → CaO + CO2
CaCO3 = 100.
CaO = 56.
CO2 = 44.
From the equation
1mole of C + 1mole of O2 = 1mol CO2
Number of moles = Weight in grams/Molecular Weight.
Number of calcium carbonate moles = 1280/100 = 12.8 mole
Then:
12.8 C + 12.8 O2 = 12.8 CO2
∴ Weight of CO2 in tons per day = 12.8 * 44 = 563.2 ton/day
∴ Weight of CO2 in tons per year = 563.2 * 240 = 135168 ton/year

Global Warming Chapter 4
51
It's worth mentioning that it is hard to reduce CO2 emission from calcinations
unless reducing the quality of cement to one with less efficiency as example
blended cement
4.2.2 Calculation of CO2 emissions from combustion of fuels:
Pet-Cock Heavy Fuel
Oil Natural Gas Coal(C) % 78 86 75
H2 % 5.0 12 24 O2 % 6.0 1.0 N/A N % 1.5 1.0 1
Sulfur % 1.0 N/A N/A Ash % 8.5 N/A N/A
Volatile Particles % 3.0 N/A N/A
Table 4.1 Constituent of fuels
Combustion Equations:
C + O2 → CO2
C + O2 → CO2
2 H2 + O2 → 2H2O
N2 + 2O2 → 2NO2
S + O2 → SO2
It is noticed that carbon monoxide (CO), sulfur dioxide (SO2) and nitrogen
dioxide (NO2) are air pollutant gases and not greenhouse gases (no effect in
global warming), for that it will not be calculated and water vapor is a
greenhouse gasses but has a little generate in this case equivalents to carbon
dioxide, so the calculation will be focused on carbon dioxide (CO2).

Global Warming Chapter 4
52
One of the main processes in which carbon dioxide can be produced or
resulted is through the combustion of fuel. Fuels have different forms and they
are mainly are hydrocarbons chemical compounds. . In the combustion reaction,
a compound reacts with an oxidizing element, such as oxygen.
The chemical reaction of combustion of fuels is rather simple. It requires
the existence of oxygen with the fuel to be burned. Stated in words as follows;
Fuel + Air → Heat + Water + Carbon dioxide
• Heavy Fuel Oil (furnace)(the fuel used)
Heavy Fuel Oil (furnace) = 9,800,000 kcal/ton
Production of 1 ton of cement consume 1,250,000 kcal
That’s mean consumption of fuel per ton production calculated as
1,250,000/9,800,000 = 0.127551 ton of fuel
1000 ton production of cement per day consume
0.127551 * 1000 = 127.551 ton of fuel
Heavy fuel oil content of 86% carbon (C)
That’s mean combustion of carbon per day calculated as
127.551 * 0.86 = 109.693 ton/day
The equation of carbon combustion in fuel
C + O2 → CO2
The molecular weights are as follows:
C = 12
O2 = 32
CO2 = 44
From the equation
1mole of C + 1mole of O2 = 1mol CO2
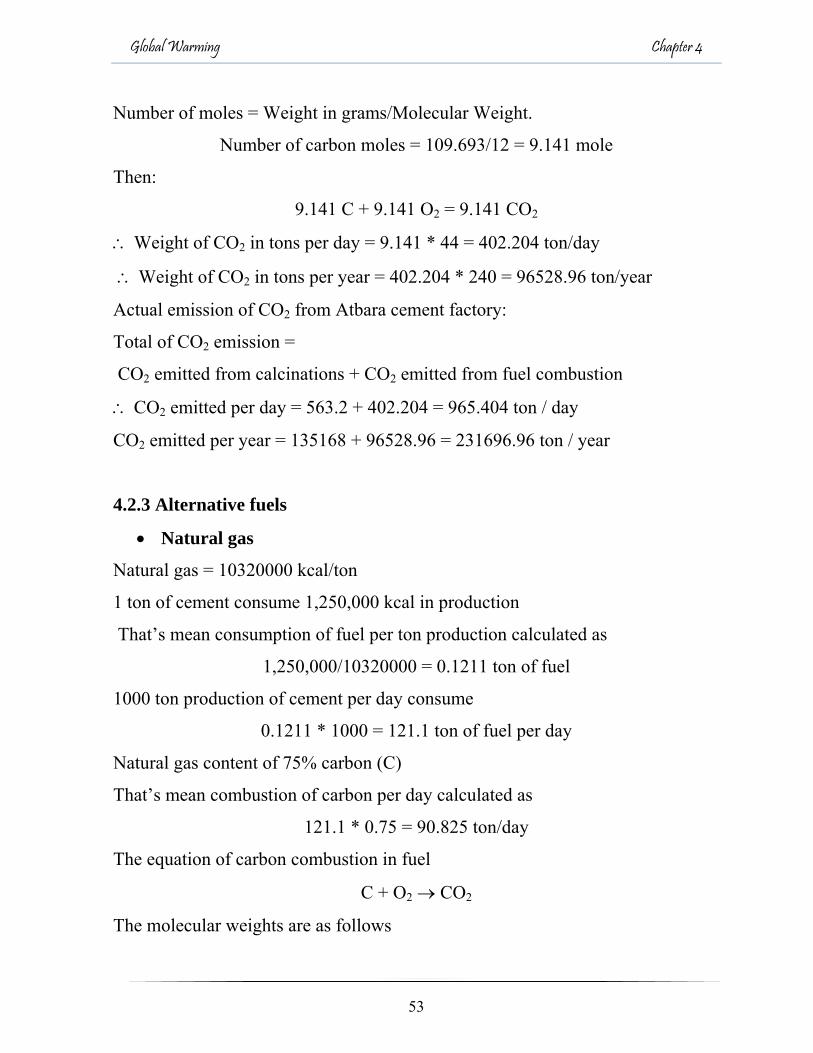
Global Warming Chapter 4
53
Number of moles = Weight in grams/Molecular Weight.
Number of carbon moles = 109.693/12 = 9.141 mole
Then:
9.141 C + 9.141 O2 = 9.141 CO2
∴ Weight of CO2 in tons per day = 9.141 * 44 = 402.204 ton/day
∴ Weight of CO2 in tons per year = 402.204 * 240 = 96528.96 ton/year
Actual emission of CO2 from Atbara cement factory:
Total of CO2 emission =
CO2 emitted from calcinations + CO2 emitted from fuel combustion
∴ CO2 emitted per day = 563.2 + 402.204 = 965.404 ton / day
CO2 emitted per year = 135168 + 96528.96 = 231696.96 ton / year
4.2.3 Alternative fuels
• Natural gas
Natural gas = 10320000 kcal/ton
1 ton of cement consume 1,250,000 kcal in production
That’s mean consumption of fuel per ton production calculated as
1,250,000/10320000 = 0.1211 ton of fuel
1000 ton production of cement per day consume
0.1211 * 1000 = 121.1 ton of fuel per day
Natural gas content of 75% carbon (C)
That’s mean combustion of carbon per day calculated as
121.1 * 0.75 = 90.825 ton/day
The equation of carbon combustion in fuel
C + O2 → CO2
The molecular weights are as follows

Global Warming Chapter 4
54
C = 12
O2 = 32
CO2 = 44
From the equation
1mole of C + 1mole of O2 = 1mol CO2
Number of moles=Weight in grams/Molecular Weight.
Number of carbon moles=90.825/12=7.568 mole
Then:
7.568 C + 7.568 O2 = 7.568 CO2
∴ Weight of CO2 in tons per day=7.568 * 44 = 332.992 ton/day
∴ Weight of CO2 in tons per year =332.992 * 240 = 79918.08 ton/year
• Petcock
Petcock = 7216000 kcal/ton
1 ton of cement consume 1,250,000 kcal in production
That’s mean consumption of fuel per ton production calculated as
1,250,000/7216000 = 0.173226 ton of fuel
1000 ton production of cement per day consume
0.173226 * 1000 = 173.226 ton of fuel
Petcock content of 78% carbon(C)
That’s mean combustion of carbon per day calculated as
173.226 * 0.78 = 135.116 ton/day
The equation of carbon combustion in fuel
C + O2 → CO2
The molecular weights are as follows
C = 12
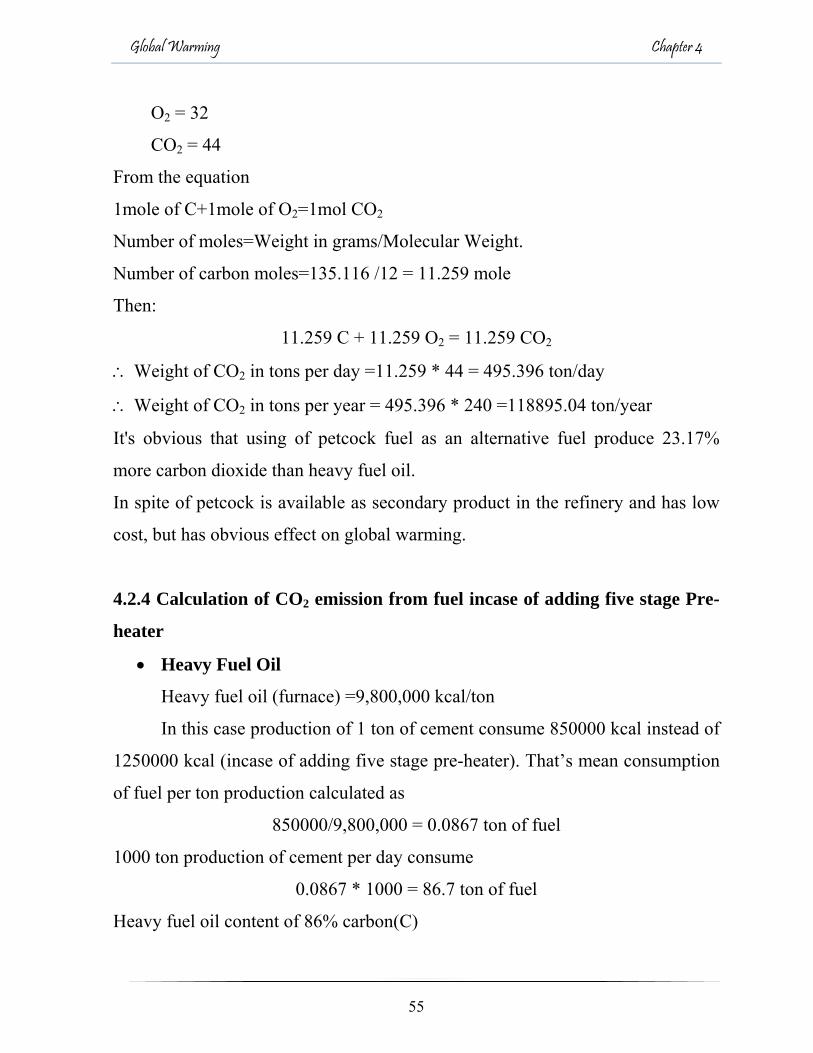
Global Warming Chapter 4
55
O2 = 32
CO2 = 44
From the equation
1mole of C+1mole of O2=1mol CO2
Number of moles=Weight in grams/Molecular Weight.
Number of carbon moles=135.116 /12 = 11.259 mole
Then:
11.259 C + 11.259 O2 = 11.259 CO2
∴ Weight of CO2 in tons per day =11.259 * 44 = 495.396 ton/day
∴ Weight of CO2 in tons per year = 495.396 * 240 =118895.04 ton/year
It's obvious that using of petcock fuel as an alternative fuel produce 23.17%
more carbon dioxide than heavy fuel oil.
In spite of petcock is available as secondary product in the refinery and has low
cost, but has obvious effect on global warming.
4.2.4 Calculation of CO2 emission from fuel incase of adding five stage Pre-
heater
• Heavy Fuel Oil
Heavy fuel oil (furnace) =9,800,000 kcal/ton
In this case production of 1 ton of cement consume 850000 kcal instead of
1250000 kcal (incase of adding five stage pre-heater). That’s mean consumption
of fuel per ton production calculated as
850000/9,800,000 = 0.0867 ton of fuel
1000 ton production of cement per day consume
0.0867 * 1000 = 86.7 ton of fuel
Heavy fuel oil content of 86% carbon(C)

Global Warming Chapter 4
56
That’s mean combustion of carbon per day calculated as
86.7 * 0.86 = 74.562 ton/day
The equation of carbon combustion in fuel
C + O2 → CO2
The molecular weights are as follows
C = 12
O2 = 32
CO2 = 44
From the equation
1mole of C+1mole of O2 = 1mol CO2Number of moles=Weight in
grams/Molecular Weight.
Number of carbon moles = 74.562/12 = 6.2135 mole
Then:
6.2135 C + 6.2135 O2 = 6.2135 CO2
∴ Weight of CO2 in tons per day = 6.2135 * 44 = 273.394 ton/day
∴ Weight of CO2 in tons per year = 273.394 * 240 = 65614.56 ton/year
• Natural Gas
Natural gas = 10320000 kcal/ton
1 ton of cement consume 850000 kcal in production (incase of adding five stage
pre-heater). That’s mean consumption of fuel per ton production calculated as
850000 /10320000 = 0.082364 ton of fuel
1000 ton production of cement per day consume
0.082364 * 1000 = 82.364 ton of fuel
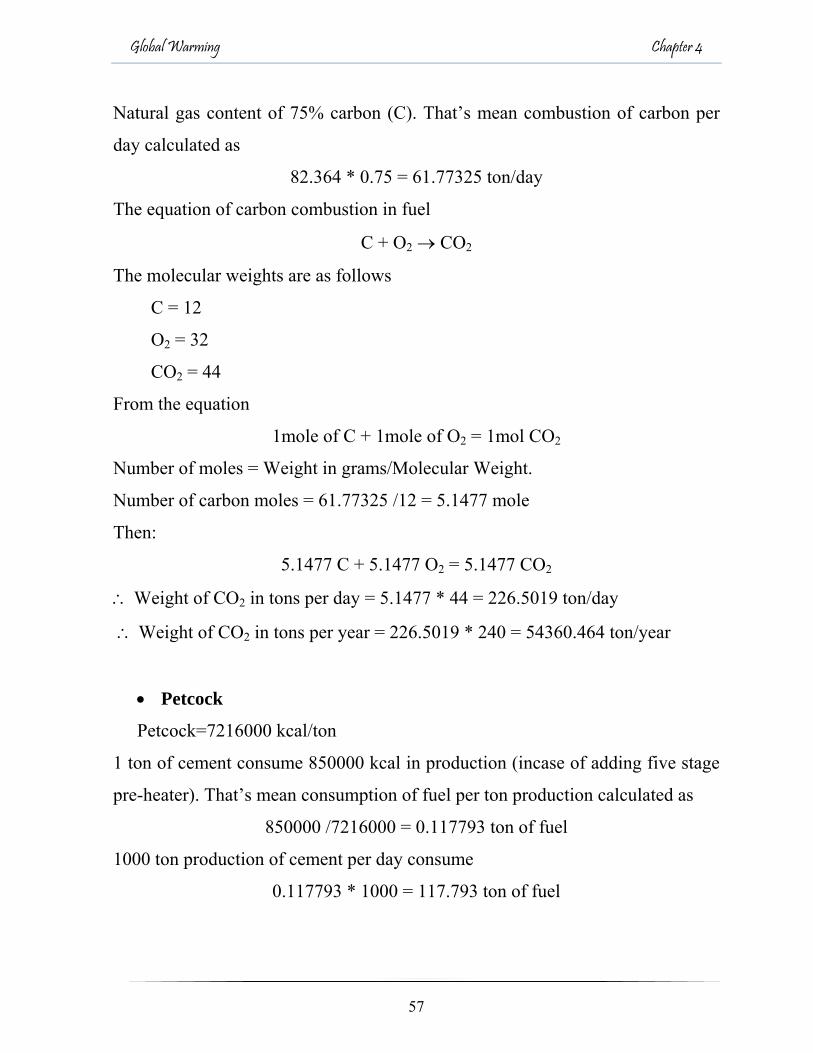
Global Warming Chapter 4
57
Natural gas content of 75% carbon (C). That’s mean combustion of carbon per
day calculated as
82.364 * 0.75 = 61.77325 ton/day
The equation of carbon combustion in fuel
C + O2 → CO2
The molecular weights are as follows
C = 12
O2 = 32
CO2 = 44
From the equation
1mole of C + 1mole of O2 = 1mol CO2
Number of moles = Weight in grams/Molecular Weight.
Number of carbon moles = 61.77325 /12 = 5.1477 mole
Then:
5.1477 C + 5.1477 O2 = 5.1477 CO2
∴ Weight of CO2 in tons per day = 5.1477 * 44 = 226.5019 ton/day
∴ Weight of CO2 in tons per year = 226.5019 * 240 = 54360.464 ton/year
• Petcock
Petcock=7216000 kcal/ton
1 ton of cement consume 850000 kcal in production (incase of adding five stage
pre-heater). That’s mean consumption of fuel per ton production calculated as
850000 /7216000 = 0.117793 ton of fuel
1000 ton production of cement per day consume
0.117793 * 1000 = 117.793 ton of fuel

Global Warming Chapter 4
58
Petcock content of 78% carbon (C). That’s mean combustion of carbon per day
calculated as
117.793 * 0.78 = 91.878 ton/day
The equation of carbon combustion in fuel
C + O2 → CO2
The molecular weights are as follows
C = 12
O2 = 32
CO2 = 44
From the equation
1mole of C + 1mole of O2 = 1mol CO2
Number of moles = Weight in grams/Molecular Weight.
Number of carbon moles = 91.878 /12 = 7.656 mole
Then:
7.656 C + 7.656 O2 = 7.656 CO2
∴ Weight of CO2 in tons per day = 7.656 * 44 = 336.887 ton/day
∴ Weight of CO2 in tons per year = 336.887 * 240 = 80853.115 ton/year
Source of CO2 Emission
CO2 Emission
without pre-heater
(ton/day)
CO2 Emission with pre-
heater (ton/day)
CO2 Emission
without pre-heater
(ton/yr)
CO2 Emission with pre-heater
(ton/yr)
Calcinations 563.200 563.200 135168.00 135168.00
Heavy Fuel Oil 402.204 273.394 96528.96 65614.56
Pet-cock 495.396 336.887 118895.04 80853.115
Natural Gas 332.992 226.502 79918.08 54360.46
Table 4.2. Comparison for Different CO2-Emitting-Sources

Global Warming Chapter 4
59
Table 4.2 shows a comparison of different CO2-emittting-sources and the
amount of CO2 each source emits when burned. The table revealed that Natural
gas is the lowest producer for CO2 which produce 32.78% less than petcock and
17.2% less than heavy fuel oil while petcock produce 18.81% CO2 more than
heavy fuel oil.
In addition to the above, it was found that adding five stages pre-heaters
reduced consumption of fuel and reduced emission of carbon dioxide to 32.02%.

Global Warming Chapter 5
60
5. Conclusions & Recommendations
5.1 Conclusions
It is important to follow the most recent international data on climate
change and to try adopting it for the case of Sudan which is huge country with
different climatic conditions. It is also important to disseminate the culture of
reducing the global warming.
As far as, cement industry is concerned it was found that:
1. Natural gas is the cleanest of all the fossil fuels discussed.
2. Total amount of CO2 emitted from calcinations and combustion equal to
965.404 ton/day and 231696.96 ton / year.
3. The amount of CO2 emitted from calcinations equal to 563.200ton/day and
135168.00 ton/year.
4. The amount of CO2 emitted from combustion of fuels equal to 402.204
ton/day and 96528.96 ton/year.
5. In case of using natural gas as an alternative fuels , CO2 emitted will be
equal to 332.992 ton/day and 79918.08 ton/year which is equivalent to
17.2% less than the one in use (heavy fuel oil).
6. Incase of using petcock as an alternative fuels, CO2 emitted will be equal
to 495.396 ton/day and 118895.04 ton/year which is equivalent to 18.81%
more than the one in use (heavy fuel oil).
7. Using five stages pre-heater the total amount of CO2 emitted from
calcinations and combustion equal to 836.594 ton/day and 200782.56 ton /
year which is equivalent to 13.34% less than the case of without using pre-
heater.
5.2 Recommendations

Global Warming Chapter 5
61
The study recommended the dissemination of global warming and climate
change culture.
To reduce the influence and contribution of cement industry to global
warming, it is recommended:
1. To add a pre-heater to kilns.
2. To use an alternative fuel (natural gas) instead of fossil fuels.
3. To develop alternative cement products, and replace Portland cement.
4. Minimize emission of CO2 through use of biofuels and absorption.

References
62
References
1. “The Physical Science Basis”, IPCC Fourth Assessment Report,
Working Group I Report, 2005.
http://www.ipcc.ch , Sunday, 17 Feb, 2008.
2. “The Physical Science Basis”, IPCC Fourth Assessment Report,
Working Group I Report, 2005.
http://www.ipcc.ch , Monday, 18 Feb, 2008.
3. http://www.ipcc.ch/pdf/assessment-report/ar4/wg1/ar4-wg1-faqs.pdf,
Saturday, 26 Jan, 2008.
4. http://en.wikipedia.org/wiki/Global_warming, Saturday, 2 Feb, 2008.
5. “The Physical Science Basis”, IPCC Fourth Assessment Report,
Working Group I Report, 2005.
http://www.ipcc.ch , Sunday, 17 Feb, 2008.
6. http://en.wikipedia.org , Sunday, 17 Feb, 2008.
7. www.ipcc.ch/ipccreports/ar4-wg1.htm, Sunday, 17 Feb, 2008.
8. www.ipcc.ch/ipccreports/ar4-wg2.htm , Sunday, 17 Feb, 2008.
9. www.ipcc.ch/ipccreports/ar4-wg3.htm , Saturday, 9 Feb, 2008.
10. www.ipcc-data.org , Wednesday, 20 Feb, 2008.
11. Climate Action Network Europe, Ratification Calendar, Retrieved
on October 30, 2006.
12. http://www.earthpolicy.org/Indicators/indicator5.htm,
Saturday, 1 Mar, 2008.
13. http://green.nationalgeographic.com/environment/global-warming/
gw-solutions.html, Saturday, 1 Mar, 2008.
14. http://www.aceee.org/pubs/i921.htm , Saturday, 1 Mar, 2008.

References
63
15. http://en.wikipedia.org/wiki/Fuel_efficiency,
http://www.transportenvironment.org/Article267.html,
Saturday, 1 Mar, 2008.
16. http://www.renewableenergyworld.com/rea/tech/home ,
Monday, 3 Mar, 2008.
17. IPCC special report on Carbon Dioxide Capture and Storage.
Prepared by working group III of the . Metz, B., O.Davidson, H. C.
de Coninck, M. Loos, and L.A. Meyer (eds.). Cambridge University
Press, Cambridge, United Kingdom and New York, NY, 2005.
http://en.wikipedia.org/wiki/Carbon_capture_and_storage#Environ
mental_effects. Monday, 3 Mar, 2008.
18. http://www.nzic.org.nz/ChemProcesses/inorganic/9B.pdf , Monday,
3 Mar, 2008.
19. The Manufacture of Portland Cement, The Cement and Concrete
Association of New Zealand; 1989.
www.mineralsuk.com/britmin/mp5_cement_latest.pdf , Monday, 18
Aug, 2008.
20. Environmental, Health, and Safety Guidelines for Cement and Lime
Manufacturing, http://www.cement.org.au/, Monday, 18 Aug, 2008.
21. Cement Data book, by Walter H. Duda, 1988.
22. (Hendricks et al, 1998).

64
APPENDIX
Attachment 1.
Carbon Emissions by Country

65
Attachment 2.

66
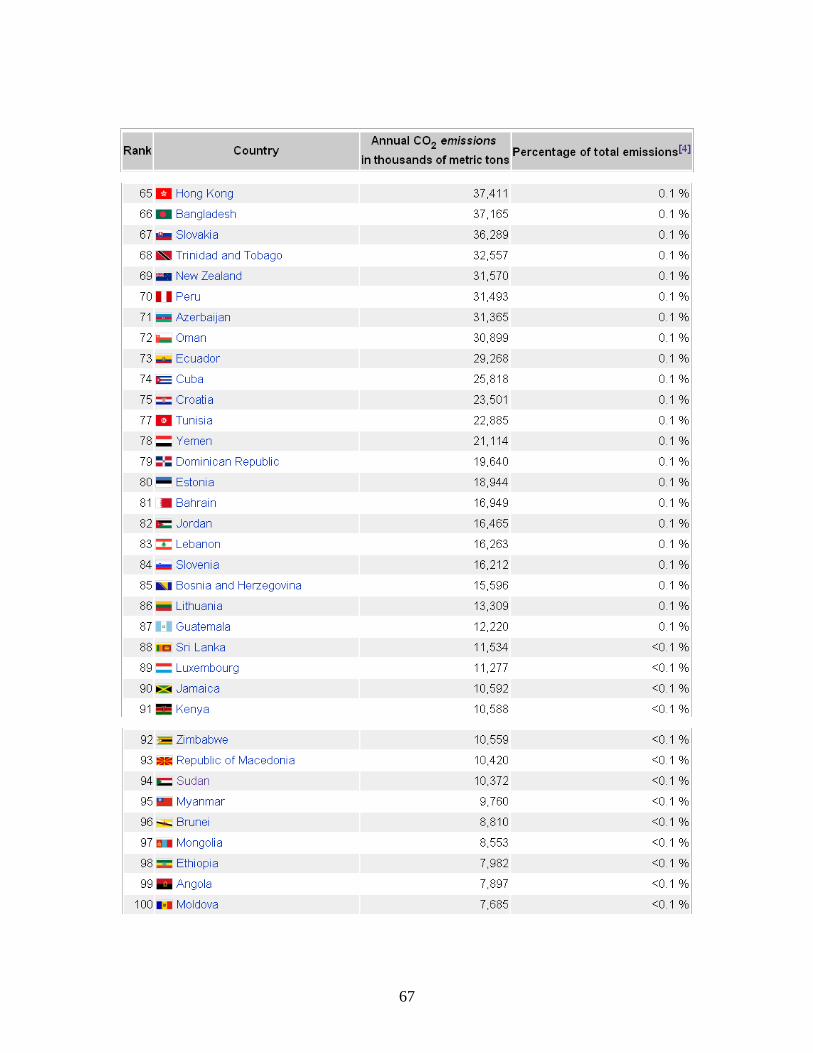
67

68

69

70

71

72
Attachment .3

73
Related Documents


