Welcome message from author
This document is posted to help you gain knowledge. Please leave a comment to let me know what you think about it! Share it to your friends and learn new things together.
Transcript
GLOBALTUBERCULOSIS
REPORT2020
Global tuberculosis report 2020
ISBN 978-92-4-001313-1 (electronic version) ISBN 978-92-4-001314-8 (print version)
© World Health Organization 2020
Some rights reserved. This work is available under the Creative Commons Attribution-NonCommercial-ShareAlike 3.0 IGO licence (CC BY-NC-SA 3.0 IGO; https://creativecommons.org/licenses/by-nc-sa/3.0/igo).
Under the terms of this licence, you may copy, redistribute and adapt the work for non-commercial purposes, provided the work is appropriately cited, as indicated below. In any use of this work, there should be no suggestion that WHO endorses any specific organization, products or services. The use of the WHO logo is not permitted. If you adapt the work, then you must license your work under the same or equivalent Creative Commons licence. If you create a translation of this work, you should add the following disclaimer along with the suggested citation: “This translation was not created by the World Health Organization (WHO). WHO is not responsible for the content or accuracy of this translation. The original English edition shall be the binding and authentic edition”.
Any mediation relating to disputes arising under the licence shall be conducted in accordance with the mediation rules of the World Intellectual Property Organization (http://www.wipo.int/amc/en/mediation/rules/).
Suggested citation. Global tuberculosis report 2020. Geneva: World Health Organization; 2020. Licence: CC BY-NC-SA 3.0 IGO.
Cataloguing-in-Publication (CIP) data. CIP data are available at http://apps.who.int/iris.
Sales, rights and licensing. To purchase WHO publications, see http://apps.who.int/bookorders. To submit requests for commercial use and queries on rights and licensing, see http://www.who.int/about/licensing.
Third-party materials. If you wish to reuse material from this work that is attributed to a third party, such as tables, figures or images, it is your responsibility to determine whether permission is needed for that reuse and to obtain permission from the copyright holder. The risk of claims resulting from infringement of any third-party-owned component in the work rests solely with the user.
General disclaimers. The designations employed and the presentation of the material in this publication do not imply the expression of any opinion whatsoever on the part of WHO concerning the legal status of any country, territory, city or area or of its authorities, or concerning the delimitation of its frontiers or boundaries. Dotted and dashed lines on maps represent approximate border lines for which there may not yet be full agreement.
The mention of specific companies or of certain manufacturers’ products does not imply that they are endorsed or recommended by WHO in preference to others of a similar nature that are not mentioned. Errors and omissions excepted, the names of proprietary products are distinguished by initial capital letters.
All reasonable precautions have been taken by WHO to verify the information contained in this publication. However, the published material is being distributed without warranty of any kind, either expressed or implied. The responsibility for the interpretation and use of the material lies with the reader. In no event shall WHO be liable for damages arising from its use.
Designed by Fiona Byrne.
Cover designed by Irwin Law.
iiiGLOBAL TUBERCULOSIS REPORT 2020
Contents
Message from the WHO Director-General vForeword viAcknowledgements viiAbbreviations xiExecutive Summary xiiiChapter 1 Introduction 1Chapter 2 Progress towards global TB targets – an overview 5Chapter 3 The COVID-19 pandemic and TB – impact and implications 15Chapter 4 TB disease burden 23Chapter 5 TB diagnosis and treatment 71Chapter 6 TB prevention services 115Chapter 7 Financing for TB prevention, diagnosis and treatment 129Chapter 8 Universal health coverage, TB determinants and multisectoral action 145Chapter 9 TB research and innovation 175
Annexes1. The WHO global TB database 1972. Lists of high-burden countries defined by WHO for the period 2016–2020 2033. Country, regional and global profiles 207

v GLOBAL TUBERCULOSIS REPORT 2020
Message from the WHO Director-General
Two years ago, the nations of the world gathered for the first United Nations (UN) high-level meeting on tuber-culosis (TB). Heads of State and other leaders made bold commitments to accelerate the response to end the world’s top infectious disease killer. Those commitments have offered hope for ending the death and
suffering of millions worldwide who are struggling with TB – a preventable and treatable disease.
This year’s World Health Organization (WHO) glob-al TB report comes at a critical time. The report provides an opportunity to reflect on progress made in the fight against TB, but also to highlight the risks that threaten to erode the gains we have made.
There is good news. The number of people treated for TB has grown since the UN high level meeting, with over 14 million people reached with TB care in 2018 and 2019. The number of people provided with TB preventive treat-ment has quadrupled since 2015, from 1 million in 2015 to over 4 million in 2019.
These are impressive achievements that we must cel-ebrate. However, equitable access to quality and timely diagnosis, prevention, treatment and care remains a chal-lenge. Accelerated action worldwide is urgently needed if we are to meet our targets by 2022.
The COVID-19 pandemic threatens to unwind the gains made over recent years. The impact of the pandemic on TB services has been severe. Data collated by WHO from high TB burden countries show sharp drops in TB notifications in 2020. Our modelling suggests that a 50% drop in TB case detection over 3 months could result in 400 000 additional TB deaths this year alone. In response, WHO is working closely with our partners and civil soci-ety to support countries in maintaining continuity of essential health services, including for TB.
COVID-19 is demonstrating that health is not only an outcome of development: it is also a prerequisite for social, economic and political stability. Although the pandemic is a setback to our efforts to achieve the Sustainable Devel-opment Goals, we cannot allow it to become an excuse for not achieving those goals. Instead, we must use it as motivation.
Dr Tedros Adhanom GhebreyesusDirector-GeneralWorld Health Organization
We are all accountable for delivering on the com-mitments we have made. But none of us can meet those commitments alone. We can only do it together. We need all hands-on-deck. That’s why WHO has developed the Global Strategy for TB Research and Innovation and the Multisectoral Accountability Framework for TB. WHO has also updated its TB policies and guidelines, and is supporting countries to adapt and use these tools to trans-late commitments into actions and to monitor, report and review progress, while engaging leaders, relevant sectors, civil society and other stakeholders.
We’re encouraged to see high-level leadership on mul-tisectoral accountability in several countries, including India, Indonesia, Pakistan, the Philippines, the Russian Federation and Viet Nam. In all, 86 countries have report-ed that a national multisectoral accountability mecha-nism for high-level review is in place.
But ending TB is not just a job for governments. Every-one has a role to play, from those in the corridors of power to those in the villages and streets where people live and die with TB.
To make sure everyone’s voice is heard, WHO estab-lished the WHO Civil Society Taskforce on TB two years ago, following the highly successful Global Ministerial Conference on Ending TB in Moscow. When we listen to the voices of people and communities affected by TB, we are reminded that ending TB is not just about ensuring access to health services. It’s also about defending human rights. As you know, TB is deeply rooted in populations where human rights and dignity are threatened. While anyone can fall ill with TB, the disease takes the heaviest toll on the most vulnerable. That is why efforts to end TB must go hand-in-hand with other efforts to reduce ine-qualities, eliminate extreme poverty, ensure social protec-tion and achieve universal health coverage.
COVID-19 has taken so much from us. But nothing can take away our shared vision to end TB.
Together, we will make that vision a reality.
GLOBAL TUBERCULOSIS REPORT 2020 vi
Foreword
This year, we are at the half-way mark for efforts to reach the 2022 targets committed to by Heads of State at the histor-ic United Nations (UN) high- level meeting on tuberculosis (TB) in 2018. The 2020 World Health Organization (WHO) global TB report showcases the progress made towards ending
the TB epidemic, and puts in stark perspective the cur-rent and potential impact of the COVID-19 pandemic, in eroding the hard-won gains of recent years.
TB remains the world’s most deadly infectious disease; it claims more than a million lives each year and affects millions more, with enormous impacts on families and communities. The report highlights the fact that TB inci-dence and deaths are falling, but not fast enough to reach global TB targets.
Globally, the annual number of people reported to have accessed TB treatment has grown from about 6 million in 2015, to 7 million in 2018 and 7.1 million in 2019. Access to TB preventive treatment has also increased, from 1 million in 2015, to 2.2 million in 2018 and 4.1 million in 2019. There is an urgent need to bolster these increas-es, to reach the 2022 targets on quality care and preven-tive treatment that were set in the political declaration of the UN high-level meeting. The political declaration targets are aligned with those of WHO’s End TB Strat-egy and the WHO Director-General’s flagship initiative ‘Find. Treat. All. #EndTB’, which is being implemented in collaboration with the Stop TB Partnership and the Global Fund to Fight AIDS, Tuberculosis and Malaria. We need to close gaps and reach the 2.9 million people with TB who are still not accessing quality care, including those with drug-resistant TB. We also need to intensify prevention efforts, and address funding gaps that impede progress in the TB response and in research.
The good news is that the WHO European Region is on track to reach the 2020 milestones of the End TB Strategy, and the African Region is making good progress towards these milestones.
Putting the spotlight on the impact of the COVID-19 pandemic on TB, this report includes data collected by WHO’s Global TB Programme that show sharp drops in TB case notifications in several high TB burden countries
Dr Tereza KasaevaDirector, WHO Global TB ProgrammeWorld Health Organization
in 2020. WHO modelling and analysis of the pandemic’s impact on TB mortality indicate that a 50% drop in the detection of TB cases over 3 months will lead to almost 400 000 more people dying from TB. We need to work together and do our best to save these lives.
The report includes an assessment of universal health coverage (UHC), social determinants and multisectoral action. TB impedes development; at the same time, pov-erty, vulnerability and other social factors fuel TB. Suc-cess depends on action across sectors; thus, it is crucial to implement WHO’s multisectoral accountability frame-work on TB. In 2019 and 2020, WHO worked with high TB burden countries to develop or strengthen account-ability mechanisms. Examples include joint reviews of national TB programmes with independent and civil society representatives, as well as support for high-level collaboration and review mechanisms, broad stakeholder forums, and head-of-state or government initiatives. In addition, WHO has worked with high TB burden coun-tries to strengthen the engagement of civil society and youth, to galvanize the TB response.
All these efforts are being led under the umbrella of UHC and WHO’s General Programme of Work, to ensure that no one is left behind.
This year’s WHO global TB report comes in tandem with the UN Secretary-General’s 2020 progress report on TB; the latter was prepared with support from WHO, as requested in the UN political declaration on TB. The over-arching message of both reports is clear. High-level com-mitments have galvanized global, regional and national progress towards ending TB, but we need urgent and more ambitious investments and actions to put the world on track to reach the targets, especially in the context of the COVID-19 pandemic.
We need to stand in solidarity. Any slackening of com-mitment and action will impede efforts to save millions of lives. I believe that, together, we can and will make a difference. It’s time for action. It’s time to End TB.
vii GLOBAL TUBERCULOSIS REPORT 2020
Acknowledgements
This global TB report was produced by a core team of 16 people: Annabel Baddeley, Marie-Christine Bar-tens, Anna Dean, Hannah Monica Dias, Dennis Falzon, Katherine Floyd, Inés Garcia Baena, Nebiat Gebreselas-sie, Philippe Glaziou, Marek Lalli, Irwin Law, Nobuyuki Nishikiori, Gita Parwati, Charalambos Sismanidis, Lana Syed and Hazim Timimi. The team was led by Katherine Floyd. Overall guidance was provided by the Director of the Global TB Programme, Tereza Kasaeva.
The data collection forms were developed by Philippe Glaziou and Hazim Timimi, with input from staff throughout the WHO Global TB Programme. Hazim Timimi led and organized all aspects of data management.
Data were reviewed by the following people at WHO headquarters: Annabel Baddeley, Marie-Christine Bar-tens, Annemieke Brands, Marzia Calvi, Anna Dean, Sas-kia den Boon, Hannah Monica Dias, Dennis Falzon, Inés Garcia Baena, Nebiat Gebreselassie, Medea Gegia, Chris-tian Gunneberg, Karina Halle, Avinash Kanchar, Alex-ei Korobitsyn, Marek Lalli, Tomáš Matas, Carl-Michael Nathanson, Linh Nguyen, Elizaveta Safronova, Lana Syed, Hazim Timimi, Eloise Valli, Sabine Verkuijl, Kerri Viney, Yi Wang and Diana Weil. Data from countries and areas in the Americas were also reviewed by the follow-ing people at the WHO regional office for the Americas: Pedro Avedillo, Oscar Bernal, Ernesto Montoro, Rafael Lopez Olarte and Keisha Westby. Andrea Pantoja (WHO consultant) and Lela Serebryakova (WHO consultant) contributed to the review of data on TB financing and Olga Tosas Auguet (WHO consultant) contributed to the review of data related to drug resistance.
Data for the European Region were collected and vali-dated jointly by the WHO Regional Office for Europe and the European Centre for Disease Prevention and Control (ECDC); we thank in particular Marlena Kaczmarek, Csaba Ködmön and Favelle Lamb from ECDC for provid-ing validated data files.
UNAIDS managed the process of data collection from national AIDS programmes and provided access to their TB/HIV dataset. Review and validation of TB/HIV data were both undertaken in collaboration with UNAIDS staff.
Many people contributed to the analyses, preparation of figures and tables, and writing required for the main chapters of the report. Unless otherwise specified, those named work in the WHO Global TB Programme.
Chapter 1 (Introduction) was written by Katherine Floyd. She also prepared Chapter 2 (Progress towards glob-al TB targets – an overview) and Chapter 3 (The COVID-19 pandemic and TB – impact and implications), with contri-
butions from Dennis Falzon, Philippe Glaziou, Irwin Law and Hazim Timimi; and the Executive Summary, with inputs from Hannah Monica Dias and Tereza Kasaeva.
Chapter 4 (TB disease burden) was prepared by Anna Dean, Peter Dodd (University of Sheffield), Katherine Floyd, Philippe Glaziou, Irwin Law and Olga Tosas Auget (WHO consultant), with contributions from Marie-Chris-tine Bartens and Marek Lalli.
Chapter 5 (TB diagnosis and treatment) was prepared by Marie-Christine Bartens, Charalambos Sismanidis and Hazim Timimi, with contributions from Annabel Badde-ley, Annemieke Brands, Hannah Monica Dias, Katherine Floyd, Philippe Glaziou, Irwin Law, Fuad Mirzayev, Lana Syed and Sabine Verkuijl.
Chapter 6 (TB prevention services) was prepared by Annabel Baddeley, Saskia den Boon, Dennis Falzon and Avinash Kanchar, with support from Katherine Floyd and Hazim Timimi.
Chapter 7 (Financing for TB prevention, diagnosis and treatment) was prepared by Inés Garcia Baena and Peter Nguhiu (Kenya Medical Research Institute), with support from Katherine Floyd and Marek Lalli.
Chapter 8 (Universal health coverage, multisec-toral action and social determinants) was prepared by Nobuyuki Nishikiori with support from Katherine Floyd and Inés Garcia Baena and contributions from Marzia Calvi, Philippe Glaziou, Tereza Kasaeva and Diana Weil. The chapter authors are grateful to staff from the national TB programmes of China, Democratic Republic of Con-go, India, Indonesia, Lao People’s Democratic Republic, Myanmar, Philippines, Russian Federation, South Africa and Viet Nam for their input to and review of boxes that feature results from national TB patient cost surveys or descriptions of the high-level mechanisms and initiatives to end TB in their countries.
Chapter 9 (TB research and innovation) was prepared by Dennis Falzon, Nebiat Gebreselassie, Nazir Ismail and Alexei Korobitsyn, with support for the writing of the chapter from Katherine Floyd.
Irwin Law coordinated the finalization of figures and tables for all chapters and subsequent review of proofs, was the focal point for communications with the graphic designer and designed the report cover.
Annex 1, which provides an overview of the WHO global TB database, was written by Hazim Timimi. Annex 2 (WHO lists of high TB burden countries) was prepared by Katherine Floyd and Annex 3 (country, regional and global profiles) was prepared by Katherine Floyd and Hazim Timimi.
GLOBAL TUBERCULOSIS REPORT 2020 viii
The preparation of the online technical appendix that explains the methods used to produce estimates of TB disease burden was led by Philippe Glaziou, with contri-butions from Peter Dodd (University of Sheffield). The online appendix that explains methods used to analyse TB financing data was prepared by Inés Garcia Baena and Peter Nguhiu.
We thank Valérie Robert in the Global TB Programme’s monitoring, evaluation and strategic information unit for impeccable administrative support; Simone Gigli, Celine Hazbun, Nicolas Jimenez and Dorothy Leonor for excel-lent information technology support; Pedro Avedillo, Yulia Bakonina, Oscar Bernal, Marek Lalli, Ernesto Montoro, Rafael Lopez Olarte, Elizaveta Safronova, Lela Serebryak-ova and Keisha Westby for translating the data collection forms and associated email requests into French, Spanish and Russian; Doris Ma Fat from the WHO Mortality and Burden of Disease team for providing data extracted from the WHO Mortality Database that were used to estimate TB mortality among HIV-negative people; and Juliana Daher and Mary Mahy (UNAIDS) for providing epide-miological data that were used to estimate HIV-associated TB incidence and mortality.
The report team is grateful to various external reviewers for their useful comments and suggestions on advanced drafts of the main chapters of the report. Particular thanks are due to Jessica Ho for her review of Chapter 4; Satvinder Singh and staff at UNAIDS for their reviews of Chapter 5 and Chapter 6; Gabriela Flores Pentzke Saint-Germain and Joe Kutzin for their reviews of Chapter 8; and Wil-
lo Brock, Gavin Churchyard, Barbara Laughon, Corinne Merle, Morten Ruhwald, Mel Spigelman, Zaid Tanvir, Vanessa Veronese, and Jennifer Woolley for their reviews of Chapter 9.
The report was edited by Hilary Cadman. The principal source of financial support for the report
was USAID. Production of the report was also supported by the governments of Japan, the Republic of Korea and the Russian Federation. We acknowledge with gratitude their support.
In addition to the core report team and those men-tioned above, the report benefited from inputs from many staff working in WHO regional and country offices and hundreds of people working for national TB programmes or within national surveillance systems who contributed to the reporting of data and to the review of report mate-rial prior to publication. These people are listed below, organized by WHO region. We thank them all for their invaluable contribution and collaboration, without which this report could not have been produced.
Among the WHO staff not already mentioned above, we thank in particular Muhammad Akhtar, Kenza Ben-nani, Vineet Bhatia, Michel Gasana, Jean Iragena, Tauhid Islam, Giorgi Kuchukhidze, Rafael López Olarte, Par-tha Pratim Mandal, Farai Mavhunga, Richard Mbumba Ngimbi, Fukushi Morishita, André Ndongosieme, Wil-fred Nkhoma, Mukta Sharma and Askar Yedilbayev for their contribution to data collection and validation, and review and clearance of report material by countries in advance of publication.
WHO staff in Regional and Country Offices
WHO African RegionMohamed Boubacar Abdel Aziz, Jean Louis Abena Foe, Inácio Alvarenga, Javier Aramburu, Claudina Augusto da Cruz, Ayodele Awe, Nayé Bah, Abdoulaye Mariama Baïssa, Marie Catherine Barouan, Mary Nana Ama Brantuo, Siriman Camara, Carolina Cardoso da Silva Leite Gomes, Eva Amelia Carvalho, Lastone Chitembo, Kokou Mawulé Davi, Ndella Diakhate, Noel Djemadji, Sithembile Dlamini-Nqeketo, Ismael Hassen Endris, Omoniyi Amos Fadare, Michel Gasana, Boingotlo Gasennelwe, Patrick Hazangwe, Khelifi Houria, Houansou Télesphore, Jean de Dieu Iragena, Bhavin Jani, Moses Jeuronlon, Mugagga Kaggwa, Kassa Ketema, Aristide Désiré Komangoya-Nzonzo, Angela Katherine Lao Seo-ane, Sharmily Lareef-Jah, Nomthandazo Lukhele, David Lukudu, Farai Mavhunga, Richard Mbumba Ngimbi, Nkateko Mkhondo, Lou Joseph Mogga, Laurent Moyenga, Jules Mugabo Semahore, Ahamada Nassuri, Andre Ndongosieme, Mkhokheli Ngwenya, Denise Nkezimana, Wilfred Nkhoma, Nicolas Nkiere, Ghislaine Nkone, Ishmael Nyasulu, Eunice Omesa, Amos Omoniyi, Hermann Ongouo, Ouldzeidoune Naceredine, Philip Patrobas Dashi, Kafui Senya, Susan Zim-ba Tembo, Simon Walusimbi, Hubert Wang, Addisalem Yilma, Assefash Zehaie.
WHO Region of the Americas Jean Seme Fils Alexandre, Pedro Avedillo, Oscar Bernal, Eldonna Boisson, Susana Borroto, Olivia Brathwaite, Beatriz Cohenca, Ingrid Garcia, Geffrard Harry, Franklin Hernandez, Rogerio da Silva Lima, Rafael Lopez Olarte, Wilmer Mar-quiño, Carlyne McKenzie, Ernesto Montoro, Romeo Montoya, Edgardo Nepo, Hortencia Peralta, Jean Marie Rwang-abwoba, Roberto Salvatella, Amy Tovar, Jorge Victoria, Keisha Westby.
WHO Eastern Mediterranean RegionJaylan Abdeen, Muhammad Akhtar, Jehan Al Badri, Ziad Aljarad, Mohammad Reza Aloudal, Novera Ansari, Yassine Aqachmar, Kenza Bennani, Alaa Hashish, Hania Husseiny, Edie Kemenang, Laeeq Ahmad Khawaja, Sara Nasr, Ghada Oraby, Alissar Rady, Osama Sharif, Ireneaus Sebit Sindani, Najib Thabit, Omid Zamani.
ixGLOBAL TUBERCULOSIS REPORT 2020
WHO European RegionCassandra Butu, Andrei Dadu, Masoud Dara, Georgii Dymov, Jamshid Gadoev, Stela Gheorghita, Gayane Ghukasyan, Aleksandr Goliusov, Ogtay Gozalov, Viatcheslav Grankov, Sayohat Hasanova, Giorgi Kuchukhidze, Nino Mamulashvili, Artan Mesi, Abdulakhad Safarov, Mahriban Seytliyeva, Mustafa Bahadir Sucakli, Javahir Suleymanova, Sona Valiyeva, Askar Yedilbayev, Saltanat Yegeubayeva, Gazmend Zhuri.
WHO South-East Asia RegionVineet Bhatia, Maria Regina Christian, Deyer Gopinath, Debashish Kundu, Partha Pratim Mandal, Mya Sapal Ngon, O Nam Ju, Ikushi Onozaki, Shushil Dev Pant, Malik Parmar, Kiran Rade, Ranjini Ramachandran, Md Kamar Rezwan, Preshila Samaraweera, Srinath Satyanarayana (WHO consultant), Mukta Sharma, Ashish Shrestha, Sabera Sultana, Lungten Zangmo Wangchuk, Kyaw Ko Ko Win.
WHO Western Pacific RegionZhongdan Chen, Serongkea Deng, Zina Fefera, Lepaitai Hansell, Tom Hiatt, Tauhid Islam, Kiyohiko Izumi, Narantuya Jadambaa, Fukushi Morishita, Kyung Hyun Oh, Anuzaya Prevdagva, Kalpeshsinh Rahevar, Richard Rehan, Jacques Sebert, Vu Quang Hieu, Rajendra-Prasad Yadav, Subhash Yadav.
National respondents who contributed to reporting and verification of data
WHO African RegionBarka Abderramane Abdelrahim, Yaw Adusi-Poku, Affolabi Dissou, Felix Kwami Afutu, Sofiane Ali Halassa, Arlindo Tomas do Amaral, Mohamed Assao Neino Mourtala, Yaya Ballayira, Ballé Boubakar, Adama Marie Bangoura, Jorge Noel Barreto, Willie Barries, Wilfried Bekou, Roxanne Boker, Frank Adae Bonsu, Régis Gothard Bopaka, Kahina Bouaziz, Miguel Camara, Newton Chagoma, Obioma Chijioke-Akaniro, Ernest Cholopray, Adjima Combary, Fatou Tiépé Couli-baly, Isaias Dambe, John Deng, Abdoulaye Diallo, Adama Diallo, Youssouf Diallo, Ambrosio Disadidi, Sicelo Dlamini, Themba Dlamini, Mohammed Fall Dogo, Antoine Etoundi Evouna, Juan Eyene Acuresila, Yakhokh Fall, Lynda Foray, Hervé Gildas Gando, Evariste Gasana, Belaineh Girma, Joshua Gitonga, Barnabe Gning, Amanuel Hadgu, Feno Her-isoa, El Hadj Malick Kane, Lordwin Kasambula, Clara Chola Kasapo, Michel Kaswa Kayomo, Mariam Keita, Mamy Kinkela, Zuweina Kondo, Jacquemin Kouakou Kouakou, Adebola Lawanson, Gertrude Lay Ofali, Taye Letta, Patrick Saili Lungu, Llang Maama, Raimundo Machava, Jocelyn Mahoumbou, Robert Kaos Majwala, Bheki Mamba, Guitouka Strédice Manguinga, Ivan Manhiça, T Mapuranga, Makhosazana Matsebula, Vincent Mbassa, Patrick Migambi, Louine Morel, Robson Mukwiza, Herbert Mutunzi, Lindiwe Mvusi, Anne Mwenye, Euphrasie Ndihokubwayo, Jacques Ndi-on-Ngandzien, Hiwet Negusse, Dubliss Nguafack Njimoh, Baba Njie, Emmanuel Nkiligi, Tendai Nkomo, Herménégilde Nzimenya, Godwin Ohisa Yosia, Franck Hardain Okemba-Okombi, Elizabeth Onyango, Violet Oramisi, Abdelhadi Oumar, Emile Rakotondramanana, Thato Joyce Raleting, Reesaul Ramprakash, Goabaone Rankgoane-Pono, Turibio Anderson Razafindranaivo, Adulai Gomes Rodrigues, Aiban Ronoh, F. Rujeedawa, Agbenyegan Samey, Charles Sandy, Kebba Sanneh, Hilarius Shilomboleni, Nicholas Siziba, Bonifacio Sousa, Albertina Martha Thomas, Abdallahi Mohamed Khairou Traore, Thusoyaone Titi Tsholofelo, Stavia Turyahabwe.
WHO Region of the AmericasAarón Aguero Zumbado, Sarita Aguirre, Shalauddin Ahmed, Edwin Aizpurua, Xochil Alemán de Cruz, Denise Araka-ki-Sanchez, Carmen Arraya Gironda, Fernando Arrieta Pessolano, Norma Artiles, Carlos Alberto Marcos Ayala Luna, Carla Alexandra Ayala Reyes, Wiedjaiprekash Balesar, Patricia Bartholomay, Donna Bascombe, Tamara Bobb, Violet Brown, Jose Calderon, Beatriz Eugenia Castillo Vizcaíno, Shawn Charles, Karolyn Chong, Eric Commiesie, Mariela Contrera, Yaren Cruz, Clara de la Cruz, Oscar Andres Cruz Martinez, Dana DaCosta Gomez, Nadia Escobar Salinas, Mercedes España Cedeño, Fernandez Hugo, Cecilia Figueroa Benites, Geovanna Clarita Alexandra Freile Gachet, Gail Gajadhar, Julio Garay Ramos, Anyeli Garcia, Claudia Gutiérrez, Dorothea Hazel-Blake, Maria Henry, Olga Joglar, Diana Khan, Adam Langer, Diana Lawrence, Andrea Lewis, Eva Lista-de Weever, Claudia Llerana Polo, Luna López Fátima Leticia, Eugène Maduro, Andrea Yvette Maldonado Saavedra, Marvin Manzanero, Belkys Marcelino, Ma. de Lourdes Martínez Olivares, Zeidy Mata Azofeifa, Angélica Medina, Mejía Andrea, Richard Milo, Leilawati Mohammed, Jeet-endra Mohanlall, Francis Morey, Morose Willy, Pilar Muñoz, Marcela Natiello, Jacquelyn Newbold, Cheryl Peek-Ball, Tomasa Portillo Esquivel, Robert Pratt, Manohar Singh Rajamanickam, Ramirez Sagastume Norma Lucrecia, Julia Rosa Maria Rios Vidal, Alisha Robb-Allen, Myrian Román, Samanta Rosas, Arelisabel Ruiz Guido, Wilmer Salazar, Samayoa Peláez Maritza, Natalia Sosa, Suarez Alvarez Lourdes, Carlos Trabado Alpizar, Michelle Trotman, Melissa Valdez, Iyan-na Wellington, Jennifer Wilson, Alesia Worgs, Oritta Zachariah.
GLOBAL TUBERCULOSIS REPORT 2020 x
WHO Eastern Mediterranean RegionIdil Abdourahim Abdillahi, Faouzi Abid, Ahmad Abu-rumman, Shahnaz Ahmadi, Rehab Ahmed, Mahmoud Al Baour, Abdullatif Al Khal, Al Saidi Fatmah, Maha Alalawi, Abeer Albalawi, Abdulbari Al-Hamadi, Nada Almarzouqi, Ebra-him Al-Romaihi, Esam Alsabery, Layth Al-Salihi, Kifah Alshaqeldi, Khalsa Al-Thuhli, Fatma Alyaquobi, Wagdy Amin, Samir Bahnasy, Aurangzaib Qaudir Baloch, Laila Bouhamidi, Imane Chelloufi, Joanne Daghfal, Driss Daoudi, Hend Farhat, Hazar Zuheir Faroun, Mohamed Furjani, Amal Galal, Assia Haissama Mohamed, Ahmed Hakawy, Dia Hjaija, Abdullah Latif, Ahmed Mankhi, Badeeha Mansoor, Nasehi Mahshid, Yassir Piro, Radia Sabouni, Kubra Sayed Naser Salman, Mohmmad Khaled Seddiq, Mohammed Sghiar, Sharafi Saeed, Ghazi Sharkas, Mousab Siddig, Hiam Yaacoub, Moinullah Zafari.
WHO European RegionElmira Dzhusupbekovna Abdrahmanova, Malik Adenov, Salihjan Alimov, Ekkehardt Altpeter, Peter Henrik Andersen, Elena Arbuzova, Trude Margrete Arnesen, Vardan Avagyan, Zaza Avaliani, Agnes Bakos, Isabel Carvalho, Viktorija Cerniseva, Aisoltan Charieva, Daniel Chemtob, Mamuka Chincharauli, Nicoleta Valentina Cioran, Andrei Corlote-anu, Valeriu Crudu, Edita Davidaviciene, Patrick de Smet, Gerard de Vries, Irène Demuth, Lanfranco Fattorini, Viktor Gasimov, Majlinda Gjocaj, Biljana Grbavcevic, Gennady Gurevich, Henrik Hansen, Laetitia Huiart, Biljana Ilievska Poposka, Sarah Jackson, Gulnora Jalilova, Aylin Jaspersen, Jerker Jonsson, Olim Kabirov, Ourania Kalkouni, Anush Khachatryan, Dmitry Klimuk Zhurkin, Larisa Korinchuk, Maria Korzeniewska-Kosela, Mitja Kosnik, Stefan Kröger, Xhevat Kurhasani, Yana Levin, Nino Lomtadze, Stevan Lucic, Wanlin Maryse, Bolot Bektashevich Maykanayev, Donika Mema, Dace Mihalovska, Ioana Munteanu, Joan O’Donnell, Analita Pace Asciak, Clara Palma Jordana, Nargiza Parpi-yeva, Victoria Petrica, Asliddin Rajabzoda, Ieva Rimsane, Gabriele Rinaldi, Elena Sacchini, Gerard Scheiden, Anita Seglina, Firuza Sharipova, Vinciane Sizaire, Erika Slump, Hanna Soini, Ivan Solovic, Sergey Sterlikov, Maja Stosic, Petra Svetina, Silva Tafaj, Sevinj Taghiyeva, Yana Terleyeva, Seher Topluoglu, Mariya Tyufekchieva, Shahnoza Usmonova, Tonka Varleva, Irina Vasilyeva, Piret Viiklepp, Valentina Vilc, Jirí Wallenfels, Stefan Wesolowski, Aysegul Yildirim, Maja Zakoska, Ljiljana Žmak.
WHO South-East Asia RegionNazis Arefin Saki, Anuj Bhattachan, Ratna Bhattarai, Mizaya Cader, Choe Kum Song, Rada Dukpa, Abdul Hameed, Fathaath Hassan, Herath Hemantha, Md. Shamiul Islam, Dushani Jayawardana, Phalin Kamolwat, Ahmadul Hasan Khan, Constantino Lopes, Endang Lukitosari, Sanjay Kumar Mattoo, Imran Pambudi, Jamyang Pema, Kuldeep Singh Sachdeva, Cho Cho San, Sharad Kumar Sharma, Wilawan Somsong, Sulistyo SKM M.Epid, Janaka Thilakarathna, Zaw Tun.
WHO Western Pacific RegionHjh Anie Haryani Hj Abd Rahman, Zirwatul Adilah Aziz, Sandy Ahoia, Paul Aia, Mohammad Fathi Alikhan, Samantha Anuntak, Uranchimeg Borgil, Amy Bright, Sarah Brown, Risa Bukbuk, Stacey Cain, Chi Kuen Chan, Kwok Chiu Chang, Thilaka Chinnayah, Phonenaly Chittamany, Chou Kuok Hei, Clément Couteaux, Alice Cuenca, Jeffery Lawrence Cutter, Enkhmandakh Danjaad, Pascale Domingue, Jack Ekiek Mayleen, Jenny Eveni, Apinelu Puafitu Faaalo, Ludovic Floury, Louise Fonua, Saipale Fuimaono, Sam Fullman, Anna Marie Celina Garfin, Donna Mae Gaviola, James Hofscneider, Laurence Holding, Edna Iavro, Mohd Ihsani bin Mahmood, Noel Itogo, Mike Kama, Seiya Kato, Lisa Kawatsu, Kim Jinsun, Phonesavanh Kommanivanh, Christine Lifuka Alopua, Leo Lim, Liza Lopez, Shepherd Machekera, Mao Tan Eang, Chima Mbakwem, Mei Jian, Serafi Moa, Binh Hoa Nguyen, Nguyen Viet Nhung, Nou Chanly, Connie Olikong, Marcelina Rabauliman, Asmah Binti Razali, Bereka Reiher, Shim Eunhye, Jane Short, Phitsada Siphanthong, Edwina Tangaroa, Annie Teannaki, Tieng Sivanna, Kazuhiro Uchimura, Tereapii Uka, Frank Underwood, Lalomilo Varea, Du Xin, Zhang Hui, Zhao Yanlin.
xiGLOBAL TUBERCULOSIS REPORT 2020
Abbreviations
AIDS acquired immunodeficiency syndromeART antiretroviral therapy BCG bacille Calmette-GuérinBPaMZ bedaquiline, pretomanid, moxifloxacin and
pyrazinamideBRICS Brazil, Russian Federation, India, China and
South AfricaCAD computer-aided detectionCB clinical breakpointCC critical concentrationCCM country coordination mechanismCDC Centers for Disease Control and Prevention
(United States) CFR case fatality ratioCHW community health workerCI confidence intervalCOR correlate of riskCORTIS Correlate of Risk Targeted Intervention
StudyCRS creditor reporting systemCV community volunteerCXR chest X-rayDAC Development Assistance Committee (OECD)DALY disability-adjusted life yearDNA deoxyribonucleic acid DST drug-susceptibility testingDTG dolutegravir EDCTP European & Developing Countries Clinical
Trials Partnership EECA Eastern Europe and Central AsiaELISA enzyme-linked immunosorbent assayELISPOT enzyme-linked immunosorbent spot assay FDA United States Food and Drug Administration FIND Foundation for Innovative New DiagnosticsGates MRI Bill & Melinda Gates Medical Research
InstituteGDG guideline development groupGDP gross domestic productGlobal Fund The Global Fund to Fight AIDS, Tuberculosis
and Malaria GTB Global TB ProgrammeHIV human immunodeficiency virusHP isoniazid and rifapentineICD-10 International Classification of Diseases (10th
edition) IFN interferonIGRA interferon gamma release assayIHME Institute for Health Metrics and EvaluationIPT isoniazid preventive treatmentIR implementation researchIU international unitsLF-LAM lateral flow lipoarabinomannan assayMAF-TB multisectoral accountability framework for
TB MAMS-TB Multi-Arm, Multi-Stage TB
MDG Millennium Development GoalMDR multidrug-resistant MDR/RR-TB multidrug-resistant TB or rifampicin-
resistant TBMDR-TB multidrug-resistant TB M:F male to female (ratio)MIC minimum inhibitory concentration MTBC Mycobacterium tuberculosis complexNAAT nucleic-acid amplification testsNGS next-generation sequencingNIAID National Institute of Allergy and Infectious
DiseasesNIH National Institutes of HealthNSP national strategic planNTP national TB programmeODA official development assistanceOECD Organisation for Economic Co-operation
and DevelopmentPanACEA Pan-African Consortium for the Evaluation
of Antituberculosis AntibioticsPBMC peripheral blood mononuclear cellPCR polymerase chain reaction pDST phenotypic drug-susceptibility testingPEPFAR President’s Emergency Plan for AIDS ReliefP:N prevalence to notification (ratio)PPD purified protein derivativePPM public–public and public–private mixRNA ribonucleic acidRR-TB rifampicin-resistant TBSANAC South Africa National AIDS Council SCI service coverage indexSDG Sustainable Development GoalSDR systematic drug reactionSRL Supranational Reference LaboratorySTREAM Standardised Treatment Regimen of Anti-TB
Drugs for Patients with MDR-TB TAG Treatment Action GroupTB tuberculosisTB Alliance Global Alliance for TB Drug DevelopmentTBTC TB Trial ConsortiumTDR Special Programme for Research and
Training in Tropical DiseasestRNA transfer ribonucleic acidTST tuberculin skin testTU tuberculin unitsUHC universal health coverageUN United NationsUNAIDS Joint United Nations Programme on HIV/
AIDSUS United StatesUSA United States of AmericaUSAID United States Agency for International
Development VR vital registrationWHO World Health Organization
TB outreach to a “floating” neighborhood near Port Moresby, Papua New Guinea.John Rae Photography
xiii GLOBAL TUBERCULOSIS REPORT 2020
Executive Summary
BackgroundTuberculosis (TB) is a communicable disease that is a major cause of ill health, one of the top 10 causes of death worldwide and the leading cause of death from a single infectious agent (ranking above HIV/AIDS). TB is caused by the bacillus Mycobacterium tuberculosis, which is spread when people who are sick with TB expel bacteria into the air; for example, by coughing. The disease typi-cally affects the lungs (pulmonary TB) but can also affect other sites (extrapulmonary TB). About a quarter of the world’s population is infected with M. tuberculosis.1
TB can affect anyone anywhere, but most people who develop the disease are adults, there are more cases among men than women, and 30 high TB burden coun-tries account for almost 90% of those who fall sick with TB each year. TB is a disease of poverty, and economic distress, vulnerability, marginalization, stigma and dis-crimination are often faced by people affected by TB.
TB is curable and preventable. About 85% of people who develop TB disease can be successfully treated with a 6-month drug regimen; treatment has the additional ben-efit of curtailing onward transmission of infection. Since 2000, TB treatment has averted more than 60 million deaths, although with access still falling short of universal health coverage (UHC), many millions have also missed out on diagnosis and care. Preventive treatment is avail-able for people with TB infection. The number of people developing infection and disease (and thus the number of deaths) can also be reduced through multisectoral action to address TB determinants such as poverty, undernutri-tion, HIV infection, smoking and diabetes.
Research breakthroughs (e.g. a new vaccine) are need-ed to rapidly reduce TB incidence worldwide to the levels already achieved in low-burden countries, where TB is often regarded as a disease of the past.
This reportThe World Health Organization (WHO) has published a global TB report every year since 1997. The purpose of the report is to provide a comprehensive and up-to-date assessment of the status of the TB epidemic, and of pro-gress in the response to the epidemic – at global, regional and country levels – in the context of global commitments and strategies. The report is based primarily on data gath-ered by WHO in annual rounds of data collection. In 2020, data were reported by 198 countries and territories that accounted for more than 99% of the world’s popula-tion and estimated number of TB cases.2
The 2020 edition complements and expands on the United Nations (UN) Secretary-General’s 2020 progress report on TB, which was prepared with WHO support as requested in the political declaration of the UN high-level meeting on TB in 2018.3
In recognition of the enormous health, social and eco-nomic impacts of the COVID-19 pandemic, the report includes a provisional assessment of how the pandemic will affect the TB epidemic, people with TB and progress towards global TB targets.
Global commitments and strategy to end TBIn 2014 and 2015, all Member States of WHO and the UN committed to ending the TB epidemic, through their adoption of WHO’s End TB Strategy and the UN Sustain-able Development Goals (SDGs). The strategy and SDGs include milestones and targets for large reductions in TB incidence, TB deaths and costs faced by TB patients and their households (Table E.1).
Efforts to step up political commitment to the fight against TB intensified in 2017 and 2018.
A WHO global ministerial conference on TB was organized in November 2017. The outcome was the Mos-cow Declaration to End TB, which was welcomed by all Member States at the World Health Assembly in May 2018.
In September 2018, the UN General Assembly held its first-ever high-level meeting on TB, attended by heads of state and government as well as other leaders. The outcome was a political declaration in which commitments to the SDGs and End TB Strategy were reaffirmed and new ones added. Global targets for the funding to be mobilized for TB prevention, care and research, and for the number of people to be treated for TB infection and disease, were set for the first time (Table E.1).4
Status of the TB epidemicGlobally, an estimated 10.0 million (range, 8.9–11.0 mil-lion)5 people fell ill with TB in 2019, a number that has been declining very slowly in recent years.
There were an estimated 1.2 million (range, 1.1–1.3 million) TB deaths among HIV-negative people in 2019 (a reduction from 1.7 million in 2000), and an addi-tional 208 000 deaths (range, 177 000–242 000)6 among HIV-positive people (a reduction from 678 000 in 2000).
Men (aged ≥15 years) accounted for 56% of the people who developed TB in 2019; women accounted for 32% and children (aged <15 years) for 12%. Among all those affect-ed, 8.2% were people living with HIV.
GLOBAL TUBERCULOSIS REPORT 2020 xiv
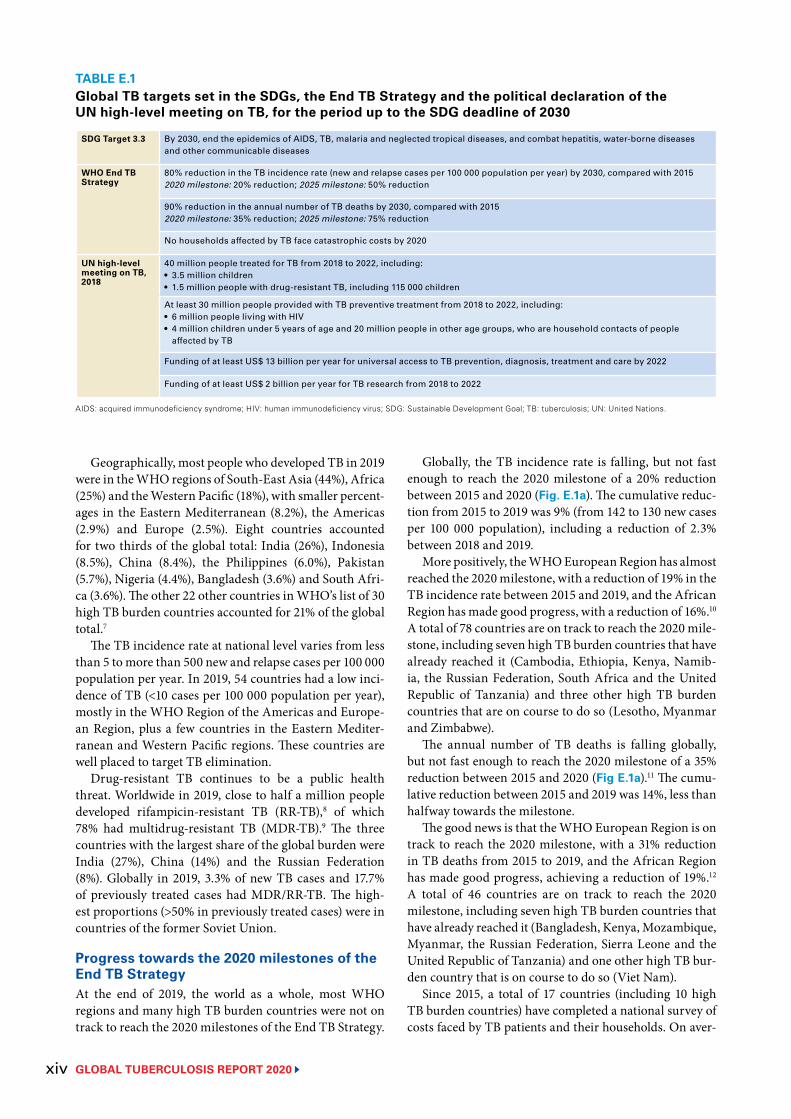
TABLE E.1Global TB targets set in the SDGs, the End TB Strategy and the political declaration of the UN high-level meeting on TB, for the period up to the SDG deadline of 2030
SDG Target 3.3 By 2030, end the epidemics of AIDS, TB, malaria and neglected tropical diseases, and combat hepatitis, water-borne diseases and other communicable diseases
WHO End TB Strategy
80% reduction in the TB incidence rate (new and relapse cases per 100 000 population per year) by 2030, compared with 2015 2020 milestone: 20% reduction; 2025 milestone: 50% reduction
90% reduction in the annual number of TB deaths by 2030, compared with 20152020 milestone: 35% reduction; 2025 milestone: 75% reduction
No households affected by TB face catastrophic costs by 2020
UN high-level meeting on TB, 2018
40 million people treated for TB from 2018 to 2022, including:• 3.5 million children• 1.5 million people with drug-resistant TB, including 115 000 children
At least 30 million people provided with TB preventive treatment from 2018 to 2022, including:• 6 million people living with HIV• 4 million children under 5 years of age and 20 million people in other age groups, who are household contacts of people
affected by TB
Funding of at least US$ 13 billion per year for universal access to TB prevention, diagnosis, treatment and care by 2022
Funding of at least US$ 2 billion per year for TB research from 2018 to 2022
AIDS: acquired immunodeficiency syndrome; HIV: human immunodeficiency virus; SDG: Sustainable Development Goal; TB: tuberculosis; UN: United Nations.
Geographically, most people who developed TB in 2019 were in the WHO regions of South-East Asia (44%), Africa (25%) and the Western Pacific (18%), with smaller percent-ages in the Eastern Mediterranean (8.2%), the Americas (2.9%) and Europe (2.5%). Eight countries accounted for two thirds of the global total: India (26%), Indonesia (8.5%), China (8.4%), the Philippines (6.0%), Pakistan (5.7%), Nigeria (4.4%), Bangladesh (3.6%) and South Afri-ca (3.6%). The other 22 other countries in WHO’s list of 30 high TB burden countries accounted for 21% of the global total.7
The TB incidence rate at national level varies from less than 5 to more than 500 new and relapse cases per 100 000 population per year. In 2019, 54 countries had a low inci-dence of TB (<10 cases per 100 000 population per year), mostly in the WHO Region of the Americas and Europe-an Region, plus a few countries in the Eastern Mediter-ranean and Western Pacific regions. These countries are well placed to target TB elimination.
Drug-resistant TB continues to be a public health threat. Worldwide in 2019, close to half a million people developed rifampicin-resistant TB (RR-TB),8 of which 78% had multidrug-resistant TB (MDR-TB).9 The three countries with the largest share of the global burden were India (27%), China (14%) and the Russian Federation (8%). Globally in 2019, 3.3% of new TB cases and 17.7% of previously treated cases had MDR/RR-TB. The high-est proportions (>50% in previously treated cases) were in countries of the former Soviet Union.
Progress towards the 2020 milestones of the End TB StrategyAt the end of 2019, the world as a whole, most WHO regions and many high TB burden countries were not on track to reach the 2020 milestones of the End TB Strategy.
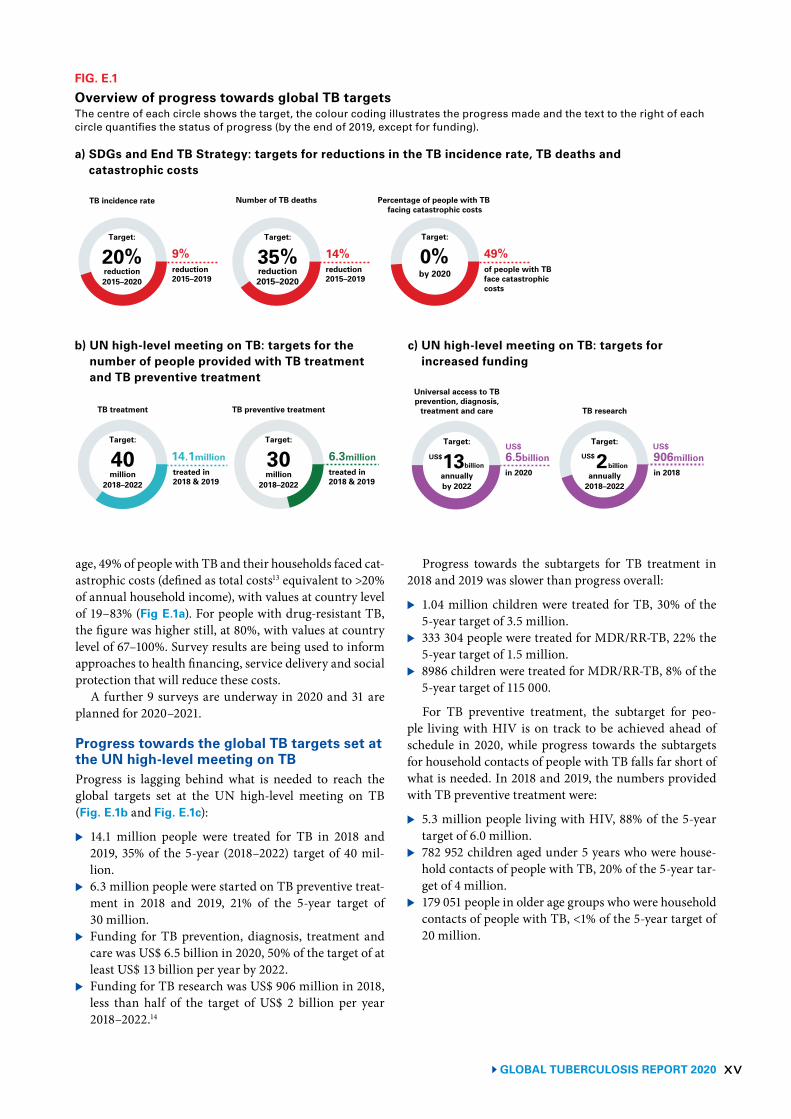
Globally, the TB incidence rate is falling, but not fast enough to reach the 2020 milestone of a 20% reduction between 2015 and 2020 (Fig. E.1a). The cumulative reduc-tion from 2015 to 2019 was 9% (from 142 to 130 new cases per 100 000 population), including a reduction of 2.3% between 2018 and 2019.
More positively, the WHO European Region has almost reached the 2020 milestone, with a reduction of 19% in the TB incidence rate between 2015 and 2019, and the African Region has made good progress, with a reduction of 16%.10 A total of 78 countries are on track to reach the 2020 mile-stone, including seven high TB burden countries that have already reached it (Cambodia, Ethiopia, Kenya, Namib-ia, the Russian Federation, South Africa and the United Republic of Tanzania) and three other high TB burden countries that are on course to do so (Lesotho, Myanmar and Zimbabwe).
The annual number of TB deaths is falling globally, but not fast enough to reach the 2020 milestone of a 35% reduction between 2015 and 2020 (Fig E.1a).11 The cumu-lative reduction between 2015 and 2019 was 14%, less than halfway towards the milestone.
The good news is that the WHO European Region is on track to reach the 2020 milestone, with a 31% reduction in TB deaths from 2015 to 2019, and the African Region has made good progress, achieving a reduction of 19%.12 A total of 46 countries are on track to reach the 2020 milestone, including seven high TB burden countries that have already reached it (Bangladesh, Kenya, Mozambique, Myanmar, the Russian Federation, Sierra Leone and the United Republic of Tanzania) and one other high TB bur-den country that is on course to do so (Viet Nam).
Since 2015, a total of 17 countries (including 10 high TB burden countries) have completed a national survey of costs faced by TB patients and their households. On aver-
xv GLOBAL TUBERCULOSIS REPORT 2020
b) UN high-level meeting on TB: targets for the number of people provided with TB treatment and TB preventive treatment
14.1million
Target:
40million
2018–2022
TB treatment
6.3million
Target:
30million
2018–2022
TB preventive treatment
treated in2018 & 2019
treated in2018 & 2019
FIG. E.1
Overview of progress towards global TB targetsThe centre of each circle shows the target, the colour coding illustrates the progress made and the text to the right of each circle quantifies the status of progress (by the end of 2019, except for funding).
c) UN high-level meeting on TB: targets for increased funding
6.5billionin 2020
906millionin 2018
Universal access to TBprevention, diagnosis,
treatment and care TB research
Target:
13annuallyby 2022
US$billion
US$ US$Target:
2annually
2018–2022
US$billion
9%Target:
20%reduction2015–2020
reduction2015–2019
TB incidence rate
Target:
35%reduction2015–2020
Number of TB deaths Percentage of people with TB facing catastrophic costs
0%Target:
by 2020
14%reduction2015–2019
49%of people with TBface catastrophiccosts
a) SDGs and End TB Strategy: targets for reductions in the TB incidence rate, TB deaths and catastrophic costs
age, 49% of people with TB and their households faced cat-astrophic costs (defined as total costs13 equivalent to >20% of annual household income), with values at country level of 19–83% (Fig E.1a). For people with drug-resistant TB, the figure was higher still, at 80%, with values at country level of 67–100%. Survey results are being used to inform approaches to health financing, service delivery and social protection that will reduce these costs.
A further 9 surveys are underway in 2020 and 31 are planned for 2020–2021.
Progress towards the global TB targets set at the UN high-level meeting on TBProgress is lagging behind what is needed to reach the global targets set at the UN high-level meeting on TB (Fig. E.1b and Fig. E.1c):
▶ 14.1 million people were treated for TB in 2018 and 2019, 35% of the 5-year (2018–2022) target of 40 mil-lion.
▶ 6.3 million people were started on TB preventive treat-ment in 2018 and 2019, 21% of the 5-year target of 30 million.
▶ Funding for TB prevention, diagnosis, treatment and care was US$ 6.5 billion in 2020, 50% of the target of at least US$ 13 billion per year by 2022.
▶ Funding for TB research was US$ 906 million in 2018, less than half of the target of US$ 2 billion per year 2018–2022.14
Progress towards the subtargets for TB treatment in 2018 and 2019 was slower than progress overall:
▶ 1.04 million children were treated for TB, 30% of the 5-year target of 3.5 million.
▶ 333 304 people were treated for MDR/RR-TB, 22% the 5-year target of 1.5 million.
▶ 8986 children were treated for MDR/RR-TB, 8% of the 5-year target of 115 000.
For TB preventive treatment, the subtarget for peo-ple living with HIV is on track to be achieved ahead of schedule in 2020, while progress towards the subtargets for household contacts of people with TB falls far short of what is needed. In 2018 and 2019, the numbers provided with TB preventive treatment were:
▶ 5.3 million people living with HIV, 88% of the 5-year target of 6.0 million.
▶ 782 952 children aged under 5 years who were house-hold contacts of people with TB, 20% of the 5-year tar-get of 4 million.
▶ 179 051 people in older age groups who were household contacts of people with TB, <1% of the 5-year target of 20 million.
GLOBAL TUBERCULOSIS REPORT 2020 xvi
The COVID-19 pandemic and TB – impact and implicationsThe COVID-19 pandemic threatens to reverse recent pro-gress in reducing the global burden of TB disease.
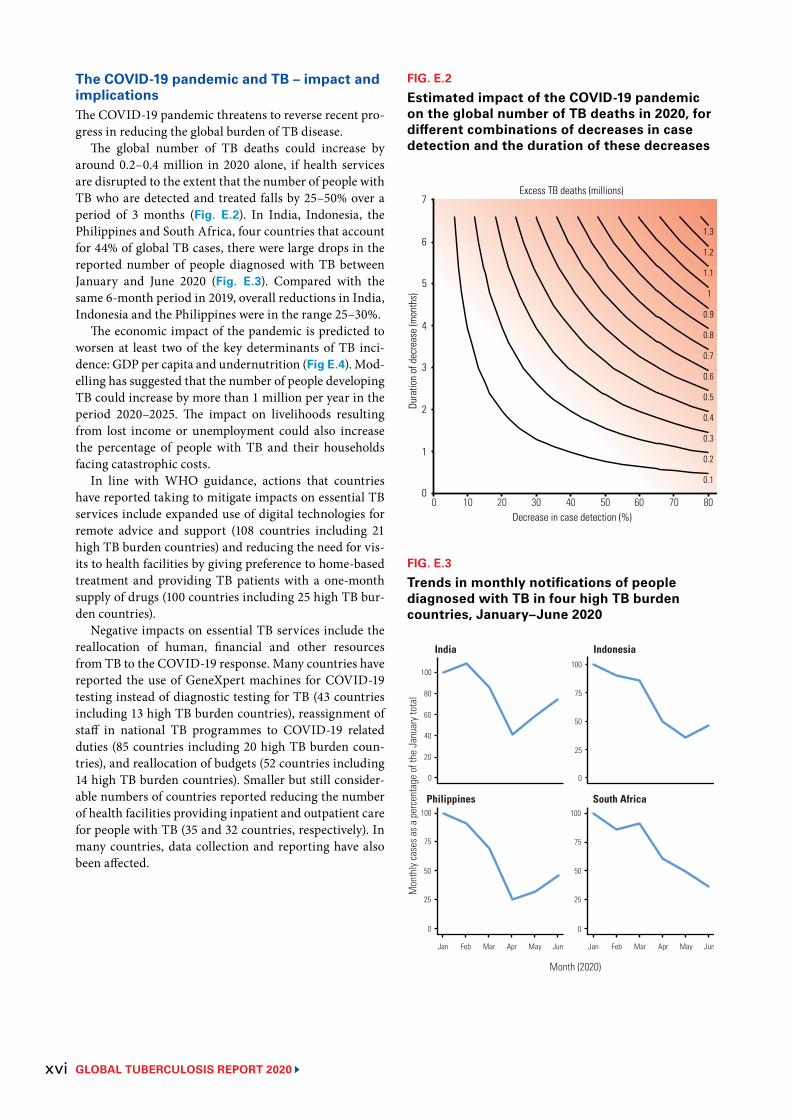
The global number of TB deaths could increase by around 0.2–0.4 million in 2020 alone, if health services are disrupted to the extent that the number of people with TB who are detected and treated falls by 25–50% over a period of 3 months (Fig. E.2). In India, Indonesia, the Philippines and South Africa, four countries that account for 44% of global TB cases, there were large drops in the reported number of people diagnosed with TB between January and June 2020 (Fig. E.3). Compared with the same 6-month period in 2019, overall reductions in India, Indonesia and the Philippines were in the range 25–30%.
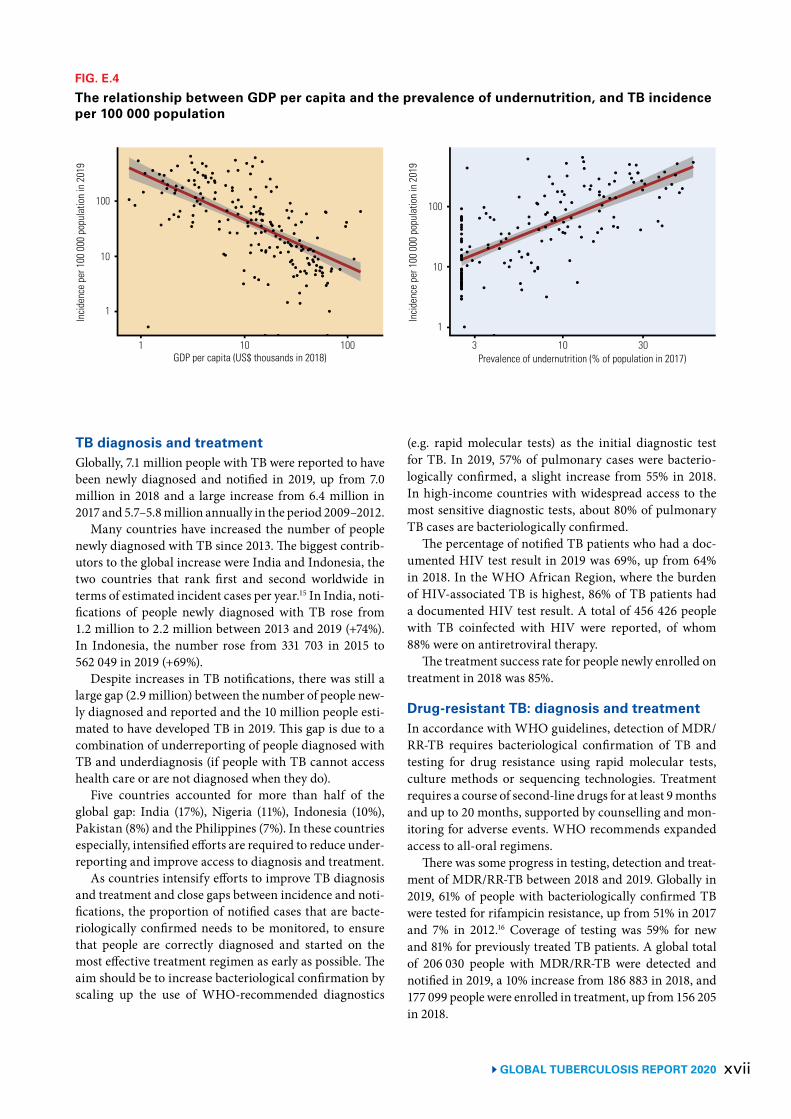
The economic impact of the pandemic is predicted to worsen at least two of the key determinants of TB inci-dence: GDP per capita and undernutrition (Fig E.4). Mod-elling has suggested that the number of people developing TB could increase by more than 1 million per year in the period 2020–2025. The impact on livelihoods resulting from lost income or unemployment could also increase the percentage of people with TB and their households facing catastrophic costs.
In line with WHO guidance, actions that countries have reported taking to mitigate impacts on essential TB services include expanded use of digital technologies for remote advice and support (108 countries including 21 high TB burden countries) and reducing the need for vis-its to health facilities by giving preference to home-based treatment and providing TB patients with a one-month supply of drugs (100 countries including 25 high TB bur-den countries).
Negative impacts on essential TB services include the reallocation of human, financial and other resources from TB to the COVID-19 response. Many countries have reported the use of GeneXpert machines for COVID-19 testing instead of diagnostic testing for TB (43 countries including 13 high TB burden countries), reassignment of staff in national TB programmes to COVID-19 related duties (85 countries including 20 high TB burden coun-tries), and reallocation of budgets (52 countries including 14 high TB burden countries). Smaller but still consider-able numbers of countries reported reducing the number of health facilities providing inpatient and outpatient care for people with TB (35 and 32 countries, respectively). In many countries, data collection and reporting have also been affected.
FIG. E.2
Estimated impact of the COVID-19 pandemic on the global number of TB deaths in 2020, for different combinations of decreases in case detection and the duration of these decreases
0.1
1
1.1
1.2
1.3
0.2
0.3
0.4
0.5
0.6
0.7
0.8
0.9
Decrease in case detection (%)
Dura
tion
of d
ecre
ase
(mon
ths)
Excess TB deaths (millions)
1
0
2
3
4
5
6
7
0 10 20 30 40 50 60 70 80
FIG. E.3
Trends in monthly notifications of people diagnosed with TB in four high TB burden countries, January–June 2020
Mon
thly
case
s as a
per
cent
age
of th
e Ja
nuar
y tot
al
Jan Feb Mar Apr May Jun Jan Feb Mar Apr May Jun
India Indonesia
Philippines South Africa
75
50
25
0
75
50
25
0
100100
75
50
25
100
0
Month (2020)
40
20
0
80
100
60
xvii GLOBAL TUBERCULOSIS REPORT 2020
FIG. E.4
The relationship between GDP per capita and the prevalence of undernutrition, and TB incidence per 100 000 population
1 10 100
10
1
100
Incid
ence
per
100
000
pop
ulat
ion
in 2
019
GDP per capita (US$ thousands in 2018) 3 10 30
10
1
100
Incid
ence
per
100
000
pop
ulat
ion
in 2
019
Prevalence of undernutrition (% of population in 2017)
TB diagnosis and treatment Globally, 7.1 million people with TB were reported to have been newly diagnosed and notified in 2019, up from 7.0 million in 2018 and a large increase from 6.4 million in 2017 and 5.7–5.8 million annually in the period 2009–2012.
Many countries have increased the number of people newly diagnosed with TB since 2013. The biggest contrib-utors to the global increase were India and Indonesia, the two countries that rank first and second worldwide in terms of estimated incident cases per year.15 In India, noti-fications of people newly diagnosed with TB rose from 1.2 million to 2.2 million between 2013 and 2019 (+74%). In Indonesia, the number rose from 331 703 in 2015 to 562 049 in 2019 (+69%).
Despite increases in TB notifications, there was still a large gap (2.9 million) between the number of people new-ly diagnosed and reported and the 10 million people esti-mated to have developed TB in 2019. This gap is due to a combination of underreporting of people diagnosed with TB and underdiagnosis (if people with TB cannot access health care or are not diagnosed when they do).
Five countries accounted for more than half of the global gap: India (17%), Nigeria (11%), Indonesia (10%), Pakistan (8%) and the Philippines (7%). In these countries especially, intensified efforts are required to reduce under-reporting and improve access to diagnosis and treatment.
As countries intensify efforts to improve TB diagnosis and treatment and close gaps between incidence and noti-fications, the proportion of notified cases that are bacte-riologically confirmed needs to be monitored, to ensure that people are correctly diagnosed and started on the most effective treatment regimen as early as possible. The aim should be to increase bacteriological confirmation by scaling up the use of WHO-recommended diagnostics
(e.g. rapid molecular tests) as the initial diagnostic test for TB. In 2019, 57% of pulmonary cases were bacterio-logically confirmed, a slight increase from 55% in 2018. In high-income countries with widespread access to the most sensitive diagnostic tests, about 80% of pulmonary TB cases are bacteriologically confirmed.
The percentage of notified TB patients who had a doc-umented HIV test result in 2019 was 69%, up from 64% in 2018. In the WHO African Region, where the burden of HIV-associated TB is highest, 86% of TB patients had a documented HIV test result. A total of 456 426 people with TB coinfected with HIV were reported, of whom 88% were on antiretroviral therapy.
The treatment success rate for people newly enrolled on treatment in 2018 was 85%.
Drug-resistant TB: diagnosis and treatmentIn accordance with WHO guidelines, detection of MDR/RR-TB requires bacteriological confirmation of TB and testing for drug resistance using rapid molecular tests, culture methods or sequencing technologies. Treatment requires a course of second-line drugs for at least 9 months and up to 20 months, supported by counselling and mon-itoring for adverse events. WHO recommends expanded access to all-oral regimens.
There was some progress in testing, detection and treat-ment of MDR/RR-TB between 2018 and 2019. Globally in 2019, 61% of people with bacteriologically confirmed TB were tested for rifampicin resistance, up from 51% in 2017 and 7% in 2012.16 Coverage of testing was 59% for new and 81% for previously treated TB patients. A global total of 206 030 people with MDR/RR-TB were detected and notified in 2019, a 10% increase from 186 883 in 2018, and 177 099 people were enrolled in treatment, up from 156 205 in 2018.
GLOBAL TUBERCULOSIS REPORT 2020 xviii
Despite these improvements, the number of people enrolled in treatment in 2019 was equivalent to only 38% of the estimated number of people who developed MDR/RR-TB in 2019. Closing this wide gap requires one or more of the following: improving detection of TB; increasing bacteriological confirmation among those diagnosed with TB; expanding the coverage of testing for drug resistance among those with bacteriologically confirmed TB; and ensuring that all those diagnosed with MDR/RR-TB are enrolled in treatment.
Ten countries accounted for 77% of the global gap between treatment enrolments and the estimated number of new cases of MDR/RR-TB in 2019, and thus will have a strong influence on progress in closing this gap. China and India accounted for 41% of the global gap.17
The latest treatment outcome data for people with MDR/RR-TB show a global treatment success rate of 57%. Three examples of high MDR-TB burden countries with relatively high TB treatment coverage that have higher treatment success rates for MDR/RR-TB (≥75%) are Ethi-opia, Kazakhstan and Myanmar.
TB prevention servicesThe main health care intervention available to reduce the risk of TB infection progressing to active TB disease is TB preventive treatment.18 Other interventions are TB infec-tion prevention and control; and vaccination of children with the bacille Calmette–Guérin (BCG) vaccine, which can confer protection, especially from severe forms of TB in children.
WHO guidance recommends TB preventive treatment for people living with HIV, household contacts of bacte-riologically confirmed pulmonary TB cases and clinical risk groups (e.g. those receiving dialysis). Globally in 2019, TB preventive treatment was provided to 4.1 million peo-ple, up from 2.2 million in 2018.
People living with HIV accounted for 85% (3.5 million) of the 2019 total. Of the 3.5 million, three countries – India, the United Republic of Tanzania and South Africa – accounted for 25%, 17% and 14%, respectively.
Numbers of household contacts provided with TB pre-ventive treatment were much smaller: 423 607 in 2018 and 538 396 in 2019. Of these, 81% were children under 5 years (349 796 in 2018 and 433 156 in 2019, equivalent to 27% and 33% of the 1.3 million estimated to be eligible) and 19% were people in older age groups (73 811 in 2018 and 105 240 in 2019). Substantial scale-up will be needed to reach the targets set at the UN high-level meeting on TB. Building synergies with contact tracing efforts related to the COVID-19 pandemic may help.
The COVID-19 pandemic has also highlighted the importance of infection prevention and control in health care facilities and congregate settings, for both health care workers and people seeking care.
In 2019, 153 countries reported providing BCG vacci-nation as a standard part of childhood immunization pro-grammes, of which 87 reported coverage of ≥90%.
Financing for TB prevention, diagnosis and treatmentFunding for the provision of TB prevention, diagnostic and treatment services has doubled since 2006 but still falls far short of what is needed (Fig. E.1c).
In 121 low- and middle-income countries that reported data (and accounted for 98% of reported TB cases globally), funding is projected to reach US$ 6.5 billion in 2020. This is higher than estimated expenditures of US$ 6.0–6.1 bil-lion annually in these countries between 2017 and 2019, but still only 50% of the global target of at least US$ 13 billion annually by 2022. Moreover, the final amount may be lower due to reallocation of funding for the COVID-19 response.
As in previous years, most of the funding (85%) avail-able in 2020 is from domestic sources. This aggregate fig-ure is strongly influenced by the BRICS group of countries (Brazil, Russian Federation, India, China and South Afri-ca). The BRICS countries account for 57% of the available funding in 2020, and 97% of their funding is from domes-tic sources.
In other low- and middle-income countries, interna-tional donor funding remains crucial, accounting for 44% of the funding available in the 25 high TB burden coun-tries outside BRICS and 57% of the funding available in low-income countries.
International donor funding, as reported by nation-al TB programmes (NTPs), increased from US$ 0.9 bil-lion in 2019 to US$ 1.0 billion in 2020. The single largest source (77% of the total in 2020) is the Global Fund to Fight AIDS, Tuberculosis and Malaria (the Global Fund). The largest bilateral donor is the US government, which provides almost 50% of total international donor funding for TB, when combined with funds channelled through and allocated by the Global Fund.
Universal health coverage, social determinants and multisectoral actionThe End TB Strategy milestones for 2020 and 2025 can only be achieved if TB diagnosis, treatment and preven-tion services are provided within the context of progress towards UHC, and if there is multisectoral action and accountability to address the broader determinants that influence TB epidemics and their socioeconomic impact.
UHC means that everyone can obtain the health ser-vices they need without suffering financial hardship. SDG Target 3.8 is to achieve UHC by 2030; the two indicators to monitor progress are a UHC service coverage index (SCI), and the percentage of the population experiencing house-hold expenditures on health care that are large in relation to household expenditures or income.
xixGLOBAL TUBERCULOSIS REPORT 2020
The global SCI increased steadily between 2000 and 2017, from 45 (out of 100) in 2000 to 66 in 2017. Improve-ments were made in all WHO regions and all World Bank income groups. However, values of the SCI in 2017 in the 30 high TB burden countries were mostly in the range of 40–60.
In 2015, at least 930 million people, or 12.7% of the world’s population, faced out-of-pocket expenditures on health care that accounted for 10% or more of their house-hold expenditure or income (a threshold used within the SDG framework to define direct expenditures on health in the general population as catastrophic), up from 9.4% in 2010.
Among high TB burden countries, Thailand stands out as having a high SCI of 80 and a low level of catastrophic health expenditures (2% of households). Brazil and China both had a relatively high SCI of 79.
Many new cases of TB are attributable to five risk fac-tors: undernutrition, HIV infection, alcohol use disorders, smoking (especially among men) and diabetes. In 2019, the estimated numbers of cases attributable to these risk factors were 2.2 million, 0.76 million, 0.72 million, 0.70 million and 0.35 million, respectively. In the context of the COVID-19 pandemic, multisectoral action to address these and other determinants of TB and its consequences, including GDP per capita, poverty and social protection, is more important than ever (Fig. E.4).
Following the request to the WHO Director-General at the UN high-level meeting, a multisectoral accounta-bility framework for TB (MAF-TB) was released by WHO in May 2019. The framework has four major components: commitments; actions; monitoring and reporting; and review. These apply at the global/regional level, and at national (including subnational) level.
At global level, actions taken by WHO include: the development of a MAF-TB checklist; high-level mis-sions; the WHO Director-General Initiative Find.Treat.All#EndTB; engagement of civil society (e.g. the WHO Civil Society Task Force on TB) and youth; updating of guidelines and tools; and development and release of a global strategy for TB research and innovation. Glob-al monitoring, reporting and review has been ensured through annual rounds of data collection, the WHO glob-al TB report, TB reports to the World Health Assembly and the UN Secretary-General 2020 progress report on TB.
Countries have started to adapt and use the MAF-TB. In terms of actions in 2020, 25/30 high TB burden countries reported that they had developed or updated a national strategic plan for TB since the UN high-level meeting on TB, with countries reporting the involve-ment of civil society and affected communities in 29/30. Most high TB burden countries (27/30) reported that they produce an annual TB report. High-level review mecha-nisms were stated to be in place in 16/30 countries. More
detailed assessments of the status of accountability using the checklist developed by WHO are underway.
TB research and innovationThe SDG and End TB Strategy targets set for 2030 can-not be met without intensified research and innovation. Technological breakthroughs are needed by 2025, so that the annual decline in the global TB incidence rate can be accelerated to an average of 17% per year. Priorities include a vaccine to lower the risk of infection, a vaccine or new drug treatment to cut the risk of TB disease in the approximately 2 billion people already infected, rapid diagnostics for use at the point of care, and simpler, short-er treatments for TB disease.
The diagnostic pipeline appears robust in terms of the number of tests, products or methods in development. Examples include several cartridge-based technologies for the detection of drug resistance; next-generation sequenc-ing (NGS) assays for detecting drug-resistant TB directly from sputum specimens; and newer skin tests and inter-feron gamma release assays (IGRA) to test for TB infec-tion.
As of August 2020, there were 22 drugs, various com-bination regimens and 14 vaccine candidates in clinical trials.
Final results from a Phase IIb trial of the M72/AS01E vaccine candidate showed a 50% (90% CI: 12–71%) point estimate for vaccine efficacy for people with TB infection after 3 years of follow-up. If the findings are confirmed in a Phase III trial, this vaccine could transform global TB prevention efforts. In 2020, the Gates Medical Research Institute obtained a license to develop M72/AS01E for use in low-income countries.
A Global Strategy for TB Research and Innovation was adopted by all WHO Member States through a World Health Assembly resolution in August 2020. The strate-gy aims to support countries and relevant stakeholders to translate commitments in the Moscow Declaration and the political declaration of the UN high-level meeting on TB into concrete actions. WHO has also developed a TB/COVID-19 research compendium and launched a toolkit to support expanded use of digital technologies in TB care.
ConclusionLeaders of all UN Member States have committed to “end-ing the global TB epidemic” by 2030, backed up by con-crete milestones and targets.
Progress is being made. At the end of 2019, global indi-cators for reductions in TB disease burden, improved access to TB prevention and care and increased financing were all moving in the right direction. The WHO Euro-pean Region and several high TB burden countries are on track to reach 2020 milestones for reductions in TB cases and deaths. However, agreed milestones and targets are not
GLOBAL TUBERCULOSIS REPORT 2020 xx
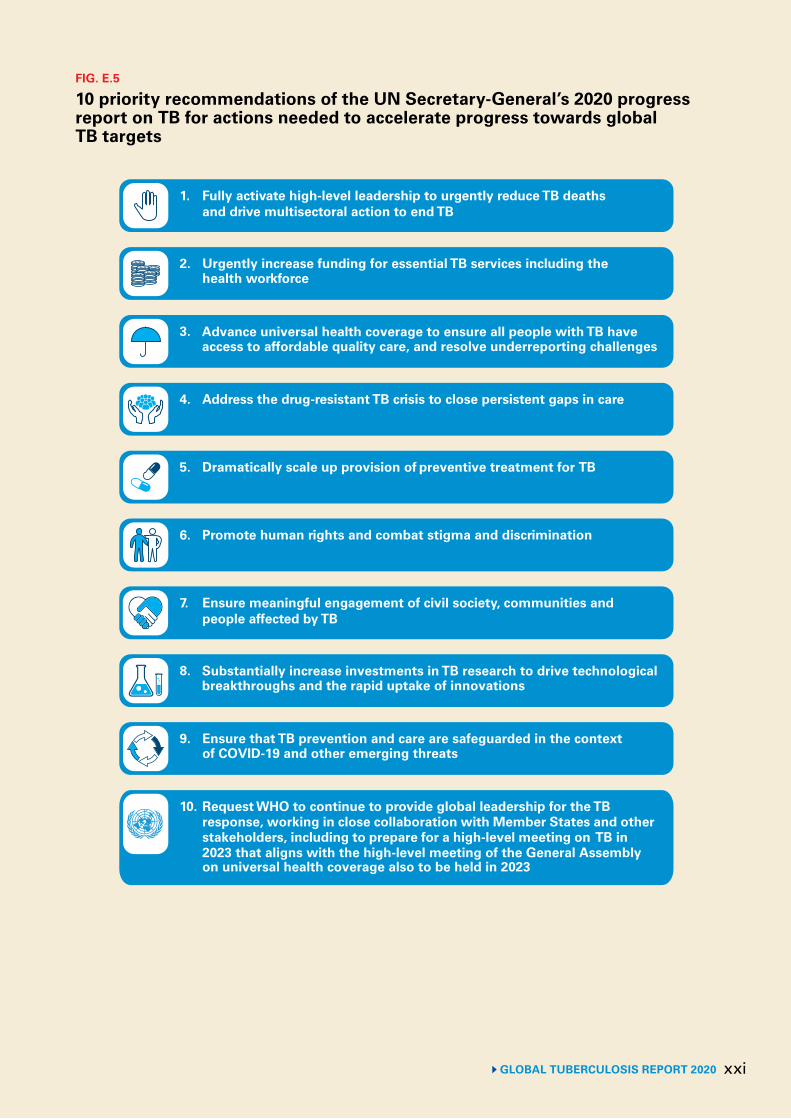
on track to be met globally and the COVID-19 pandem-ic now threatens to stall or reverse the progress that has been achieved. The UN Secretary-General’s 2020 progress report on TB urges countries to implement 10 priority recommendations needed to reach targets and reduce the enormous human and societal toll caused by TB (Fig. E.5).
The overarching message of this report and that of the UN Secretary-General’s 2020 progress report on TB is the same. High-level commitments have galvanized global, regional and national progress towards ending TB, but urgent and more ambitious investments and actions are required to put the world on track to reach targets, espe-cially in the context of the COVID-19 pandemic.
1 For these people, the lifetime risk of developing TB disease is about 5–10%.
2 WHO’s annual rounds of global TB data collection and the annu-al WHO Global TB Report are key elements of “monitoring and reporting” in the WHO multisectoral accountability framework for TB.
3 The UN Secretary General’s report was released in September 2020.4 The treatment targets were built on the WHO Flagship Initiative
“Find. Treat. All. #EndTB” and the funding targets were based on the Stop TB Partnership’s Global Plan to End TB, 2018–2022.
5 Here and elsewhere, “range” in the context of estimates of TB disease burden refers to the 95% uncertainty interval.
6 When an HIV-positive person dies from TB disease, the under-lying cause is coded as HIV in the International Classification of Diseases system.
7 The other 22 countries are Angola, Brazil, Cambodia, Central African Republic, the Congo, the Democratic People’s Republic of Korea, the Democratic Republic of the Congo, Ethiopia, Ken-ya, Lesotho, Liberia, Mozambique, Myanmar, Namibia, Papua New Guinea, the Russian Federation, Sierra Leone, Thailand, the United Republic of Tanzania, Viet Nam, Zambia and Zimbabwe.
8 The 95% uncertainty interval is 400 000–535 000.9 MDR-TB is defined as resistance to rifampicin and isoniazid. 10 Reductions in other WHO regions were 3.5% in the Eastern Med-
iterranean Region, 8.7% in the South-East Asia Region and 6.1% in the Western Pacific Region. In the WHO Region of the Amer-icas, incidence is slowly increasing, owing to an upward trend in Brazil.
11 Including TB deaths among both HIV-negative and HIV-positive people.
12 Reductions in other WHO regions were 6.1% in the Americas, 11% in the Eastern Mediterranean, 10% in South-East Asia and 17% in the Western Pacific.
13 Calculated as the sum of direct medical expenditures, non-med-ical expenditures and income losses.
14 Funding for TB research is monitored by Treatment Action Group; the latest data are from their 2019 report.
15 Other countries with large relative increases in 2017–2019 are shown in Fig. 5.2.
16 The numbers cited refer to pulmonary cases.17 The other 8 countries were the Democratic Republic of the Con-
go, Indonesia, Myanmar, Nigeria, Pakistan, the Philippines, the Russian Federation and Viet Nam.
18 The drug regimens currently recommended by WHO are explained in Chapter 6.
xxiGLOBAL TUBERCULOSIS REPORT 2020
1. Fully activate high-level leadership to urgently reduce TB deathsand drive multisectoral action to end TB
2. Urgently increase funding for essential TB services including thehealth workforce
4. Address the drug-resistant TB crisis to close persistent gaps in care
3. Advance universal health coverage to ensure all people with TB haveaccess to affordable quality care, and resolve underreporting challenges
7. Ensure meaningful engagement of civil society, communities andpeople affected by TB
5. Dramatically scale up provision of preventive treatment for TB
9. Ensure that TB prevention and care are safeguarded in the contextof COVID-19 and other emerging threats
10. Request WHO to continue to provide global leadership for the TBresponse, working in close collaboration with Member States and otherstakeholders, including to prepare for a high-level meeting on TB in2023 that aligns with the high-level meeting of the General Assemblyon universal health coverage also to be held in 2023
8. Substantially increase investments in TB research to drive technologicalbreakthroughs and the rapid uptake of innovations
6. Promote human rights and combat stigma and discrimination
FIG. E.5
10 priority recommendations of the UN Secretary-General’s 2020 progress report on TB for actions needed to accelerate progress towards global TB targets
Doctors reviewing a patient’s medication in a rural TB clinic, South Sudan.John Rae Photography
1GLOBAL TUBERCULOSIS REPORT 2020
Chapter 1
Introduction
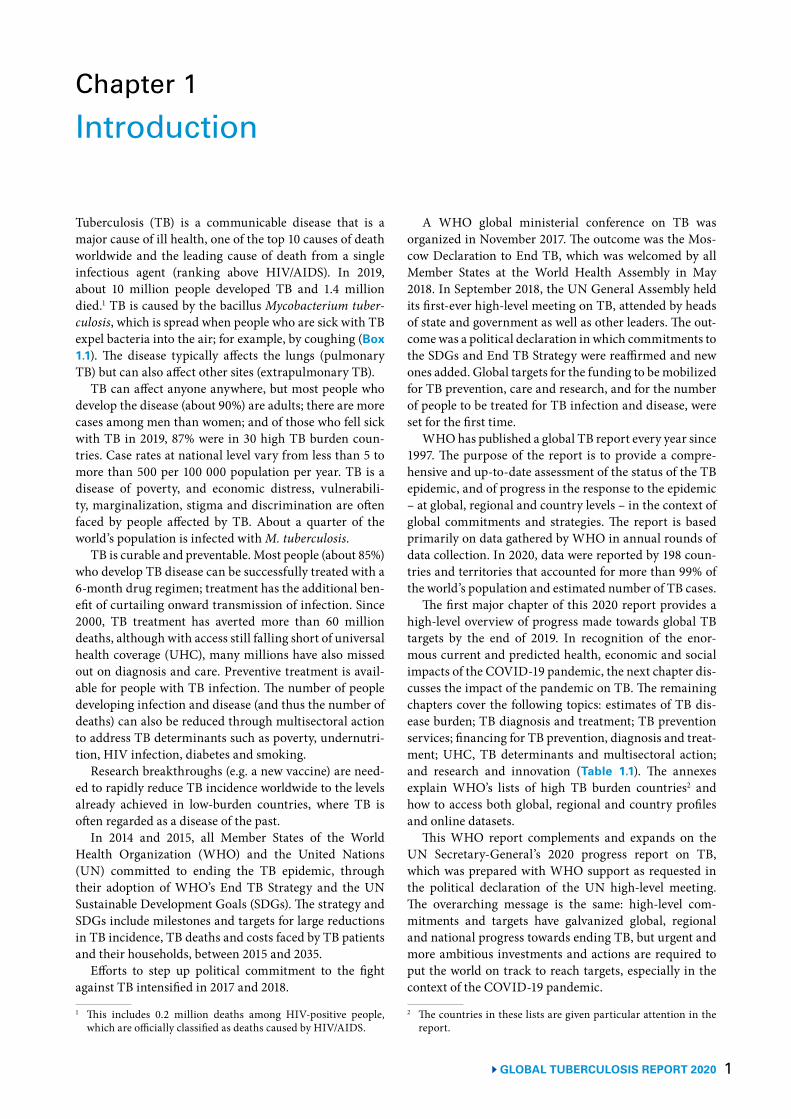
Tuberculosis (TB) is a communicable disease that is a major cause of ill health, one of the top 10 causes of death worldwide and the leading cause of death from a single infectious agent (ranking above HIV/AIDS). In 2019, about 10 million people developed TB and 1.4 million died.1 TB is caused by the bacillus Mycobacterium tuber-culosis, which is spread when people who are sick with TB expel bacteria into the air; for example, by coughing (Box 1.1). The disease typically affects the lungs (pulmonary TB) but can also affect other sites (extrapulmonary TB).
TB can affect anyone anywhere, but most people who develop the disease (about 90%) are adults; there are more cases among men than women; and of those who fell sick with TB in 2019, 87% were in 30 high TB burden coun-tries. Case rates at national level vary from less than 5 to more than 500 per 100 000 population per year. TB is a disease of poverty, and economic distress, vulnerabili-ty, marginalization, stigma and discrimination are often faced by people affected by TB. About a quarter of the world’s population is infected with M. tuberculosis.
TB is curable and preventable. Most people (about 85%) who develop TB disease can be successfully treated with a 6-month drug regimen; treatment has the additional ben-efit of curtailing onward transmission of infection. Since 2000, TB treatment has averted more than 60 million deaths, although with access still falling short of universal health coverage (UHC), many millions have also missed out on diagnosis and care. Preventive treatment is avail-able for people with TB infection. The number of people developing infection and disease (and thus the number of deaths) can also be reduced through multisectoral action to address TB determinants such as poverty, undernutri-tion, HIV infection, diabetes and smoking.
Research breakthroughs (e.g. a new vaccine) are need-ed to rapidly reduce TB incidence worldwide to the levels already achieved in low-burden countries, where TB is often regarded as a disease of the past.
In 2014 and 2015, all Member States of the World Health Organization (WHO) and the United Nations (UN) committed to ending the TB epidemic, through their adoption of WHO’s End TB Strategy and the UN Sustainable Development Goals (SDGs). The strategy and SDGs include milestones and targets for large reductions in TB incidence, TB deaths and costs faced by TB patients and their households, between 2015 and 2035.
Efforts to step up political commitment to the fight against TB intensified in 2017 and 2018.
1 This includes 0.2 million deaths among HIV-positive people, which are officially classified as deaths caused by HIV/AIDS.
A WHO global ministerial conference on TB was organized in November 2017. The outcome was the Mos-cow Declaration to End TB, which was welcomed by all Member States at the World Health Assembly in May 2018. In September 2018, the UN General Assembly held its first-ever high-level meeting on TB, attended by heads of state and government as well as other leaders. The out-come was a political declaration in which commitments to the SDGs and End TB Strategy were reaffirmed and new ones added. Global targets for the funding to be mobilized for TB prevention, care and research, and for the number of people to be treated for TB infection and disease, were set for the first time.
WHO has published a global TB report every year since 1997. The purpose of the report is to provide a compre-hensive and up-to-date assessment of the status of the TB epidemic, and of progress in the response to the epidemic – at global, regional and country levels – in the context ofglobal commitments and strategies. The report is based primarily on data gathered by WHO in annual rounds of data collection. In 2020, data were reported by 198 coun-tries and territories that accounted for more than 99% of the world’s population and estimated number of TB cases.
The first major chapter of this 2020 report provides a high-level overview of progress made towards global TB targets by the end of 2019. In recognition of the enor-mous current and predicted health, economic and social impacts of the COVID-19 pandemic, the next chapter dis-cusses the impact of the pandemic on TB. The remaining chapters cover the following topics: estimates of TB dis-ease burden; TB diagnosis and treatment; TB prevention services; financing for TB prevention, diagnosis and treat-ment; UHC, TB determinants and multisectoral action; and research and innovation (Table 1.1). The annexes explain WHO’s lists of high TB burden countries2 and how to access both global, regional and country profiles and online datasets.
This WHO report complements and expands on the UN Secretary-General’s 2020 progress report on TB, which was prepared with WHO support as requested in the political declaration of the UN high-level meeting. The overarching message is the same: high-level com-mitments and targets have galvanized global, regional and national progress towards ending TB, but urgent and more ambitious investments and actions are required to put the world on track to reach targets, especially in the context of the COVID-19 pandemic.
2 The countries in these lists are given particular attention in the report.
GLOBAL TUBERCULOSIS REPORT 2020 2
Basic facts about tuberculosis
BOX 1.1
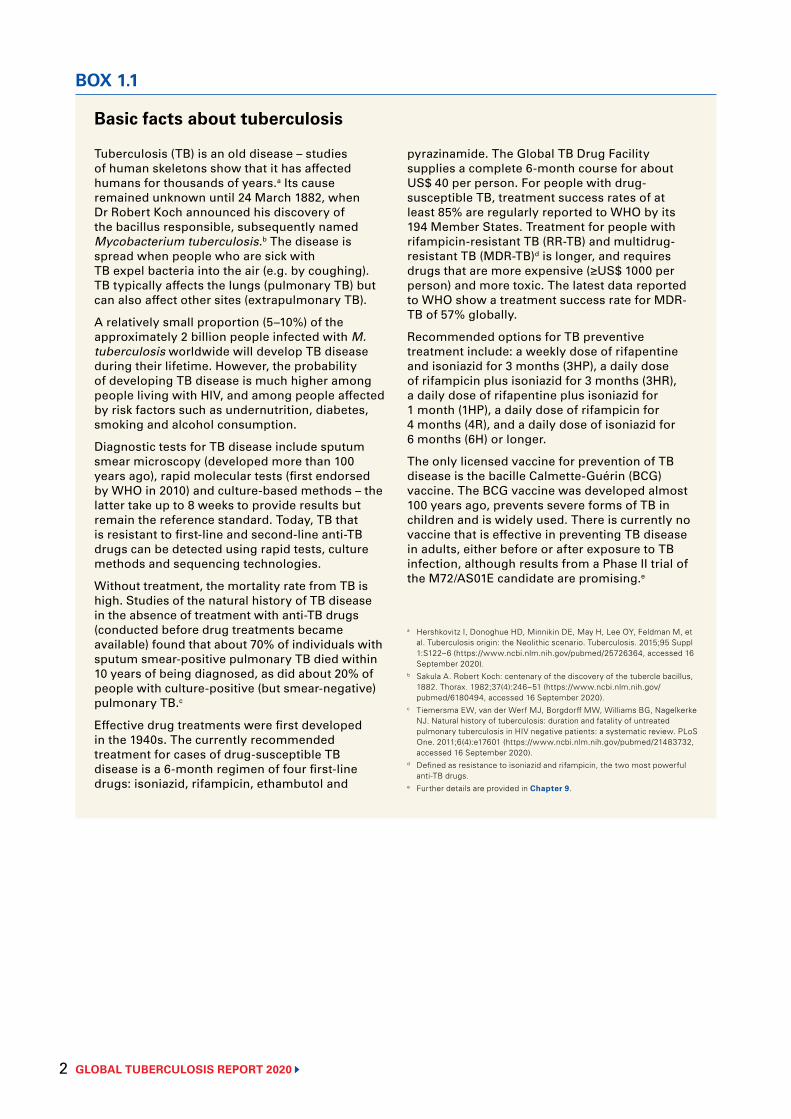
Tuberculosis (TB) is an old disease – studies of human skeletons show that it has affected humans for thousands of years.a Its cause remained unknown until 24 March 1882, when Dr Robert Koch announced his discovery of the bacillus responsible, subsequently named Mycobacterium tuberculosis.b The disease is spread when people who are sick with TB expel bacteria into the air (e.g. by coughing). TB typically affects the lungs (pulmonary TB) but can also affect other sites (extrapulmonary TB).
A relatively small proportion (5–10%) of the approximately 2 billion people infected with M. tuberculosis worldwide will develop TB disease during their lifetime. However, the probability of developing TB disease is much higher among people living with HIV, and among people affected by risk factors such as undernutrition, diabetes, smoking and alcohol consumption.
Diagnostic tests for TB disease include sputum smear microscopy (developed more than 100 years ago), rapid molecular tests (first endorsed by WHO in 2010) and culture-based methods – the latter take up to 8 weeks to provide results but remain the reference standard. Today, TB that is resistant to first-line and second-line anti-TB drugs can be detected using rapid tests, culture methods and sequencing technologies.
Without treatment, the mortality rate from TB is high. Studies of the natural history of TB disease in the absence of treatment with anti-TB drugs (conducted before drug treatments became available) found that about 70% of individuals with sputum smear-positive pulmonary TB died within 10 years of being diagnosed, as did about 20% of people with culture-positive (but smear-negative) pulmonary TB.c
Effective drug treatments were first developed in the 1940s. The currently recommended treatment for cases of drug-susceptible TB disease is a 6-month regimen of four first-line drugs: isoniazid, rifampicin, ethambutol and
pyrazinamide. The Global TB Drug Facility supplies a complete 6-month course for about US$ 40 per person. For people with drug-susceptible TB, treatment success rates of at least 85% are regularly reported to WHO by its 194 Member States. Treatment for people with rifampicin-resistant TB (RR-TB) and multidrug-resistant TB (MDR-TB)d is longer, and requires drugs that are more expensive (≥US$ 1000 per person) and more toxic. The latest data reported to WHO show a treatment success rate for MDR-TB of 57% globally.
Recommended options for TB preventive treatment include: a weekly dose of rifapentine and isoniazid for 3 months (3HP), a daily dose of rifampicin plus isoniazid for 3 months (3HR), a daily dose of rifapentine plus isoniazid for 1 month (1HP), a daily dose of rifampicin for 4 months (4R), and a daily dose of isoniazid for 6 months (6H) or longer.
The only licensed vaccine for prevention of TB disease is the bacille Calmette-Guérin (BCG) vaccine. The BCG vaccine was developed almost 100 years ago, prevents severe forms of TB in children and is widely used. There is currently no vaccine that is effective in preventing TB disease in adults, either before or after exposure to TB infection, although results from a Phase II trial of the M72/AS01E candidate are promising.e
a Hershkovitz I, Donoghue HD, Minnikin DE, May H, Lee OY, Feldman M, et al. Tuberculosis origin: the Neolithic scenario. Tuberculosis. 2015;95 Suppl 1:S122–6 (https://www.ncbi.nlm.nih.gov/pubmed/25726364, accessed 16 September 2020).
b Sakula A. Robert Koch: centenary of the discovery of the tubercle bacillus, 1882. Thorax. 1982;37(4):246–51 (https://www.ncbi.nlm.nih.gov/pubmed/6180494, accessed 16 September 2020).
c Tiemersma EW, van der Werf MJ, Borgdorff MW, Williams BG, Nagelkerke NJ. Natural history of tuberculosis: duration and fatality of untreated pulmonary tuberculosis in HIV negative patients: a systematic review. PLoS One. 2011;6(4):e17601 (https://www.ncbi.nlm.nih.gov/pubmed/21483732, accessed 16 September 2020).
d Defined as resistance to isoniazid and rifampicin, the two most powerful anti-TB drugs.
e Further details are provided in Chapter 9.
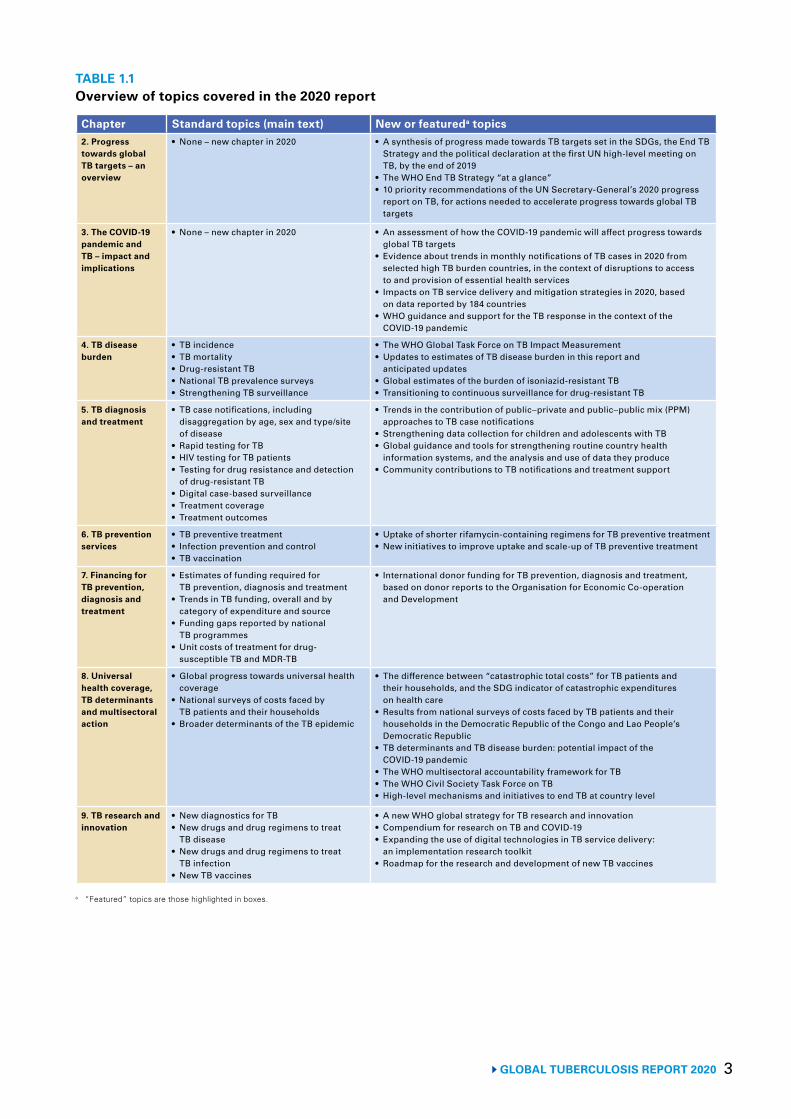
3GLOBAL TUBERCULOSIS REPORT 2020
TABLE 1.1 Overview of topics covered in the 2020 report
Chapter Standard topics (main text) New or featureda topics2. Progress towards global TB targets – an overview
• None – new chapter in 2020 • A synthesis of progress made towards TB targets set in the SDGs, the End TB Strategy and the political declaration at the first UN high-level meeting on TB, by the end of 2019
• The WHO End TB Strategy “at a glance”• 10 priority recommendations of the UN Secretary-General’s 2020 progress
report on TB, for actions needed to accelerate progress towards global TB targets
3. The COVID-19 pandemic and TB – impact and implications
• None – new chapter in 2020 • An assessment of how the COVID-19 pandemic will affect progress towards global TB targets
• Evidence about trends in monthly notifications of TB cases in 2020 from selected high TB burden countries, in the context of disruptions to access to and provision of essential health services
• Impacts on TB service delivery and mitigation strategies in 2020, based on data reported by 184 countries
• WHO guidance and support for the TB response in the context of the COVID-19 pandemic
4. TB disease burden
• TB incidence• TB mortality• Drug-resistant TB• National TB prevalence surveys• Strengthening TB surveillance
• The WHO Global Task Force on TB Impact Measurement• Updates to estimates of TB disease burden in this report and
anticipated updates• Global estimates of the burden of isoniazid-resistant TB• Transitioning to continuous surveillance for drug-resistant TB
5. TB diagnosis and treatment
• TB case notifications, including disaggregation by age, sex and type/site of disease
• Rapid testing for TB• HIV testing for TB patients• Testing for drug resistance and detection
of drug-resistant TB• Digital case-based surveillance• Treatment coverage• Treatment outcomes
• Trends in the contribution of public–private and public–public mix (PPM) approaches to TB case notifications
• Strengthening data collection for children and adolescents with TB• Global guidance and tools for strengthening routine country health
information systems, and the analysis and use of data they produce • Community contributions to TB notifications and treatment support
6. TB prevention services
• TB preventive treatment• Infection prevention and control• TB vaccination
• Uptake of shorter rifamycin-containing regimens for TB preventive treatment• New initiatives to improve uptake and scale-up of TB preventive treatment
7. Financing for TB prevention, diagnosis and treatment
• Estimates of funding required for TB prevention, diagnosis and treatment
• Trends in TB funding, overall and by category of expenditure and source
• Funding gaps reported by national TB programmes
• Unit costs of treatment for drug-susceptible TB and MDR-TB
• International donor funding for TB prevention, diagnosis and treatment, based on donor reports to the Organisation for Economic Co-operation and Development
8. Universal health coverage, TB determinants and multisectoral action
• Global progress towards universal health coverage
• National surveys of costs faced by TB patients and their households
• Broader determinants of the TB epidemic
• The difference between “catastrophic total costs” for TB patients and their households, and the SDG indicator of catastrophic expenditures on health care
• Results from national surveys of costs faced by TB patients and their households in the Democratic Republic of the Congo and Lao People’s Democratic Republic
• TB determinants and TB disease burden: potential impact of the COVID-19 pandemic
• The WHO multisectoral accountability framework for TB• The WHO Civil Society Task Force on TB• High-level mechanisms and initiatives to end TB at country level
9. TB research and innovation
• New diagnostics for TB• New drugs and drug regimens to treat
TB disease• New drugs and drug regimens to treat
TB infection• New TB vaccines
• A new WHO global strategy for TB research and innovation• Compendium for research on TB and COVID-19• Expanding the use of digital technologies in TB service delivery:
an implementation research toolkit• Roadmap for the research and development of new TB vaccines
a “Featured” topics are those highlighted in boxes.
GLOBAL TUBERCULOSIS REPORT 2020 4
TB screening activities in a rural village, Cambodia.Yoshi Shimizu/WHO
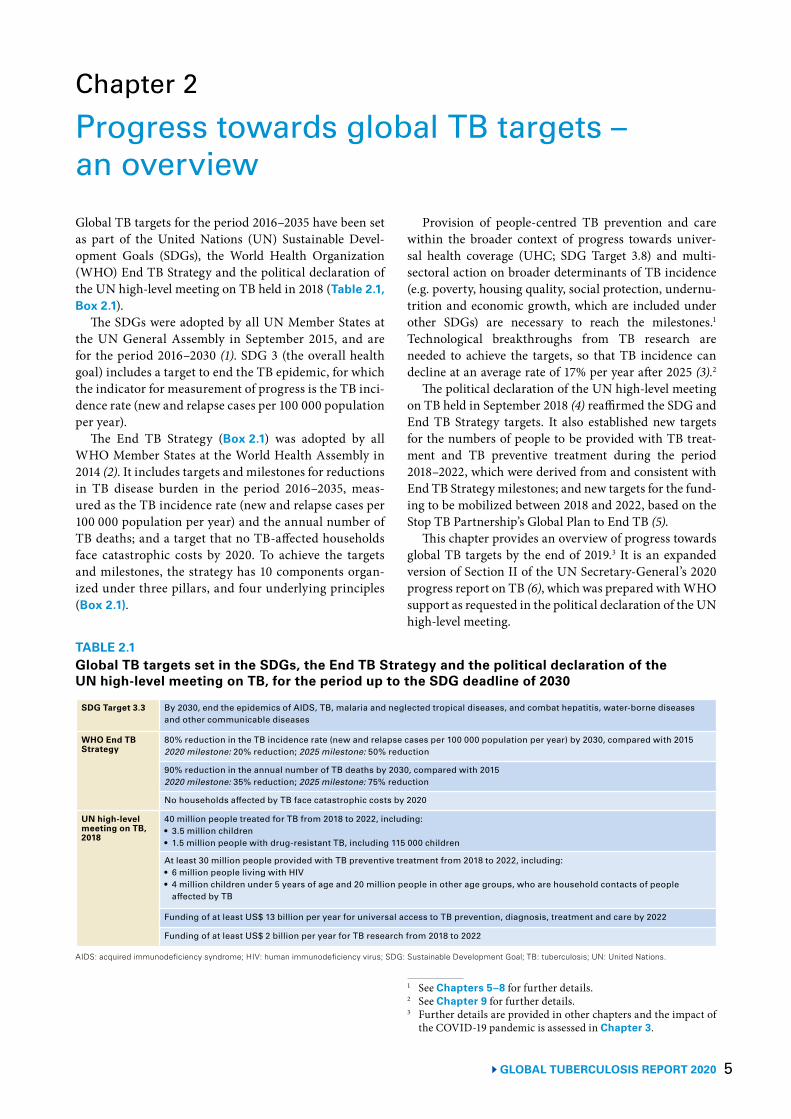
5 GLOBAL TUBERCULOSIS REPORT 2020
Chapter 2
Progress towards global TB targets – an overviewGlobal TB targets for the period 2016–2035 have been set as part of the United Nations (UN) Sustainable Devel-opment Goals (SDGs), the World Health Organization (WHO) End TB Strategy and the political declaration of the UN high-level meeting on TB held in 2018 (Table 2.1, Box 2.1).
The SDGs were adopted by all UN Member States at the UN General Assembly in September 2015, and are for the period 2016–2030 (1). SDG 3 (the overall health goal) includes a target to end the TB epidemic, for which the indicator for measurement of progress is the TB inci-dence rate (new and relapse cases per 100 000 population per year).
The End TB Strategy (Box 2.1) was adopted by all WHO Member States at the World Health Assembly in 2014 (2). It includes targets and milestones for reductions in TB disease burden in the period 2016–2035, meas-ured as the TB incidence rate (new and relapse cases per 100 000 population per year) and the annual number of TB deaths; and a target that no TB-affected households face catastrophic costs by 2020. To achieve the targets and milestones, the strategy has 10 components organ-ized under three pillars, and four underlying principles (Box 2.1).
Provision of people-centred TB prevention and care within the broader context of progress towards univer-sal health coverage (UHC; SDG Target 3.8) and multi-sectoral action on broader determinants of TB incidence (e.g. poverty, housing quality, social protection, undernu-trition and economic growth, which are included under other SDGs) are necessary to reach the milestones.1 Technological breakthroughs from TB research are needed to achieve the targets, so that TB incidence can decline at an average rate of 17% per year after 2025 (3).2
The political declaration of the UN high-level meeting on TB held in September 2018 (4) reaffirmed the SDG and End TB Strategy targets. It also established new targets for the numbers of people to be provided with TB treat-ment and TB preventive treatment during the period 2018–2022, which were derived from and consistent with End TB Strategy milestones; and new targets for the fund-ing to be mobilized between 2018 and 2022, based on the Stop TB Partnership’s Global Plan to End TB (5).
This chapter provides an overview of progress towards global TB targets by the end of 2019.3 It is an expanded version of Section II of the UN Secretary-General’s 2020 progress report on TB (6), which was prepared with WHO support as requested in the political declaration of the UN high-level meeting.
1 See Chapters 5–8 for further details. 2 See Chapter 9 for further details.3 Further details are provided in other chapters and the impact of
the COVID-19 pandemic is assessed in Chapter 3.
TABLE 2.1Global TB targets set in the SDGs, the End TB Strategy and the political declaration of the UN high-level meeting on TB, for the period up to the SDG deadline of 2030
SDG Target 3.3 By 2030, end the epidemics of AIDS, TB, malaria and neglected tropical diseases, and combat hepatitis, water-borne diseases and other communicable diseases
WHO End TB Strategy
80% reduction in the TB incidence rate (new and relapse cases per 100 000 population per year) by 2030, compared with 2015 2020 milestone: 20% reduction; 2025 milestone: 50% reduction
90% reduction in the annual number of TB deaths by 2030, compared with 20152020 milestone: 35% reduction; 2025 milestone: 75% reduction
No households affected by TB face catastrophic costs by 2020
UN high-level meeting on TB, 2018
40 million people treated for TB from 2018 to 2022, including:• 3.5 million children• 1.5 million people with drug-resistant TB, including 115 000 children
At least 30 million people provided with TB preventive treatment from 2018 to 2022, including:• 6 million people living with HIV• 4 million children under 5 years of age and 20 million people in other age groups, who are household contacts of people
affected by TB
Funding of at least US$ 13 billion per year for universal access to TB prevention, diagnosis, treatment and care by 2022
Funding of at least US$ 2 billion per year for TB research from 2018 to 2022
AIDS: acquired immunodeficiency syndrome; HIV: human immunodeficiency virus; SDG: Sustainable Development Goal; TB: tuberculosis; UN: United Nations.
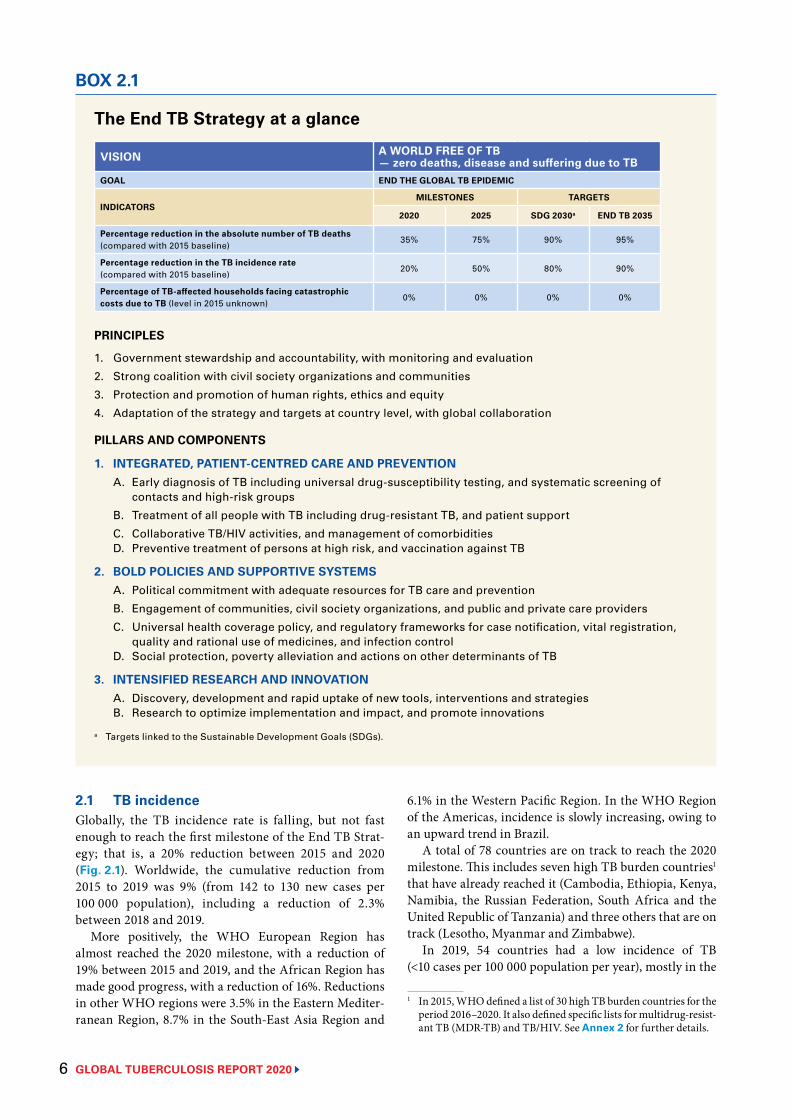
GLOBAL TUBERCULOSIS REPORT 2020 6
2.1 TB incidence Globally, the TB incidence rate is falling, but not fast enough to reach the first milestone of the End TB Strat-egy; that is, a 20% reduction between 2015 and 2020 (Fig. 2.1). Worldwide, the cumulative reduction from 2015 to 2019 was 9% (from 142 to 130 new cases per 100 000 population), including a reduction of 2.3% between 2018 and 2019.
More positively, the WHO European Region has almost reached the 2020 milestone, with a reduction of 19% between 2015 and 2019, and the African Region has made good progress, with a reduction of 16%. Reductions in other WHO regions were 3.5% in the Eastern Mediter-ranean Region, 8.7% in the South-East Asia Region and
The End TB Strategy at a glance
VISION A WORLD FREE OF TB— zero deaths, disease and suffering due to TB
GOAL END THE GLOBAL TB EPIDEMIC
INDICATORSMILESTONES TARGETS
2020 2025 SDG 2030a END TB 2035
Percentage reduction in the absolute number of TB deaths (compared with 2015 baseline)
35% 75% 90% 95%
Percentage reduction in the TB incidence rate (compared with 2015 baseline)
20% 50% 80% 90%
Percentage of TB-affected households facing catastrophic costs due to TB (level in 2015 unknown)
0% 0% 0% 0%
PRINCIPLES
1. Government stewardship and accountability, with monitoring and evaluation
2. Strong coalition with civil society organizations and communities
3. Protection and promotion of human rights, ethics and equity
4. Adaptation of the strategy and targets at country level, with global collaboration
PILLARS AND COMPONENTS
1. INTEGRATED, PATIENT-CENTRED CARE AND PREVENTIONA. Early diagnosis of TB including universal drug-susceptibility testing, and systematic screening of
contacts and high-risk groups
B. Treatment of all people with TB including drug-resistant TB, and patient support
C. Collaborative TB/HIV activities, and management of comorbiditiesD. Preventive treatment of persons at high risk, and vaccination against TB
2. BOLD POLICIES AND SUPPORTIVE SYSTEMSA. Political commitment with adequate resources for TB care and prevention
B. Engagement of communities, civil society organizations, and public and private care providers
C. Universal health coverage policy, and regulatory frameworks for case notification, vital registration,quality and rational use of medicines, and infection control
D. Social protection, poverty alleviation and actions on other determinants of TB
3. INTENSIFIED RESEARCH AND INNOVATIONA. Discovery, development and rapid uptake of new tools, interventions and strategiesB. Research to optimize implementation and impact, and promote innovations
a Targets linked to the Sustainable Development Goals (SDGs).
BOX 2.1
6.1% in the Western Pacific Region. In the WHO Region of the Americas, incidence is slowly increasing, owing to an upward trend in Brazil.
A total of 78 countries are on track to reach the 2020 milestone. This includes seven high TB burden countries1 that have already reached it (Cambodia, Ethiopia, Kenya, Namibia, the Russian Federation, South Africa and the United Republic of Tanzania) and three others that are on track (Lesotho, Myanmar and Zimbabwe).
In 2019, 54 countries had a low incidence of TB (<10 cases per 100 000 population per year), mostly in the
1 In 2015, WHO defined a list of 30 high TB burden countries for the period 2016–2020. It also defined specific lists for multidrug-resist-ant TB (MDR-TB) and TB/HIV. See Annex 2 for further details.
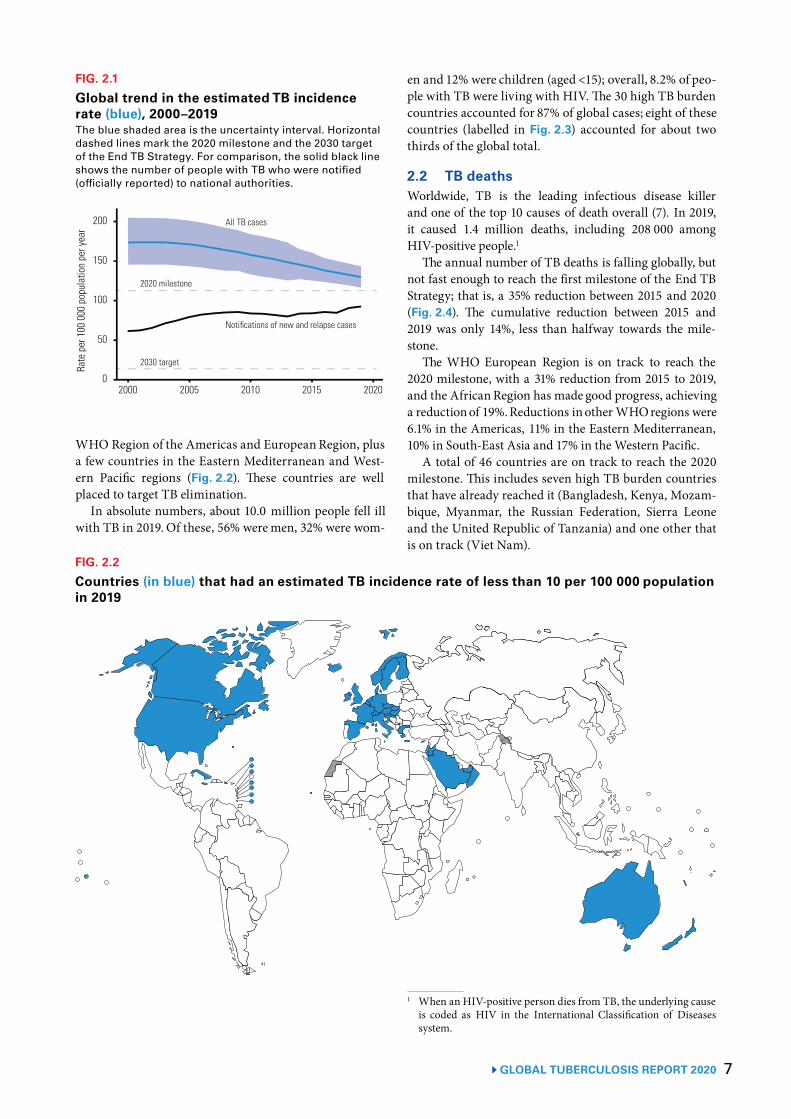
7GLOBAL TUBERCULOSIS REPORT 2020
WHO Region of the Americas and European Region, plusa few countries in the Eastern Mediterranean and West-ern Pacific regions (Fig. 2.2). These countries are wellplaced to target TB elimination.
In absolute numbers, about 10.0 million people fell illwith TB in 2019. Of these, 56% were men, 32% were wom-
FIG. 2.1
Global trend in the estimated TB incidencerate (blue), 2000–2019The blue shaded area is the uncertainty interval. Horizontaldashed lines mark the 2020 milestone and the 2030 targetof the End TB Strategy. For comparison, the solid black lineshows the number of people with TB who were notified(officially reported) to national authorities.
Rateper100
000populationperyear
100
50
0
200
150
2020 milestone
2030 target
2000 2005 2010 2015 2020
All TB cases
Notifications of new and relapse cases
en and 12% were children (aged <15); overall, 8.2% of peo-ple with TB were living with HIV. The 30 high TB burdencountries accounted for 87% of global cases; eight of thesecountries (labelled in Fig. 2.3) accounted for about twothirds of the global total.
2.2 TB deathsWorldwide, TB is the leading infectious disease killerand one of the top 10 causes of death overall (7). In 2019,it caused 1.4 million deaths, including 208 000 amongHIV-positive people.1
The annual number of TB deaths is falling globally, butnot fast enough to reach the first milestone of the End TBStrategy; that is, a 35% reduction between 2015 and 2020(Fig. 2.4). The cumulative reduction between 2015 and2019 was only 14%, less than halfway towards the mile-stone.
The WHO European Region is on track to reach the2020 milestone, with a 31% reduction from 2015 to 2019,and the African Region has made good progress, achievinga reduction of 19%. Reductions in other WHO regions were6.1% in the Americas, 11% in the Eastern Mediterranean,10% in South-East Asia and 17% in the Western Pacific.
A total of 46 countries are on track to reach the 2020milestone. This includes seven high TB burden countriesthat have already reached it (Bangladesh, Kenya, Mozam-bique, Myanmar, the Russian Federation, Sierra Leoneand the United Republic of Tanzania) and one other thatis on track (Viet Nam).
1 When an HIV-positive person dies from TB, the underlying causeis coded as HIV in the International Classification of Diseasessystem.
FIG. 2.2
Countries (in blue) that had an estimated TB incidence rate of less than 10 per 100 000 populationin 2019
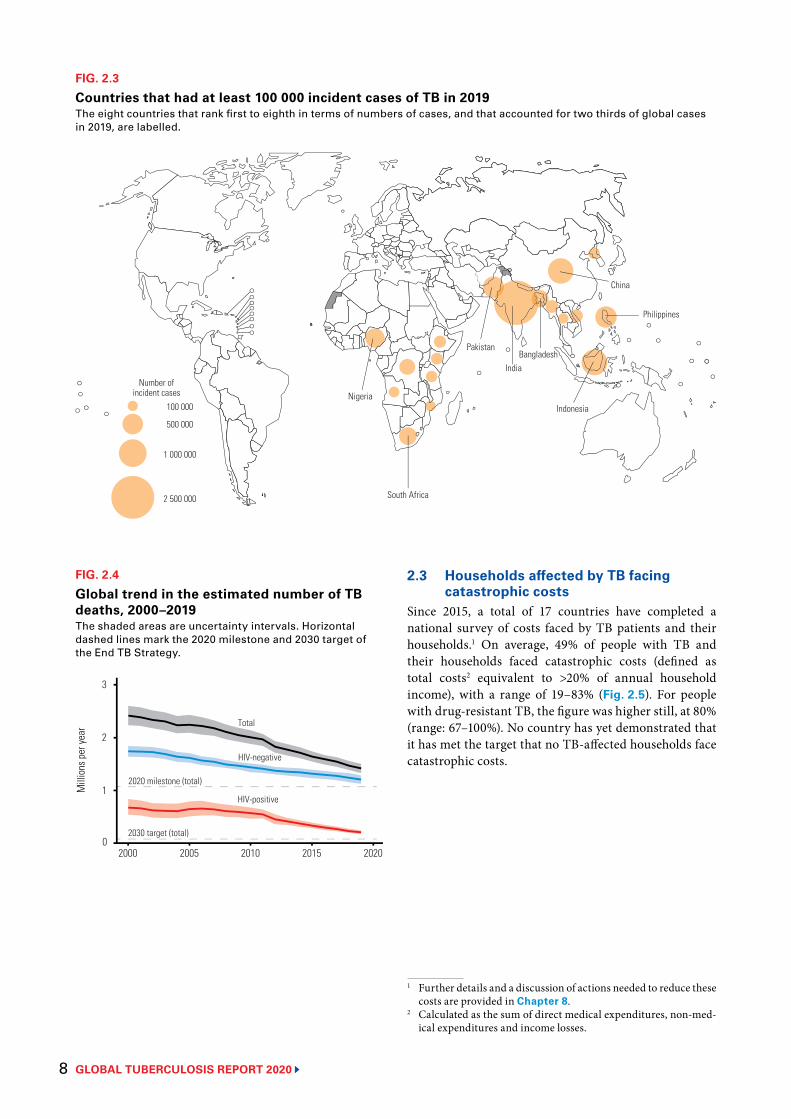
GLOBAL TUBERCULOSIS REPORT 2020 8
2.3 Households affected by TB facing catastrophic costs
Since 2015, a total of 17 countries have completed a national survey of costs faced by TB patients and their households.1 On average, 49% of people with TB and their households faced catastrophic costs (defined as total costs2 equivalent to >20% of annual household income), with a range of 19–83% (Fig. 2.5). For people with drug-resistant TB, the figure was higher still, at 80% (range: 67–100%). No country has yet demonstrated that it has met the target that no TB-affected households face catastrophic costs.
1 Further details and a discussion of actions needed to reduce these costs are provided in Chapter 8.
2 Calculated as the sum of direct medical expenditures, non-med-ical expenditures and income losses.
FIG. 2.3
Countries that had at least 100 000 incident cases of TB in 2019The eight countries that rank first to eighth in terms of numbers of cases, and that accounted for two thirds of global cases in 2019, are labelled.
Number ofincident cases
100 000
500 000
1 000 000
2 500 000
Nigeria
South Africa
Pakistan
India
Indonesia
Philippines
China
Bangladesh
FIG. 2.4
Global trend in the estimated number of TB deaths, 2000–2019The shaded areas are uncertainty intervals. Horizontal dashed lines mark the 2020 milestone and 2030 target of the End TB Strategy.
Mill
ions
per
year 2
1
0
2020 milestone (total)
2030 target (total)
Total
HIV-negative
HIV-positive
3
2000 2005 2010 2015 2020
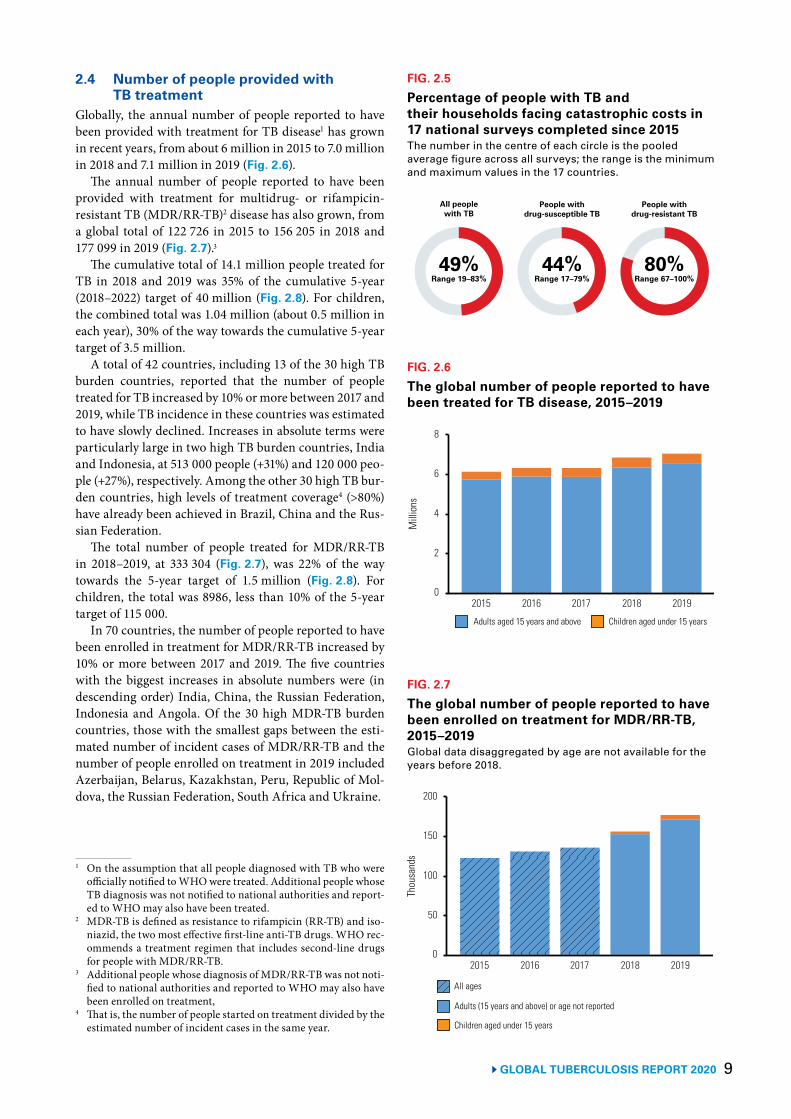
9 GLOBAL TUBERCULOSIS REPORT 2020
2.4 Number of people provided with TB treatment
Globally, the annual number of people reported to have been provided with treatment for TB disease1 has grown in recent years, from about 6 million in 2015 to 7.0 million in 2018 and 7.1 million in 2019 (Fig. 2.6).
The annual number of people reported to have been provided with treatment for multidrug- or rifampicin- resistant TB (MDR/RR-TB)2 disease has also grown, from a global total of 122 726 in 2015 to 156 205 in 2018 and 177 099 in 2019 (Fig. 2.7).3
The cumulative total of 14.1 million people treated for TB in 2018 and 2019 was 35% of the cumulative 5-year (2018–2022) target of 40 million (Fig. 2.8). For children, the combined total was 1.04 million (about 0.5 million in each year), 30% of the way towards the cumulative 5-year target of 3.5 million.
A total of 42 countries, including 13 of the 30 high TB burden countries, reported that the number of people treated for TB increased by 10% or more between 2017 and 2019, while TB incidence in these countries was estimated to have slowly declined. Increases in absolute terms were particularly large in two high TB burden countries, India and Indonesia, at 513 000 people (+31%) and 120 000 peo-ple (+27%), respectively. Among the other 30 high TB bur-den countries, high levels of treatment coverage4 (>80%) have already been achieved in Brazil, China and the Rus-sian Federation.
The total number of people treated for MDR/RR-TB in 2018–2019, at 333 304 (Fig. 2.7), was 22% of the way towards the 5-year target of 1.5 million (Fig. 2.8). For children, the total was 8986, less than 10% of the 5-year target of 115 000.
In 70 countries, the number of people reported to have been enrolled in treatment for MDR/RR-TB increased by 10% or more between 2017 and 2019. The five countries with the biggest increases in absolute numbers were (in descending order) India, China, the Russian Federation, Indonesia and Angola. Of the 30 high MDR-TB burden countries, those with the smallest gaps between the esti-mated number of incident cases of MDR/RR-TB and the number of people enrolled on treatment in 2019 included Azerbaijan, Belarus, Kazakhstan, Peru, Republic of Mol-dova, the Russian Federation, South Africa and Ukraine.
1 On the assumption that all people diagnosed with TB who were officially notified to WHO were treated. Additional people whose TB diagnosis was not notified to national authorities and report-ed to WHO may also have been treated.
2 MDR-TB is defined as resistance to rifampicin (RR-TB) and iso-niazid, the two most effective first-line anti-TB drugs. WHO rec-ommends a treatment regimen that includes second-line drugs for people with MDR/RR-TB.
3 Additional people whose diagnosis of MDR/RR-TB was not noti-fied to national authorities and reported to WHO may also have been enrolled on treatment,
4 That is, the number of people started on treatment divided by the estimated number of incident cases in the same year.
FIG. 2.5
Percentage of people with TB and their households facing catastrophic costs in 17 national surveys completed since 2015The number in the centre of each circle is the pooled average figure across all surveys; the range is the minimum and maximum values in the 17 countries.
49%Range 19–83%
All peoplewith TB
44%Range 17–79%
80%Range 67–100%
People withdrug-susceptible TB
People withdrug-resistant TB
FIG. 2.6
The global number of people reported to have been treated for TB disease, 2015–2019
Mill
ions
2015 2016 2017 2018 2019
6
2
0
8
Adults aged 15 years and above Children aged under 15 years
4
FIG. 2.7
The global number of people reported to have been enrolled on treatment for MDR/RR-TB, 2015–2019Global data disaggregated by age are not available for the years before 2018.
Thou
sand
s
2015 2016 2017 2018 2019
150
50
0
200
Adults (15 years and above) or age not reported
Children aged under 15 years
100
All ages
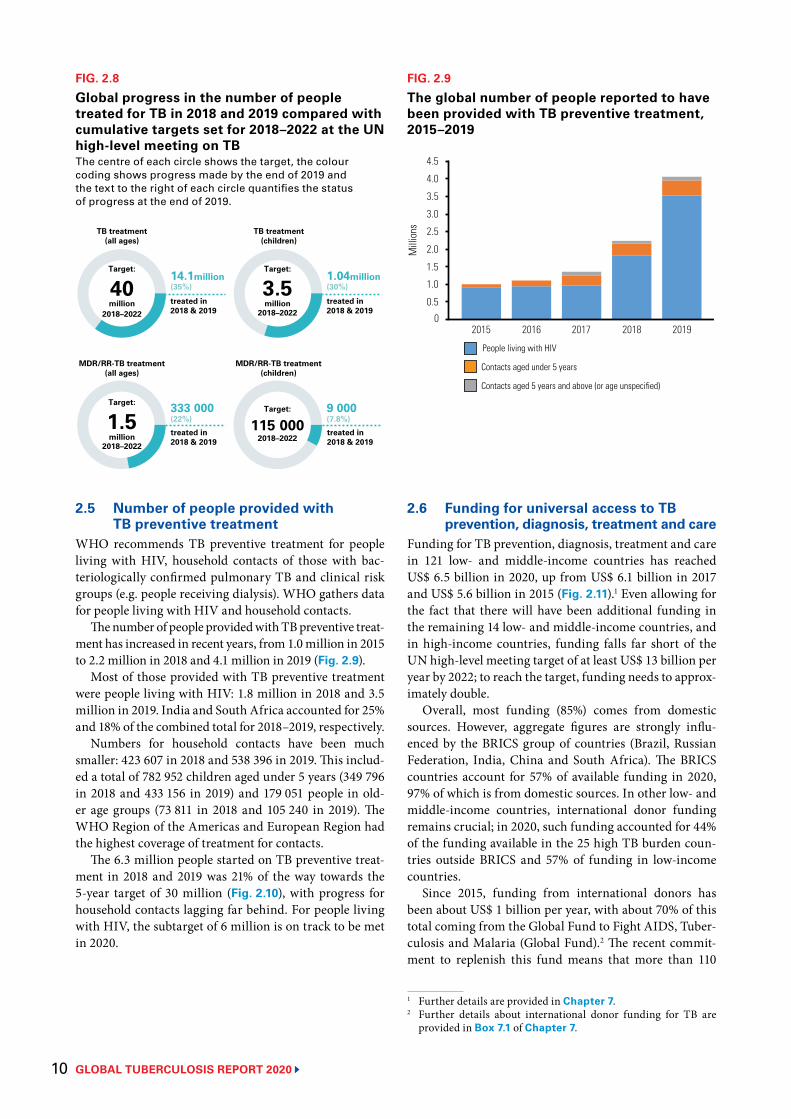
GLOBAL TUBERCULOSIS REPORT 2020 10
2.5 Number of people provided with TB preventive treatment
WHO recommends TB preventive treatment for people living with HIV, household contacts of those with bac-teriologically confirmed pulmonary TB and clinical risk groups (e.g. people receiving dialysis). WHO gathers data for people living with HIV and household contacts.
The number of people provided with TB preventive treat-ment has increased in recent years, from 1.0 million in 2015 to 2.2 million in 2018 and 4.1 million in 2019 (Fig. 2.9).
Most of those provided with TB preventive treatment were people living with HIV: 1.8 million in 2018 and 3.5 million in 2019. India and South Africa accounted for 25% and 18% of the combined total for 2018–2019, respectively.
Numbers for household contacts have been much smaller: 423 607 in 2018 and 538 396 in 2019. This includ-ed a total of 782 952 children aged under 5 years (349 796 in 2018 and 433 156 in 2019) and 179 051 people in old-er age groups (73 811 in 2018 and 105 240 in 2019). The WHO Region of the Americas and European Region had the highest coverage of treatment for contacts.
The 6.3 million people started on TB preventive treat-ment in 2018 and 2019 was 21% of the way towards the 5-year target of 30 million (Fig. 2.10), with progress for household contacts lagging far behind. For people living with HIV, the subtarget of 6 million is on track to be met in 2020.
FIG. 2.8
Global progress in the number of people treated for TB in 2018 and 2019 compared with cumulative targets set for 2018–2022 at the UN high-level meeting on TBThe centre of each circle shows the target, the colour coding shows progress made by the end of 2019 and the text to the right of each circle quantifies the status of progress at the end of 2019.
14.1million
treated in2018 & 2019
(35%)1.04million(30%)
9 000(7.8%)
333 000(22%)
TB treatment(all ages)
Target:
3.52018–2022
MDR/RR-TB treatment(all ages)
TB treatment(children)
MDR/RR-TB treatment(children)
treated in2018 & 2019
treated in2018 & 2019
treated in2018 & 2019
Target:
40million
2018–2022million
Target:
1.52018–2022
million
Target:
115 0002018–2022
FIG. 2.9
The global number of people reported to have been provided with TB preventive treatment, 2015–2019
Mill
ions
2015 2016 2017 2018 2019
1.5
0
4.5
People living with HIV
Contacts aged under 5 years
3.0
Contacts aged 5 years and above (or age unspecified)
0.5
2.0
1.0
2.5
4.0
3.5
2.6 Funding for universal access to TB prevention, diagnosis, treatment and care
Funding for TB prevention, diagnosis, treatment and care in 121 low- and middle-income countries has reached US$ 6.5 billion in 2020, up from US$ 6.1 billion in 2017 and US$ 5.6 billion in 2015 (Fig. 2.11).1 Even allowing for the fact that there will have been additional funding in the remaining 14 low- and middle-income countries, and in high-income countries, funding falls far short of the UN high-level meeting target of at least US$ 13 billion per year by 2022; to reach the target, funding needs to approx-imately double.
Overall, most funding (85%) comes from domestic sources. However, aggregate figures are strongly influ-enced by the BRICS group of countries (Brazil, Russian Federation, India, China and South Africa). The BRICS countries account for 57% of available funding in 2020, 97% of which is from domestic sources. In other low- and middle-income countries, international donor funding remains crucial; in 2020, such funding accounted for 44% of the funding available in the 25 high TB burden coun-tries outside BRICS and 57% of funding in low-income countries.
Since 2015, funding from international donors has been about US$ 1 billion per year, with about 70% of this total coming from the Global Fund to Fight AIDS, Tuber-culosis and Malaria (Global Fund).2 The recent commit-ment to replenish this fund means that more than 110
1 Further details are provided in Chapter 7.2 Further details about international donor funding for TB are
provided in Box 7.1 of Chapter 7.
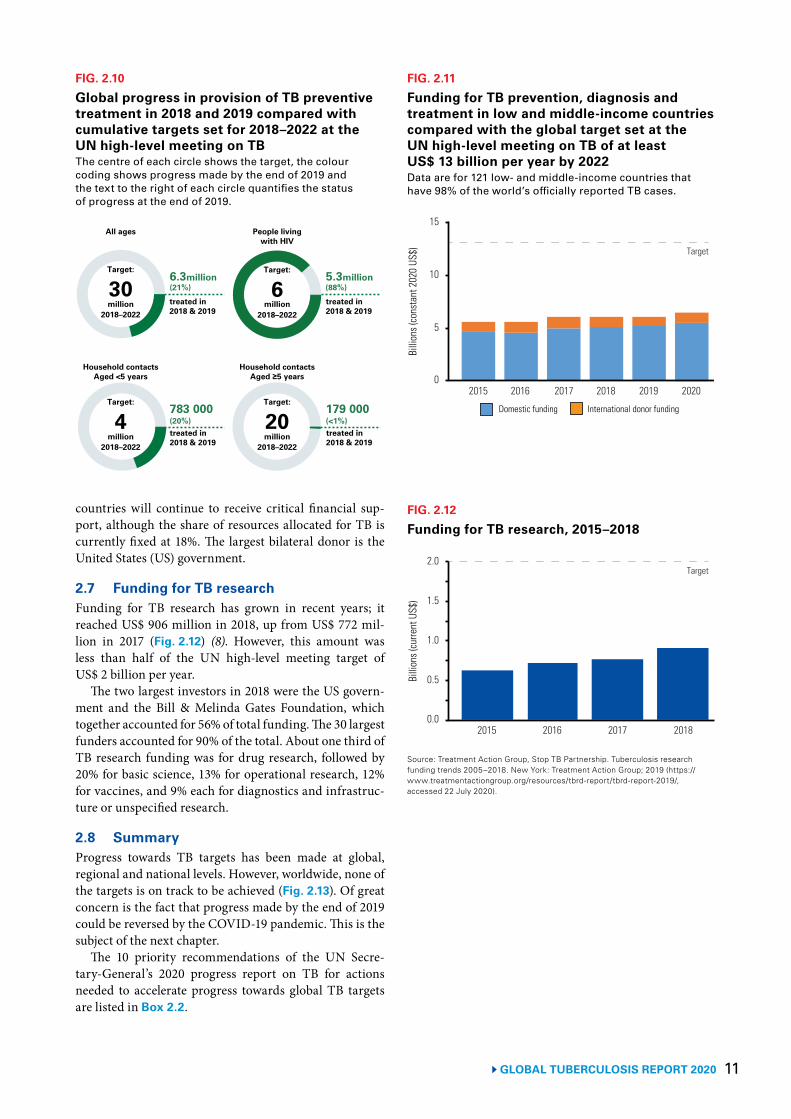
11GLOBAL TUBERCULOSIS REPORT 2020
countries will continue to receive critical financial sup-port, although the share of resources allocated for TB is currently fixed at 18%. The largest bilateral donor is the United States (US) government.
2.7 Funding for TB research Funding for TB research has grown in recent years; it reached US$ 906 million in 2018, up from US$ 772 mil-lion in 2017 (Fig. 2.12) (8). However, this amount was less than half of the UN high-level meeting target of US$ 2 billion per year.
The two largest investors in 2018 were the US govern-ment and the Bill & Melinda Gates Foundation, which together accounted for 56% of total funding. The 30 largest funders accounted for 90% of the total. About one third of TB research funding was for drug research, followed by 20% for basic science, 13% for operational research, 12% for vaccines, and 9% each for diagnostics and infrastruc-ture or unspecified research.
2.8 SummaryProgress towards TB targets has been made at global, regional and national levels. However, worldwide, none of the targets is on track to be achieved (Fig. 2.13). Of great concern is the fact that progress made by the end of 2019 could be reversed by the COVID-19 pandemic. This is the subject of the next chapter.
The 10 priority recommendations of the UN Secre-tary-General’s 2020 progress report on TB for actions needed to accelerate progress towards global TB targets are listed in Box 2.2.
FIG. 2.10
Global progress in provision of TB preventive treatment in 2018 and 2019 compared with cumulative targets set for 2018–2022 at the UN high-level meeting on TBThe centre of each circle shows the target, the colour coding shows progress made by the end of 2019 and the text to the right of each circle quantifies the status of progress at the end of 2019.
6.3million(21%)
5.3million(88%)
783 000(20%)
179 000(<1%)
All ages People livingwith HIV
Household contactsAged <5 years
Household contactsAged ≥5 years
treated in2018 & 2019
treated in2018 & 2019
treated in2018 & 2019
treated in2018 & 2019
Target:
30million
2018–2022
Target:
6million
2018–2022
Target:
4million
2018–2022
Target:
20million
2018–2022
FIG. 2.11
Funding for TB prevention, diagnosis and treatment in low and middle-income countries compared with the global target set at the UN high-level meeting on TB of at least US$ 13 billion per year by 2022Data are for 121 low- and middle-income countries that have 98% of the world’s officially reported TB cases.
Billi
ons (
cons
tant
202
0 US
$)
2015 2016 2017 2018 2019 2020
10
5
0
15
Target
Domestic funding International donor funding
FIG. 2.12
Funding for TB research, 2015–2018
Billi
ons (
curre
nt U
S$)
2015 2016 2017 2018
1.0
0.5
0.0
2.0
1.5
Target
Source: Treatment Action Group, Stop TB Partnership. Tuberculosis research funding trends 2005–2018. New York: Treatment Action Group; 2019 (https://www.treatmentactiongroup.org/resources/tbrd-report/tbrd-report-2019/, accessed 22 July 2020).
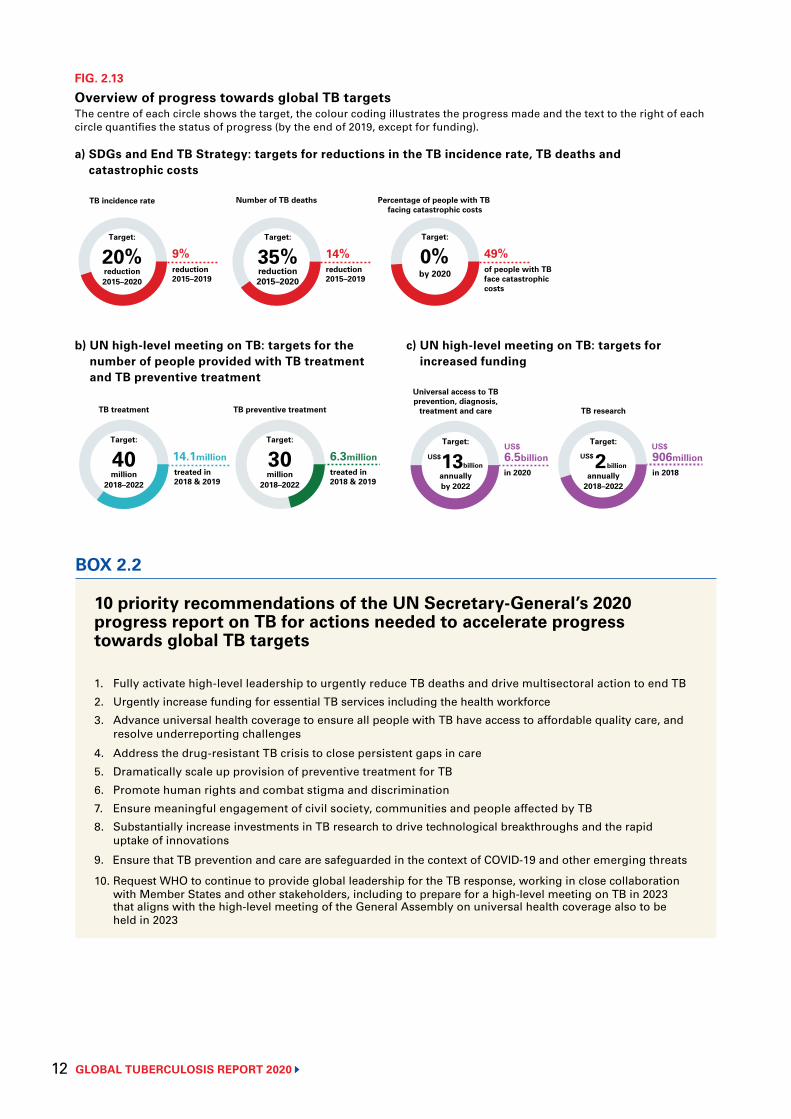
GLOBAL TUBERCULOSIS REPORT 2020 12
b) UN high-level meeting on TB: targets for thenumber of people provided with TB treatmentand TB preventive treatment
14.1million
Target:
40million
2018–2022
TB treatment
6.3million
Target:
30million
2018–2022
TB preventive treatment
treated in2018 & 2019
treated in2018 & 2019
FIG. 2.13
Overview of progress towards global TB targetsThe centre of each circle shows the target, the colour coding illustrates the progress made and the text to the right of each circle quantifies the status of progress (by the end of 2019, except for funding).
c) UN high-level meeting on TB: targets forincreased funding
6.5billionin 2020
906millionin 2018
Universal access to TBprevention, diagnosis,
treatment and care TB research
Target:
13annuallyby 2022
US$billion
US$ US$Target:
2annually
2018–2022
US$billion
9%Target:
20%reduction2015–2020
reduction2015–2019
TB incidence rate
Target:
35%reduction2015–2020
Number of TB deaths Percentage of people with TB facing catastrophic costs
0%Target:
by 2020
14%reduction2015–2019
49%of people with TBface catastrophiccosts
a) SDGs and End TB Strategy: targets for reductions in the TB incidence rate, TB deaths andcatastrophic costs
10 priority recommendations of the UN Secretary-General’s 2020 progress report on TB for actions needed to accelerate progress towards global TB targets
1. Fully activate high-level leadership to urgently reduce TB deaths and drive multisectoral action to end TB
2. Urgently increase funding for essential TB services including the health workforce
3. Advance universal health coverage to ensure all people with TB have access to affordable quality care, and resolve underreporting challenges
4. Address the drug-resistant TB crisis to close persistent gaps in care
5. Dramatically scale up provision of preventive treatment for TB
6. Promote human rights and combat stigma and discrimination
7. Ensure meaningful engagement of civil society, communities and people affected by TB
8. Substantially increase investments in TB research to drive technological breakthroughs and the rapid uptake of innovations
9. Ensure that TB prevention and care are safeguarded in the context of COVID-19 and other emerging threats
10. Request WHO to continue to provide global leadership for the TB response, working in close collaboration with Member States and other stakeholders, including to prepare for a high-level meeting on TB in 2023 that aligns with the high-level meeting of the General Assembly on universal health coverage also to be held in 2023
BOX 2.2
13 GLOBAL TUBERCULOSIS REPORT 2020
References1 Sustainable development goals [website]. New York: United Nations;
(https://sustainabledevelopment.un.org/topics/sustainabledevelopmentgoals, accessed 20 July 2020).2 World Health Organization. Resolution WHA67.1. Global strategy and targets for tuberculosis prevention,
care and control after 2015. Geneva: World Health Organization; 2014 (http://apps.who.int/gb/ebwha/pdf_files/WHA67/A67_R1-en.pdf, accessed 20 July 2020)
3 Floyd K, Glaziou P, Houben R, Sumner T, White RG, Raviglione M. Global tuberculosis targets and milestones set for 2016-2035: definition and rationale. Int J Tuberc Lung Dis. 2018;22(7):723–30 (https://www.ncbi.nlm.nih.gov/pubmed/29914597, accessed 20 July 2020).
4 United Nations General Assembly. Resolution 73/3: Political declaration of the high-level meeting of the General Assembly on the fight against tuberculosis. United Nations; 2018 (https://www.un.org/en/ga/search/view_doc.asp?symbol=A/RES/73/3, accessed 20 July 2020).
5 The Global Plan to End TB, 2018–2022. Geneva: Stop TB Partnership; 2019 (http://stoptb.org/global/plan/plan1822.asp, accessed 20 July 2020).
6 Report of the Secretary-General. Progress towards achieving global tuberculosis targets and implementation of the UN political declaration on tuberculosis. Seventy-fifth session. Agenda Item 132. Global health and foreign policy. United Nations; 2020 (https://undocs.org/en/A/75/236, accessed 24 September 2020).
7 World Health Organization. Global Health Estimates 2016: Deaths by Cause, Age, Sex, by Country and by Region, 2000-2016. Geneva, World Health Organization 2018. (https://www.who.int/news-room/fact-sheets/detail/the-top-10-causes-of-death, accessed 20 July 2020).
8 Treatment Action Group, Stop TB Partnership. Tuberculosis research funding trends 2005–2018. New York: Treatment Action Group; 2019 (https://www.treatmentactiongroup.org/resources/tbrd-report/tbrd-report-2019/, accessed 20 July 2020).
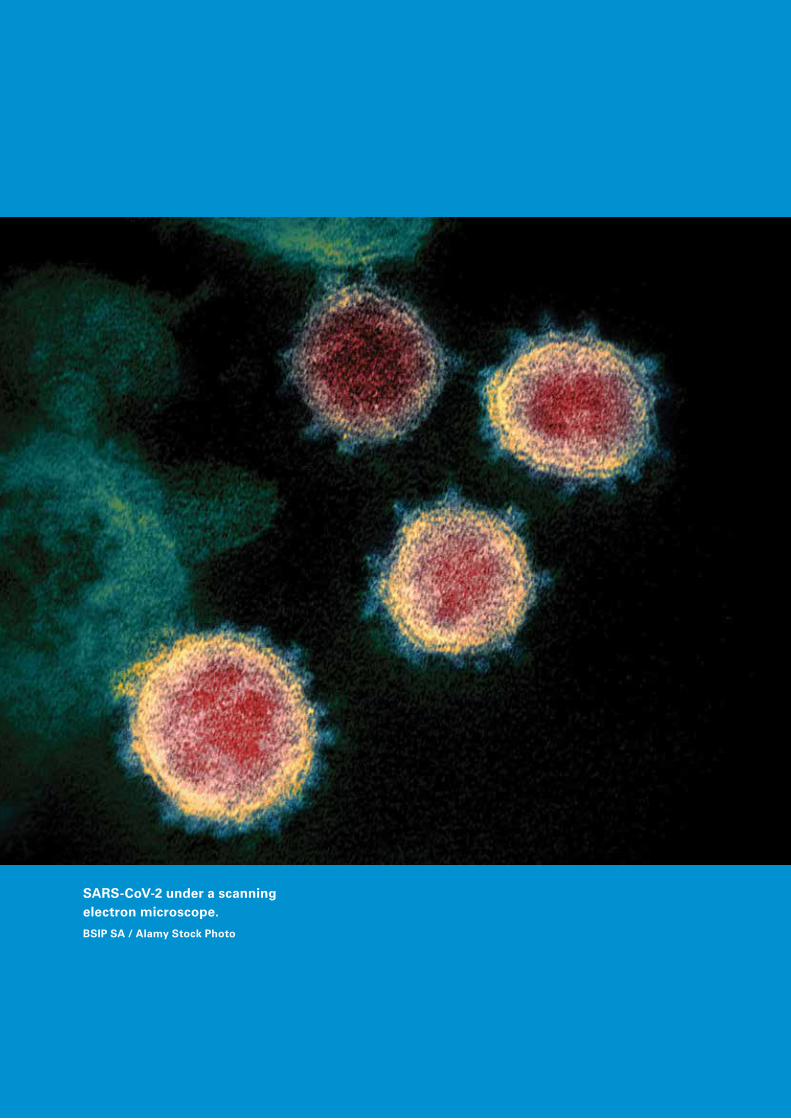
GLOBAL TUBERCULOSIS REPORT 2020 14
SARS-CoV-2 under a scanning electron microscope.BSIP SA / Alamy Stock Photo
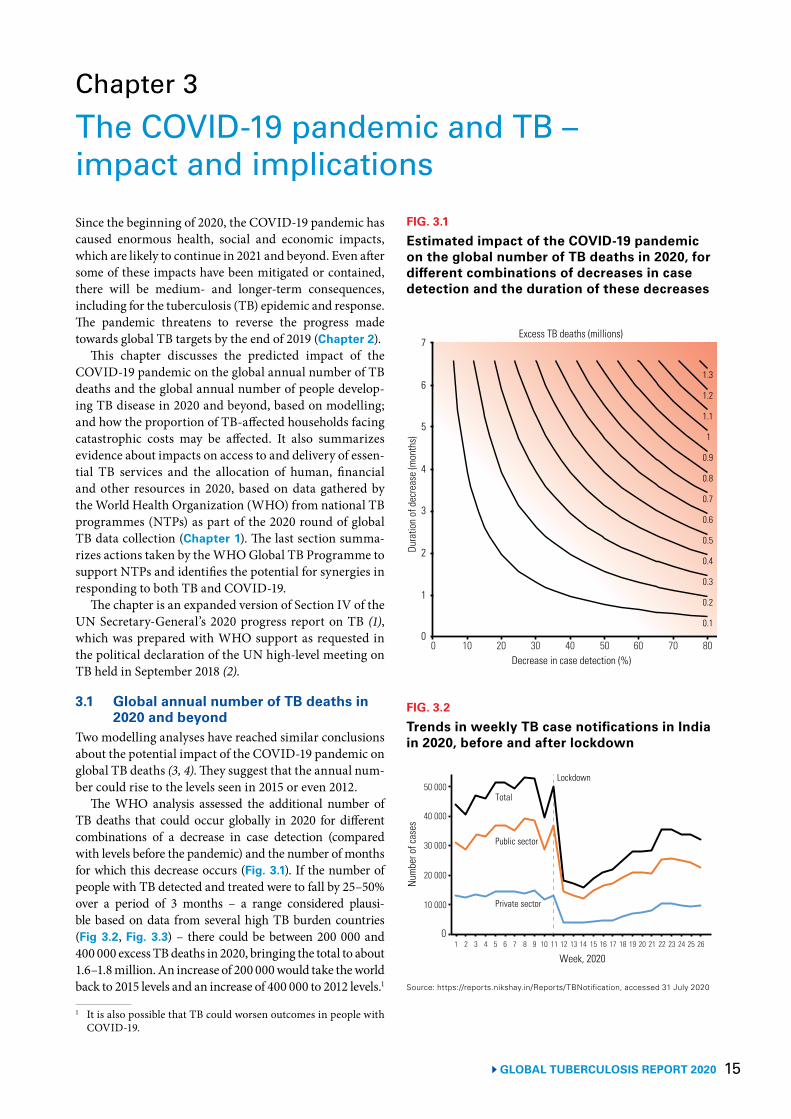
15 GLOBAL TUBERCULOSIS REPORT 2020
Chapter 3
The COVID-19 pandemic and TB – impact and implications Since the beginning of 2020, the COVID-19 pandemic has caused enormous health, social and economic impacts, which are likely to continue in 2021 and beyond. Even after some of these impacts have been mitigated or contained, there will be medium- and longer-term consequences, including for the tuberculosis (TB) epidemic and response. The pandemic threatens to reverse the progress made towards global TB targets by the end of 2019 (Chapter 2).
This chapter discusses the predicted impact of the COVID-19 pandemic on the global annual number of TB deaths and the global annual number of people develop-ing TB disease in 2020 and beyond, based on modelling; and how the proportion of TB-affected households facing catastrophic costs may be affected. It also summarizes evidence about impacts on access to and delivery of essen-tial TB services and the allocation of human, financial and other resources in 2020, based on data gathered by the World Health Organization (WHO) from national TB programmes (NTPs) as part of the 2020 round of global TB data collection (Chapter 1). The last section summa-rizes actions taken by the WHO Global TB Programme to support NTPs and identifies the potential for synergies in responding to both TB and COVID-19.
The chapter is an expanded version of Section IV of the UN Secretary-General’s 2020 progress report on TB (1), which was prepared with WHO support as requested in the political declaration of the UN high-level meeting on TB held in September 2018 (2).
3.1 Global annual number of TB deaths in 2020 and beyond
Two modelling analyses have reached similar conclusions about the potential impact of the COVID-19 pandemic on global TB deaths (3, 4). They suggest that the annual num-ber could rise to the levels seen in 2015 or even 2012.
The WHO analysis assessed the additional number of TB deaths that could occur globally in 2020 for different combinations of a decrease in case detection (compared with levels before the pandemic) and the number of months for which this decrease occurs (Fig. 3.1). If the number of people with TB detected and treated were to fall by 25–50% over a period of 3 months – a range considered plausi-ble based on data from several high TB burden countries (Fig 3.2, Fig. 3.3) – there could be between 200 000 and 400 000 excess TB deaths in 2020, bringing the total to about 1.6–1.8 million. An increase of 200 000 would take the world back to 2015 levels and an increase of 400 000 to 2012 levels.1
1 It is also possible that TB could worsen outcomes in people with COVID-19.
FIG. 3.1
Estimated impact of the COVID-19 pandemic on the global number of TB deaths in 2020, for different combinations of decreases in case detection and the duration of these decreases
0.1
1
1.1
1.2
1.3
0.2
0.3
0.4
0.5
0.6
0.7
0.8
0.9
Decrease in case detection (%)
Dura
tion
of d
ecre
ase
(mon
ths)
Excess TB deaths (millions)
1
0
2
3
4
5
6
7
0 10 20 30 40 50 60 70 80
FIG. 3.2
Trends in weekly TB case notifications in India in 2020, before and after lockdown
Public sector
Num
ber o
f cas
es
1 2 3 4 5 6 7 8 9 10 11 12 13 14 15 16 17 18 19 20 21 22 23 24 25 26
20 000
10 000
0
40 000
50 000
Private sector
Total
30 000
Week, 2020
Lockdown
Source: https://reports.nikshay.in/Reports/TBNotification, accessed 31 July 2020
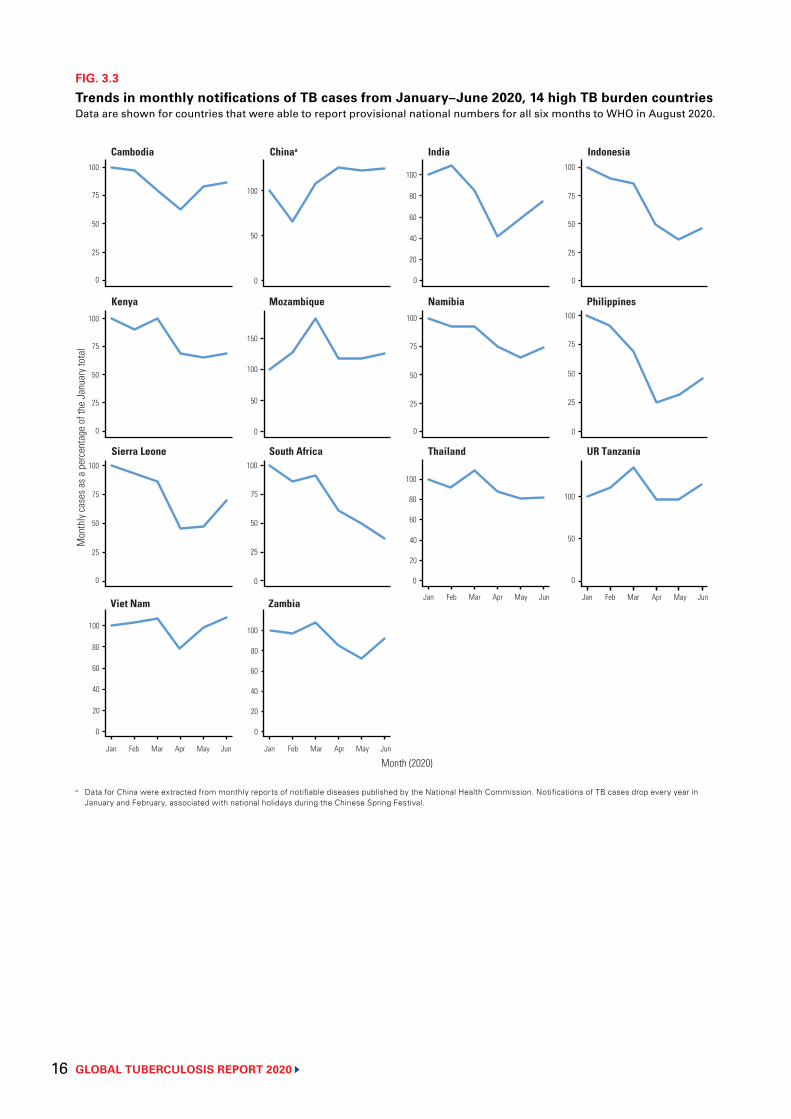
GLOBAL TUBERCULOSIS REPORT 2020 16
FIG. 3.3
Trends in monthly notifications of TB cases from January–June 2020, 14 high TB burden countriesData are shown for countries that were able to report provisional national numbers for all six months to WHO in August 2020.
a Data for China were extracted from monthly reports of notifiable diseases published by the National Health Commission. Notifications of TB cases drop every year in January and February, associated with national holidays during the Chinese Spring Festival.
Mon
thly
case
s as a
per
cent
age
of th
e Ja
nuar
y tot
al
Sierra Leone South Africa Thailand UR Tanzania
Jan Feb Mar Apr May Jun Jan Feb Mar Apr May Jun
Jan Feb Mar Apr May Jun Jan Feb Mar Apr May Jun
75
50
25
100
75
50
25
0
100
50
0
80
40
20
80
60
20
Month (2020)
Viet Nam Zambia
0
0 0
Cambodia Chinaa India Indonesia
75
50
25
100
40
20
0
80 75
50
25
100
50
100
0 0 0
Kenya Mozambique Namibia Philippines
75
50
25
100
150
100
50
0
75
50
25
100
75
50
0 0
25
0
80
60
20
0
100
100
100100
100
100
60
40
60
40
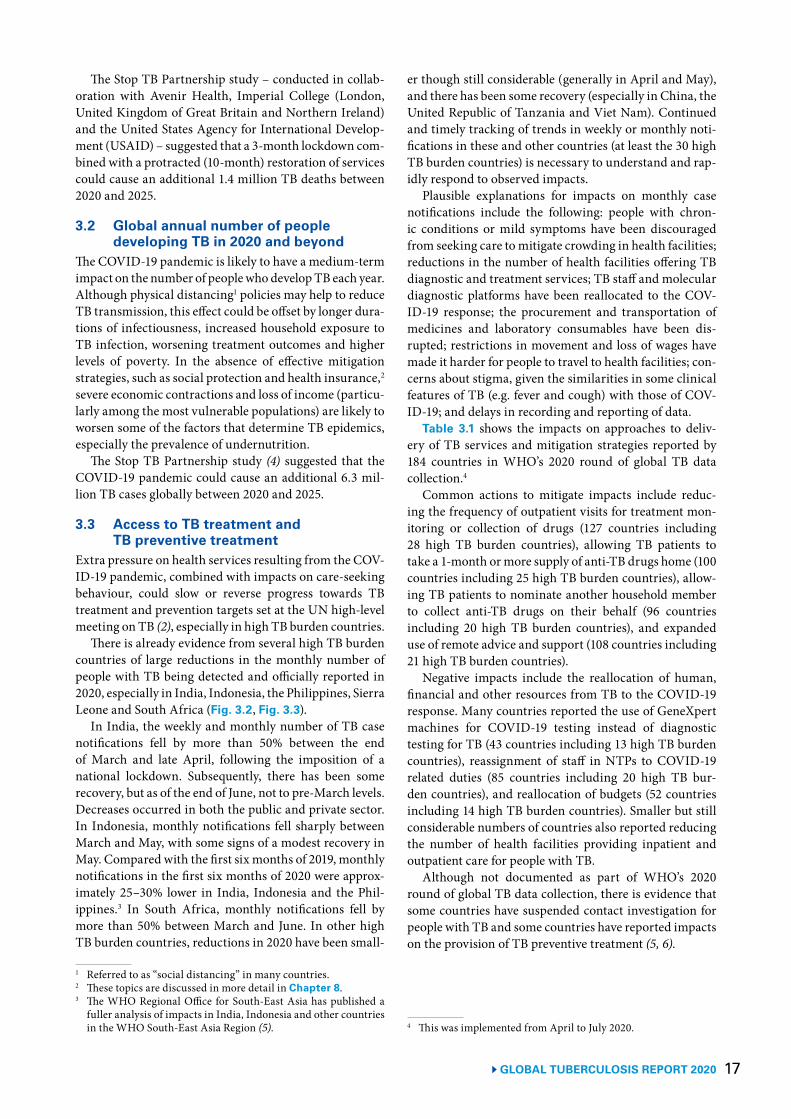
17 GLOBAL TUBERCULOSIS REPORT 2020
The Stop TB Partnership study – conducted in collab-oration with Avenir Health, Imperial College (London, United Kingdom of Great Britain and Northern Ireland) and the United States Agency for International Develop-ment (USAID) – suggested that a 3-month lockdown com-bined with a protracted (10-month) restoration of services could cause an additional 1.4 million TB deaths between 2020 and 2025.
3.2 Global annual number of people developing TB in 2020 and beyond
The COVID-19 pandemic is likely to have a medium-term impact on the number of people who develop TB each year. Although physical distancing1 policies may help to reduce TB transmission, this effect could be offset by longer dura-tions of infectiousness, increased household exposure to TB infection, worsening treatment outcomes and higher levels of poverty. In the absence of effective mitigation strategies, such as social protection and health insurance,2 severe economic contractions and loss of income (particu-larly among the most vulnerable populations) are likely to worsen some of the factors that determine TB epidemics, especially the prevalence of undernutrition.
The Stop TB Partnership study (4) suggested that the COVID-19 pandemic could cause an additional 6.3 mil-lion TB cases globally between 2020 and 2025.
3.3 Access to TB treatment and TB preventive treatment
Extra pressure on health services resulting from the COV-ID-19 pandemic, combined with impacts on care-seeking behaviour, could slow or reverse progress towards TB treatment and prevention targets set at the UN high-level meeting on TB (2), especially in high TB burden countries.
There is already evidence from several high TB burden countries of large reductions in the monthly number of people with TB being detected and officially reported in 2020, especially in India, Indonesia, the Philippines, Sierra Leone and South Africa (Fig. 3.2, Fig. 3.3).
In India, the weekly and monthly number of TB case notifications fell by more than 50% between the end of March and late April, following the imposition of a national lockdown. Subsequently, there has been some recovery, but as of the end of June, not to pre-March levels. Decreases occurred in both the public and private sector. In Indonesia, monthly notifications fell sharply between March and May, with some signs of a modest recovery in May. Compared with the first six months of 2019, monthly notifications in the first six months of 2020 were approx-imately 25–30% lower in India, Indonesia and the Phil-ippines.3 In South Africa, monthly notifications fell by more than 50% between March and June. In other high TB burden countries, reductions in 2020 have been small-
1 Referred to as “social distancing” in many countries.2 These topics are discussed in more detail in Chapter 8. 3 The WHO Regional Office for South-East Asia has published a
fuller analysis of impacts in India, Indonesia and other countries in the WHO South-East Asia Region (5).
er though still considerable (generally in April and May), and there has been some recovery (especially in China, the United Republic of Tanzania and Viet Nam). Continued and timely tracking of trends in weekly or monthly noti-fications in these and other countries (at least the 30 high TB burden countries) is necessary to understand and rap-idly respond to observed impacts.
Plausible explanations for impacts on monthly case notifications include the following: people with chron-ic conditions or mild symptoms have been discouraged from seeking care to mitigate crowding in health facilities; reductions in the number of health facilities offering TB diagnostic and treatment services; TB staff and molecular diagnostic platforms have been reallocated to the COV-ID-19 response; the procurement and transportation of medicines and laboratory consumables have been dis-rupted; restrictions in movement and loss of wages have made it harder for people to travel to health facilities; con-cerns about stigma, given the similarities in some clinical features of TB (e.g. fever and cough) with those of COV-ID-19; and delays in recording and reporting of data.
Table 3.1 shows the impacts on approaches to deliv-ery of TB services and mitigation strategies reported by 184 countries in WHO’s 2020 round of global TB data collection.4
Common actions to mitigate impacts include reduc-ing the frequency of outpatient visits for treatment mon-itoring or collection of drugs (127 countries including 28 high TB burden countries), allowing TB patients to take a 1-month or more supply of anti-TB drugs home (100 countries including 25 high TB burden countries), allow-ing TB patients to nominate another household member to collect anti-TB drugs on their behalf (96 countries including 20 high TB burden countries), and expanded use of remote advice and support (108 countries including 21 high TB burden countries).
Negative impacts include the reallocation of human, financial and other resources from TB to the COVID-19 response. Many countries reported the use of GeneXpert machines for COVID-19 testing instead of diagnostic testing for TB (43 countries including 13 high TB burden countries), reassignment of staff in NTPs to COVID-19 related duties (85 countries including 20 high TB bur-den countries), and reallocation of budgets (52 countries including 14 high TB burden countries). Smaller but still considerable numbers of countries also reported reducing the number of health facilities providing inpatient and outpatient care for people with TB.
Although not documented as part of WHO’s 2020 round of global TB data collection, there is evidence that some countries have suspended contact investigation for people with TB and some countries have reported impacts on the provision of TB preventive treatment (5, 6).
4 This was implemented from April to July 2020.
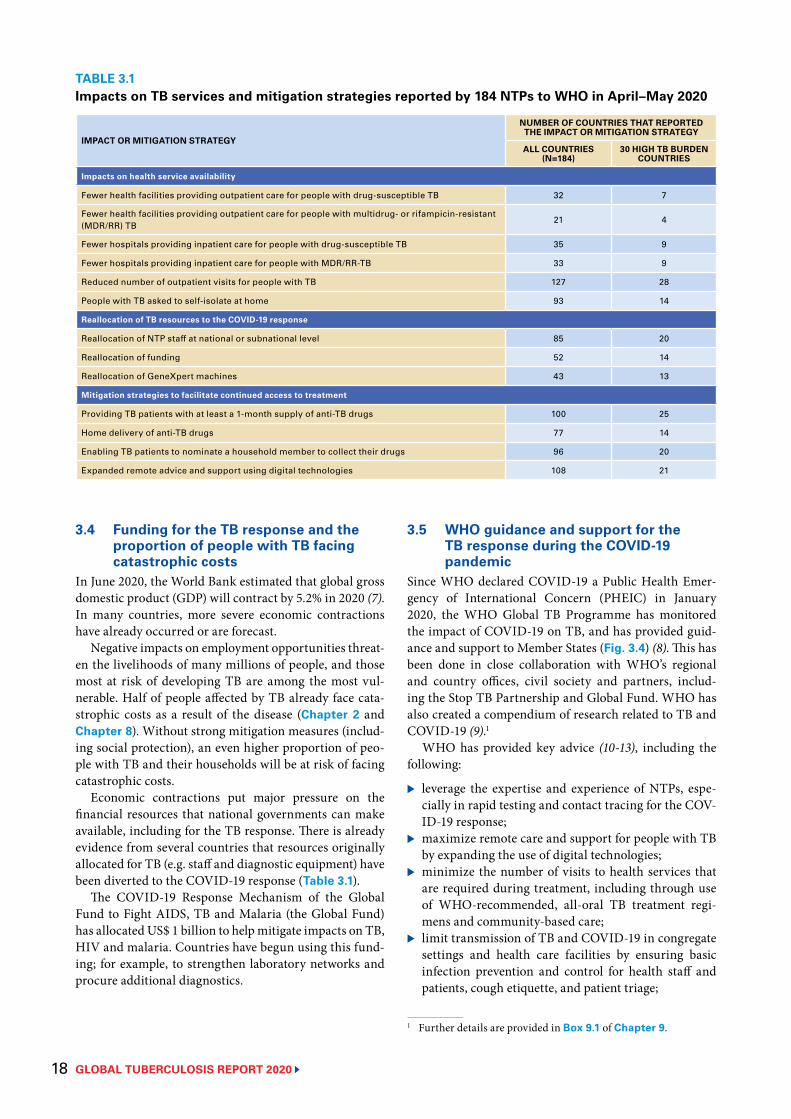
GLOBAL TUBERCULOSIS REPORT 2020 18
3.4 Funding for the TB response and the proportion of people with TB facing catastrophic costs
In June 2020, the World Bank estimated that global gross domestic product (GDP) will contract by 5.2% in 2020 (7). In many countries, more severe economic contractions have already occurred or are forecast.
Negative impacts on employment opportunities threat-en the livelihoods of many millions of people, and those most at risk of developing TB are among the most vul-nerable. Half of people affected by TB already face cata-strophic costs as a result of the disease (Chapter 2 and Chapter 8). Without strong mitigation measures (includ-ing social protection), an even higher proportion of peo-ple with TB and their households will be at risk of facing catastrophic costs.
Economic contractions put major pressure on the financial resources that national governments can make available, including for the TB response. There is already evidence from several countries that resources originally allocated for TB (e.g. staff and diagnostic equipment) have been diverted to the COVID-19 response (Table 3.1).
The COVID-19 Response Mechanism of the Global Fund to Fight AIDS, TB and Malaria (the Global Fund) has allocated US$ 1 billion to help mitigate impacts on TB, HIV and malaria. Countries have begun using this fund-ing; for example, to strengthen laboratory networks and procure additional diagnostics.
TABLE 3.1Impacts on TB services and mitigation strategies reported by 184 NTPs to WHO in April–May 2020
IMPACT OR MITIGATION STRATEGY
NUMBER OF COUNTRIES THAT REPORTED THE IMPACT OR MITIGATION STRATEGY
ALL COUNTRIES (N=184)
30 HIGH TB BURDEN COUNTRIES
Impacts on health service availability
Fewer health facilities providing outpatient care for people with drug-susceptible TB 32 7
Fewer health facilities providing outpatient care for people with multidrug- or rifampicin-resistant (MDR/RR) TB
21 4
Fewer hospitals providing inpatient care for people with drug-susceptible TB 35 9
Fewer hospitals providing inpatient care for people with MDR/RR-TB 33 9
Reduced number of outpatient visits for people with TB 127 28
People with TB asked to self-isolate at home 93 14
Reallocation of TB resources to the COVID-19 response
Reallocation of NTP staff at national or subnational level 85 20
Reallocation of funding 52 14
Reallocation of GeneXpert machines 43 13
Mitigation strategies to facilitate continued access to treatment
Providing TB patients with at least a 1-month supply of anti-TB drugs 100 25
Home delivery of anti-TB drugs 77 14
Enabling TB patients to nominate a household member to collect their drugs 96 20
Expanded remote advice and support using digital technologies 108 21
3.5 WHO guidance and support for the TB response during the COVID-19 pandemic
Since WHO declared COVID-19 a Public Health Emer-gency of International Concern (PHEIC) in January 2020, the WHO Global TB Programme has monitored the impact of COVID-19 on TB, and has provided guid-ance and support to Member States (Fig. 3.4) (8). This has been done in close collaboration with WHO’s regional and country offices, civil society and partners, includ-ing the Stop TB Partnership and Global Fund. WHO has also created a compendium of research related to TB and COVID-19 (9).1
WHO has provided key advice (10-13), including the following:
▶ leverage the expertise and experience of NTPs, espe-cially in rapid testing and contact tracing for the COV-ID-19 response;
▶ maximize remote care and support for people with TB by expanding the use of digital technologies;
▶ minimize the number of visits to health services that are required during treatment, including through use of WHO-recommended, all-oral TB treatment regi-mens and community-based care;
▶ limit transmission of TB and COVID-19 in congregate settings and health care facilities by ensuring basic infection prevention and control for health staff and patients, cough etiquette, and patient triage;
1 Further details are provided in Box 9.1 of Chapter 9.
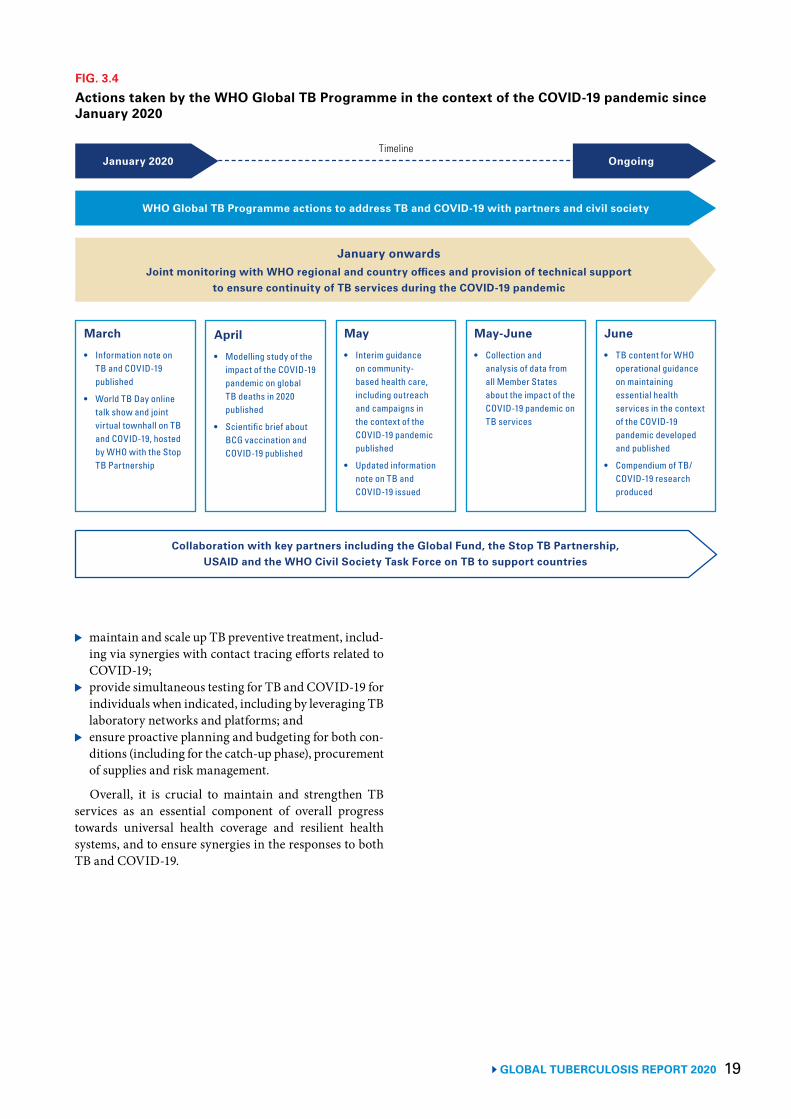
19 GLOBAL TUBERCULOSIS REPORT 2020
FIG. 3.4
Actions taken by the WHO Global TB Programme in the context of the COVID-19 pandemic since January 2020
March
• Information note on TB and COVID-19 published
• World TB Day online talk show and joint virtual townhall on TB and COVID-19, hosted by WHO with the Stop TB Partnership
January onwardsJoint monitoring with WHO regional and country offices and provision of technical support
to ensure continuity of TB services during the COVID-19 pandemic
WHO Global TB Programme actions to address TB and COVID-19 with partners and civil society
Collaboration with key partners including the Global Fund, the Stop TB Partnership, USAID and the WHO Civil Society Task Force on TB to support countries
January 2020 OngoingTimeline
April
• Modelling study of the impact of the COVID-19 pandemic on global TB deaths in 2020 published
• Scientific brief about BCG vaccination and COVID-19 published
May
• Interim guidance on community-based health care, including outreach and campaigns in the context of the COVID-19 pandemic published
• Updated information note on TB and COVID-19 issued
May-June
• Collection and analysis of data from all Member States about the impact of the COVID-19 pandemic on TB services
June
• TB content for WHO operational guidance on maintaining essential health services in the context of the COVID-19 pandemic developed and published
• Compendium of TB/COVID-19 research produced
▶ maintain and scale up TB preventive treatment, includ-ing via synergies with contact tracing efforts related to COVID-19;
▶ provide simultaneous testing for TB and COVID-19 for individuals when indicated, including by leveraging TB laboratory networks and platforms; and
▶ ensure proactive planning and budgeting for both con-ditions (including for the catch-up phase), procurement of supplies and risk management.
Overall, it is crucial to maintain and strengthen TB services as an essential component of overall progress towards universal health coverage and resilient health systems, and to ensure synergies in the responses to both TB and COVID-19.
GLOBAL TUBERCULOSIS REPORT 2020 20
References1 Report of the Secretary-General. Progress towards achieving global tuberculosis targets and implementation of
the UN political declaration on tuberculosis. Seventy-fifth session. Agenda Item 132. Global health and foreign policy. United Nations; 2020 (https://undocs.org/en/A/75/236, accessed 24 September 2020).
2 United Nations General Assembly. Resolution 73/3: Political declaration of the high-level meeting of the General Assembly on the fight against tuberculosis. United Nations; 2018 (https://www.un.org/en/ga/search/view_doc.asp?symbol=A/RES/73/3, accessed 20 July 2020).
3 Glaziou P. Predicted impact of the COVID-19 pandemic on global tuberculosis deaths in 2020 [Preprint]. (https://www.medrxiv.org/content/10.1101/2020.04.28.20079582v1, accessed 5 August 2020).
4 The potential impact of the COVID-19 response on tuberculosis in high-burden countries: a modelling analysis. Geneva: Stop TB Partnership in collaboration with Imperial College, Avenir Health, Johns Hopkins University and USAID; 2020 (http://stoptb.org/assets/documents/news/Modeling%20Report_1%20May%202020_FINAL.pdf, accessed 5 August 2020).
5 Bhatia V, Mandal P, Satyanarayana S, Aditama T, Sharma M. Mitigating the impact of the COVID-19 pandemic on progress towards ending tuberculosis in the WHO South-East Asia Region. WHO South-East Asia Journal of Public Health; 9(2); September 2020.
6 Supporting TB preventive therapy for clients accessing DSD during COVID-19. CQUIN DSD and COVID-19 webinar series. HIV Learning Network; 2020 (https://cquin.icap.columbia.edu/wp-content/uploads/2020/05/TPT-DSD-COVID-26May_Master-deck_English_low-rest.pdf, accessed 27 July 2020).
7 Global economic prospects, June 2020. Washington, DC: World Bank; 2020 (https://www.worldbank.org/en/publication/global-economic-prospects, accessed 20 July 2020).
8 Tuberculosis and COVID-19. Geneva: World Health Organization; 2020 (https://www.who.int/teams/global-tuberculosis-programme/covid-19, accessed 27 July 2020).
9 Compendium of TB/COVID-19 studies. Geneva: World Health Organization; 2020 (https://www.who.int/teams/global-tuberculosis-programme/covid-19/compendium, accessed 5 August 2020).
10 World Health Organization (WHO) information note. tuberculosis and COVID-19. Geneva: World Health Organization; 2020 (https://www.who.int/tb/COVID_19considerations_tuberculosis_services.pdf, accessed 27 July 2020).
11 Bacille Calmette-Guérin (BCG) vaccination and COVID-19. Geneva: World Health Organization; 2020 (https://www.who.int/news-room/commentaries/detail/bacille-calmette-guérin-(bcg)-vaccination-and-covid-19, accessed 27 July 2020).
12 Maintaining essential health services: operational guidance for the COVID-19 context. Geneva: World Health Organization; 2020 (https://www.who.int/publications/i/item/WHO-2019-nCoV-essential-health-services-2020.1, accessed 27 July 2020).
13 Community-based health care, including outreach and campaigns, in the context of the COVID-19 pandemic: interim guidance. Geneva: World Health Organization; 2020 (https://www.who.int/publications/i/item/community-based-health-care-including-outreach-and-campaigns-in-the-context-of-the-covid-19-pandemic, accessed 27 July 2020).

21 GLOBAL TUBERCULOSIS REPORT 2020
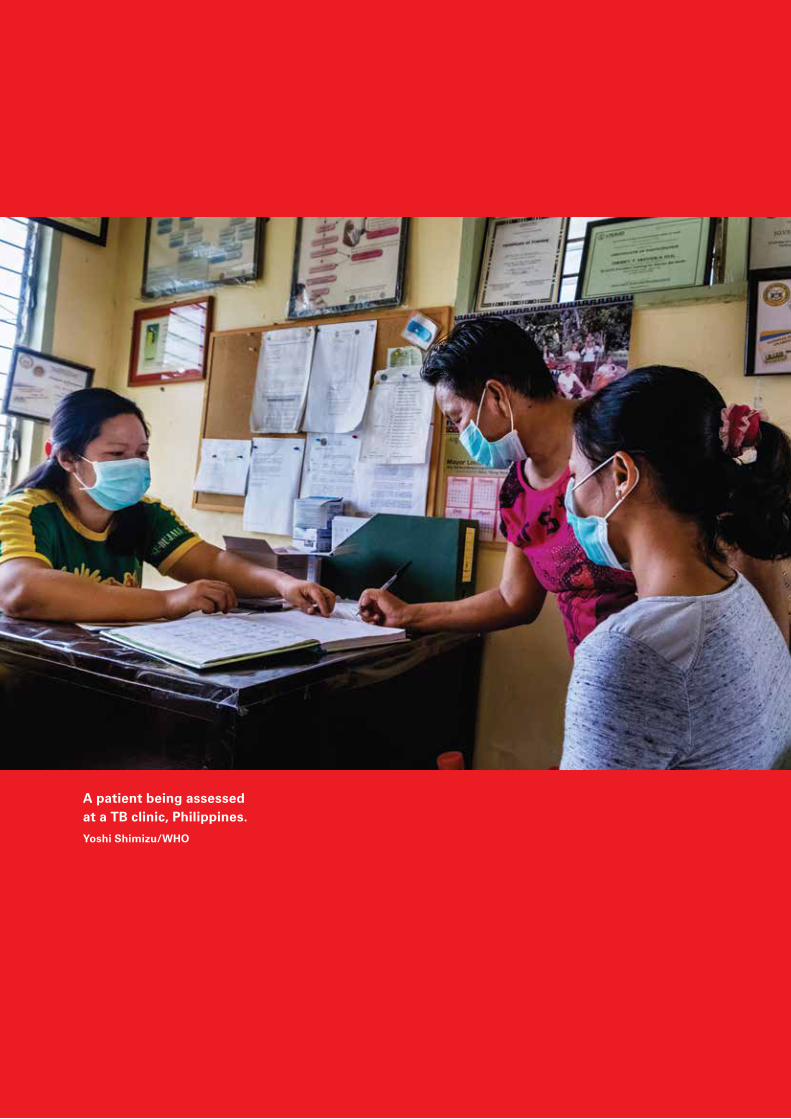
GLOBAL TUBERCULOSIS REPORT 2020 22
A patient being assessed at a TB clinic, Philippines.Yoshi Shimizu/WHO
23 GLOBAL TUBERCULOSIS REPORT 2020
Chapter 4
TB disease burden
Key facts and messagesTuberculosis (TB) is a major cause of ill health, one of the top 10 causes of death worldwide and the leading cause of death from a single infectious agent (ranking above HIV/AIDS since 2007).
Globally in 2019, an estimated 10.0 million (range, 8.9–11.0 million) people fell ill with TB. There were 1.2 million (range, 1.1–1.3 million) TB deaths among HIV-negative people and an additional 208 000 deaths (range, 177 000–242 000) among HIV-positive people.a
TB affects people of both sexes and all age groups, but the highest burden is in adult men, who accounted for 56% of all TB cases in 2019; by comparison, adult women accounted for 32% and children for 12%. Among all TB cases, 8.2% were among people living with HIV.
Geographically, in 2019, most TB cases were in the World Health Organization (WHO) regions of South-East Asia (44%), Africa (25%) and the Western Pacific (18%), with smaller shares in the Eastern Mediterranean (8.2%), the Americas (2.9%) and Europe (2.5%). Eight countries accounted for two thirds of the global total: India (26%), Indonesia (8.5%), China (8.4%), the Philippines (6.0%), Pakistan (5.7%), Nigeria (4.4%), Bangladesh (3.6%) and South Africa (3.6%).
Global targets and milestones for reductions in TB incidence and TB deaths have been set as part of the Sustainable Development Goals (SDGs) and WHO’s End TB Strategy. SDG 3 includes a target to end the global TB epidemic by 2030. The End TB Strategy includes targets of a 90% reduction in TB deaths and an 80% reduction in the TB incidence rate (new and relapse cases per
100 000 population per year) between 2015 and 2030; the 2020 milestones are reductions of 35% and 20%, respectively.
Currently, the world as a whole, most WHO regions and many high TB burden countries are not on track to reach the 2020 milestones of the End TB Strategy.
Globally, the reduction in the TB incidence rate between 2015 and 2019 was 9% (from 142 to 130 new and relapse cases per 100 000 population), less than halfway to the 2020 milestone. More positively, the WHO European Region has almost reached the milestone, with a reduction of 19% between 2015 and 2019, and the African Region has made good progress, with a reduction of 16%.
A total of 78 countries are on track to reach the 2020 milestone of a 20% reduction in TB incidence. Among the 30 high TB burden countries, seven have already reached the milestone (Cambodia, Ethiopia, Kenya, Namibia, the Russian Federation, South Africa and the United Republic of Tanzania) and three others are on track to do so (Lesotho, Myanmar and Zimbabwe).
The global reduction in the number of TB deaths between 2015 and 2019 was 14%. The WHO European Region is on track to reach the 2020 milestone, with a 31% reduction from 2015 to 2019, and the African Region has made good progress, achieving a reduction of 19%.
A total of 46 countries are on track to reach the 2020 milestone of a 35% reduction in TB deaths. Among the 30 high TB burden countries, seven
have already reached the milestone (Bangladesh, Kenya, Mozambique, Myanmar, the Russian Federation, Sierra Leone and the United Republic of Tanzania) and one other is on track to do so (Viet Nam).
Faster reductions in TB incidence and deaths require improvements in access to diagnosis and care within the context of progress towards universal health coverage, action on broader determinants of TB incidence (e.g. levels of undernutrition, poverty, smoking and diabetes) and a new treatment or vaccine to substantially lower the risk of developing TB in people who have a latent TB infection.
Globally, the burden of multidrug- or rifampicin-resistant TB (MDR/RR-TB) as a share of the number of TB cases remains stable. In 2019, an estimated 3.3% of new TB cases and 18% of previously treated cases had MDR/RR-TB. In absolute numbers, there were an estimated 465 000 (range, 400 000–535 000) incident cases of rifampicin-resistant TB; 78% had multidrug-resistant TB. India (27%), China (14%) and the Russian Federation (8%) had the largest share of the global burden.
In recent years, sources of data to inform estimates of TB disease burden have improved considerably, particularly from national TB prevalence surveys. National TB notification and vital registration systems require improvements to track TB incidence and mortality reliably. a When an HIV-positive person dies from TB
disease, the underlying cause is classified as HIV in the International Classification of Diseases system (10th edition).
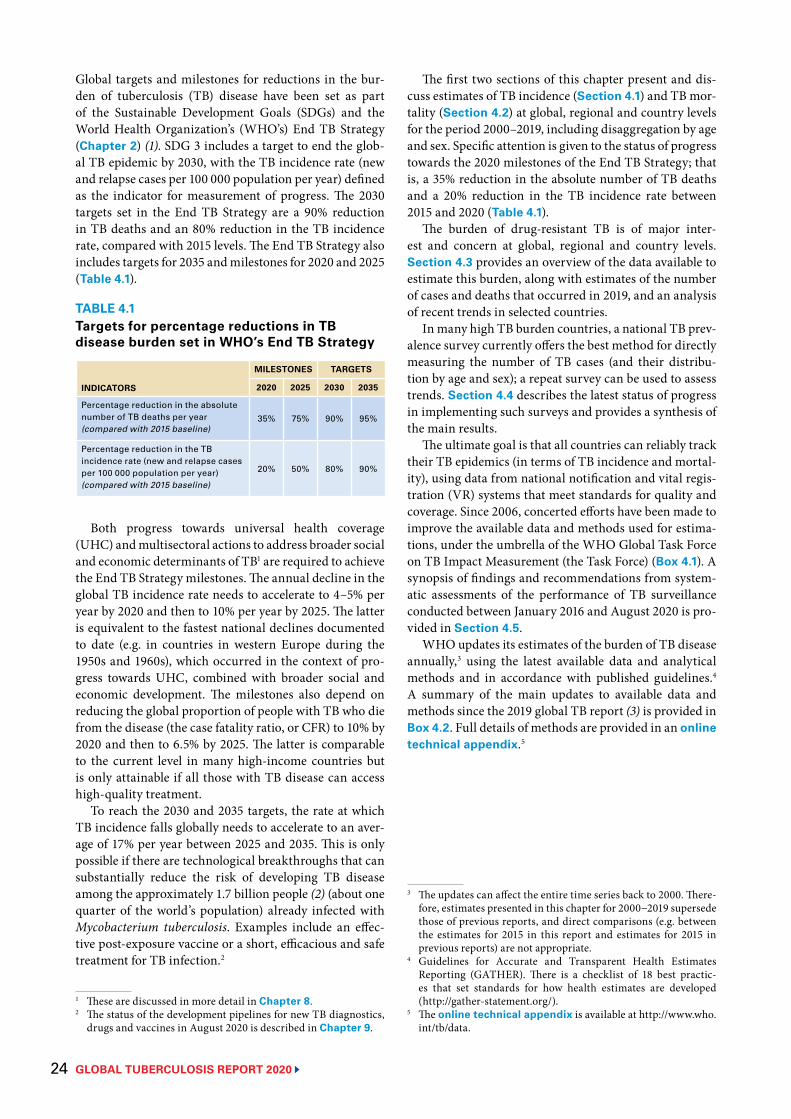
GLOBAL TUBERCULOSIS REPORT 2020 24
Global targets and milestones for reductions in the bur-den of tuberculosis (TB) disease have been set as part of the Sustainable Development Goals (SDGs) and the World Health Organization’s (WHO’s) End TB Strategy (Chapter 2) (1). SDG 3 includes a target to end the glob-al TB epidemic by 2030, with the TB incidence rate (new and relapse cases per 100 000 population per year) defined as the indicator for measurement of progress. The 2030 targets set in the End TB Strategy are a 90% reduction in TB deaths and an 80% reduction in the TB incidence rate, compared with 2015 levels. The End TB Strategy also includes targets for 2035 and milestones for 2020 and 2025 (Table 4.1).
Both progress towards universal health coverage (UHC) and multisectoral actions to address broader social and economic determinants of TB1 are required to achieve the End TB Strategy milestones. The annual decline in the global TB incidence rate needs to accelerate to 4–5% per year by 2020 and then to 10% per year by 2025. The latter is equivalent to the fastest national declines documented to date (e.g. in countries in western Europe during the 1950s and 1960s), which occurred in the context of pro-gress towards UHC, combined with broader social and economic development. The milestones also depend on reducing the global proportion of people with TB who die from the disease (the case fatality ratio, or CFR) to 10% by 2020 and then to 6.5% by 2025. The latter is comparable to the current level in many high-income countries but is only attainable if all those with TB disease can access high-quality treatment.
To reach the 2030 and 2035 targets, the rate at which TB incidence falls globally needs to accelerate to an aver-age of 17% per year between 2025 and 2035. This is only possible if there are technological breakthroughs that can substantially reduce the risk of developing TB disease among the approximately 1.7 billion people (2) (about one quarter of the world’s population) already infected with Mycobacterium tuberculosis. Examples include an effec-tive post-exposure vaccine or a short, efficacious and safe treatment for TB infection.2
1 These are discussed in more detail in Chapter 8. 2 The status of the development pipelines for new TB diagnostics,
drugs and vaccines in August 2020 is described in Chapter 9.
The first two sections of this chapter present and dis-cuss estimates of TB incidence (Section 4.1) and TB mor-tality (Section 4.2) at global, regional and country levels for the period 2000–2019, including disaggregation by age and sex. Specific attention is given to the status of progress towards the 2020 milestones of the End TB Strategy; that is, a 35% reduction in the absolute number of TB deaths and a 20% reduction in the TB incidence rate between 2015 and 2020 (Table 4.1).
The burden of drug-resistant TB is of major inter-est and concern at global, regional and country levels. Section 4.3 provides an overview of the data available to estimate this burden, along with estimates of the number of cases and deaths that occurred in 2019, and an analysis of recent trends in selected countries.
In many high TB burden countries, a national TB prev-alence survey currently offers the best method for directly measuring the number of TB cases (and their distribu-tion by age and sex); a repeat survey can be used to assess trends. Section 4.4 describes the latest status of progress in implementing such surveys and provides a synthesis of the main results.
The ultimate goal is that all countries can reliably track their TB epidemics (in terms of TB incidence and mortal-ity), using data from national notification and vital regis-tration (VR) systems that meet standards for quality and coverage. Since 2006, concerted efforts have been made to improve the available data and methods used for estima-tions, under the umbrella of the WHO Global Task Force on TB Impact Measurement (the Task Force) (Box 4.1). A synopsis of findings and recommendations from system-atic assessments of the performance of TB surveillance conducted between January 2016 and August 2020 is pro-vided in Section 4.5.
WHO updates its estimates of the burden of TB disease annually,3 using the latest available data and analytical methods and in accordance with published guidelines.4 A summary of the main updates to available data and methods since the 2019 global TB report (3) is provided in Box 4.2. Full details of methods are provided in an online technical appendix.5
3 The updates can affect the entire time series back to 2000. There-fore, estimates presented in this chapter for 2000−2019 supersede those of previous reports, and direct comparisons (e.g. between the estimates for 2015 in this report and estimates for 2015 in previous reports) are not appropriate.
4 Guidelines for Accurate and Transparent Health Estimates Reporting (GATHER). There is a checklist of 18 best practic-es that set standards for how health estimates are developed (http://gather-statement.org/).
5 The online technical appendix is available at http://www.who.int/tb/data.
TABLE 4.1Targets for percentage reductions in TB disease burden set in WHO’s End TB Strategy
INDICATORS
MILESTONES TARGETS
2020 2025 2030 2035
Percentage reduction in the absolute number of TB deaths per year (compared with 2015 baseline)
35% 75% 90% 95%
Percentage reduction in the TB incidence rate (new and relapse cases per 100 000 population per year)(compared with 2015 baseline)
20% 50% 80% 90%
BOX 4.1
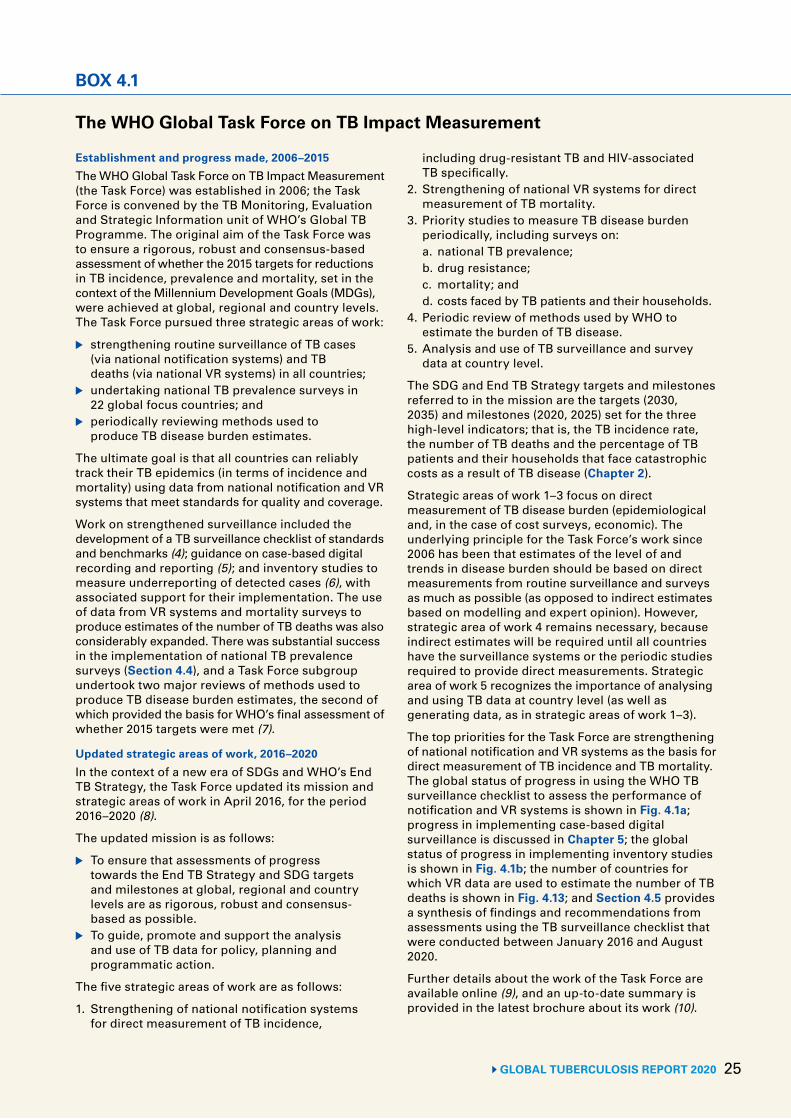
25 GLOBAL TUBERCULOSIS REPORT 2020
BOX 4.1
The WHO Global Task Force on TB Impact Measurement
Establishment and progress made, 2006–2015The WHO Global Task Force on TB Impact Measurement (the Task Force) was established in 2006; the Task Force is convened by the TB Monitoring, Evaluation and Strategic Information unit of WHO’s Global TB Programme. The original aim of the Task Force was to ensure a rigorous, robust and consensus-based assessment of whether the 2015 targets for reductions in TB incidence, prevalence and mortality, set in the context of the Millennium Development Goals (MDGs), were achieved at global, regional and country levels. The Task Force pursued three strategic areas of work:
▶ strengthening routine surveillance of TB cases (via national notification systems) and TB deaths (via national VR systems) in all countries;
▶ undertaking national TB prevalence surveys in 22 global focus countries; and
▶ periodically reviewing methods used to produce TB disease burden estimates.
The ultimate goal is that all countries can reliably track their TB epidemics (in terms of incidence and mortality) using data from national notification and VR systems that meet standards for quality and coverage.
Work on strengthened surveillance included the development of a TB surveillance checklist of standards and benchmarks (4); guidance on case-based digital recording and reporting (5); and inventory studies to measure underreporting of detected cases (6), with associated support for their implementation. The use of data from VR systems and mortality surveys to produce estimates of the number of TB deaths was also considerably expanded. There was substantial success in the implementation of national TB prevalence surveys (Section 4.4), and a Task Force subgroup undertook two major reviews of methods used to produce TB disease burden estimates, the second of which provided the basis for WHO’s final assessment of whether 2015 targets were met (7).
Updated strategic areas of work, 2016–2020In the context of a new era of SDGs and WHO’s End TB Strategy, the Task Force updated its mission and strategic areas of work in April 2016, for the period 2016–2020 (8).
The updated mission is as follows:
▶ To ensure that assessments of progress towards the End TB Strategy and SDG targets and milestones at global, regional and country levels are as rigorous, robust and consensus-based as possible.
▶ To guide, promote and support the analysis and use of TB data for policy, planning and programmatic action.
The five strategic areas of work are as follows:
1. Strengthening of national notification systems for direct measurement of TB incidence,
including drug-resistant TB and HIV-associated TB specifically.
2. Strengthening of national VR systems for direct measurement of TB mortality.
3. Priority studies to measure TB disease burden periodically, including surveys on:a. national TB prevalence;b. drug resistance;c. mortality; andd. costs faced by TB patients and their households.
4. Periodic review of methods used by WHO to estimate the burden of TB disease.
5. Analysis and use of TB surveillance and survey data at country level.
The SDG and End TB Strategy targets and milestones referred to in the mission are the targets (2030, 2035) and milestones (2020, 2025) set for the three high-level indicators; that is, the TB incidence rate, the number of TB deaths and the percentage of TB patients and their households that face catastrophic costs as a result of TB disease (Chapter 2).
Strategic areas of work 1–3 focus on direct measurement of TB disease burden (epidemiological and, in the case of cost surveys, economic). The underlying principle for the Task Force’s work since 2006 has been that estimates of the level of and trends in disease burden should be based on direct measurements from routine surveillance and surveys as much as possible (as opposed to indirect estimates based on modelling and expert opinion). However, strategic area of work 4 remains necessary, because indirect estimates will be required until all countries have the surveillance systems or the periodic studies required to provide direct measurements. Strategic area of work 5 recognizes the importance of analysing and using TB data at country level (as well as generating data, as in strategic areas of work 1–3).
The top priorities for the Task Force are strengthening of national notification and VR systems as the basis for direct measurement of TB incidence and TB mortality. The global status of progress in using the WHO TB surveillance checklist to assess the performance of notification and VR systems is shown in Fig. 4.1a; progress in implementing case-based digital surveillance is discussed in Chapter 5; the global status of progress in implementing inventory studies is shown in Fig. 4.1b; the number of countries for which VR data are used to estimate the number of TB deaths is shown in Fig. 4.13; and Section 4.5 provides a synthesis of findings and recommendations from assessments using the TB surveillance checklist that were conducted between January 2016 and August 2020.
Further details about the work of the Task Force are available online (9), and an up-to-date summary is provided in the latest brochure about its work (10).
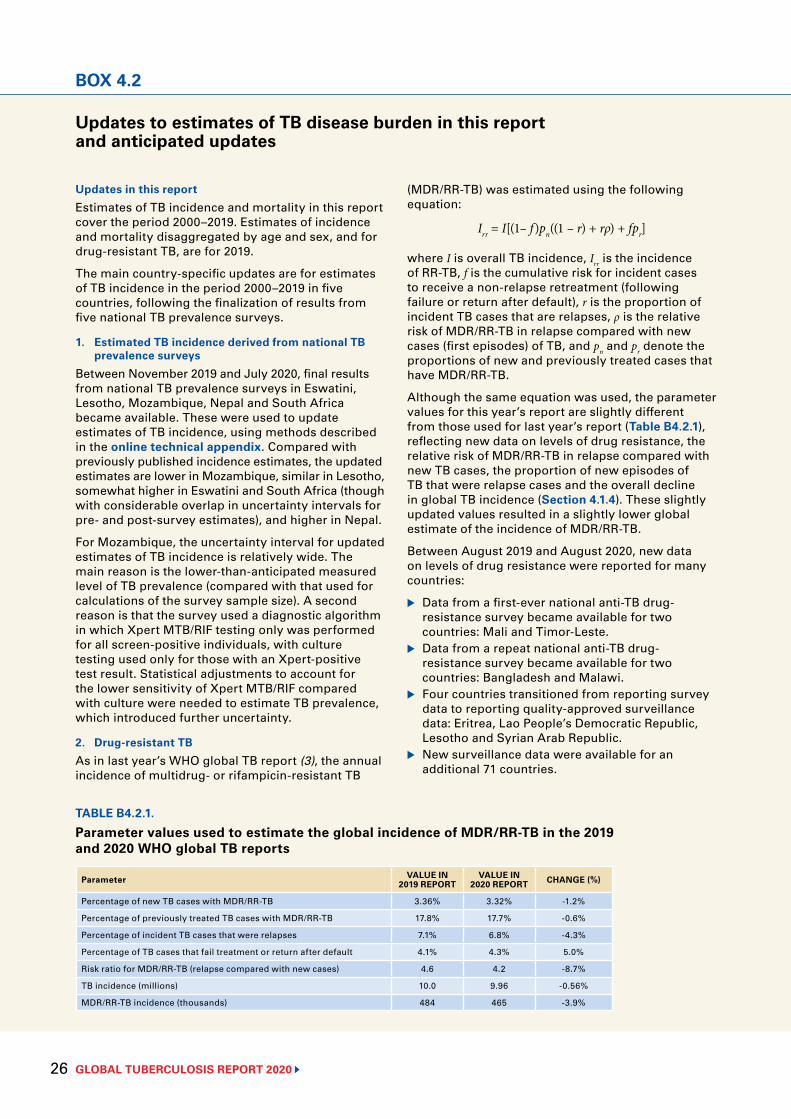
GLOBAL TUBERCULOSIS REPORT 2020 26
BOX 4.2
Updates to estimates of TB disease burden in this report and anticipated updates
Updates in this reportEstimates of TB incidence and mortality in this report cover the period 2000–2019. Estimates of incidence and mortality disaggregated by age and sex, and for drug-resistant TB, are for 2019.
The main country-specific updates are for estimates of TB incidence in the period 2000–2019 in five countries, following the finalization of results from five national TB prevalence surveys.
1. Estimated TB incidence derived from national TB prevalence surveys
Between November 2019 and July 2020, final results from national TB prevalence surveys in Eswatini, Lesotho, Mozambique, Nepal and South Africa became available. These were used to update estimates of TB incidence, using methods described in the online technical appendix. Compared with previously published incidence estimates, the updated estimates are lower in Mozambique, similar in Lesotho, somewhat higher in Eswatini and South Africa (though with considerable overlap in uncertainty intervals for pre- and post-survey estimates), and higher in Nepal.
For Mozambique, the uncertainty interval for updated estimates of TB incidence is relatively wide. The main reason is the lower-than-anticipated measured level of TB prevalence (compared with that used for calculations of the survey sample size). A second reason is that the survey used a diagnostic algorithm in which Xpert MTB/RIF testing only was performed for all screen-positive individuals, with culture testing used only for those with an Xpert-positive test result. Statistical adjustments to account for the lower sensitivity of Xpert MTB/RIF compared with culture were needed to estimate TB prevalence, which introduced further uncertainty.
2. Drug-resistant TBAs in last year’s WHO global TB report (3), the annual incidence of multidrug- or rifampicin-resistant TB
(MDR/RR-TB) was estimated using the following equation:
Irr = I[(1– f)pn((1 – r) + rρ) + fpr]
where I is overall TB incidence, Irr is the incidence of RR-TB, f is the cumulative risk for incident cases to receive a non-relapse retreatment (following failure or return after default), r is the proportion of incident TB cases that are relapses, ρ is the relative risk of MDR/RR-TB in relapse compared with new cases (first episodes) of TB, and pn and pr denote the proportions of new and previously treated cases that have MDR/RR-TB.
Although the same equation was used, the parameter values for this year’s report are slightly different from those used for last year’s report (Table B4.2.1), reflecting new data on levels of drug resistance, the relative risk of MDR/RR-TB in relapse compared with new TB cases, the proportion of new episodes of TB that were relapse cases and the overall decline in global TB incidence (Section 4.1.4). These slightly updated values resulted in a slightly lower global estimate of the incidence of MDR/RR-TB.
Between August 2019 and August 2020, new data on levels of drug resistance were reported for many countries:
▶ Data from a first-ever national anti-TB drug-resistance survey became available for two countries: Mali and Timor-Leste.
▶ Data from a repeat national anti-TB drug-resistance survey became available for two countries: Bangladesh and Malawi.
▶ Four countries transitioned from reporting survey data to reporting quality-approved surveillance data: Eritrea, Lao People’s Democratic Republic, Lesotho and Syrian Arab Republic.
▶ New surveillance data were available for an additional 71 countries.
TABLE B4.2.1.
Parameter values used to estimate the global incidence of MDR/RR-TB in the 2019 and 2020 WHO global TB reports
Parameter VALUE IN 2019 REPORT
VALUE IN 2020 REPORT CHANGE (%)
Percentage of new TB cases with MDR/RR-TB 3.36% 3.32% -1.2%
Percentage of previously treated TB cases with MDR/RR-TB 17.8% 17.7% -0.6%
Percentage of incident TB cases that were relapses 7.1% 6.8% -4.3%
Percentage of TB cases that fail treatment or return after default 4.1% 4.3% 5.0%
Risk ratio for MDR/RR-TB (relapse compared with new cases) 4.6 4.2 -8.7%
TB incidence (millions) 10.0 9.96 -0.56%
MDR/RR-TB incidence (thousands) 484 465 -3.9%
BOX 4.2
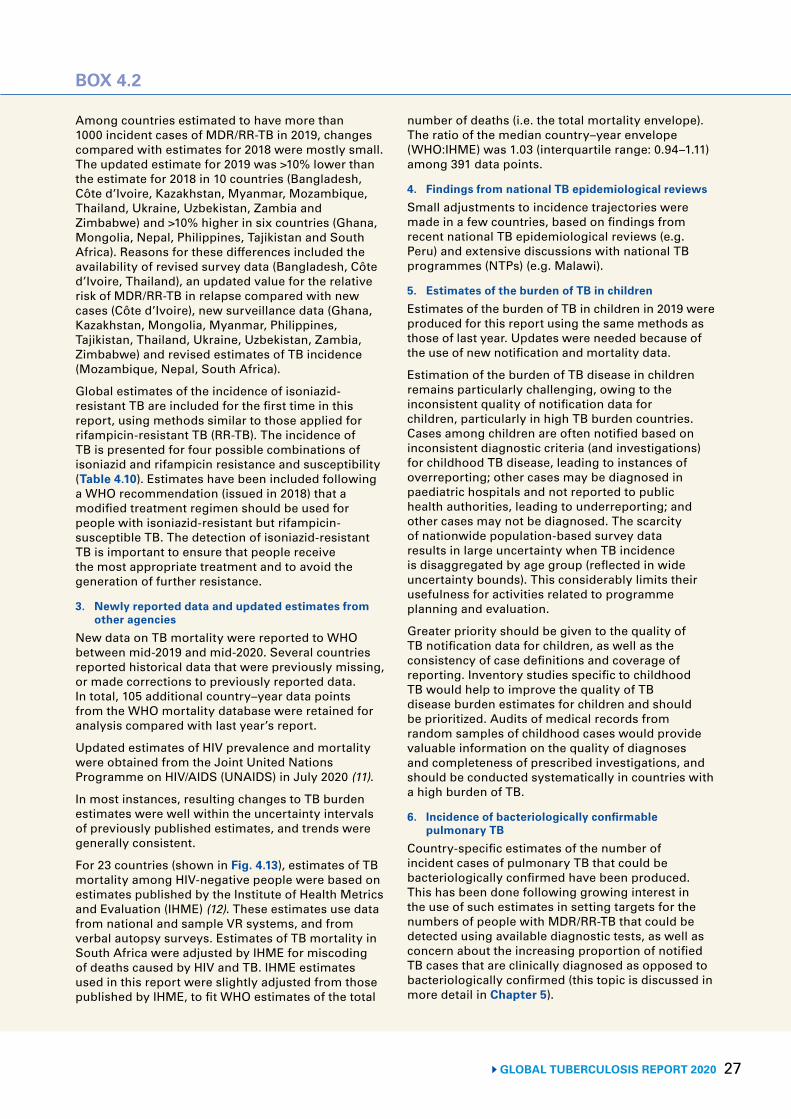
27 GLOBAL TUBERCULOSIS REPORT 2020
BOX 4.2 BOX 4.2
Among countries estimated to have more than 1000 incident cases of MDR/RR-TB in 2019, changes compared with estimates for 2018 were mostly small. The updated estimate for 2019 was >10% lower than the estimate for 2018 in 10 countries (Bangladesh, Côte d’Ivoire, Kazakhstan, Myanmar, Mozambique, Thailand, Ukraine, Uzbekistan, Zambia and Zimbabwe) and >10% higher in six countries (Ghana, Mongolia, Nepal, Philippines, Tajikistan and South Africa). Reasons for these differences included the availability of revised survey data (Bangladesh, Côte d’Ivoire, Thailand), an updated value for the relative risk of MDR/RR-TB in relapse compared with new cases (Côte d’Ivoire), new surveillance data (Ghana, Kazakhstan, Mongolia, Myanmar, Philippines, Tajikistan, Thailand, Ukraine, Uzbekistan, Zambia, Zimbabwe) and revised estimates of TB incidence (Mozambique, Nepal, South Africa).
Global estimates of the incidence of isoniazid-resistant TB are included for the first time in this report, using methods similar to those applied for rifampicin-resistant TB (RR-TB). The incidence of TB is presented for four possible combinations of isoniazid and rifampicin resistance and susceptibility (Table 4.10). Estimates have been included following a WHO recommendation (issued in 2018) that a modified treatment regimen should be used for people with isoniazid-resistant but rifampicin-susceptible TB. The detection of isoniazid-resistant TB is important to ensure that people receive the most appropriate treatment and to avoid the generation of further resistance.
3. Newly reported data and updated estimates from other agencies
New data on TB mortality were reported to WHO between mid-2019 and mid-2020. Several countries reported historical data that were previously missing, or made corrections to previously reported data. In total, 105 additional country–year data points from the WHO mortality database were retained for analysis compared with last year’s report.
Updated estimates of HIV prevalence and mortality were obtained from the Joint United Nations Programme on HIV/AIDS (UNAIDS) in July 2020 (11).
In most instances, resulting changes to TB burden estimates were well within the uncertainty intervals of previously published estimates, and trends were generally consistent.
For 23 countries (shown in Fig. 4.13), estimates of TB mortality among HIV-negative people were based on estimates published by the Institute of Health Metrics and Evaluation (IHME) (12). These estimates use data from national and sample VR systems, and from verbal autopsy surveys. Estimates of TB mortality in South Africa were adjusted by IHME for miscoding of deaths caused by HIV and TB. IHME estimates used in this report were slightly adjusted from those published by IHME, to fit WHO estimates of the total
number of deaths (i.e. the total mortality envelope). The ratio of the median country–year envelope (WHO:IHME) was 1.03 (interquartile range: 0.94–1.11) among 391 data points.
4. Findings from national TB epidemiological reviewsSmall adjustments to incidence trajectories were made in a few countries, based on findings from recent national TB epidemiological reviews (e.g. Peru) and extensive discussions with national TB programmes (NTPs) (e.g. Malawi).
5. Estimates of the burden of TB in childrenEstimates of the burden of TB in children in 2019 were produced for this report using the same methods as those of last year. Updates were needed because of the use of new notification and mortality data.
Estimation of the burden of TB disease in children remains particularly challenging, owing to the inconsistent quality of notification data for children, particularly in high TB burden countries. Cases among children are often notified based on inconsistent diagnostic criteria (and investigations) for childhood TB disease, leading to instances of overreporting; other cases may be diagnosed in paediatric hospitals and not reported to public health authorities, leading to underreporting; and other cases may not be diagnosed. The scarcity of nationwide population-based survey data results in large uncertainty when TB incidence is disaggregated by age group (reflected in wide uncertainty bounds). This considerably limits their usefulness for activities related to programme planning and evaluation.
Greater priority should be given to the quality of TB notification data for children, as well as the consistency of case definitions and coverage of reporting. Inventory studies specific to childhood TB would help to improve the quality of TB disease burden estimates for children and should be prioritized. Audits of medical records from random samples of childhood cases would provide valuable information on the quality of diagnoses and completeness of prescribed investigations, and should be conducted systematically in countries with a high burden of TB.
6. Incidence of bacteriologically confirmable pulmonary TB
Country-specific estimates of the number of incident cases of pulmonary TB that could be bacteriologically confirmed have been produced. This has been done following growing interest in the use of such estimates in setting targets for the numbers of people with MDR/RR-TB that could be detected using available diagnostic tests, as well as concern about the increasing proportion of notified TB cases that are clinically diagnosed as opposed to bacteriologically confirmed (this topic is discussed in more detail in Chapter 5).
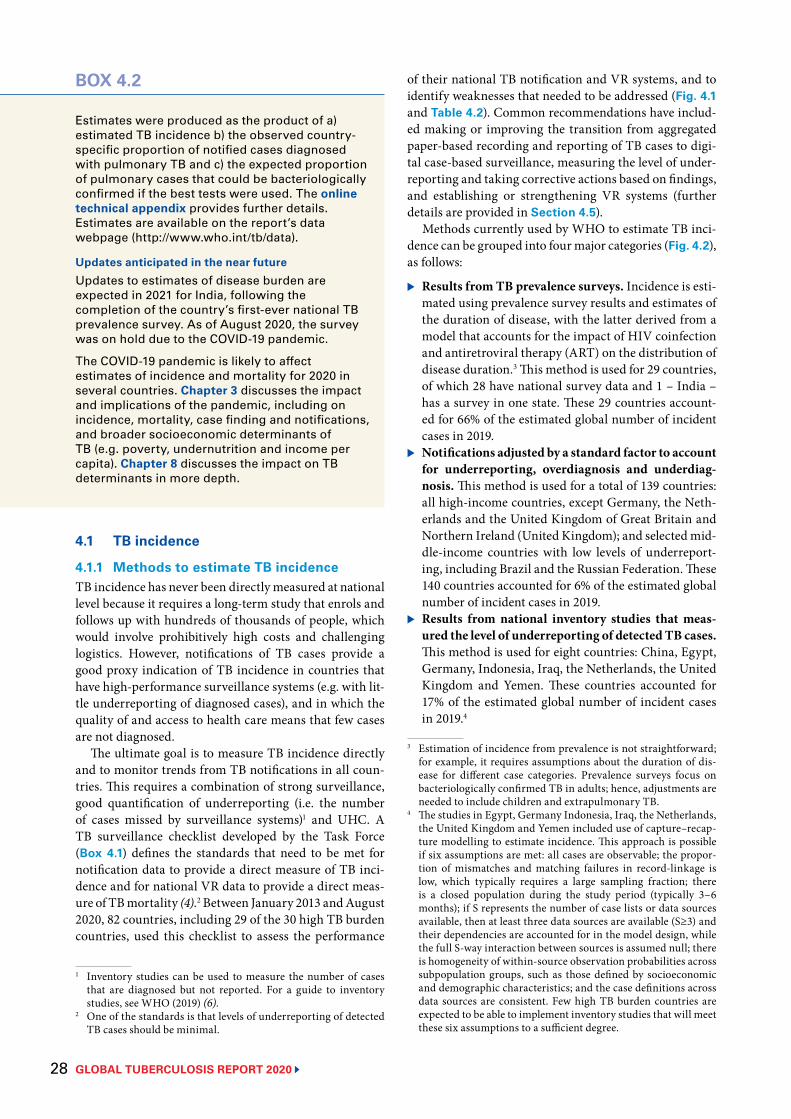
GLOBAL TUBERCULOSIS REPORT 2020 28
BOX 4.2
4.1 TB incidence
4.1.1 Methods to estimate TB incidenceTB incidence has never been directly measured at national level because it requires a long-term study that enrols and follows up with hundreds of thousands of people, which would involve prohibitively high costs and challenging logistics. However, notifications of TB cases provide a good proxy indication of TB incidence in countries that have high-performance surveillance systems (e.g. with lit-tle underreporting of diagnosed cases), and in which the quality of and access to health care means that few cases are not diagnosed.
The ultimate goal is to measure TB incidence directly and to monitor trends from TB notifications in all coun-tries. This requires a combination of strong surveillance, good quantification of underreporting (i.e. the number of cases missed by surveillance systems)1 and UHC. A TB surveillance checklist developed by the Task Force (Box 4.1) defines the standards that need to be met for notification data to provide a direct measure of TB inci-dence and for national VR data to provide a direct meas-ure of TB mortality (4).2 Between January 2013 and August 2020, 82 countries, including 29 of the 30 high TB burden countries, used this checklist to assess the performance
1 Inventory studies can be used to measure the number of cases that are diagnosed but not reported. For a guide to inventory studies, see WHO (2019) (6).
2 One of the standards is that levels of underreporting of detected TB cases should be minimal.
Estimates were produced as the product of a) estimated TB incidence b) the observed country-specific proportion of notified cases diagnosed with pulmonary TB and c) the expected proportion of pulmonary cases that could be bacteriologically confirmed if the best tests were used. The online technical appendix provides further details. Estimates are available on the report’s data webpage (http://www.who.int/tb/data).
Updates anticipated in the near futureUpdates to estimates of disease burden are expected in 2021 for India, following the completion of the country’s first-ever national TB prevalence survey. As of August 2020, the survey was on hold due to the COVID-19 pandemic.
The COVID-19 pandemic is likely to affect estimates of incidence and mortality for 2020 in several countries. Chapter 3 discusses the impact and implications of the pandemic, including on incidence, mortality, case finding and notifications, and broader socioeconomic determinants of TB (e.g. poverty, undernutrition and income per capita). Chapter 8 discusses the impact on TB determinants in more depth.
of their national TB notification and VR systems, and to identify weaknesses that needed to be addressed (Fig. 4.1 and Table 4.2). Common recommendations have includ-ed making or improving the transition from aggregated paper-based recording and reporting of TB cases to digi-tal case-based surveillance, measuring the level of under-reporting and taking corrective actions based on findings, and establishing or strengthening VR systems (further details are provided in Section 4.5).
Methods currently used by WHO to estimate TB inci-dence can be grouped into four major categories (Fig. 4.2), as follows:
▶ Results from TB prevalence surveys. Incidence is esti-mated using prevalence survey results and estimates of the duration of disease, with the latter derived from a model that accounts for the impact of HIV coinfection and antiretroviral therapy (ART) on the distribution of disease duration.3 This method is used for 29 countries, of which 28 have national survey data and 1 – India – has a survey in one state. These 29 countries account-ed for 66% of the estimated global number of incident cases in 2019.
▶ Notifications adjusted by a standard factor to account for underreporting, overdiagnosis and underdiag- nosis. This method is used for a total of 139 countries: all high-income countries, except Germany, the Neth-erlands and the United Kingdom of Great Britain and Northern Ireland (United Kingdom); and selected mid-dle-income countries with low levels of underreport-ing, including Brazil and the Russian Federation. These 140 countries accounted for 6% of the estimated global number of incident cases in 2019.
▶ Results from national inventory studies that meas-ured the level of underreporting of detected TB cases. This method is used for eight countries: China, Egypt, Germany, Indonesia, Iraq, the Netherlands, the United Kingdom and Yemen. These countries accounted for 17% of the estimated global number of incident cases in 2019.4
3 Estimation of incidence from prevalence is not straightforward; for example, it requires assumptions about the duration of dis-ease for different case categories. Prevalence surveys focus on bacteriologically confirmed TB in adults; hence, adjustments are needed to include children and extrapulmonary TB.
4 The studies in Egypt, Germany Indonesia, Iraq, the Netherlands, the United Kingdom and Yemen included use of capture–recap-ture modelling to estimate incidence. This approach is possible if six assumptions are met: all cases are observable; the propor-tion of mismatches and matching failures in record-linkage is low, which typically requires a large sampling fraction; there is a closed population during the study period (typically 3–6 months); if S represents the number of case lists or data sources available, then at least three data sources are available (S≥3) and their dependencies are accounted for in the model design, while the full S-way interaction between sources is assumed null; there is homogeneity of within-source observation probabilities across subpopulation groups, such as those defined by socioeconomic and demographic characteristics; and the case definitions across data sources are consistent. Few high TB burden countries are expected to be able to implement inventory studies that will meet these six assumptions to a sufficient degree.
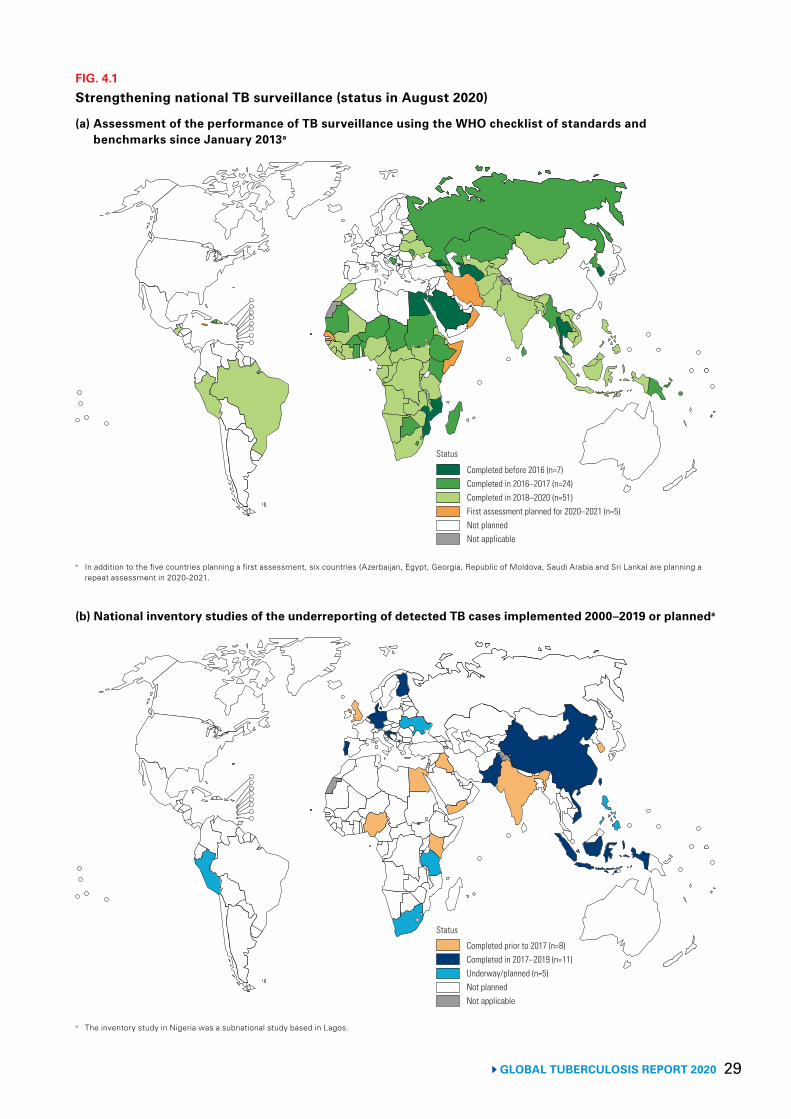
29 GLOBAL TUBERCULOSIS REPORT 2020
FIG. 4.1
Strengthening national TB surveillance (status in August 2020)
Completed before 2016 (n=7)Completed in 2016–2017 (n=24)Completed in 2018–2020 (n=51)First assessment planned for 2020–2021 (n=5)Not plannedNot applicable
Status
Completed prior to 2017 (n=8)Completed in 2017–2019 (n=11)Underway/planned (n=5)Not plannedNot applicable
Status
a In addition to the five countries planning a first assessment, six countries (Azerbaijan, Egypt, Georgia, Republic of Moldova, Saudi Arabia and Sri Lanka) are planning a repeat assessment in 2020-2021.
(a) Assessment of the performance of TB surveillance using the WHO checklist of standards and benchmarks since January 2013a
(b) National inventory studies of the underreporting of detected TB cases implemented 2000–2019 or planneda
a The inventory study in Nigeria was a subnational study based in Lagos.
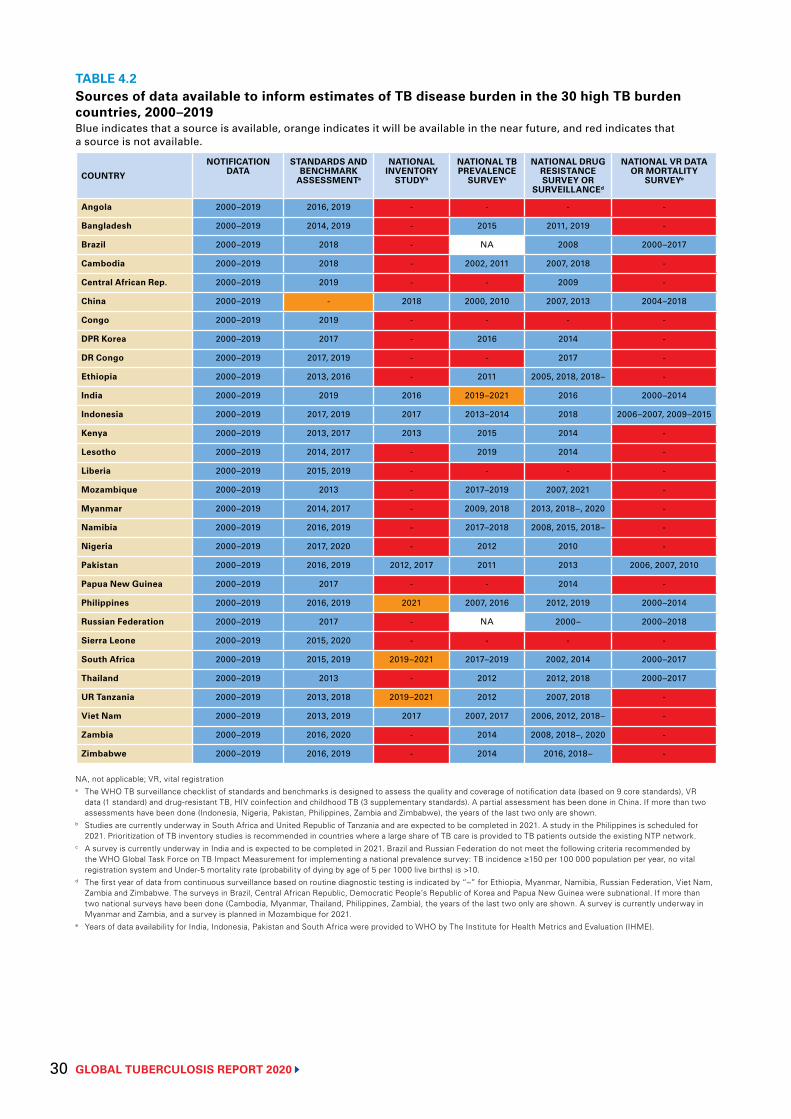
GLOBAL TUBERCULOSIS REPORT 2020 30
TABLE 4.2Sources of data available to inform estimates of TB disease burden in the 30 high TB burden countries, 2000–2019Blue indicates that a source is available, orange indicates it will be available in the near future, and red indicates that a source is not available.
COUNTRY
NOTIFICATION DATA
STANDARDS AND BENCHMARK
ASSESSMENTa
NATIONAL INVENTORY
STUDYb
NATIONAL TB PREVALENCE
SURVEYc
NATIONAL DRUG RESISTANCE SURVEY OR
SURVEILLANCEd
NATIONAL VR DATA OR MORTALITY
SURVEYe
Angola 2000–2019 2016, 2019 - - - -
Bangladesh 2000–2019 2014, 2019 - 2015 2011, 2019 -
Brazil 2000–2019 2018 - NA 2008 2000–2017
Cambodia 2000–2019 2018 - 2002, 2011 2007, 2018 -
Central African Rep. 2000–2019 2019 - - 2009 -
China 2000–2019 - 2018 2000, 2010 2007, 2013 2004–2018
Congo 2000–2019 2019 - - - -
DPR Korea 2000–2019 2017 - 2016 2014 -
DR Congo 2000–2019 2017, 2019 - - 2017 -
Ethiopia 2000–2019 2013, 2016 - 2011 2005, 2018, 2018– -
India 2000–2019 2019 2016 2019–2021 2016 2000–2014
Indonesia 2000–2019 2017, 2019 2017 2013–2014 2018 2006–2007, 2009–2015
Kenya 2000–2019 2013, 2017 2013 2015 2014 -
Lesotho 2000–2019 2014, 2017 - 2019 2014 -
Liberia 2000–2019 2015, 2019 - - - -
Mozambique 2000–2019 2013 - 2017–2019 2007, 2021 -
Myanmar 2000–2019 2014, 2017 - 2009, 2018 2013, 2018–, 2020 -
Namibia 2000–2019 2016, 2019 - 2017–2018 2008, 2015, 2018– -
Nigeria 2000–2019 2017, 2020 - 2012 2010 -
Pakistan 2000–2019 2016, 2019 2012, 2017 2011 2013 2006, 2007, 2010
Papua New Guinea 2000–2019 2017 - - 2014 -
Philippines 2000–2019 2016, 2019 2021 2007, 2016 2012, 2019 2000–2014
Russian Federation 2000–2019 2017 - NA 2000– 2000–2018
Sierra Leone 2000–2019 2015, 2020 - - - -
South Africa 2000–2019 2015, 2019 2019–2021 2017–2019 2002, 2014 2000–2017
Thailand 2000–2019 2013 - 2012 2012, 2018 2000–2017
UR Tanzania 2000–2019 2013, 2018 2019–2021 2012 2007, 2018 -
Viet Nam 2000–2019 2013, 2019 2017 2007, 2017 2006, 2012, 2018– -
Zambia 2000–2019 2016, 2020 - 2014 2008, 2018–, 2020 -
Zimbabwe 2000–2019 2016, 2019 - 2014 2016, 2018– -
NA, not applicable; VR, vital registrationa The WHO TB surveillance checklist of standards and benchmarks is designed to assess the quality and coverage of notification data (based on 9 core standards), VR
data (1 standard) and drug-resistant TB, HIV coinfection and childhood TB (3 supplementary standards). A partial assessment has been done in China. If more than two assessments have been done (Indonesia, Nigeria, Pakistan, Philippines, Zambia and Zimbabwe), the years of the last two only are shown.
b Studies are currently underway in South Africa and United Republic of Tanzania and are expected to be completed in 2021. A study in the Philippines is scheduled for 2021. Prioritization of TB inventory studies is recommended in countries where a large share of TB care is provided to TB patients outside the existing NTP network.
c A survey is currently underway in India and is expected to be completed in 2021. Brazil and Russian Federation do not meet the following criteria recommended by the WHO Global Task Force on TB Impact Measurement for implementing a national prevalence survey: TB incidence ≥150 per 100 000 population per year, no vital registration system and Under-5 mortality rate (probability of dying by age of 5 per 1000 live births) is >10.
d The first year of data from continuous surveillance based on routine diagnostic testing is indicated by “–” for Ethiopia, Myanmar, Namibia, Russian Federation, Viet Nam, Zambia and Zimbabwe. The surveys in Brazil, Central African Republic, Democratic People’s Republic of Korea and Papua New Guinea were subnational. If more than two national surveys have been done (Cambodia, Myanmar, Thailand, Philippines, Zambia), the years of the last two only are shown. A survey is currently underway in Myanmar and Zambia, and a survey is planned in Mozambique for 2021.
e Years of data availability for India, Indonesia, Pakistan and South Africa were provided to WHO by The Institute for Health Metrics and Evaluation (IHME).
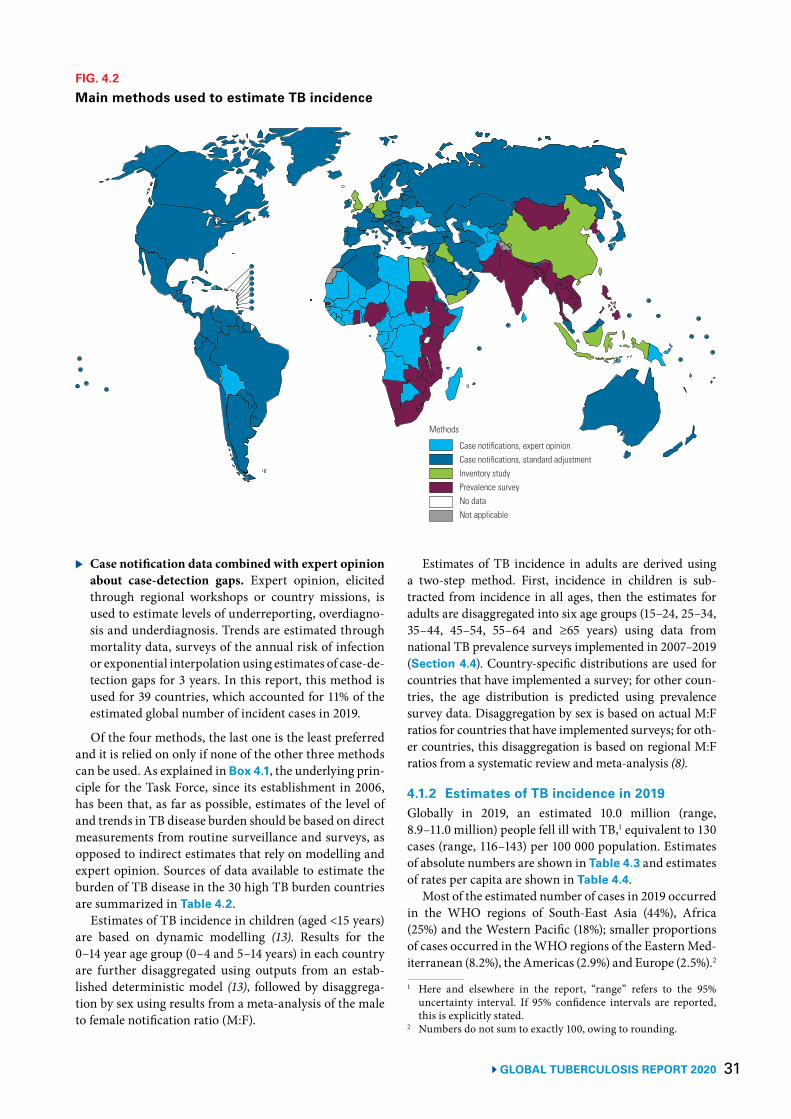
31 GLOBAL TUBERCULOSIS REPORT 2020
▶ Case notification data combined with expert opinion about case-detection gaps. Expert opinion, elicited through regional workshops or country missions, is used to estimate levels of underreporting, overdiagno-sis and underdiagnosis. Trends are estimated through mortality data, surveys of the annual risk of infection or exponential interpolation using estimates of case-de-tection gaps for 3 years. In this report, this method is used for 39 countries, which accounted for 11% of the estimated global number of incident cases in 2019.
Of the four methods, the last one is the least preferred and it is relied on only if none of the other three methods can be used. As explained in Box 4.1, the underlying prin-ciple for the Task Force, since its establishment in 2006, has been that, as far as possible, estimates of the level of and trends in TB disease burden should be based on direct measurements from routine surveillance and surveys, as opposed to indirect estimates that rely on modelling and expert opinion. Sources of data available to estimate the burden of TB disease in the 30 high TB burden countries are summarized in Table 4.2.
Estimates of TB incidence in children (aged <15 years) are based on dynamic modelling (13). Results for the 0–14 year age group (0–4 and 5–14 years) in each country are further disaggregated using outputs from an estab-lished deterministic model (13), followed by disaggrega-tion by sex using results from a meta-analysis of the male to female notification ratio (M:F).
FIG. 4.2
Main methods used to estimate TB incidence
Case notifications, expert opinionCase notifications, standard adjustmentInventory studyPrevalence surveyNo dataNot applicable
Methods
Estimates of TB incidence in adults are derived using a two-step method. First, incidence in children is sub-tracted from incidence in all ages, then the estimates for adults are disaggregated into six age groups (15–24, 25–34, 35–44, 45–54, 55–64 and ≥65 years) using data from national TB prevalence surveys implemented in 2007–2019 (Section 4.4). Country-specific distributions are used for countries that have implemented a survey; for other coun-tries, the age distribution is predicted using prevalence survey data. Disaggregation by sex is based on actual M:F ratios for countries that have implemented surveys; for oth-er countries, this disaggregation is based on regional M:F ratios from a systematic review and meta-analysis (8).
4.1.2 Estimates of TB incidence in 2019Globally in 2019, an estimated 10.0 million (range, 8.9–11.0 million) people fell ill with TB,1 equivalent to 130 cases (range, 116–143) per 100 000 population. Estimates of absolute numbers are shown in Table 4.3 and estimates of rates per capita are shown in Table 4.4.
Most of the estimated number of cases in 2019 occurred in the WHO regions of South-East Asia (44%), Africa (25%) and the Western Pacific (18%); smaller proportions of cases occurred in the WHO regions of the Eastern Med-iterranean (8.2%), the Americas (2.9%) and Europe (2.5%).2
1 Here and elsewhere in the report, “range” refers to the 95% uncertainty interval. If 95% confidence intervals are reported, this is explicitly stated.
2 Numbers do not sum to exactly 100, owing to rounding.
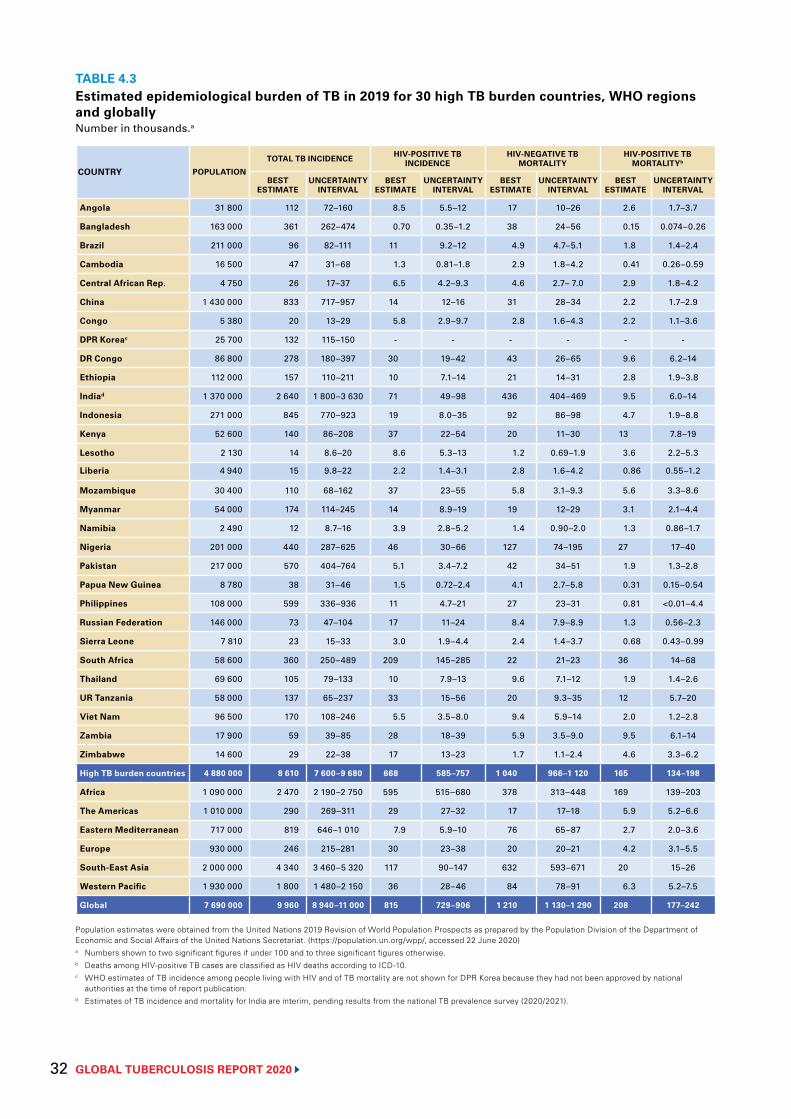
GLOBAL TUBERCULOSIS REPORT 2020 32
TABLE 4.3Estimated epidemiological burden of TB in 2019 for 30 high TB burden countries, WHO regions and globallyNumber in thousands.a
COUNTRY POPULATION
TOTAL TB INCIDENCE HIV-POSITIVE TB INCIDENCE
HIV-NEGATIVE TB MORTALITY
HIV-POSITIVE TB MORTALITYb
BEST ESTIMATE
UNCERTAINTY INTERVAL
BEST ESTIMATE
UNCERTAINTY INTERVAL
BEST ESTIMATE
UNCERTAINTY INTERVAL
BEST ESTIMATE
UNCERTAINTY INTERVAL
Angola 31 800 112 72–160 8.5 5.5–12 17 10–26 2.6 1.7–3.7
Bangladesh 163 000 361 262–474 0.70 0.35–1.2 38 24–56 0.15 0.074–0.26
Brazil 211 000 96 82–111 11 9.2–12 4.9 4.7–5.1 1.8 1.4–2.4
Cambodia 16 500 47 31–68 1.3 0.81–1.8 2.9 1.8–4.2 0.41 0.26–0.59
Central African Rep. 4 750 26 17–37 6.5 4.2–9.3 4.6 2.7– 7.0 2.9 1.8–4.2
China 1 430 000 833 717–957 14 12–16 31 28–34 2.2 1.7–2.9
Congo 5 380 20 13–29 5.8 2.9–9.7 2.8 1.6–4.3 2.2 1.1–3.6
DPR Koreac 25 700 132 115–150 - - - - - -
DR Congo 86 800 278 180–397 30 19–42 43 26–65 9.6 6.2–14
Ethiopia 112 000 157 110–211 10 7.1–14 21 14–31 2.8 1.9–3.8
Indiad 1 370 000 2 640 1 800–3 630 71 49–98 436 404–469 9.5 6.0–14
Indonesia 271 000 845 770–923 19 8.0–35 92 86–98 4.7 1.9–8.8
Kenya 52 600 140 86–208 37 22–54 20 11–30 13 7.8–19
Lesotho 2 130 14 8.6–20 8.6 5.3–13 1.2 0.69–1.9 3.6 2.2–5.3
Liberia 4 940 15 9.8–22 2.2 1.4–3.1 2.8 1.6–4.2 0.86 0.55–1.2
Mozambique 30 400 110 68–162 37 23–55 5.8 3.1–9.3 5.6 3.3–8.6
Myanmar 54 000 174 114–245 14 8.9–19 19 12–29 3.1 2.1–4.4
Namibia 2 490 12 8.7–16 3.9 2.8–5.2 1.4 0.90–2.0 1.3 0.86–1.7
Nigeria 201 000 440 287–625 46 30–66 127 74–195 27 17–40
Pakistan 217 000 570 404–764 5.1 3.4–7.2 42 34–51 1.9 1.3–2.8
Papua New Guinea 8 780 38 31–46 1.5 0.72–2.4 4.1 2.7–5.8 0.31 0.15–0.54
Philippines 108 000 599 336–936 11 4.7–21 27 23–31 0.81 <0.01–4.4
Russian Federation 146 000 73 47–104 17 11–24 8.4 7.9–8.9 1.3 0.56–2.3
Sierra Leone 7 810 23 15–33 3.0 1.9–4.4 2.4 1.4–3.7 0.68 0.43–0.99
South Africa 58 600 360 250–489 209 145–285 22 21–23 36 14–68
Thailand 69 600 105 79–133 10 7.9–13 9.6 7.1–12 1.9 1.4–2.6
UR Tanzania 58 000 137 65–237 33 15–56 20 9.3–35 12 5.7–20
Viet Nam 96 500 170 108–246 5.5 3.5–8.0 9.4 5.9–14 2.0 1.2–2.8
Zambia 17 900 59 39–85 28 18–39 5.9 3.5–9.0 9.5 6.1–14
Zimbabwe 14 600 29 22–38 17 13–23 1.7 1.1–2.4 4.6 3.3–6.2
High TB burden countries 4 880 000 8 610 7 600–9 680 668 585–757 1 040 966–1 120 165 134–198
Africa 1 090 000 2 470 2 190–2 750 595 515–680 378 313–448 169 139–203
The Americas 1 010 000 290 269–311 29 27–32 17 17–18 5.9 5.2–6.6
Eastern Mediterranean 717 000 819 646–1 010 7.9 5.9–10 76 65–87 2.7 2.0–3.6
Europe 930 000 246 215–281 30 23–38 20 20–21 4.2 3.1–5.5
South-East Asia 2 000 000 4 340 3 460–5 320 117 90–147 632 593–671 20 15–26
Western Pacific 1 930 000 1 800 1 480–2 150 36 28–46 84 78–91 6.3 5.2–7.5
Global 7 690 000 9 960 8 940–11 000 815 729–906 1 210 1 130–1 290 208 177–242
Population estimates were obtained from the United Nations 2019 Revision of World Population Prospects as prepared by the Population Division of the Department of Economic and Social Affairs of the United Nations Secretariat. (https://population.un.org/wpp/, accessed 22 June 2020)a Numbers shown to two significant figures if under 100 and to three significant figures otherwise.b Deaths among HIV-positive TB cases are classified as HIV deaths according to ICD-10.c WHO estimates of TB incidence among people living with HIV and of TB mortality are not shown for DPR Korea because they had not been approved by national
authorities at the time of report publication.d Estimates of TB incidence and mortality for India are interim, pending results from the national TB prevalence survey (2020/2021).
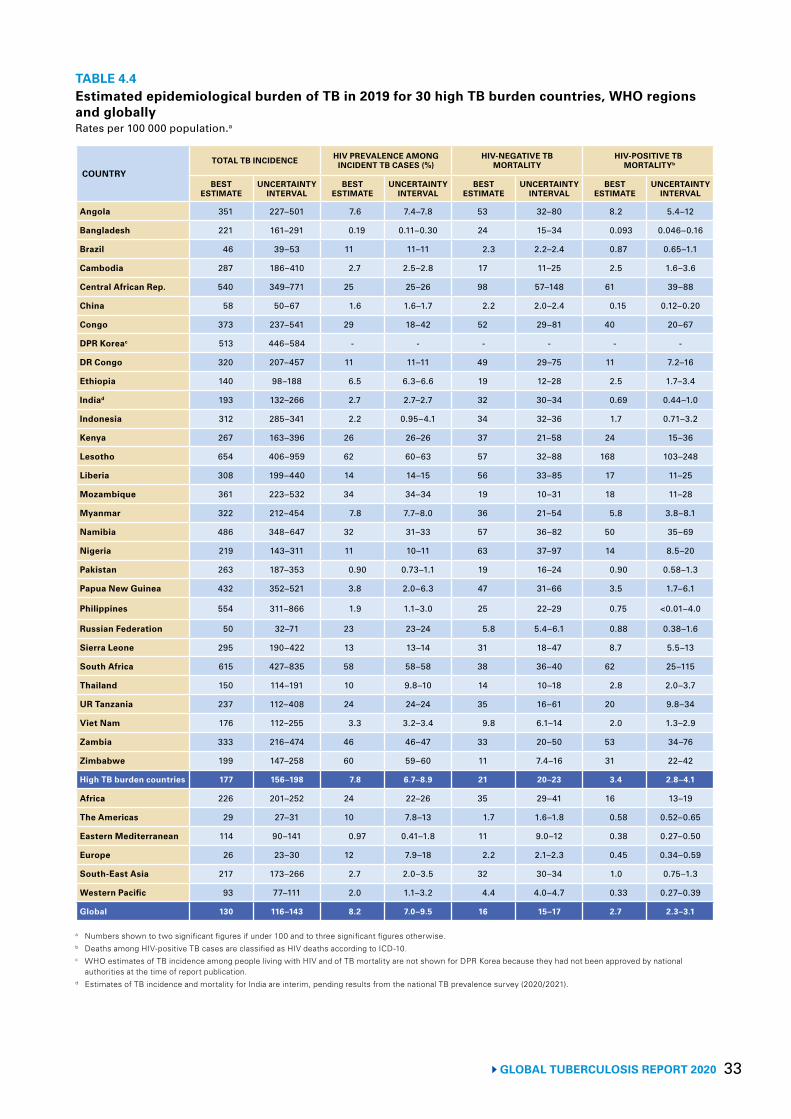
33 GLOBAL TUBERCULOSIS REPORT 2020
TABLE 4.4Estimated epidemiological burden of TB in 2019 for 30 high TB burden countries, WHO regions and globallyRates per 100 000 population.a
COUNTRYTOTAL TB INCIDENCE HIV PREVALENCE AMONG
INCIDENT TB CASES (%)HIV-NEGATIVE TB
MORTALITYHIV-POSITIVE TB
MORTALITYb
BEST ESTIMATE
UNCERTAINTY INTERVAL
BEST ESTIMATE
UNCERTAINTY INTERVAL
BEST ESTIMATE
UNCERTAINTY INTERVAL
BEST ESTIMATE
UNCERTAINTY INTERVAL
Angola 351 227–501 7.6 7.4–7.8 53 32–80 8.2 5.4–12
Bangladesh 221 161–291 0.19 0.11–0.30 24 15–34 0.093 0.046–0.16
Brazil 46 39–53 11 11–11 2.3 2.2–2.4 0.87 0.65–1.1
Cambodia 287 186–410 2.7 2.5–2.8 17 11–25 2.5 1.6–3.6
Central African Rep. 540 349–771 25 25–26 98 57–148 61 39–88
China 58 50–67 1.6 1.6–1.7 2.2 2.0–2.4 0.15 0.12–0.20
Congo 373 237–541 29 18–42 52 29–81 40 20–67
DPR Koreac 513 446–584 - - - - - -
DR Congo 320 207–457 11 11–11 49 29–75 11 7.2–16
Ethiopia 140 98–188 6.5 6.3–6.6 19 12–28 2.5 1.7–3.4
Indiad 193 132–266 2.7 2.7–2.7 32 30–34 0.69 0.44–1.0
Indonesia 312 285–341 2.2 0.95–4.1 34 32–36 1.7 0.71–3.2
Kenya 267 163–396 26 26–26 37 21–58 24 15–36
Lesotho 654 406–959 62 60–63 57 32–88 168 103–248
Liberia 308 199–440 14 14–15 56 33–85 17 11–25
Mozambique 361 223–532 34 34–34 19 10–31 18 11–28
Myanmar 322 212–454 7.8 7.7–8.0 36 21–54 5.8 3.8–8.1
Namibia 486 348–647 32 31–33 57 36–82 50 35–69
Nigeria 219 143–311 11 10–11 63 37–97 14 8.5–20
Pakistan 263 187–353 0.90 0.73–1.1 19 16–24 0.90 0.58–1.3
Papua New Guinea 432 352–521 3.8 2.0–6.3 47 31–66 3.5 1.7–6.1
Philippines 554 311–866 1.9 1.1–3.0 25 22–29 0.75 <0.01–4.0
Russian Federation 50 32–71 23 23–24 5.8 5.4–6.1 0.88 0.38–1.6
Sierra Leone 295 190–422 13 13–14 31 18–47 8.7 5.5–13
South Africa 615 427–835 58 58–58 38 36–40 62 25–115
Thailand 150 114–191 10 9.8–10 14 10–18 2.8 2.0–3.7
UR Tanzania 237 112–408 24 24–24 35 16–61 20 9.8–34
Viet Nam 176 112–255 3.3 3.2–3.4 9.8 6.1–14 2.0 1.3–2.9
Zambia 333 216–474 46 46–47 33 20–50 53 34–76
Zimbabwe 199 147–258 60 59–60 11 7.4–16 31 22–42
High TB burden countries 177 156–198 7.8 6.7–8.9 21 20–23 3.4 2.8–4.1
Africa 226 201–252 24 22–26 35 29–41 16 13–19
The Americas 29 27–31 10 7.8–13 1.7 1.6–1.8 0.58 0.52–0.65
Eastern Mediterranean 114 90–141 0.97 0.41–1.8 11 9.0–12 0.38 0.27–0.50
Europe 26 23–30 12 7.9–18 2.2 2.1–2.3 0.45 0.34–0.59
South-East Asia 217 173–266 2.7 2.0–3.5 32 30–34 1.0 0.75–1.3
Western Pacific 93 77–111 2.0 1.1–3.2 4.4 4.0–4.7 0.33 0.27–0.39
Global 130 116–143 8.2 7.0–9.5 16 15–17 2.7 2.3–3.1
a Numbers shown to two significant figures if under 100 and to three significant figures otherwise.b Deaths among HIV-positive TB cases are classified as HIV deaths according to ICD-10.c WHO estimates of TB incidence among people living with HIV and of TB mortality are not shown for DPR Korea because they had not been approved by national
authorities at the time of report publication.d Estimates of TB incidence and mortality for India are interim, pending results from the national TB prevalence survey (2020/2021).
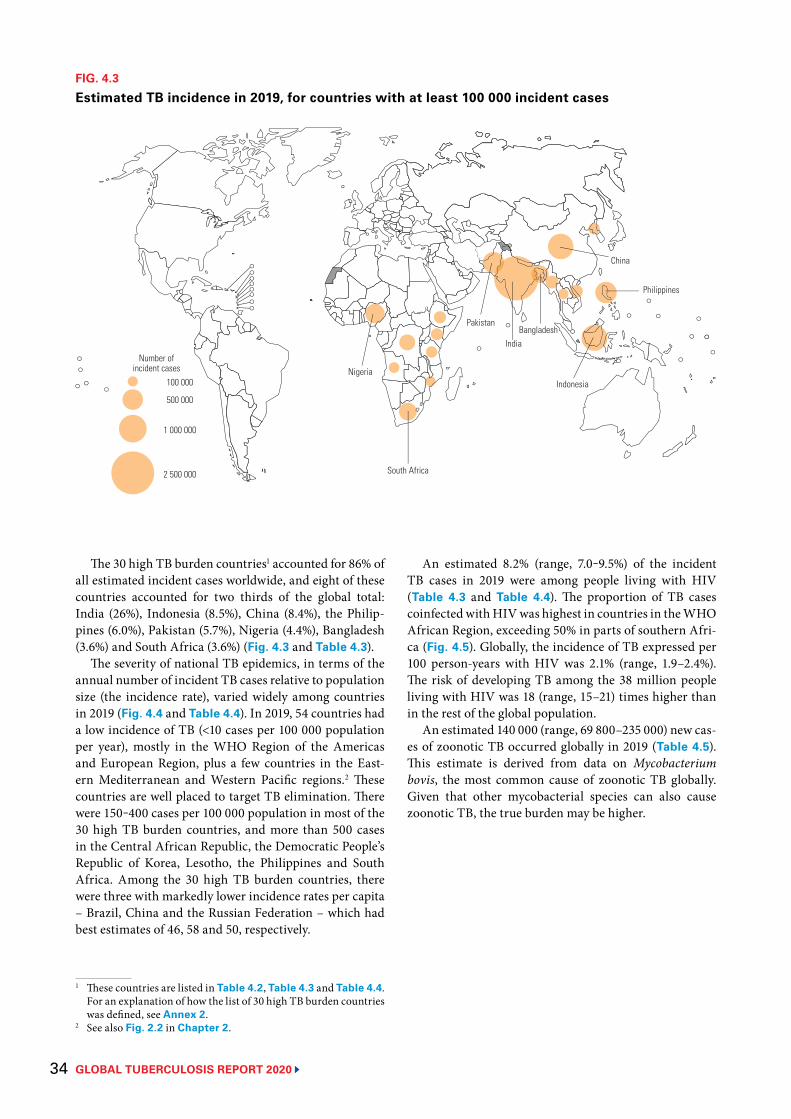
GLOBAL TUBERCULOSIS REPORT 2020 34
The 30 high TB burden countries1 accounted for 86% of all estimated incident cases worldwide, and eight of these countries accounted for two thirds of the global total: India (26%), Indonesia (8.5%), China (8.4%), the Philip-pines (6.0%), Pakistan (5.7%), Nigeria (4.4%), Bangladesh (3.6%) and South Africa (3.6%) (Fig. 4.3 and Table 4.3).
The severity of national TB epidemics, in terms of the annual number of incident TB cases relative to population size (the incidence rate), varied widely among countries in 2019 (Fig. 4.4 and Table 4.4). In 2019, 54 countries had a low incidence of TB (<10 cases per 100 000 population per year), mostly in the WHO Region of the Americas and European Region, plus a few countries in the East-ern Mediterranean and Western Pacific regions.2 These countries are well placed to target TB elimination. There were 150‒400 cases per 100 000 population in most of the 30 high TB burden countries, and more than 500 cases in the Central African Republic, the Democratic People’s Republic of Korea, Lesotho, the Philippines and South Africa. Among the 30 high TB burden countries, there were three with markedly lower incidence rates per capita – Brazil, China and the Russian Federation – which had best estimates of 46, 58 and 50, respectively.
1 These countries are listed in Table 4.2, Table 4.3 and Table 4.4. For an explanation of how the list of 30 high TB burden countries was defined, see Annex 2.
2 See also Fig. 2.2 in Chapter 2.
FIG. 4.3
Estimated TB incidence in 2019, for countries with at least 100 000 incident cases
Number ofincident cases
100 000
500 000
1 000 000
2 500 000
Nigeria
South Africa
Pakistan
India
Indonesia
Philippines
China
Bangladesh
An estimated 8.2% (range, 7.0‒9.5%) of the incident TB cases in 2019 were among people living with HIV (Table 4.3 and Table 4.4). The proportion of TB cases coinfected with HIV was highest in countries in the WHO African Region, exceeding 50% in parts of southern Afri-ca (Fig. 4.5). Globally, the incidence of TB expressed per 100 person-years with HIV was 2.1% (range, 1.9–2.4%). The risk of developing TB among the 38 million people living with HIV was 18 (range, 15–21) times higher than in the rest of the global population.
An estimated 140 000 (range, 69 800–235 000) new cas-es of zoonotic TB occurred globally in 2019 (Table 4.5). This estimate is derived from data on Mycobacterium bovis, the most common cause of zoonotic TB globally. Given that other mycobacterial species can also cause zoonotic TB, the true burden may be higher.
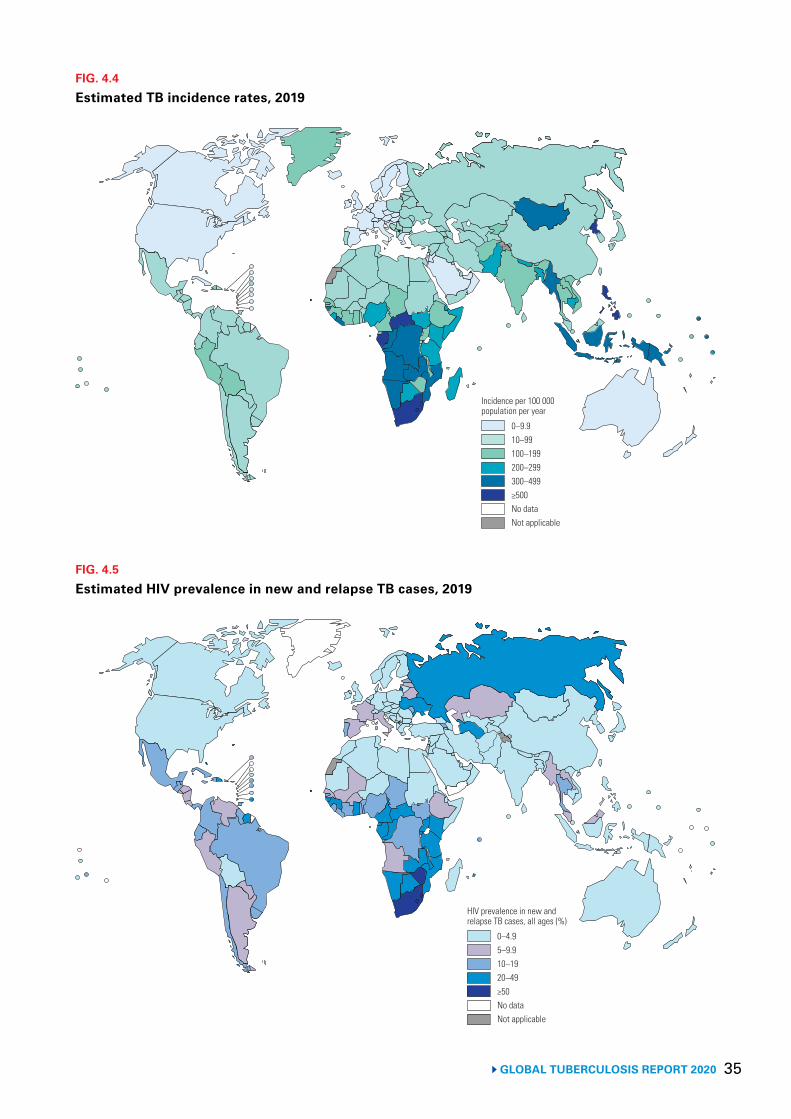
35 GLOBAL TUBERCULOSIS REPORT 2020
FIG. 4.4
Estimated TB incidence rates, 2019
0–9.910–99100–199200–299300–499≥500No dataNot applicable
Incidence per 100 000 population per year
FIG. 4.5
Estimated HIV prevalence in new and relapse TB cases, 2019
0–4.95–9.910–1920–49≥50No dataNot applicable
HIV prevalence in new and relapse TB cases, all ages (%)
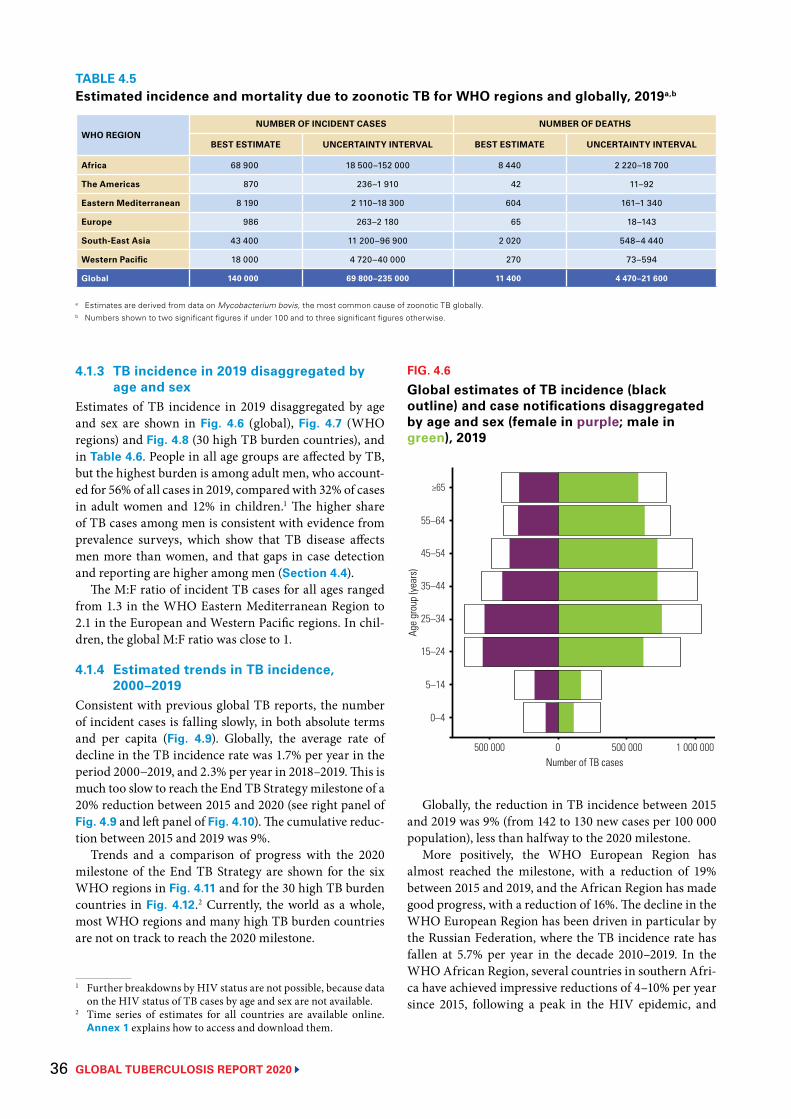
GLOBAL TUBERCULOSIS REPORT 2020 36
TABLE 4.5Estimated incidence and mortality due to zoonotic TB for WHO regions and globally, 2019a,b
WHO REGIONNUMBER OF INCIDENT CASES NUMBER OF DEATHS
BEST ESTIMATE UNCERTAINTY INTERVAL BEST ESTIMATE UNCERTAINTY INTERVAL
Africa 68 900 18 500–152 000 8 440 2 220–18 700
The Americas 870 236–1 910 42 11–92
Eastern Mediterranean 8 190 2 110–18 300 604 161–1 340
Europe 986 263–2 180 65 18–143
South-East Asia 43 400 11 200–96 900 2 020 548–4 440
Western Pacific 18 000 4 720–40 000 270 73–594
Global 140 000 69 800–235 000 11 400 4 470–21 600
a Estimates are derived from data on Mycobacterium bovis, the most common cause of zoonotic TB globally.b Numbers shown to two significant figures if under 100 and to three significant figures otherwise.
4.1.3 TB incidence in 2019 disaggregated by age and sex
Estimates of TB incidence in 2019 disaggregated by age and sex are shown in Fig. 4.6 (global), Fig. 4.7 (WHO regions) and Fig. 4.8 (30 high TB burden countries), and in Table 4.6. People in all age groups are affected by TB, but the highest burden is among adult men, who account-ed for 56% of all cases in 2019, compared with 32% of cases in adult women and 12% in children.1 The higher share of TB cases among men is consistent with evidence from prevalence surveys, which show that TB disease affects men more than women, and that gaps in case detection and reporting are higher among men (Section 4.4).
The M:F ratio of incident TB cases for all ages ranged from 1.3 in the WHO Eastern Mediterranean Region to 2.1 in the European and Western Pacific regions. In chil-dren, the global M:F ratio was close to 1.
4.1.4 Estimated trends in TB incidence, 2000–2019
Consistent with previous global TB reports, the number of incident cases is falling slowly, in both absolute terms and per capita (Fig. 4.9). Globally, the average rate of decline in the TB incidence rate was 1.7% per year in the period 2000−2019, and 2.3% per year in 2018–2019. This is much too slow to reach the End TB Strategy milestone of a 20% reduction between 2015 and 2020 (see right panel of Fig. 4.9 and left panel of Fig. 4.10). The cumulative reduc-tion between 2015 and 2019 was 9%.
Trends and a comparison of progress with the 2020 milestone of the End TB Strategy are shown for the six WHO regions in Fig. 4.11 and for the 30 high TB burden countries in Fig. 4.12.2 Currently, the world as a whole, most WHO regions and many high TB burden countries are not on track to reach the 2020 milestone.
1 Further breakdowns by HIV status are not possible, because data on the HIV status of TB cases by age and sex are not available.
2 Time series of estimates for all countries are available online. Annex 1 explains how to access and download them.
Globally, the reduction in TB incidence between 2015 and 2019 was 9% (from 142 to 130 new cases per 100 000 population), less than halfway to the 2020 milestone.
More positively, the WHO European Region has almost reached the milestone, with a reduction of 19% between 2015 and 2019, and the African Region has made good progress, with a reduction of 16%. The decline in the WHO European Region has been driven in particular by the Russian Federation, where the TB incidence rate has fallen at 5.7% per year in the decade 2010–2019. In the WHO African Region, several countries in southern Afri-ca have achieved impressive reductions of 4–10% per year since 2015, following a peak in the HIV epidemic, and
FIG. 4.6
Global estimates of TB incidence (black outline) and case notifications disaggregated by age and sex (female in purple; male in green), 2019
Age
grou
p (ye
ars)
25–34
5–14
0–4
≥65
45–54
500 000 0 500 000 1 000 000
15–24
55–64
35–44
Number of TB cases
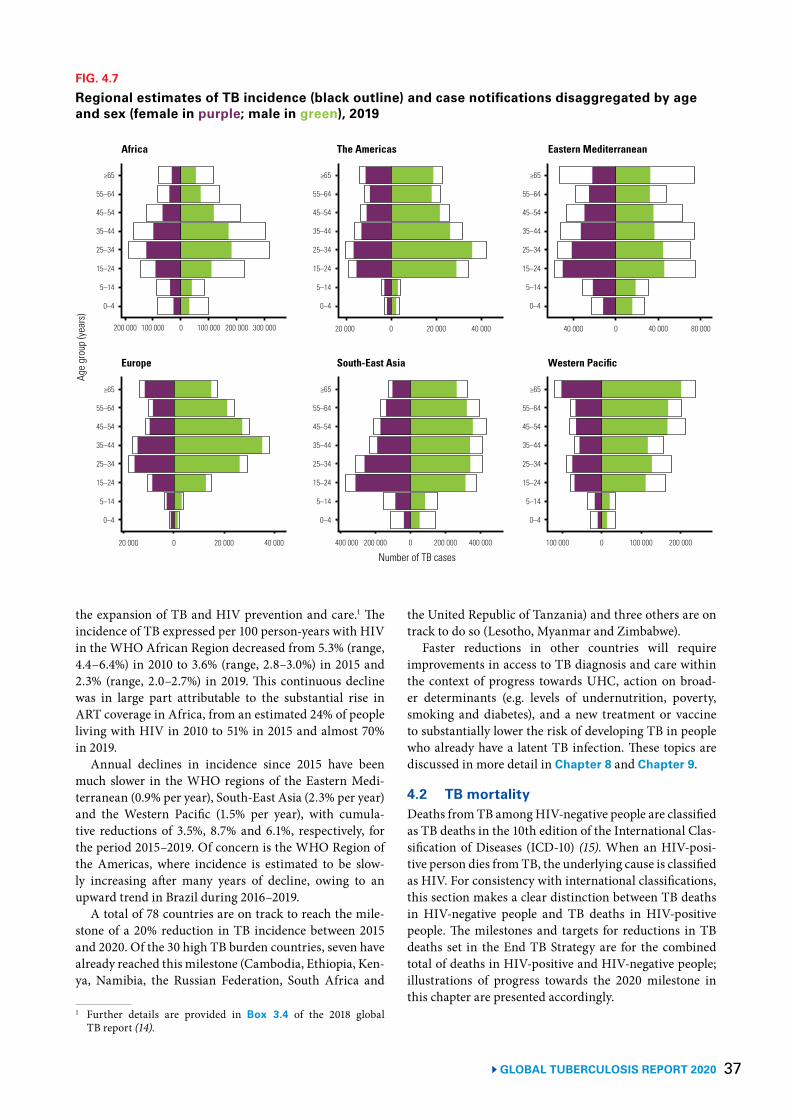
37 GLOBAL TUBERCULOSIS REPORT 2020
the expansion of TB and HIV prevention and care.1 The incidence of TB expressed per 100 person-years with HIV in the WHO African Region decreased from 5.3% (range, 4.4–6.4%) in 2010 to 3.6% (range, 2.8–3.0%) in 2015 and 2.3% (range, 2.0–2.7%) in 2019. This continuous decline was in large part attributable to the substantial rise in ART coverage in Africa, from an estimated 24% of people living with HIV in 2010 to 51% in 2015 and almost 70% in 2019.
Annual declines in incidence since 2015 have been much slower in the WHO regions of the Eastern Medi-terranean (0.9% per year), South-East Asia (2.3% per year) and the Western Pacific (1.5% per year), with cumula-tive reductions of 3.5%, 8.7% and 6.1%, respectively, for the period 2015–2019. Of concern is the WHO Region of the Americas, where incidence is estimated to be slow-ly increasing after many years of decline, owing to an upward trend in Brazil during 2016–2019.
A total of 78 countries are on track to reach the mile-stone of a 20% reduction in TB incidence between 2015 and 2020. Of the 30 high TB burden countries, seven have already reached this milestone (Cambodia, Ethiopia, Ken-ya, Namibia, the Russian Federation, South Africa and
1 Further details are provided in Box 3.4 of the 2018 global TB report (14).
FIG. 4.7
Regional estimates of TB incidence (black outline) and case notifications disaggregated by age and sex (female in purple; male in green), 2019
Age
grou
p (ye
ars)
Africa The Americas Eastern Mediterranean
Europe South-East Asia
200 000 100 000 0 100 000 200 000 300 000 20 000 0 20 000 40 000 40 000 0 40 000 80 000
20 000 0 20 000 40 000 400 000 200 000 0 200 000 400 000
25–34
5–14
0–4
≥65
45–54
15–24
55–64
35–44
25–34
5–14
0–4
≥65
45–54
15–24
55–64
35–44
25–34
5–14
0–4
≥65
45–54
15–24
55–64
35–44
25–34
5–14
0–4
≥65
45–54
15–24
55–64
35–44
25–34
5–14
0–4
≥65
45–54
15–24
55–64
35–44
25–34
5–14
0–4
≥65
45–54
15–24
55–64
35–44
Western Pacific
Number of TB cases100 000 0 100 000 200 000
the United Republic of Tanzania) and three others are on track to do so (Lesotho, Myanmar and Zimbabwe).
Faster reductions in other countries will require improvements in access to TB diagnosis and care within the context of progress towards UHC, action on broad-er determinants (e.g. levels of undernutrition, poverty, smoking and diabetes), and a new treatment or vaccine to substantially lower the risk of developing TB in people who already have a latent TB infection. These topics are discussed in more detail in Chapter 8 and Chapter 9.
4.2 TB mortalityDeaths from TB among HIV-negative people are classified as TB deaths in the 10th edition of the International Clas-sification of Diseases (ICD-10) (15). When an HIV-posi-tive person dies from TB, the underlying cause is classified as HIV. For consistency with international classifications, this section makes a clear distinction between TB deaths in HIV-negative people and TB deaths in HIV-positive people. The milestones and targets for reductions in TB deaths set in the End TB Strategy are for the combined total of deaths in HIV-positive and HIV-negative people; illustrations of progress towards the 2020 milestone in this chapter are presented accordingly.
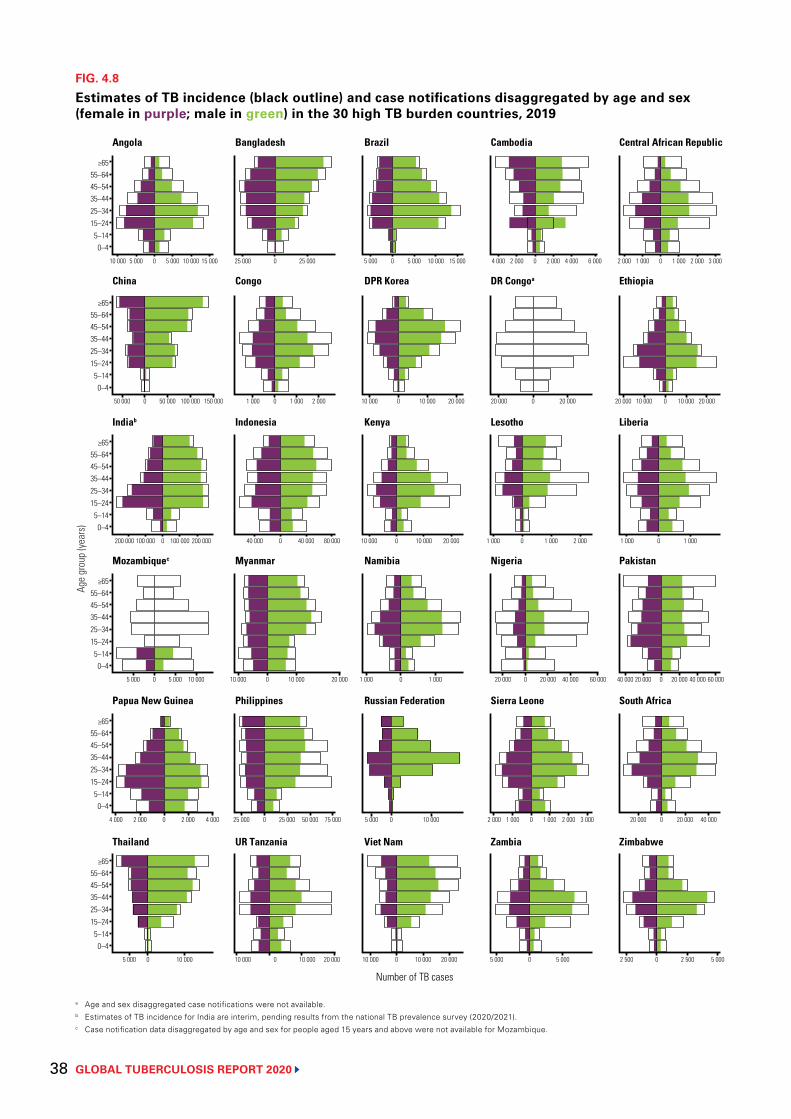
GLOBAL TUBERCULOSIS REPORT 2020 38
FIG. 4.8
Estimates of TB incidence (black outline) and case notifications disaggregated by age and sex (female in purple; male in green) in the 30 high TB burden countries, 2019
a Age and sex disaggregated case notifications were not available.b Estimates of TB incidence for India are interim, pending results from the national TB prevalence survey (2020/2021).c Case notification data disaggregated by age and sex for people aged 15 years and above were not available for Mozambique.
≥6555–6445–5435–4425–3415–24
5–140–4
≥6555–6445–5435–4425–3415–24
5–140–4
≥6555–6445–5435–4425–3415–24
5–140–4
≥6555–6445–5435–4425–3415–24
5–140–4
≥6555–6445–5435–4425–3415–24
5–140–4
≥6555–6445–5435–4425–3415–24
5–140–4
10 000 5 000 0 5 000 10 000 15 000 25 000 0 25 000 5 000 0 5 000 10 000 15 000 4 000 2 000 0 2 000 4 000 6 000 2 000 1 000 0 1 000 2 000 3 000
50 000 0 50 000 100 000 150 000 1 000 0 1 000 2 000 10 000 0 10 000 20 000 20 000 0 20 000 20 000 10 000 0 10 000 20 000
200 000 100 000 0 100 000 200 000 40 000 0 40 000 80 000 10 000 0 10 000 20 000 1 000 0 1 000 2 000 1 000 0 1 000
5 000 0 5 000 10 000 10 000 0 10 000 20 000 1 000 0 1 000 20 000 0 20 000 40 000 60 000 40 000 20 000 0 20 000 40 000 60 000
4 000 2 000 0 2 000 4 000 25 000 0 25 000 50 000 75 000 5 000 0 10 000 2 000 1 000 0 1 000 2 000 3 000 20 000 0 20 000 40 000
5 000 0 10 000 10 000 0 10 000 20 000 10 000 0 10 000 20 000 5 000 0 5 000 2 500 0 2 500 5 000
Number of TB cases
Age
grou
p (ye
ars)
Angola Bangladesh Brazil Cambodia Central African Republic
China Congo DPR Korea DR Congoa Ethiopia
Indiab Indonesia Kenya Lesotho Liberia
Mozambiquec Myanmar Namibia Nigeria Pakistan
Papua New Guinea Philippines Russian Federation Sierra Leone South Africa
Thailand UR Tanzania Viet Nam Zambia Zimbabwe
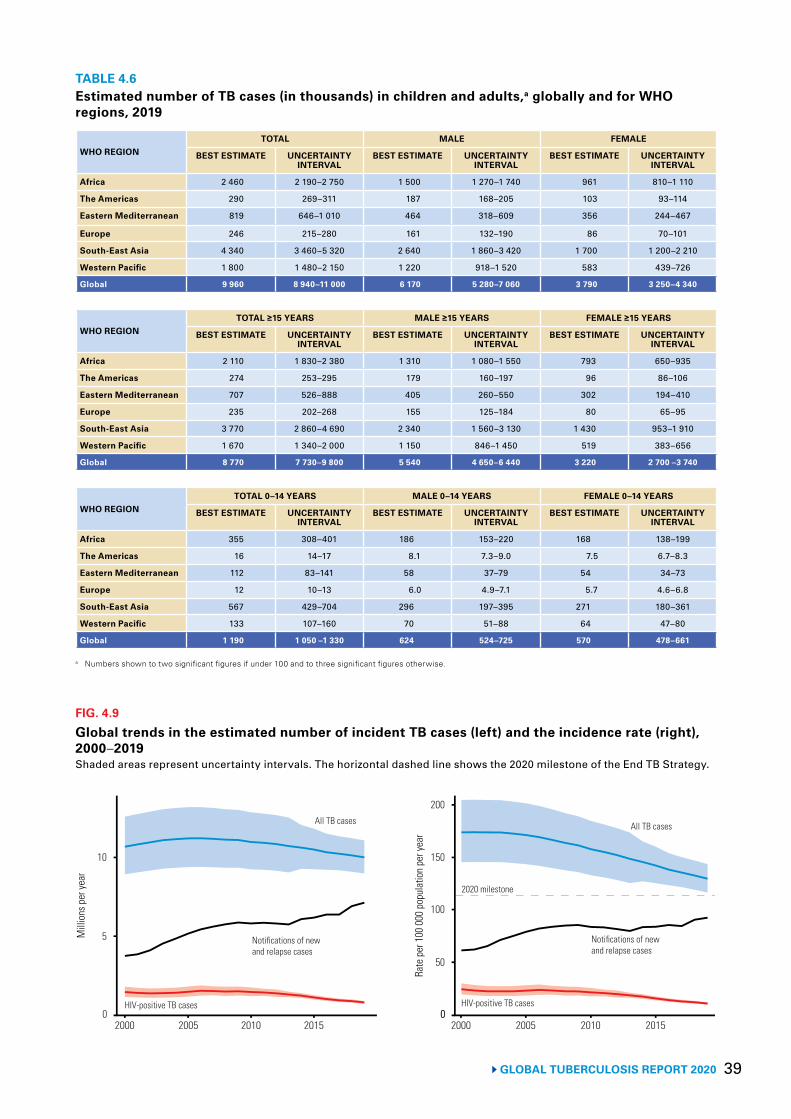
39 GLOBAL TUBERCULOSIS REPORT 2020
TABLE 4.6Estimated number of TB cases (in thousands) in children and adults,a globally and for WHO regions, 2019
WHO REGIONTOTAL MALE FEMALE
BEST ESTIMATE UNCERTAINTY INTERVAL
BEST ESTIMATE UNCERTAINTY INTERVAL
BEST ESTIMATE UNCERTAINTY INTERVAL
Africa 2 460 2 190–2 750 1 500 1 270–1 740 961 810–1 110
The Americas 290 269–311 187 168–205 103 93–114
Eastern Mediterranean 819 646–1 010 464 318–609 356 244–467
Europe 246 215–280 161 132–190 86 70–101
South-East Asia 4 340 3 460–5 320 2 640 1 860–3 420 1 700 1 200–2 210
Western Pacific 1 800 1 480–2 150 1 220 918–1 520 583 439–726
Global 9 960 8 940–11 000 6 170 5 280–7 060 3 790 3 250–4 340
WHO REGIONTOTAL ≥15 YEARS MALE ≥15 YEARS FEMALE ≥15 YEARS
BEST ESTIMATE UNCERTAINTY INTERVAL
BEST ESTIMATE UNCERTAINTY INTERVAL
BEST ESTIMATE UNCERTAINTY INTERVAL
Africa 2 110 1 830–2 380 1 310 1 080–1 550 793 650–935
The Americas 274 253–295 179 160–197 96 86–106
Eastern Mediterranean 707 526–888 405 260–550 302 194–410
Europe 235 202–268 155 125–184 80 65–95
South-East Asia 3 770 2 860–4 690 2 340 1 560–3 130 1 430 953–1 910
Western Pacific 1 670 1 340–2 000 1 150 846–1 450 519 383–656
Global 8 770 7 730–9 800 5 540 4 650–6 440 3 220 2 700 –3 740
WHO REGIONTOTAL 0–14 YEARS MALE 0–14 YEARS FEMALE 0–14 YEARS
BEST ESTIMATE UNCERTAINTY INTERVAL
BEST ESTIMATE UNCERTAINTY INTERVAL
BEST ESTIMATE UNCERTAINTY INTERVAL
Africa 355 308–401 186 153–220 168 138–199
The Americas 16 14–17 8.1 7.3–9.0 7.5 6.7–8.3
Eastern Mediterranean 112 83–141 58 37–79 54 34–73
Europe 12 10–13 6.0 4.9–7.1 5.7 4.6–6.8
South-East Asia 567 429–704 296 197–395 271 180–361
Western Pacific 133 107–160 70 51–88 64 47–80
Global 1 190 1 050 –1 330 624 524–725 570 478–661
a Numbers shown to two significant figures if under 100 and to three significant figures otherwise.
FIG. 4.9
Global trends in the estimated number of incident TB cases (left) and the incidence rate (right), 2000–2019Shaded areas represent uncertainty intervals. The horizontal dashed line shows the 2020 milestone of the End TB Strategy.
Mill
ions
per
year
5
0
10
2000 2005 2010 2015
Rate
per
100
000
pop
ulat
ion
per y
ear
100
50
0
2020 milestone
All TB cases
Notifications of newand relapse cases
HIV-positive TB cases
150
2000 2005 2010 2015
200
0
All TB cases
Notifications of newand relapse cases
HIV-positive TB cases
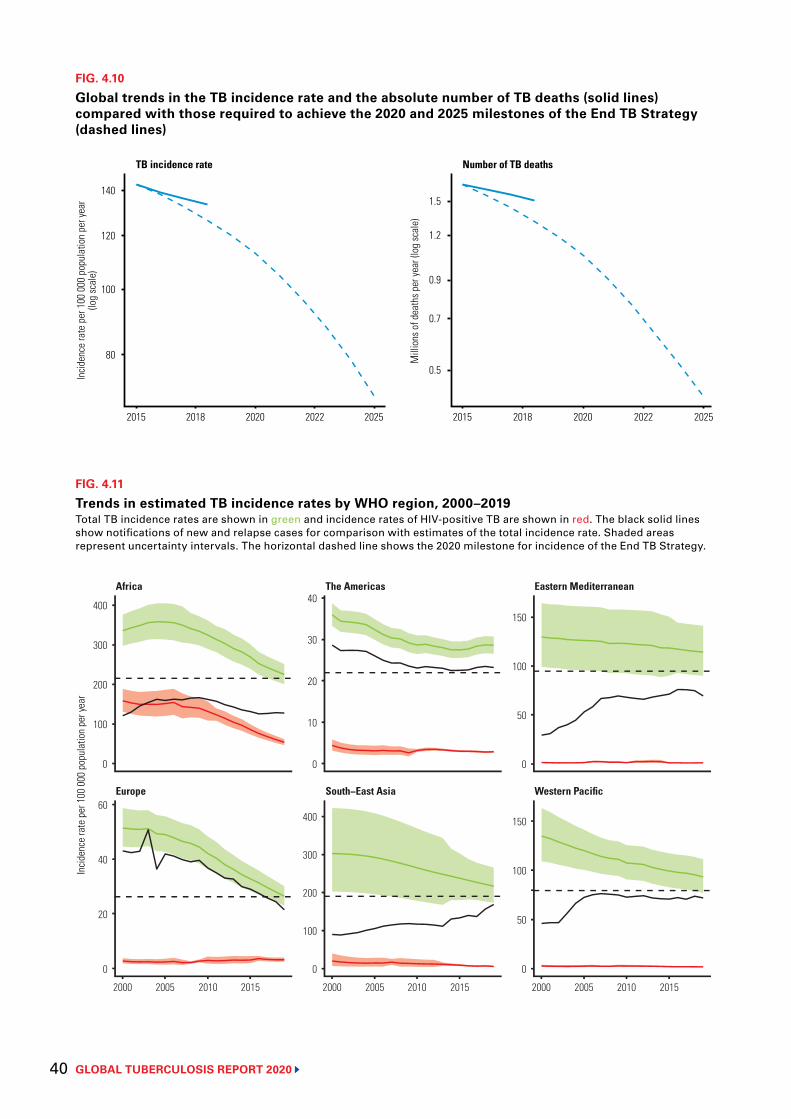
GLOBAL TUBERCULOSIS REPORT 2020 40
FIG. 4.10
Global trends in the TB incidence rate and the absolute number of TB deaths (solid lines) compared with those required to achieve the 2020 and 2025 milestones of the End TB Strategy (dashed lines)
2015 2018 2020 2022 2025 2015 2018 2020 2022 2025
140
120
100
80
Incid
ence
rate
per
100
000
pop
ulat
ion
per y
ear
(log
scal
e)
1.5
1.2
0.9
0.7
0.5
Mill
ions
of d
eath
s per
year
(log
scal
e)
TB incidence rate Number of TB deaths
FIG. 4.11
Trends in estimated TB incidence rates by WHO region, 2000–2019Total TB incidence rates are shown in green and incidence rates of HIV-positive TB are shown in red. The black solid lines show notifications of new and relapse cases for comparison with estimates of the total incidence rate. Shaded areas represent uncertainty intervals. The horizontal dashed line shows the 2020 milestone for incidence of the End TB Strategy.
Incid
ence
rate
per
100
000
pop
ulat
ion
per y
ear
Europe South−East Asia Western Pacific
Africa The Americas Eastern Mediterranean
2000 2005 2010 2015 2000 2005 2010 2015
0
50
100
150
0
50
100
150
0
10
20
30
40
0
100
200
300
400
0
100
200
300
400
0
20
40
60
2000 2005 2010 2015
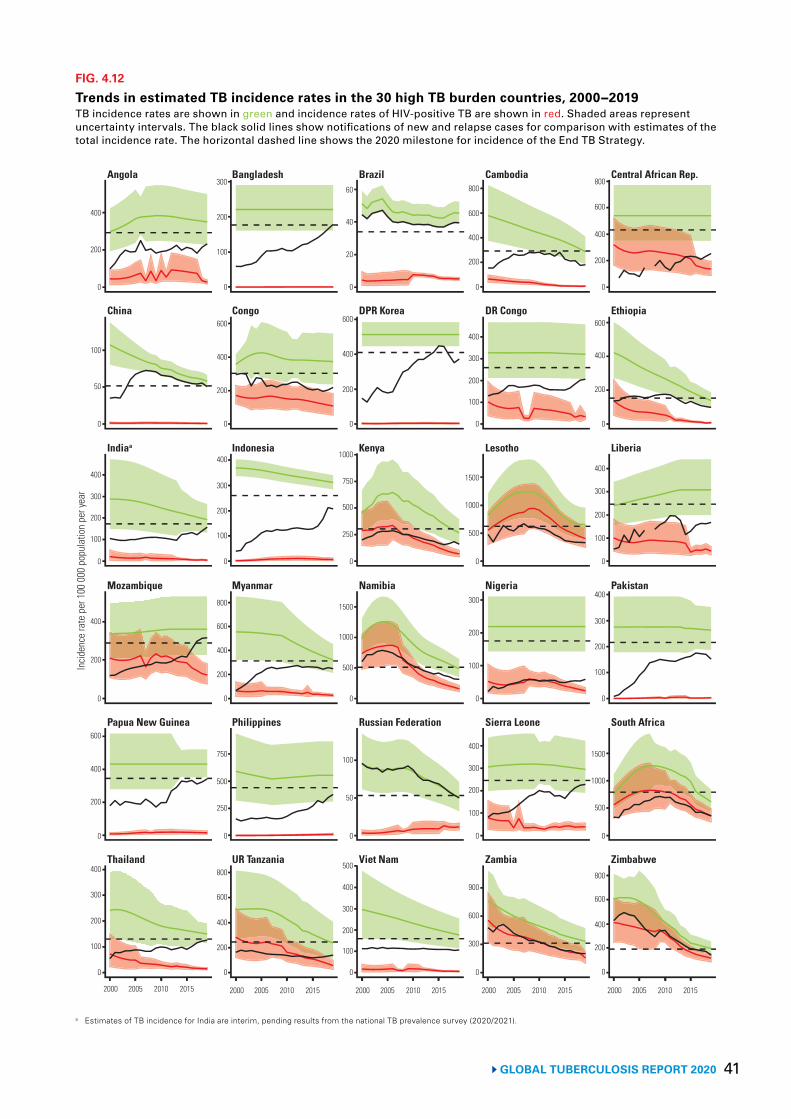
41GLOBAL TUBERCULOSIS REPORT 2020
FIG. 4.12
Trends in estimated TB incidence rates in the 30 high TB burden countries, 2000−2019TB incidence rates are shown in green and incidence rates of HIV-positive TB are shown in red. Shaded areas represent uncertainty intervals. The black solid lines show notifications of new and relapse cases for comparison with estimates of the total incidence rate. The horizontal dashed line shows the 2020 milestone for incidence of the End TB Strategy.
a Estimates of TB incidence for India are interim, pending results from the national TB prevalence survey (2020/2021).
2000 2005 2010 2015 2000 2005 2010 2015 2000 2005 2010 2015 2000 2005 2010 2015 2000 2005 2010 2015
0
200
400
0
50
100
0
100
200
300
400
0
200
400
0
200
400
600
0
100
200
300
400
Incid
ence
rate
per
100
000
pop
ulat
ion
per y
ear
0
20
40
60
0
200
400
600
0
250
500
750
1000
0
500
1000
1500
0
50
100
0
100
200
300
400
500
0
200
400
600
800
0
200
400
600
0
100
200
300
400
0
100
200
300
400
0
500
1000
1500
0
200
400
600
800
200
400
600
800
100
200
300
400
500
1000
1500
100
200
300
0
0
0
0
100
200
300
400
0
300
600
900
0
100
200
300
0
200
400
600
0
100
200
300
400
0
200
400
600
800
0
250
500
750
0
200
400
600
800
0
Thailand UR Tanzania Viet Nam Zambia Zimbabwe
Papua New Guinea Philippines Russian Federation Sierra Leone South Africa
Indiaa Indonesia Kenya Lesotho Liberia
China Congo DPR Korea DR Congo Ethiopia
Angola Bangladesh Brazil Cambodia Central African Rep.
Mozambique Myanmar Namibia PakistanNigeria
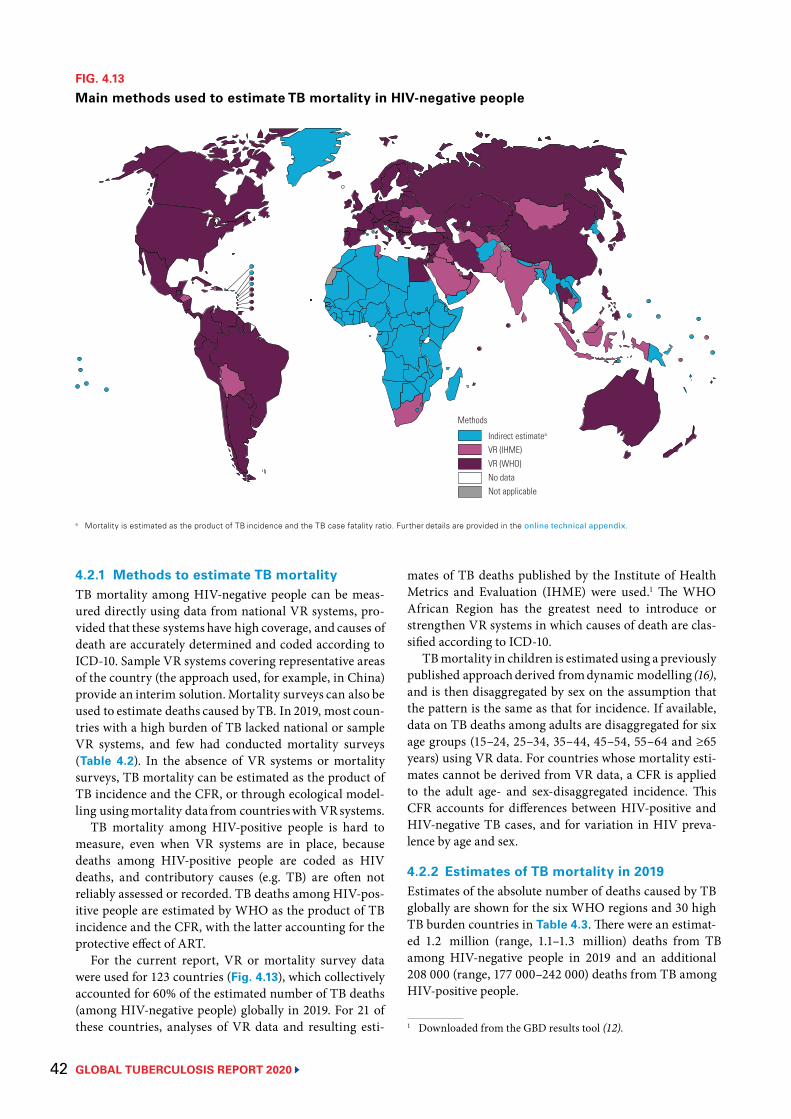
GLOBAL TUBERCULOSIS REPORT 202042
4.2.1 Methods to estimate TB mortalityTB mortality among HIV-negative people can be meas-ured directly using data from national VR systems, pro-vided that these systems have high coverage, and causes ofdeath are accurately determined and coded according toICD-10. Sample VR systems covering representative areasof the country (the approach used, for example, in China)provide an interim solution.Mortality surveys can also beused to estimate deaths caused by TB. In 2019, most coun-tries with a high burden of TB lacked national or sampleVR systems, and few had conducted mortality surveys(Table 4.2). In the absence of VR systems or mortalitysurveys, TB mortality can be estimated as the product ofTB incidence and the CFR, or through ecological model-ling usingmortality data from countrieswith VRsystems.
TB mortality among HIV-positive people is hard tomeasure, even when VR systems are in place, becausedeaths among HIV-positive people are coded as HIVdeaths, and contributory causes (e.g. TB) are often notreliably assessed or recorded. TB deaths among HIV-pos-itive people are estimated by WHO as the product of TBincidence and the CFR, with the latter accounting for theprotective effect of ART.
For the current report, VR or mortality survey datawere used for 123 countries (Fig. 4.13), which collectivelyaccounted for 60% of the estimated number of TB deaths(among HIV-negative people) globally in 2019. For 21 ofthese countries, analyses of VR data and resulting esti-
FIG. 4.13
Main methods used to estimate TB mortality in HIV-negative people
Indirect estimatea
VR (IHME)VR (WHO)No dataNot applicable
Methods
a Mortality is estimated as the product of TB incidence and the TB case fatality ratio. Further details are provided in the online technical appendix.
mates of TB deaths published by the Institute of HealthMetrics and Evaluation (IHME) were used.1 The WHOAfrican Region has the greatest need to introduce orstrengthen VR systems in which causes of death are clas-sified according to ICD-10.
TBmortality in children is estimated using a previouslypublished approachderived fromdynamic modelling (16),and is then disaggregated by sex on the assumption thatthe pattern is the same as that for incidence. If available,data on TB deaths among adults are disaggregated for sixage groups (15–24, 25–34, 35–44, 45–54, 55–64 and ≥65years) using VR data. For countries whose mortality esti-mates cannot be derived from VR data, a CFR is appliedto the adult age- and sex-disaggregated incidence. ThisCFR accounts for differences between HIV-positive andHIV-negative TB cases, and for variation in HIV preva-lence by age and sex.
4.2.2 Estimates of TB mortality in 2019Estimates of the absolute number of deaths caused by TBglobally are shown for the six WHO regions and 30 highTB burden countries in Table 4.3. There were an estimat-ed 1.2 million (range, 1.1–1.3 million) deaths from TBamong HIV-negative people in 2019 and an additional208 000 (range, 177 000–242 000) deaths from TB amongHIV-positive people.
1 Downloaded from the GBD results tool (12).
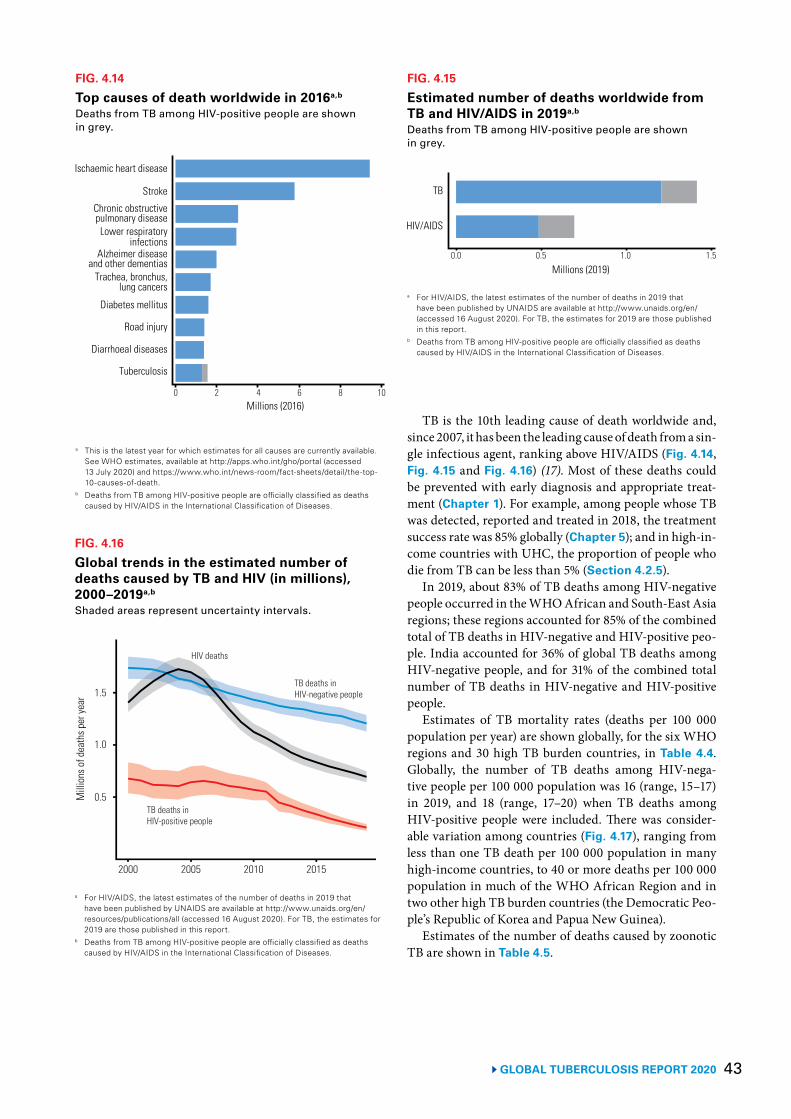
43 GLOBAL TUBERCULOSIS REPORT 2020
TB is the 10th leading cause of death worldwide and, since 2007, it has been the leading cause of death from a sin-gle infectious agent, ranking above HIV/AIDS (Fig. 4.14, Fig. 4.15 and Fig. 4.16) (17). Most of these deaths could be prevented with early diagnosis and appropriate treat-ment (Chapter 1). For example, among people whose TB was detected, reported and treated in 2018, the treatment success rate was 85% globally (Chapter 5); and in high-in-come countries with UHC, the proportion of people who die from TB can be less than 5% (Section 4.2.5).
In 2019, about 83% of TB deaths among HIV-negative people occurred in the WHO African and South-East Asia regions; these regions accounted for 85% of the combined total of TB deaths in HIV-negative and HIV-positive peo-ple. India accounted for 36% of global TB deaths among HIV-negative people, and for 31% of the combined total number of TB deaths in HIV-negative and HIV-positive people.
Estimates of TB mortality rates (deaths per 100 000 population per year) are shown globally, for the six WHO regions and 30 high TB burden countries, in Table 4.4. Globally, the number of TB deaths among HIV-nega-tive people per 100 000 population was 16 (range, 15–17) in 2019, and 18 (range, 17–20) when TB deaths among HIV-positive people were included. There was consider-able variation among countries (Fig. 4.17), ranging from less than one TB death per 100 000 population in many high-income countries, to 40 or more deaths per 100 000 population in much of the WHO African Region and in two other high TB burden countries (the Democratic Peo-ple’s Republic of Korea and Papua New Guinea).
Estimates of the number of deaths caused by zoonotic TB are shown in Table 4.5.
FIG. 4.14
Top causes of death worldwide in 2016a,b
Deaths from TB among HIV-positive people are shown in grey.
a This is the latest year for which estimates for all causes are currently available. See WHO estimates, available at http://apps.who.int/gho/portal (accessed 13 July 2020) and https://www.who.int/news-room/fact-sheets/detail/the-top-10-causes-of-death.
b Deaths from TB among HIV-positive people are officially classified as deaths caused by HIV/AIDS in the International Classification of Diseases.
Ischaemic heart disease
Stroke
Chronic obstructivepulmonary diseaseLower respiratory
infectionsAlzheimer disease
and other dementiasTrachea, bronchus,
lung cancers
Diabetes mellitus
Road injury
Diarrhoeal diseases
Tuberculosis
0 2 4 6 8 10Millions (2016)
FIG. 4.15
Estimated number of deaths worldwide from TB and HIV/AIDS in 2019a,b Deaths from TB among HIV-positive people are shown in grey.
TB
HIV/AIDS
0.0 0.5 1.0 1.5
Millions (2019)
a For HIV/AIDS, the latest estimates of the number of deaths in 2019 that have been published by UNAIDS are available at http://www.unaids.org/en/ (accessed 16 August 2020). For TB, the estimates for 2019 are those published in this report.
b Deaths from TB among HIV-positive people are officially classified as deaths caused by HIV/AIDS in the International Classification of Diseases.
FIG. 4.16
Global trends in the estimated number of deaths caused by TB and HIV (in millions), 2000–2019a,b
Shaded areas represent uncertainty intervals.
Mill
ions
of d
eath
s per
year
0.5
1.5
2000 2005 2010 2015
HIV deaths
TB deaths inHIV-negative people
TB deaths inHIV-positive people
1.0
a For HIV/AIDS, the latest estimates of the number of deaths in 2019 that have been published by UNAIDS are available at http://www.unaids.org/en/resources/publications/all (accessed 16 August 2020). For TB, the estimates for 2019 are those published in this report.
b Deaths from TB among HIV-positive people are officially classified as deaths caused by HIV/AIDS in the International Classification of Diseases.
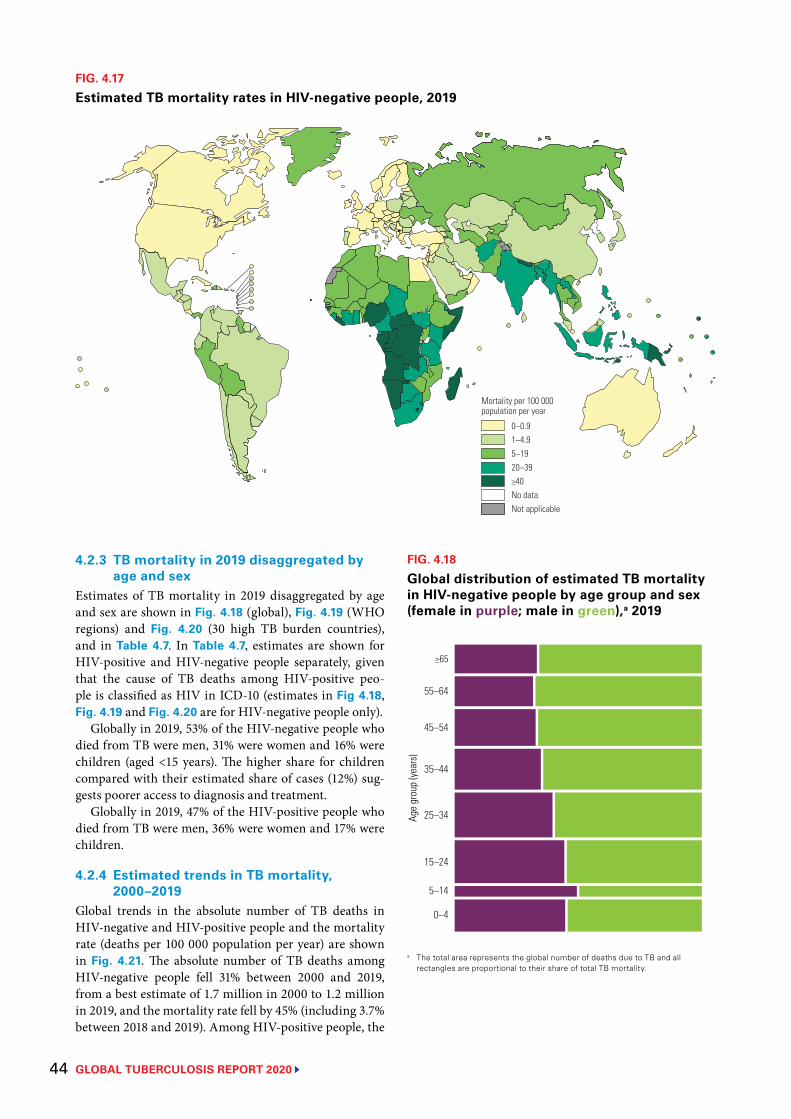
GLOBAL TUBERCULOSIS REPORT 2020 44
FIG. 4.17
Estimated TB mortality rates in HIV-negative people, 2019
0–0.91–4.95–1920–39≥40No dataNot applicable
Mortality per 100 000 population per year
4.2.3 TB mortality in 2019 disaggregated by age and sex
Estimates of TB mortality in 2019 disaggregated by age and sex are shown in Fig. 4.18 (global), Fig. 4.19 (WHO regions) and Fig. 4.20 (30 high TB burden countries), and in Table 4.7. In Table 4.7, estimates are shown for HIV-positive and HIV-negative people separately, given that the cause of TB deaths among HIV-positive peo-ple is classified as HIV in ICD-10 (estimates in Fig 4.18, Fig. 4.19 and Fig. 4.20 are for HIV-negative people only).
Globally in 2019, 53% of the HIV-negative people who died from TB were men, 31% were women and 16% were children (aged <15 years). The higher share for children compared with their estimated share of cases (12%) sug-gests poorer access to diagnosis and treatment.
Globally in 2019, 47% of the HIV-positive people who died from TB were men, 36% were women and 17% were children.
4.2.4 Estimated trends in TB mortality, 2000–2019
Global trends in the absolute number of TB deaths in HIV-negative and HIV-positive people and the mortality rate (deaths per 100 000 population per year) are shown in Fig. 4.21. The absolute number of TB deaths among HIV-negative people fell 31% between 2000 and 2019, from a best estimate of 1.7 million in 2000 to 1.2 million in 2019, and the mortality rate fell by 45% (including 3.7% between 2018 and 2019). Among HIV-positive people, the
FIG. 4.18
Global distribution of estimated TB mortality in HIV-negative people by age group and sex (female in purple; male in green),a 2019
Age
grou
p (ye
ars)
25–34
5–14
0–4
≥65
45–54
15–24
55–64
35–44
a The total area represents the global number of deaths due to TB and all rectangles are proportional to their share of total TB mortality.
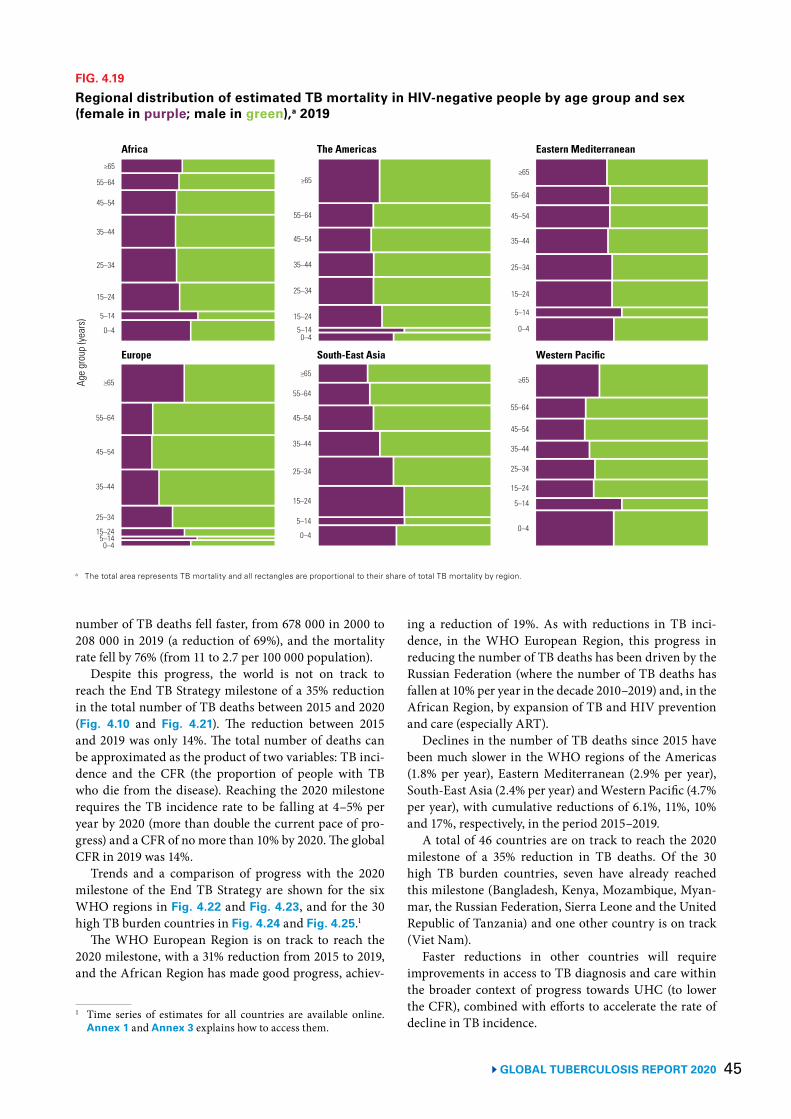
45 GLOBAL TUBERCULOSIS REPORT 2020
FIG. 4.19
Regional distribution of estimated TB mortality in HIV-negative people by age group and sex (female in purple; male in green),a 2019
a The total area represents TB mortality and all rectangles are proportional to their share of total TB mortality by region.
Age
grou
p (ye
ars)
Africa The Americas Eastern Mediterranean
Europe South-East Asia
25–34
5–14
0–4
≥65
45–54
15–24
55–64
35–44
25–34
5–140–4
≥65
45–54
15–24
55–64
35–44 25–34
5–14
0–4
≥65
45–54
15–24
55–64
35–44
25–34
5–140–4
≥65
45–54
15–24
55–64
35–44
25–34
5–14
0–4
≥65
45–54
15–24
55–64
35–44
25–34
5–14
0–4
≥65
45–54
15–24
55–64
35–44
Western Pacific
number of TB deaths fell faster, from 678 000 in 2000 to 208 000 in 2019 (a reduction of 69%), and the mortality rate fell by 76% (from 11 to 2.7 per 100 000 population).
Despite this progress, the world is not on track to reach the End TB Strategy milestone of a 35% reduction in the total number of TB deaths between 2015 and 2020 (Fig. 4.10 and Fig. 4.21). The reduction between 2015 and 2019 was only 14%. The total number of deaths can be approximated as the product of two variables: TB inci-dence and the CFR (the proportion of people with TB who die from the disease). Reaching the 2020 milestone requires the TB incidence rate to be falling at 4–5% per year by 2020 (more than double the current pace of pro-gress) and a CFR of no more than 10% by 2020. The global CFR in 2019 was 14%.
Trends and a comparison of progress with the 2020 milestone of the End TB Strategy are shown for the six WHO regions in Fig. 4.22 and Fig. 4.23, and for the 30 high TB burden countries in Fig. 4.24 and Fig. 4.25.1
The WHO European Region is on track to reach the 2020 milestone, with a 31% reduction from 2015 to 2019, and the African Region has made good progress, achiev-
1 Time series of estimates for all countries are available online. Annex 1 and Annex 3 explains how to access them.
ing a reduction of 19%. As with reductions in TB inci-dence, in the WHO European Region, this progress in reducing the number of TB deaths has been driven by the Russian Federation (where the number of TB deaths has fallen at 10% per year in the decade 2010–2019) and, in the African Region, by expansion of TB and HIV prevention and care (especially ART).
Declines in the number of TB deaths since 2015 have been much slower in the WHO regions of the Americas (1.8% per year), Eastern Mediterranean (2.9% per year), South-East Asia (2.4% per year) and Western Pacific (4.7% per year), with cumulative reductions of 6.1%, 11%, 10% and 17%, respectively, in the period 2015–2019.
A total of 46 countries are on track to reach the 2020 milestone of a 35% reduction in TB deaths. Of the 30 high TB burden countries, seven have already reached this milestone (Bangladesh, Kenya, Mozambique, Myan-mar, the Russian Federation, Sierra Leone and the United Republic of Tanzania) and one other country is on track (Viet Nam).
Faster reductions in other countries will require improvements in access to TB diagnosis and care within the broader context of progress towards UHC (to lower the CFR), combined with efforts to accelerate the rate of decline in TB incidence.
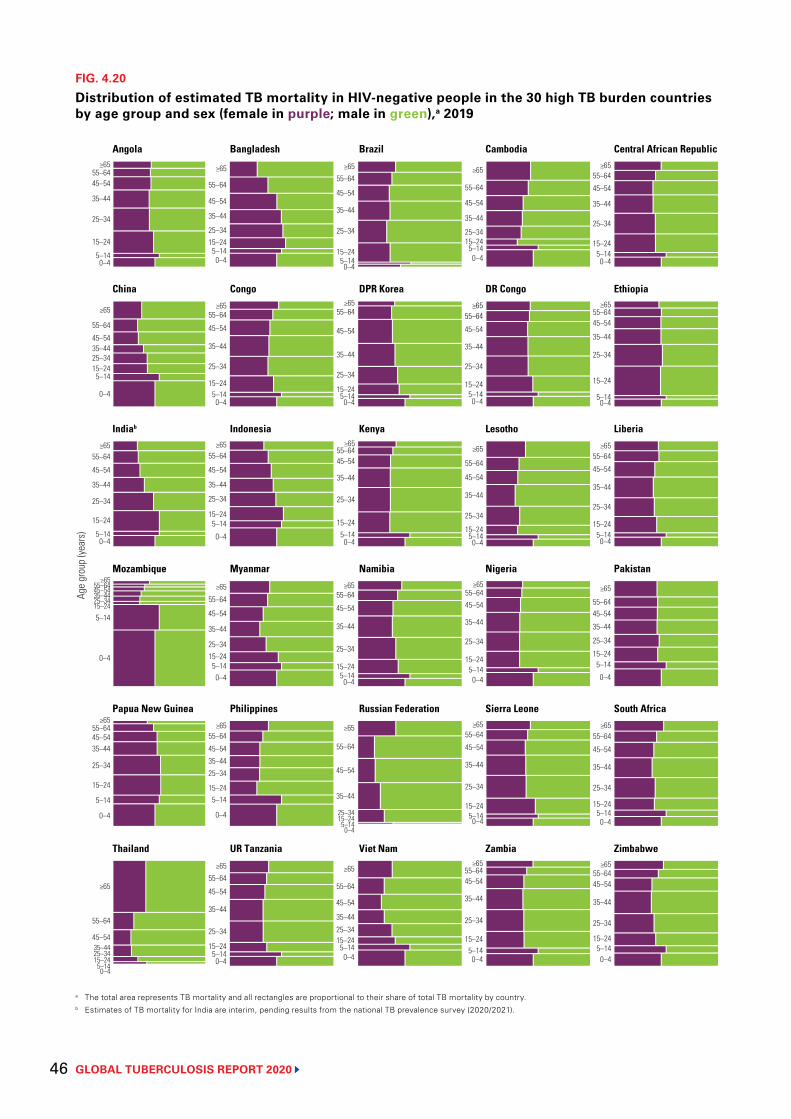
GLOBAL TUBERCULOSIS REPORT 2020 46
FIG. 4.20
Distribution of estimated TB mortality in HIV-negative people in the 30 high TB burden countries by age group and sex (female in purple; male in green),a 2019
a The total area represents TB mortality and all rectangles are proportional to their share of total TB mortality by country.b Estimates of TB mortality for India are interim, pending results from the national TB prevalence survey (2020/2021).
Age
grou
p (ye
ars)
25–34
5–140–4
≥65
45–54
15–24
55–64
Angola Bangladesh Brazil Cambodia Central African Republic
China Congo DPR Korea DR Congo Ethiopia
Indiab Indonesia Kenya Lesotho Liberia
Mozambique Myanmar Namibia Nigeria Pakistan
Papua New Guinea Philippines Russian Federation Sierra Leone South Africa
Thailand UR Tanzania Viet Nam Zambia Zimbabwe
35–44
25–34
5–14
0–4
≥65
45–54
15–24
55–64
35–44
25–34
5–140–4
≥65
45–54
15–24
55–64
35–44
25–34
5–14
0–4
≥6545–54
15–24
55–6435–44
25–34
5–14
0–4
≥65
45–54
15–24
55–64
35–44
25–34
5–140–4
≥65
45–54
15–24
55–64
35–44
25–34
5–140–4
≥65
45–54
15–24
55–64
35–44
25–34
5–140–4
≥65
45–54
15–24
55–64
35–44
25–34
5–14
0–4
≥65
45–54
15–24
55–64
35–44
25–34
5–140–4
≥65
45–54
15–24
55–64
35–44
25–34
5–14
0–4
≥65
45–54
15–24
55–64
35–44
25–34
5–140–4
≥65
45–54
15–24
55–64
35–44
25–34
5–140–4
≥65
45–54
15–24
55–64
35–44
25–34
5–140–4
≥65
45–54
15–24
55–64
35–44
25–34
5–140–4
≥65
45–54
15–24
55–64
35–44
25–34
5–140–4
≥65
45–54
15–24
55–64
35–44
25–34
5–140–4
≥65
45–54
15–24
55–64
35–44
25–34
5–140–4
≥65
45–54
15–24
55–64
35–44
25–34
5–140–4
≥65
45–54
15–24
55–64
35–44
25–34
5–140–4
≥65
45–54
15–24
55–64
35–44
25–34
5–140–4
≥65
45–54
15–24
55–64
35–44
25–34
5–140–4
≥65
45–54
15–24
55–64
35–44
25–34
5–140–4
≥65
45–54
15–24
55–64
35–44
25–34
5–140–4
≥65
45–54
15–24
55–64
35–44
25–34
5–140–4
≥65
45–54
15–24
55–64
35–44
25–34
5–140–4
≥65
45–54
15–24
55–64
35–44
25–34
5–140–4
≥65
45–54
15–24
55–64
35–44
25–34
5–14
0–4
≥65
45–54
15–24
55–64
35–44
25–34
5–140–4
≥65
45–54
15–24
55–64
35–44
25–34
5–140–4
≥65
45–54
15–24
55–64
35–44
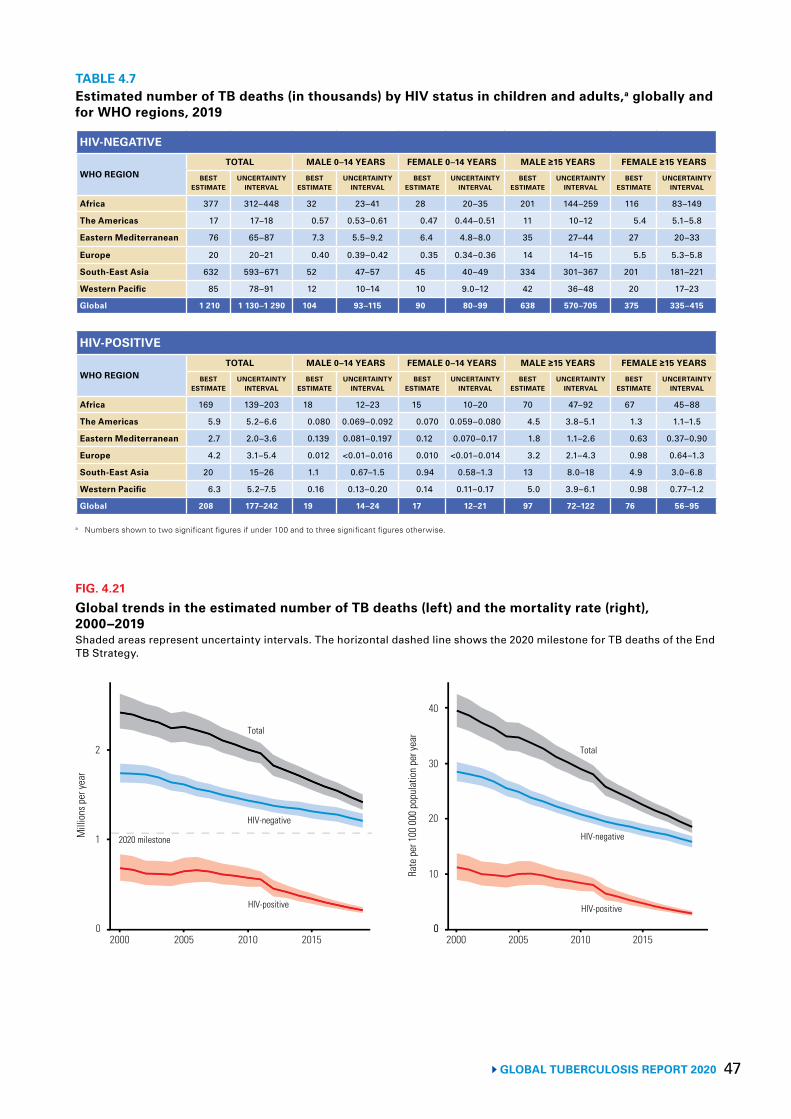
47 GLOBAL TUBERCULOSIS REPORT 2020
TABLE 4.7Estimated number of TB deaths (in thousands) by HIV status in children and adults,a globally and for WHO regions, 2019
HIV-NEGATIVE
WHO REGIONTOTAL MALE 0–14 YEARS FEMALE 0–14 YEARS MALE ≥15 YEARS FEMALE ≥15 YEARS
BEST ESTIMATE
UNCERTAINTY INTERVAL
BEST ESTIMATE
UNCERTAINTY INTERVAL
BEST ESTIMATE
UNCERTAINTY INTERVAL
BEST ESTIMATE
UNCERTAINTY INTERVAL
BEST ESTIMATE
UNCERTAINTY INTERVAL
Africa 377 312–448 32 23–41 28 20–35 201 144–259 116 83–149
The Americas 17 17–18 0.57 0.53–0.61 0.47 0.44–0.51 11 10–12 5.4 5.1–5.8
Eastern Mediterranean 76 65–87 7.3 5.5–9.2 6.4 4.8–8.0 35 27–44 27 20–33
Europe 20 20–21 0.40 0.39–0.42 0.35 0.34–0.36 14 14–15 5.5 5.3–5.8
South-East Asia 632 593–671 52 47–57 45 40–49 334 301–367 201 181–221
Western Pacific 85 78–91 12 10–14 10 9.0–12 42 36–48 20 17–23
Global 1 210 1 130–1 290 104 93–115 90 80–99 638 570–705 375 335–415
HIV-POSITIVE
WHO REGIONTOTAL MALE 0–14 YEARS FEMALE 0–14 YEARS MALE ≥15 YEARS FEMALE ≥15 YEARS
BEST ESTIMATE
UNCERTAINTY INTERVAL
BEST ESTIMATE
UNCERTAINTY INTERVAL
BEST ESTIMATE
UNCERTAINTY INTERVAL
BEST ESTIMATE
UNCERTAINTY INTERVAL
BEST ESTIMATE
UNCERTAINTY INTERVAL
Africa 169 139–203 18 12–23 15 10–20 70 47–92 67 45–88
The Americas 5.9 5.2–6.6 0.080 0.069–0.092 0.070 0.059–0.080 4.5 3.8–5.1 1.3 1.1–1.5
Eastern Mediterranean 2.7 2.0–3.6 0.139 0.081–0.197 0.12 0.070–0.17 1.8 1.1–2.6 0.63 0.37–0.90
Europe 4.2 3.1–5.4 0.012 <0.01–0.016 0.010 <0.01–0.014 3.2 2.1–4.3 0.98 0.64–1.3
South-East Asia 20 15–26 1.1 0.67–1.5 0.94 0.58–1.3 13 8.0–18 4.9 3.0–6.8
Western Pacific 6.3 5.2–7.5 0.16 0.13–0.20 0.14 0.11–0.17 5.0 3.9–6.1 0.98 0.77–1.2
Global 208 177–242 19 14–24 17 12–21 97 72–122 76 56–95
a Numbers shown to two significant figures if under 100 and to three significant figures otherwise.
FIG. 4.21
Global trends in the estimated number of TB deaths (left) and the mortality rate (right), 2000−2019Shaded areas represent uncertainty intervals. The horizontal dashed line shows the 2020 milestone for TB deaths of the End TB Strategy.
Mill
ions
per
year
1
0
2
2000 2005 2010 2015
Rate
per
100
000
pop
ulat
ion
per y
ear
20
10
0
2020 milestone
Total
HIV-negative
HIV-positive
30
2000 2005 2010 2015
40
0
Total
HIV-positive
HIV-negative
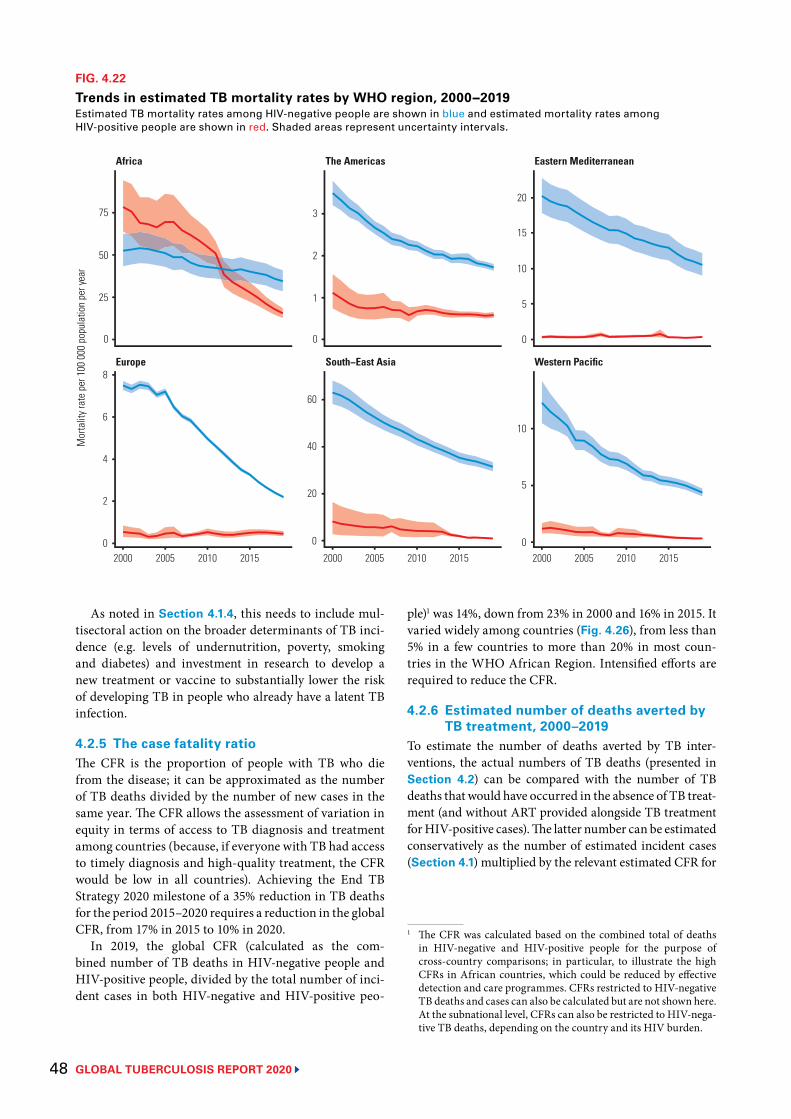
GLOBAL TUBERCULOSIS REPORT 2020 48
As noted in Section 4.1.4, this needs to include mul-tisectoral action on the broader determinants of TB inci-dence (e.g. levels of undernutrition, poverty, smoking and diabetes) and investment in research to develop a new treatment or vaccine to substantially lower the risk of developing TB in people who already have a latent TB infection.
4.2.5 The case fatality ratioThe CFR is the proportion of people with TB who die from the disease; it can be approximated as the number of TB deaths divided by the number of new cases in the same year. The CFR allows the assessment of variation in equity in terms of access to TB diagnosis and treatment among countries (because, if everyone with TB had access to timely diagnosis and high-quality treatment, the CFR would be low in all countries). Achieving the End TB Strategy 2020 milestone of a 35% reduction in TB deaths for the period 2015–2020 requires a reduction in the global CFR, from 17% in 2015 to 10% in 2020.
In 2019, the global CFR (calculated as the com-bined number of TB deaths in HIV-negative people and HIV-positive people, divided by the total number of inci-dent cases in both HIV-negative and HIV-positive peo-
FIG. 4.22
Trends in estimated TB mortality rates by WHO region, 2000−2019Estimated TB mortality rates among HIV-negative people are shown in blue and estimated mortality rates among HIV-positive people are shown in red. Shaded areas represent uncertainty intervals.
Mor
talit
y rat
e pe
r 100
000
pop
ulat
ion
per y
ear
Europe South−East Asia Western Pacific
Africa The Americas Eastern Mediterranean
2000 2005 2010 2015 2000 2005 2010 2015
0
10
15
20
0
5
10
1
2
3
0
20
40
60
25
50
75
0
2
4
8
2000 2005 2010 2015
6
5
0 0
ple)1 was 14%, down from 23% in 2000 and 16% in 2015. It varied widely among countries (Fig. 4.26), from less than 5% in a few countries to more than 20% in most coun-tries in the WHO African Region. Intensified efforts are required to reduce the CFR.
4.2.6 Estimated number of deaths averted by TB treatment, 2000–2019
To estimate the number of deaths averted by TB inter-ventions, the actual numbers of TB deaths (presented in Section 4.2) can be compared with the number of TB deaths that would have occurred in the absence of TB treat-ment (and without ART provided alongside TB treatment for HIV-positive cases). The latter number can be estimated conservatively as the number of estimated incident cases (Section 4.1) multiplied by the relevant estimated CFR for
1 The CFR was calculated based on the combined total of deaths in HIV-negative and HIV-positive people for the purpose of cross-country comparisons; in particular, to illustrate the high CFRs in African countries, which could be reduced by effective detection and care programmes. CFRs restricted to HIV-negative TB deaths and cases can also be calculated but are not shown here. At the subnational level, CFRs can also be restricted to HIV-nega-tive TB deaths, depending on the country and its HIV burden.
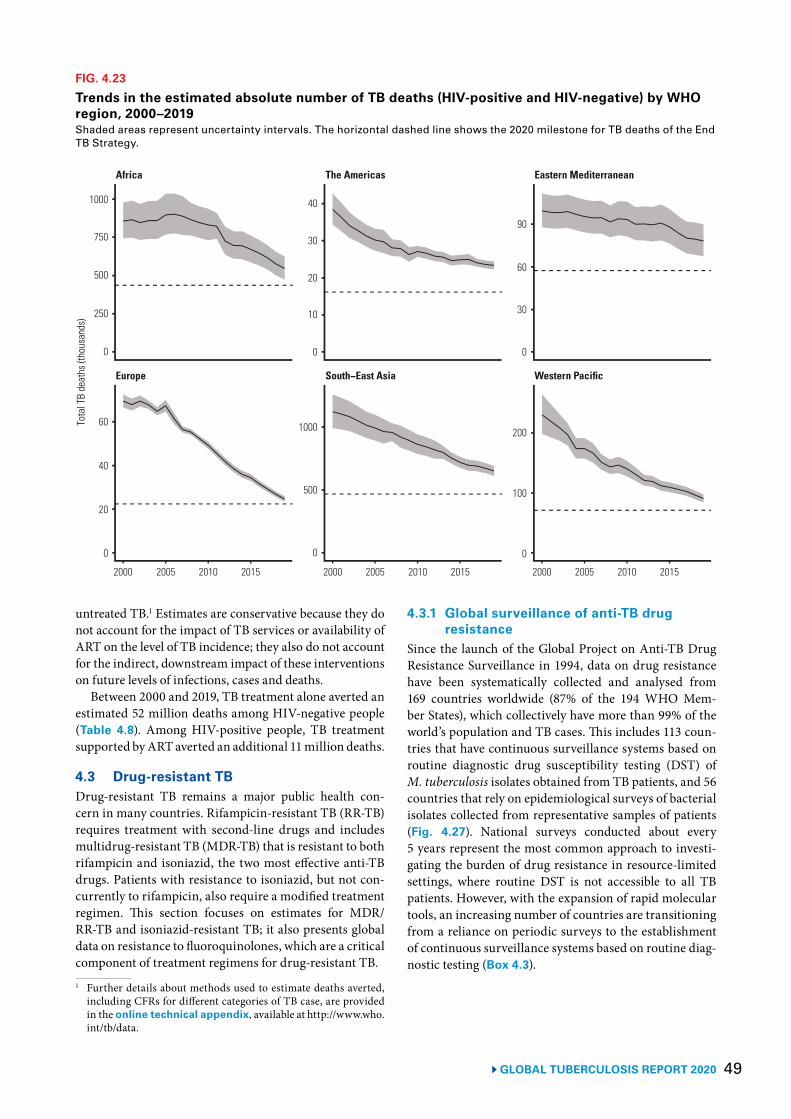
49 GLOBAL TUBERCULOSIS REPORT 2020
FIG. 4.23
Trends in the estimated absolute number of TB deaths (HIV-positive and HIV-negative) by WHO region, 2000–2019 Shaded areas represent uncertainty intervals. The horizontal dashed line shows the 2020 milestone for TB deaths of the End TB Strategy.
2000 2005 2010 2015 2000 2005 2010 2015
0
30
90
0
100
20
30
40
0
500
1000
500
750
1000
0
40
2000 2005 2010 2015
60Tota
l TB
deat
hs (t
hous
ands
)
Europe South−East Asia Western Pacific
Africa The Americas Eastern Mediterranean
20
10
200
250
0 0
60
untreated TB.1 Estimates are conservative because they do not account for the impact of TB services or availability of ART on the level of TB incidence; they also do not account for the indirect, downstream impact of these interventions on future levels of infections, cases and deaths.
Between 2000 and 2019, TB treatment alone averted an estimated 52 million deaths among HIV-negative people (Table 4.8). Among HIV-positive people, TB treatment supported by ART averted an additional 11 million deaths.
4.3 Drug-resistant TBDrug-resistant TB remains a major public health con-cern in many countries. Rifampicin-resistant TB (RR-TB) requires treatment with second-line drugs and includes multidrug-resistant TB (MDR-TB) that is resistant to both rifampicin and isoniazid, the two most effective anti-TB drugs. Patients with resistance to isoniazid, but not con-currently to rifampicin, also require a modified treatment regimen. This section focuses on estimates for MDR/RR-TB and isoniazid-resistant TB; it also presents global data on resistance to fluoroquinolones, which are a critical component of treatment regimens for drug-resistant TB.1 Further details about methods used to estimate deaths averted,
including CFRs for different categories of TB case, are provided in the online technical appendix, available at http://www.who.int/tb/data.
4.3.1 Global surveillance of anti-TB drug resistance
Since the launch of the Global Project on Anti-TB Drug Resistance Surveillance in 1994, data on drug resistance have been systematically collected and analysed from 169 countries worldwide (87% of the 194 WHO Mem-ber States), which collectively have more than 99% of the world’s population and TB cases. This includes 113 coun-tries that have continuous surveillance systems based on routine diagnostic drug susceptibility testing (DST) of M. tuberculosis isolates obtained from TB patients, and 56 countries that rely on epidemiological surveys of bacterial isolates collected from representative samples of patients (Fig. 4.27). National surveys conducted about every 5 years represent the most common approach to investi-gating the burden of drug resistance in resource-limited settings, where routine DST is not accessible to all TB patients. However, with the expansion of rapid molecular tools, an increasing number of countries are transitioning from a reliance on periodic surveys to the establishment of continuous surveillance systems based on routine diag-nostic testing (Box 4.3).
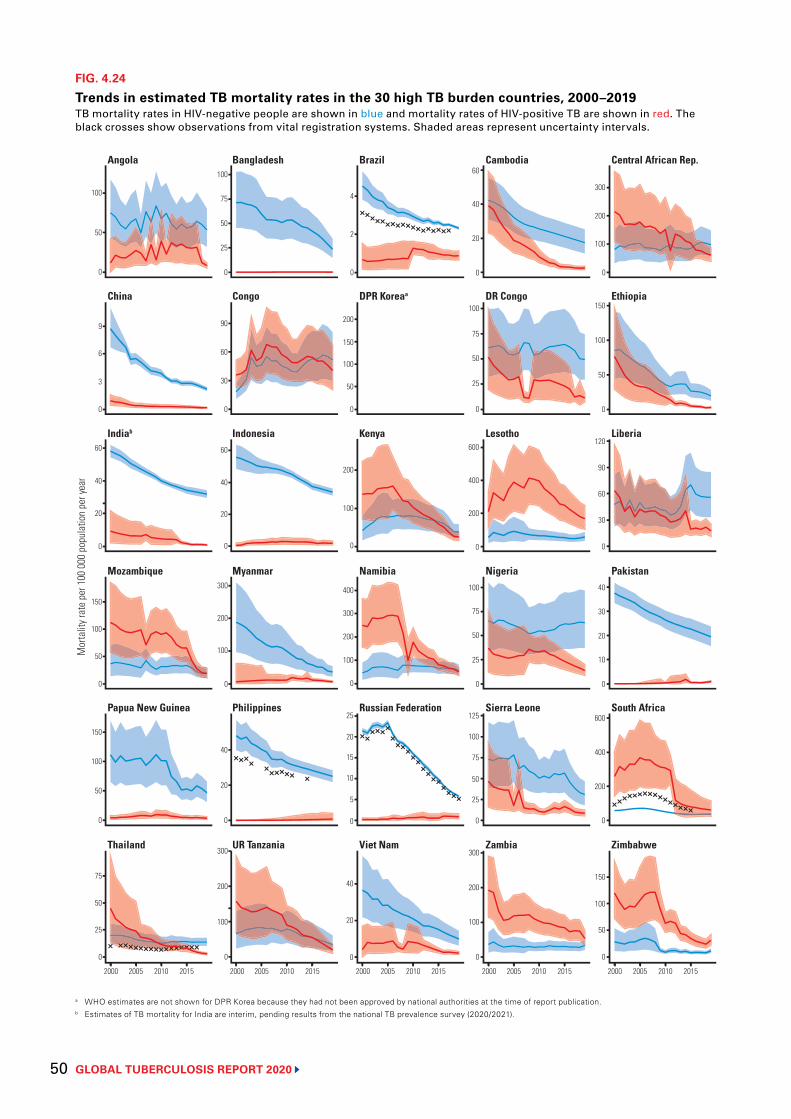
GLOBAL TUBERCULOSIS REPORT 2020 50
FIG. 4.24
Trends in estimated TB mortality rates in the 30 high TB burden countries, 2000–2019TB mortality rates in HIV-negative people are shown in blue and mortality rates of HIV-positive TB are shown in red. The black crosses show observations from vital registration systems. Shaded areas represent uncertainty intervals.
2000 2005 2010 2015 2000 2005 2010 2015 2000 2005 2010 2015 2000 2005 2010 2015 2000 2005 2010 2015
0
50
100
0
6
9
0
20
40
60
0
50
150
0
50
100
150
0
25
50
75
Mor
talit
y rat
e pe
r 100
000
pop
ulat
ion
per y
ear
0
2
4
0
50
150
200
0
100
200
0
200
300
400
0
5
20
0
20
40
0
100
200
300
0
50
100
150
0
30
60
90
120
0
10
20
30
40
0
200
400
600
0
50
100
150
20
40
60
25
50
75
100
200
400
600
50
75
100
0
0
0
0
25
50
75
100
0
100
200
300
0
25
75
100
0
30
60
90
0
20
40
60
0
100
200
300
0
20
40
0
100
200
300
0
3
100
50
25
10
15
100
100
25
125
Thailand UR Tanzania Viet Nam Zambia Zimbabwe
Papua New Guinea Philippines Russian Federation Sierra Leone South Africa
Indiab Indonesia Kenya Lesotho Liberia
China Congo DPR Koreaa DR Congo Ethiopia
Angola Bangladesh Brazil Cambodia Central African Rep.
Mozambique Myanmar Namibia PakistanNigeria
a WHO estimates are not shown for DPR Korea because they had not been approved by national authorities at the time of report publication. b Estimates of TB mortality for India are interim, pending results from the national TB prevalence survey (2020/2021).
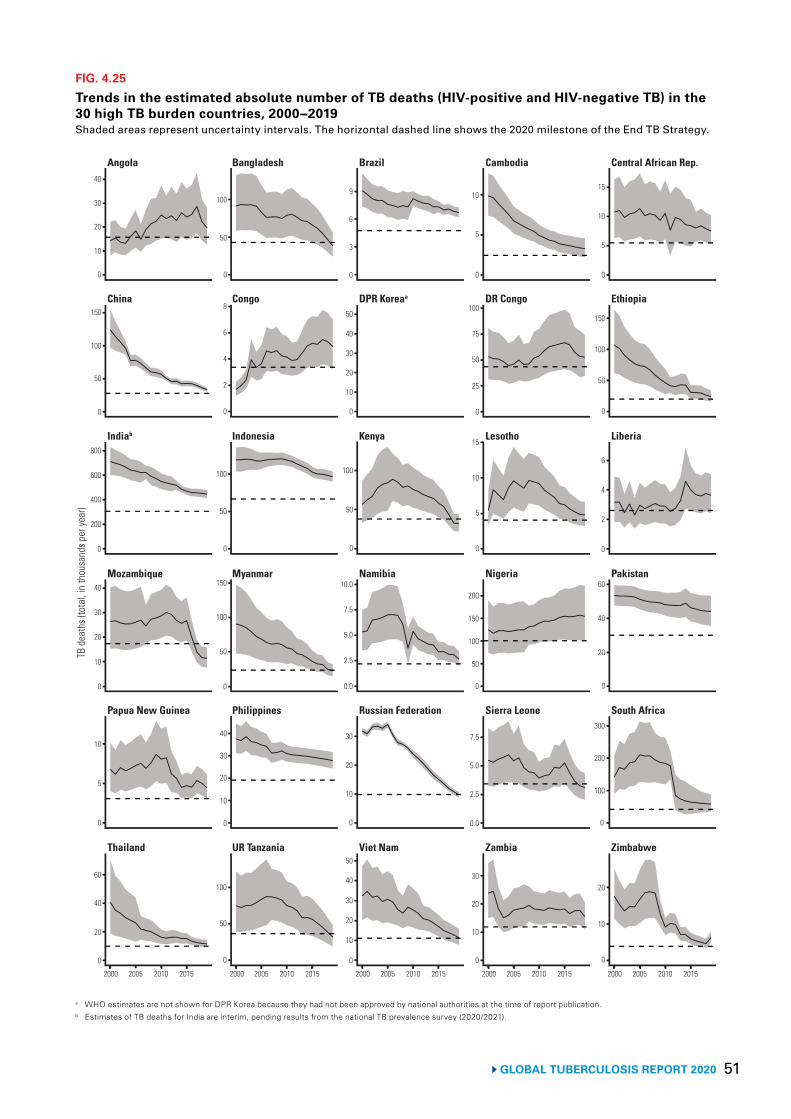
51 GLOBAL TUBERCULOSIS REPORT 2020
FIG. 4.25
Trends in the estimated absolute number of TB deaths (HIV-positive and HIV-negative TB) in the 30 high TB burden countries, 2000−2019Shaded areas represent uncertainty intervals. The horizontal dashed line shows the 2020 milestone of the End TB Strategy.
0
30
40
0
100
150
0
400
600
800
0
20
40
0
5
10
0
20
40
60
TB d
eath
s (to
tal,
in th
ousa
nds p
er ye
ar)
0
3
9
0
20
40
50
0
50
100
0.0
5.0
7.5
10.0
0
30
0
20
40
0
5
10
15
0
50
100
150
0
2
4
6
0
20
40
60
0
100
200
300
0
10
20
5
10
25
50
75
100
5
10
15
100
150
200
0
0
0
0
2.5
5.0
7.5
0.0
10
20
30
0
100
0
4
6
8
0
50
100
0
50
100
150
0
20
40
0
50
100
0
50
30
50
10
20
2.5
30
50
2000 2005 2010 2015 2000 2005 2010 2015 2000 2005 2010 2015 2000 2005 2010 2015 2000 2005 2010 2015
10
200
30
10
2
20
10
6
10
50
30
10
Thailand UR Tanzania Viet Nam Zambia Zimbabwe
Papua New Guinea Philippines Russian Federation Sierra Leone South Africa
Indiab Indonesia Kenya Lesotho Liberia
China Congo DPR Koreaa DR Congo Ethiopia
Angola Bangladesh Brazil Cambodia Central African Rep.
Mozambique Myanmar Namibia PakistanNigeria
a WHO estimates are not shown for DPR Korea because they had not been approved by national authorities at the time of report publication. b Estimates of TB deaths for India are interim, pending results from the national TB prevalence survey (2020/2021).
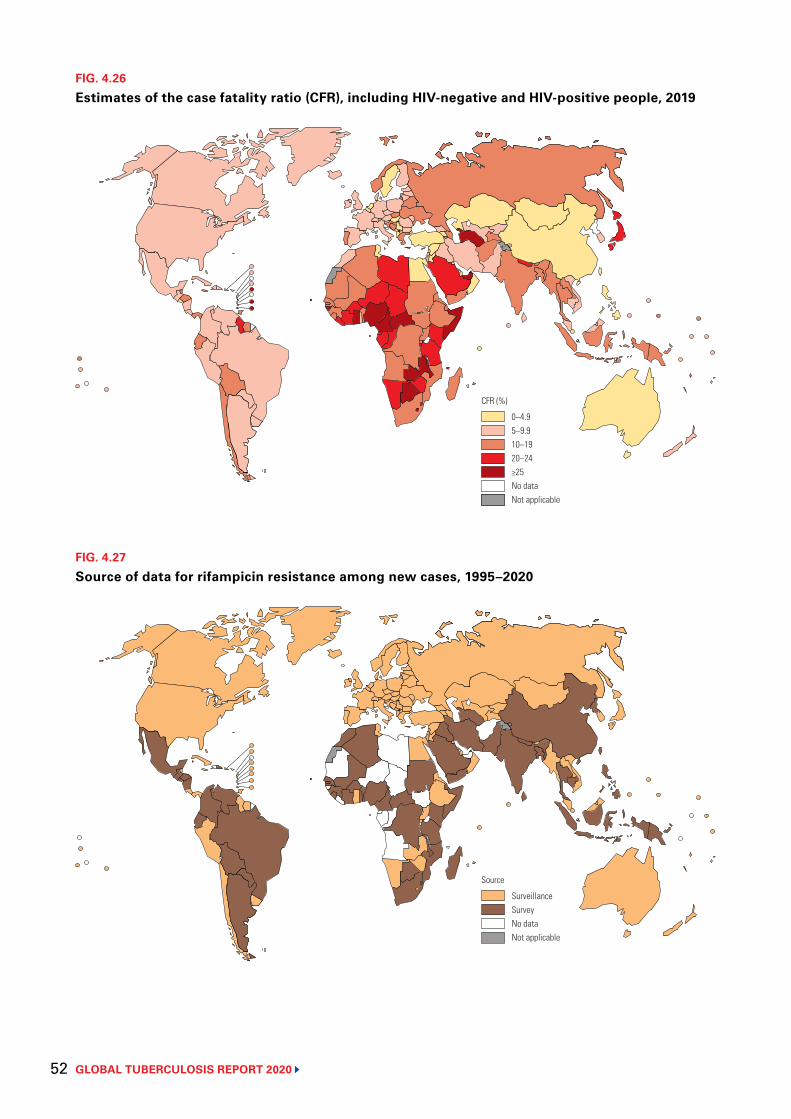
GLOBAL TUBERCULOSIS REPORT 2020 52
FIG. 4.26
Estimates of the case fatality ratio (CFR), including HIV-negative and HIV-positive people, 2019
0–4.95–9.910–1920–24≥25No dataNot applicable
CFR (%)
FIG. 4.27
Source of data for rifampicin resistance among new cases, 1995–2020
SurveillanceSurveyNo dataNot applicable
Source
BOX 4.3
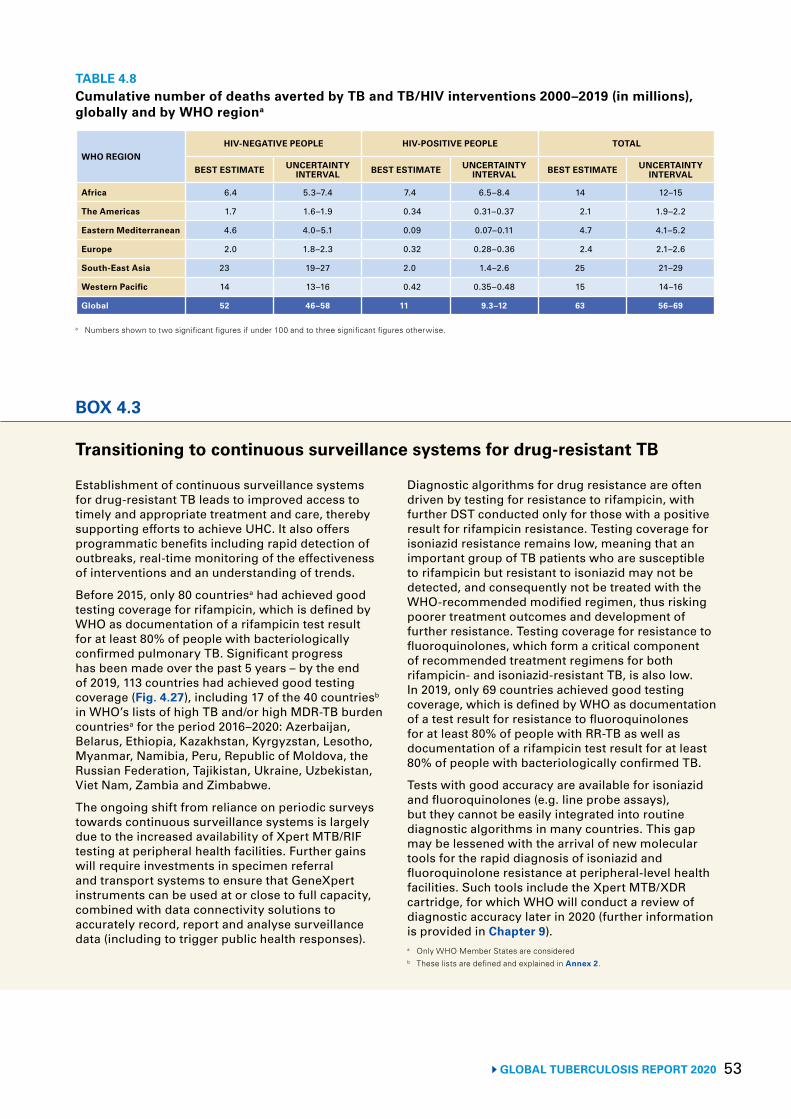
53 GLOBAL TUBERCULOSIS REPORT 2020
TABLE 4.8Cumulative number of deaths averted by TB and TB/HIV interventions 2000–2019 (in millions), globally and by WHO regiona
WHO REGIONHIV-NEGATIVE PEOPLE HIV-POSITIVE PEOPLE TOTAL
BEST ESTIMATE UNCERTAINTY INTERVAL BEST ESTIMATE UNCERTAINTY
INTERVAL BEST ESTIMATE UNCERTAINTY INTERVAL
Africa 6.4 5.3–7.4 7.4 6.5–8.4 14 12–15
The Americas 1.7 1.6–1.9 0.34 0.31–0.37 2.1 1.9–2.2
Eastern Mediterranean 4.6 4.0–5.1 0.09 0.07–0.11 4.7 4.1–5.2
Europe 2.0 1.8–2.3 0.32 0.28–0.36 2.4 2.1–2.6
South-East Asia 23 19–27 2.0 1.4–2.6 25 21–29
Western Pacific 14 13–16 0.42 0.35–0.48 15 14–16
Global 52 46–58 11 9.3–12 63 56–69
a Numbers shown to two significant figures if under 100 and to three significant figures otherwise.
BOX 4.3
Transitioning to continuous surveillance systems for drug-resistant TB
Establishment of continuous surveillance systems for drug-resistant TB leads to improved access to timely and appropriate treatment and care, thereby supporting efforts to achieve UHC. It also offers programmatic benefits including rapid detection of outbreaks, real-time monitoring of the effectiveness of interventions and an understanding of trends.
Before 2015, only 80 countriesa had achieved good testing coverage for rifampicin, which is defined by WHO as documentation of a rifampicin test result for at least 80% of people with bacteriologically confirmed pulmonary TB. Significant progress has been made over the past 5 years – by the end of 2019, 113 countries had achieved good testing coverage (Fig. 4.27), including 17 of the 40 countriesb in WHO’s lists of high TB and/or high MDR-TB burden countriesa for the period 2016–2020: Azerbaijan, Belarus, Ethiopia, Kazakhstan, Kyrgyzstan, Lesotho, Myanmar, Namibia, Peru, Republic of Moldova, the Russian Federation, Tajikistan, Ukraine, Uzbekistan, Viet Nam, Zambia and Zimbabwe.
The ongoing shift from reliance on periodic surveys towards continuous surveillance systems is largely due to the increased availability of Xpert MTB/RIF testing at peripheral health facilities. Further gains will require investments in specimen referral and transport systems to ensure that GeneXpert instruments can be used at or close to full capacity, combined with data connectivity solutions to accurately record, report and analyse surveillance data (including to trigger public health responses).
Diagnostic algorithms for drug resistance are often driven by testing for resistance to rifampicin, with further DST conducted only for those with a positive result for rifampicin resistance. Testing coverage for isoniazid resistance remains low, meaning that an important group of TB patients who are susceptible to rifampicin but resistant to isoniazid may not be detected, and consequently not be treated with the WHO-recommended modified regimen, thus risking poorer treatment outcomes and development of further resistance. Testing coverage for resistance to fluoroquinolones, which form a critical component of recommended treatment regimens for both rifampicin- and isoniazid-resistant TB, is also low. In 2019, only 69 countries achieved good testing coverage, which is defined by WHO as documentation of a test result for resistance to fluoroquinolones for at least 80% of people with RR-TB as well as documentation of a rifampicin test result for at least 80% of people with bacteriologically confirmed TB.
Tests with good accuracy are available for isoniazid and fluoroquinolones (e.g. line probe assays), but they cannot be easily integrated into routine diagnostic algorithms in many countries. This gap may be lessened with the arrival of new molecular tools for the rapid diagnosis of isoniazid and fluoroquinolone resistance at peripheral-level health facilities. Such tools include the Xpert MTB/XDR cartridge, for which WHO will conduct a review of diagnostic accuracy later in 2020 (further information is provided in Chapter 9). a Only WHO Member States are considered b These lists are defined and explained in Annex 2.
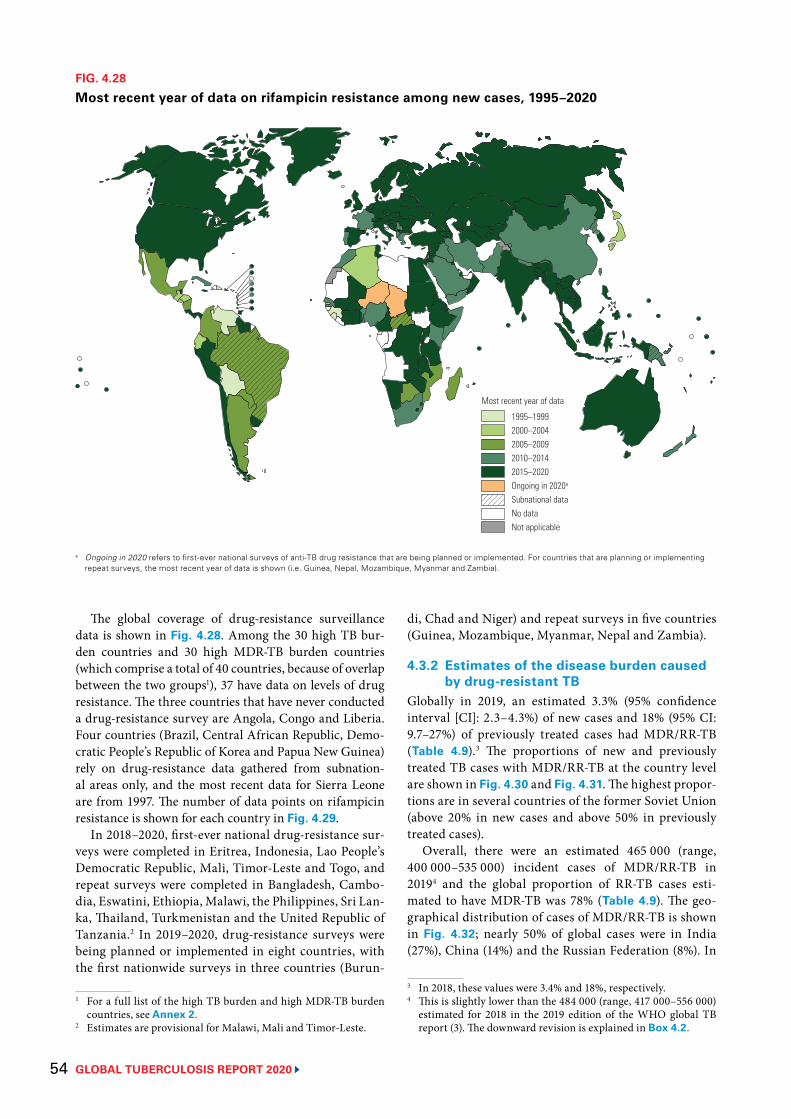
GLOBAL TUBERCULOSIS REPORT 2020 54
The global coverage of drug-resistance surveillance data is shown in Fig. 4.28. Among the 30 high TB bur-den countries and 30 high MDR-TB burden countries (which comprise a total of 40 countries, because of overlap between the two groups1), 37 have data on levels of drug resistance. The three countries that have never conducted a drug-resistance survey are Angola, Congo and Liberia. Four countries (Brazil, Central African Republic, Demo-cratic People’s Republic of Korea and Papua New Guinea) rely on drug-resistance data gathered from subnation-al areas only, and the most recent data for Sierra Leone are from 1997. The number of data points on rifampicin resistance is shown for each country in Fig. 4.29.
In 2018–2020, first-ever national drug-resistance sur-veys were completed in Eritrea, Indonesia, Lao People’s Democratic Republic, Mali, Timor-Leste and Togo, and repeat surveys were completed in Bangladesh, Cambo-dia, Eswatini, Ethiopia, Malawi, the Philippines, Sri Lan-ka, Thailand, Turkmenistan and the United Republic of Tanzania.2 In 2019–2020, drug-resistance surveys were being planned or implemented in eight countries, with the first nationwide surveys in three countries (Burun-
1 For a full list of the high TB burden and high MDR-TB burden countries, see Annex 2.
2 Estimates are provisional for Malawi, Mali and Timor-Leste.
FIG. 4.28
Most recent year of data on rifampicin resistance among new cases, 1995–2020
1995–19992000–20042005–20092010–20142015–2020Ongoing in 2020a
Subnational dataNo dataNot applicable
Most recent year of data
a Ongoing in 2020 refers to first-ever national surveys of anti-TB drug resistance that are being planned or implemented. For countries that are planning or implementing repeat surveys, the most recent year of data is shown (i.e. Guinea, Nepal, Mozambique, Myanmar and Zambia).
di, Chad and Niger) and repeat surveys in five countries (Guinea, Mozambique, Myanmar, Nepal and Zambia).
4.3.2 Estimates of the disease burden caused by drug-resistant TB
Globally in 2019, an estimated 3.3% (95% confidence interval [CI]: 2.3–4.3%) of new cases and 18% (95% CI: 9.7–27%) of previously treated cases had MDR/RR-TB (Table 4.9).3 The proportions of new and previously treated TB cases with MDR/RR-TB at the country level are shown in Fig. 4.30 and Fig. 4.31. The highest propor-tions are in several countries of the former Soviet Union (above 20% in new cases and above 50% in previously treated cases).
Overall, there were an estimated 465 000 (range, 400 000–535 000) incident cases of MDR/RR-TB in 20194 and the global proportion of RR-TB cases esti-mated to have MDR-TB was 78% (Table 4.9). The geo-graphical distribution of cases of MDR/RR-TB is shown in Fig. 4.32; nearly 50% of global cases were in India (27%), China (14%) and the Russian Federation (8%). In
3 In 2018, these values were 3.4% and 18%, respectively. 4 This is slightly lower than the 484 000 (range, 417 000–556 000)
estimated for 2018 in the 2019 edition of the WHO global TB report (3). The downward revision is explained in Box 4.2.
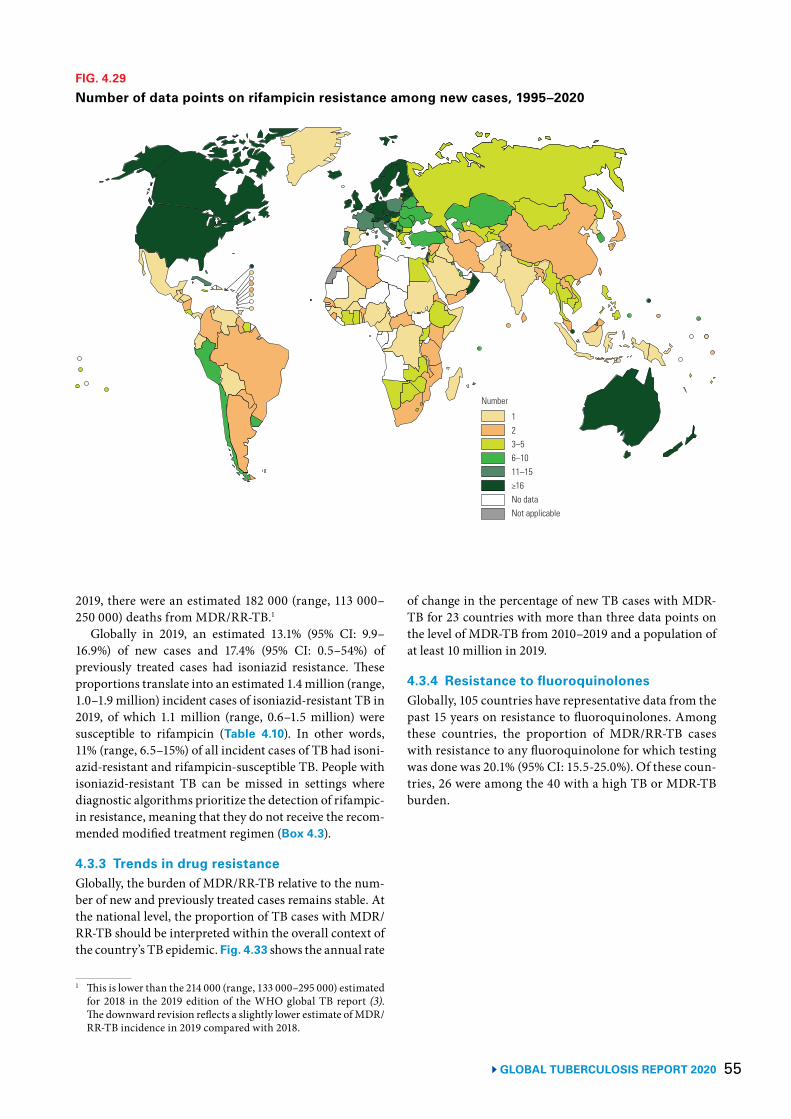
55 GLOBAL TUBERCULOSIS REPORT 2020
FIG. 4.29
Number of data points on rifampicin resistance among new cases, 1995–2020
123–56–1011–15≥16No dataNot applicable
Number
2019, there were an estimated 182 000 (range, 113 000–250 000) deaths from MDR/RR-TB.1
Globally in 2019, an estimated 13.1% (95% CI: 9.9–16.9%) of new cases and 17.4% (95% CI: 0.5–54%) of previously treated cases had isoniazid resistance. These proportions translate into an estimated 1.4 million (range, 1.0–1.9 million) incident cases of isoniazid-resistant TB in 2019, of which 1.1 million (range, 0.6–1.5 million) were susceptible to rifampicin (Table 4.10). In other words, 11% (range, 6.5–15%) of all incident cases of TB had isoni-azid-resistant and rifampicin-susceptible TB. People with isoniazid-resistant TB can be missed in settings where diagnostic algorithms prioritize the detection of rifampic-in resistance, meaning that they do not receive the recom-mended modified treatment regimen (Box 4.3).
4.3.3 Trends in drug resistanceGlobally, the burden of MDR/RR-TB relative to the num-ber of new and previously treated cases remains stable. At the national level, the proportion of TB cases with MDR/RR-TB should be interpreted within the overall context of the country’s TB epidemic. Fig. 4.33 shows the annual rate
1 This is lower than the 214 000 (range, 133 000–295 000) estimated for 2018 in the 2019 edition of the WHO global TB report (3). The downward revision reflects a slightly lower estimate of MDR/RR-TB incidence in 2019 compared with 2018.
of change in the percentage of new TB cases with MDR-TB for 23 countries with more than three data points on the level of MDR-TB from 2010–2019 and a population of at least 10 million in 2019.
4.3.4 Resistance to fluoroquinolones Globally, 105 countries have representative data from the past 15 years on resistance to fluoroquinolones. Among these countries, the proportion of MDR/RR-TB cases with resistance to any fluoroquinolone for which testing was done was 20.1% (95% CI: 15.5-25.0%). Of these coun-tries, 26 were among the 40 with a high TB or MDR-TB burden.
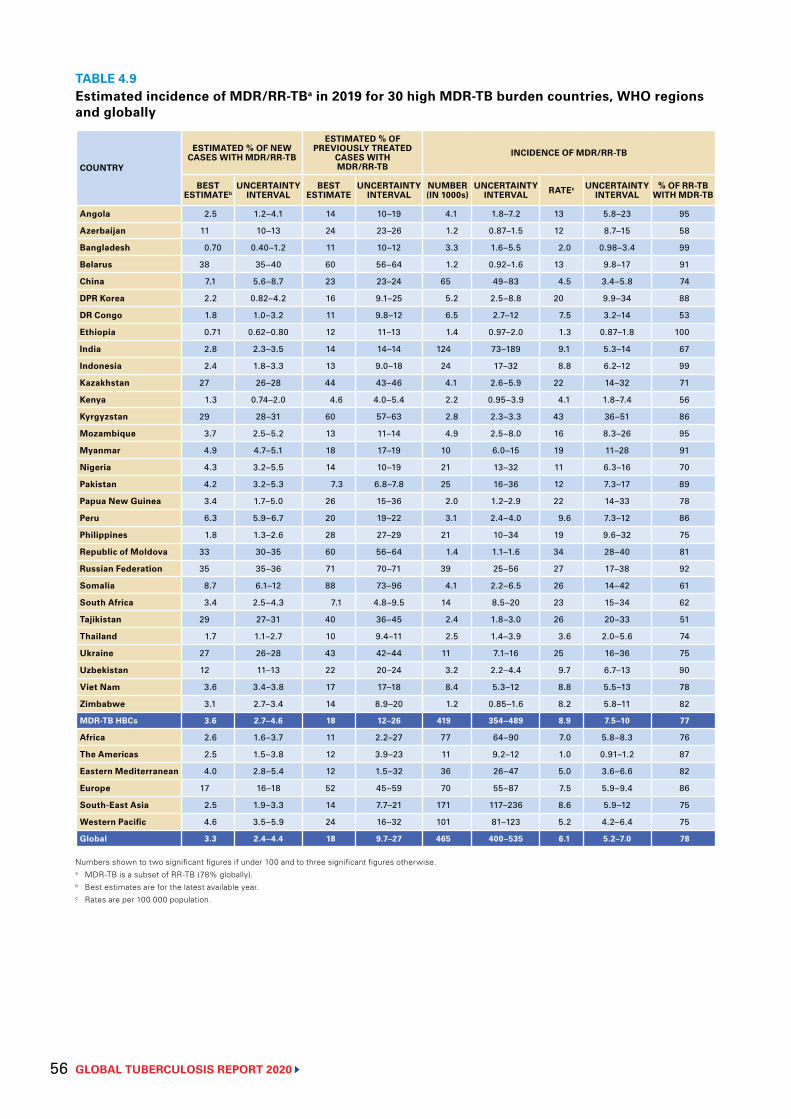
GLOBAL TUBERCULOSIS REPORT 2020 56
TABLE 4.9Estimated incidence of MDR/RR-TBa in 2019 for 30 high MDR-TB burden countries, WHO regions and globally
COUNTRY
ESTIMATED % OF NEW CASES WITH MDR/RR-TB
ESTIMATED % OF PREVIOUSLY TREATED
CASES WITH MDR/RR-TB
INCIDENCE OF MDR/RR-TB
BEST ESTIMATEb
UNCERTAINTY INTERVAL
BEST ESTIMATE
UNCERTAINTY INTERVAL
NUMBER (IN 1000s)
UNCERTAINTY INTERVAL RATEc UNCERTAINTY
INTERVAL% OF RR-TB
WITH MDR-TB
Angola 2.5 1.2–4.1 14 10–19 4.1 1.8–7.2 13 5.8–23 95
Azerbaijan 11 10–13 24 23–26 1.2 0.87–1.5 12 8.7–15 58
Bangladesh 0.70 0.40–1.2 11 10–12 3.3 1.6–5.5 2.0 0.98–3.4 99
Belarus 38 35–40 60 56–64 1.2 0.92–1.6 13 9.8–17 91
China 7.1 5.6–8.7 23 23–24 65 49–83 4.5 3.4–5.8 74
DPR Korea 2.2 0.82–4.2 16 9.1–25 5.2 2.5–8.8 20 9.9–34 88
DR Congo 1.8 1.0–3.2 11 9.8–12 6.5 2.7–12 7.5 3.2–14 53
Ethiopia 0.71 0.62–0.80 12 11–13 1.4 0.97–2.0 1.3 0.87–1.8 100
India 2.8 2.3–3.5 14 14–14 124 73–189 9.1 5.3–14 67
Indonesia 2.4 1.8–3.3 13 9.0–18 24 17–32 8.8 6.2–12 99
Kazakhstan 27 26–28 44 43–46 4.1 2.6–5.9 22 14–32 71
Kenya 1.3 0.74–2.0 4.6 4.0–5.4 2.2 0.95–3.9 4.1 1.8–7.4 56
Kyrgyzstan 29 28–31 60 57–63 2.8 2.3–3.3 43 36–51 86
Mozambique 3.7 2.5–5.2 13 11–14 4.9 2.5–8.0 16 8.3–26 95
Myanmar 4.9 4.7–5.1 18 17–19 10 6.0–15 19 11–28 91
Nigeria 4.3 3.2–5.5 14 10–19 21 13–32 11 6.3–16 70
Pakistan 4.2 3.2–5.3 7.3 6.8–7.8 25 16–36 12 7.3–17 89
Papua New Guinea 3.4 1.7–5.0 26 15–36 2.0 1.2–2.9 22 14–33 78
Peru 6.3 5.9–6.7 20 19–22 3.1 2.4–4.0 9.6 7.3–12 86
Philippines 1.8 1.3–2.6 28 27–29 21 10–34 19 9.6–32 75
Republic of Moldova 33 30–35 60 56–64 1.4 1.1–1.6 34 28–40 81
Russian Federation 35 35–36 71 70–71 39 25–56 27 17–38 92
Somalia 8.7 6.1–12 88 73–96 4.1 2.2–6.5 26 14–42 61
South Africa 3.4 2.5–4.3 7.1 4.8–9.5 14 8.5–20 23 15–34 62
Tajikistan 29 27–31 40 36–45 2.4 1.8–3.0 26 20–33 51
Thailand 1.7 1.1–2.7 10 9.4–11 2.5 1.4–3.9 3.6 2.0–5.6 74
Ukraine 27 26–28 43 42–44 11 7.1–16 25 16–36 75
Uzbekistan 12 11–13 22 20–24 3.2 2.2–4.4 9.7 6.7–13 90
Viet Nam 3.6 3.4–3.8 17 17–18 8.4 5.3–12 8.8 5.5–13 78
Zimbabwe 3.1 2.7–3.4 14 8.9–20 1.2 0.85–1.6 8.2 5.8–11 82
MDR-TB HBCs 3.6 2.7–4.6 18 12–26 419 354–489 8.9 7.5–10 77
Africa 2.6 1.6–3.7 11 2.2–27 77 64–90 7.0 5.8–8.3 76
The Americas 2.5 1.5–3.8 12 3.9–23 11 9.2–12 1.0 0.91–1.2 87
Eastern Mediterranean 4.0 2.8–5.4 12 1.5–32 36 26–47 5.0 3.6–6.6 82
Europe 17 16–18 52 45–59 70 55–87 7.5 5.9–9.4 86
South-East Asia 2.5 1.9–3.3 14 7.7–21 171 117–236 8.6 5.9–12 75
Western Pacific 4.6 3.5–5.9 24 16–32 101 81–123 5.2 4.2–6.4 75
Global 3.3 2.4–4.4 18 9.7–27 465 400–535 6.1 5.2–7.0 78
Numbers shown to two significant figures if under 100 and to three significant figures otherwise.a MDR-TB is a subset of RR-TB (78% globally).b Best estimates are for the latest available year.c Rates are per 100 000 population.
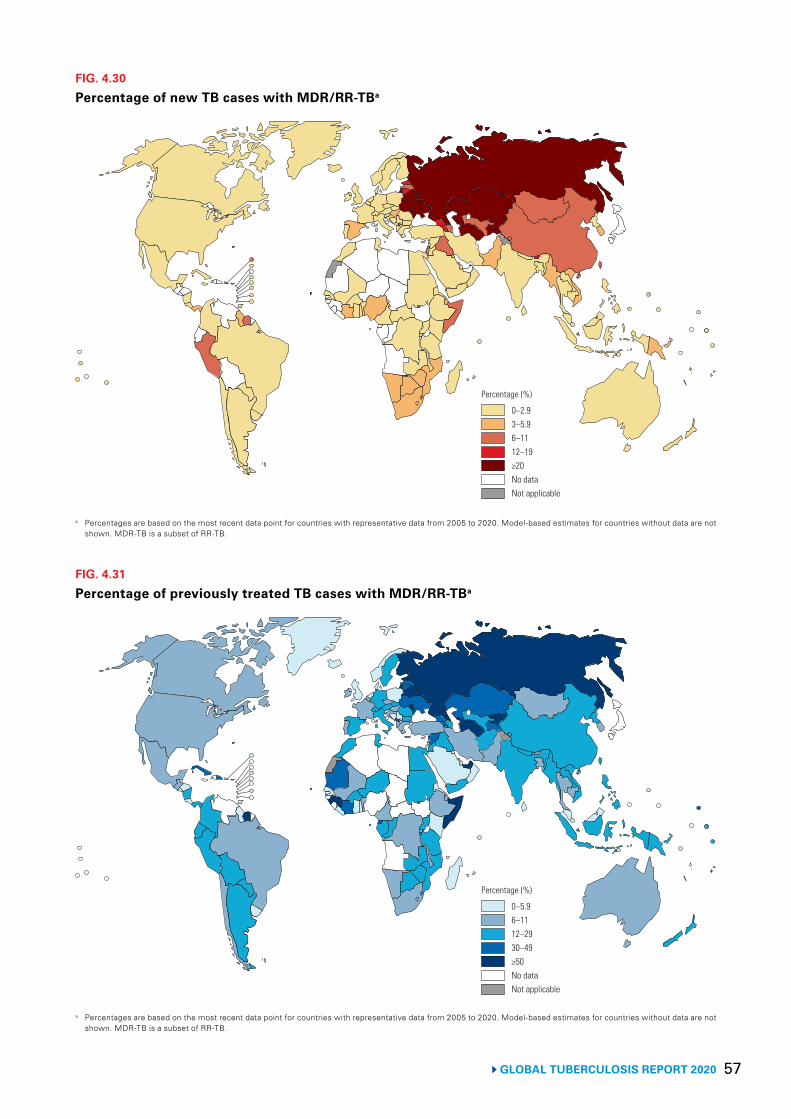
57 GLOBAL TUBERCULOSIS REPORT 2020
FIG. 4.31
Percentage of previously treated TB cases with MDR/RR-TBa
a Percentages are based on the most recent data point for countries with representative data from 2005 to 2020. Model-based estimates for countries without data are not shown. MDR-TB is a subset of RR-TB.
0–5.96–1112–2930–49≥50No dataNot applicable
Percentage (%)
FIG. 4.30
Percentage of new TB cases with MDR/RR-TBa
a Percentages are based on the most recent data point for countries with representative data from 2005 to 2020. Model-based estimates for countries without data are not shown. MDR-TB is a subset of RR-TB.
0–2.93–5.96–1112–19≥20No dataNot applicable
Percentage (%)
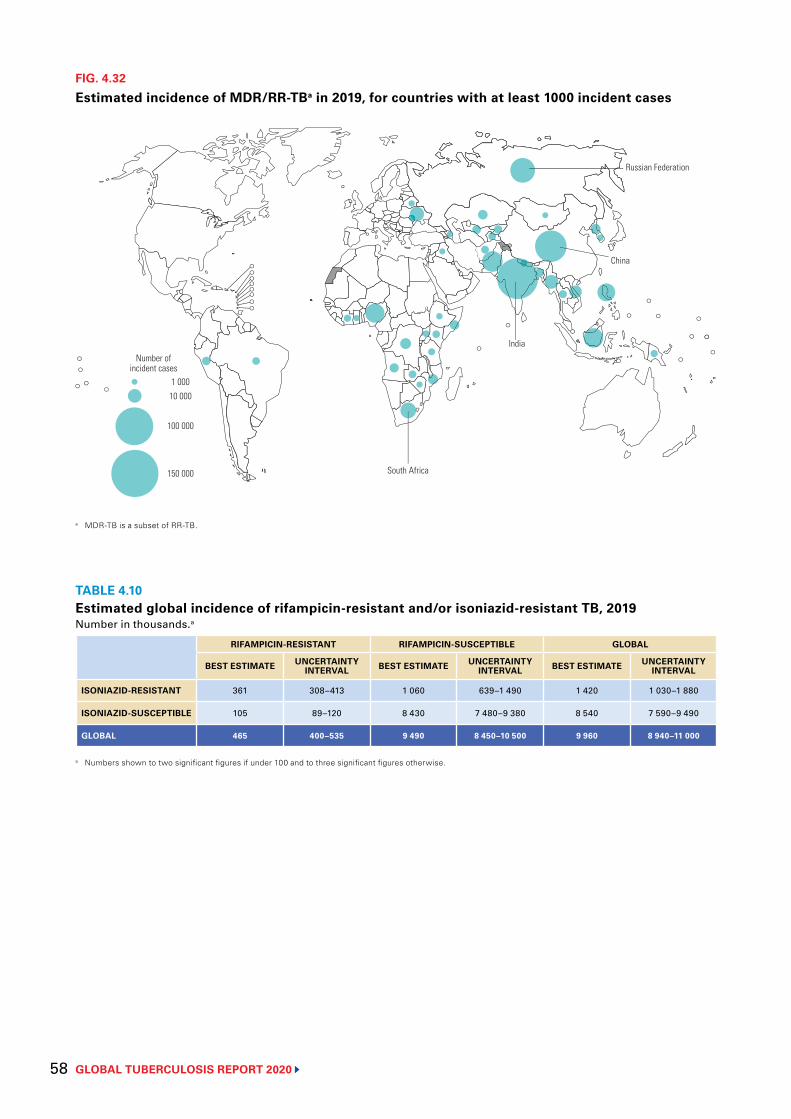
GLOBAL TUBERCULOSIS REPORT 2020 58
FIG. 4.32
Estimated incidence of MDR/RR-TBa in 2019, for countries with at least 1000 incident cases
Number ofincident cases
1 00010 000
100 000
150 000 South Africa
India
Russian Federation
China
a MDR-TB is a subset of RR-TB.
TABLE 4.10Estimated global incidence of rifampicin-resistant and/or isoniazid-resistant TB, 2019Number in thousands.a
RIFAMPICIN-RESISTANT RIFAMPICIN-SUSCEPTIBLE GLOBAL
BEST ESTIMATE UNCERTAINTY INTERVAL BEST ESTIMATE UNCERTAINTY
INTERVAL BEST ESTIMATE UNCERTAINTY INTERVAL
ISONIAZID-RESISTANT 361 308–413 1 060 639–1 490 1 420 1 030–1 880
ISONIAZID-SUSCEPTIBLE 105 89–120 8 430 7 480–9 380 8 540 7 590–9 490
GLOBAL 465 400–535 9 490 8 450–10 500 9 960 8 940–11 000
a Numbers shown to two significant figures if under 100 and to three significant figures otherwise.
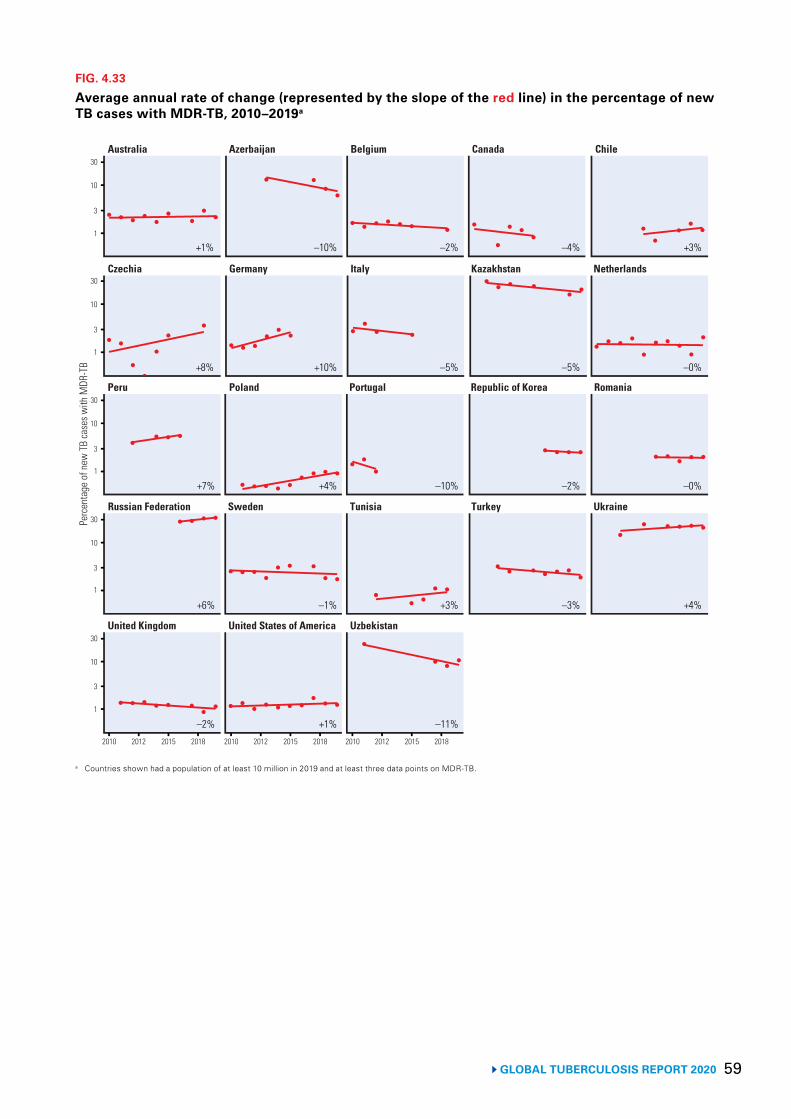
59 GLOBAL TUBERCULOSIS REPORT 2020
FIG. 4.33
Average annual rate of change (represented by the slope of the red line) in the percentage of new TB cases with MDR-TB, 2010–2019a
Australia Azerbaijan Belgium Canada Chile
Perc
enta
ge o
f new
TB
case
s with
MDR
-TB
10
3
1
30
Czechia Germany Italy Kazakhstan Netherlands
10
3
1
30
Peru Poland Portugal Republic of Korea Romania
10
3
1
30
Russian Federation Sweden Tunisia Turkey Ukraine
10
3
1
30
United Kingdom United States of America Uzbekistan
10
3
1
30
2010 2012 2015 2018 2010 2012 2015 2018 2010 2012 2015 2018
+1% –10% –2% –4% +3%
+8% +10% –5% –5% –0%
+7% +4% –10% –2% –0%
+6% –1% +3% –3% +4%
–2% +1% –11%
a Countries shown had a population of at least 10 million in 2019 and at least three data points on MDR-TB.
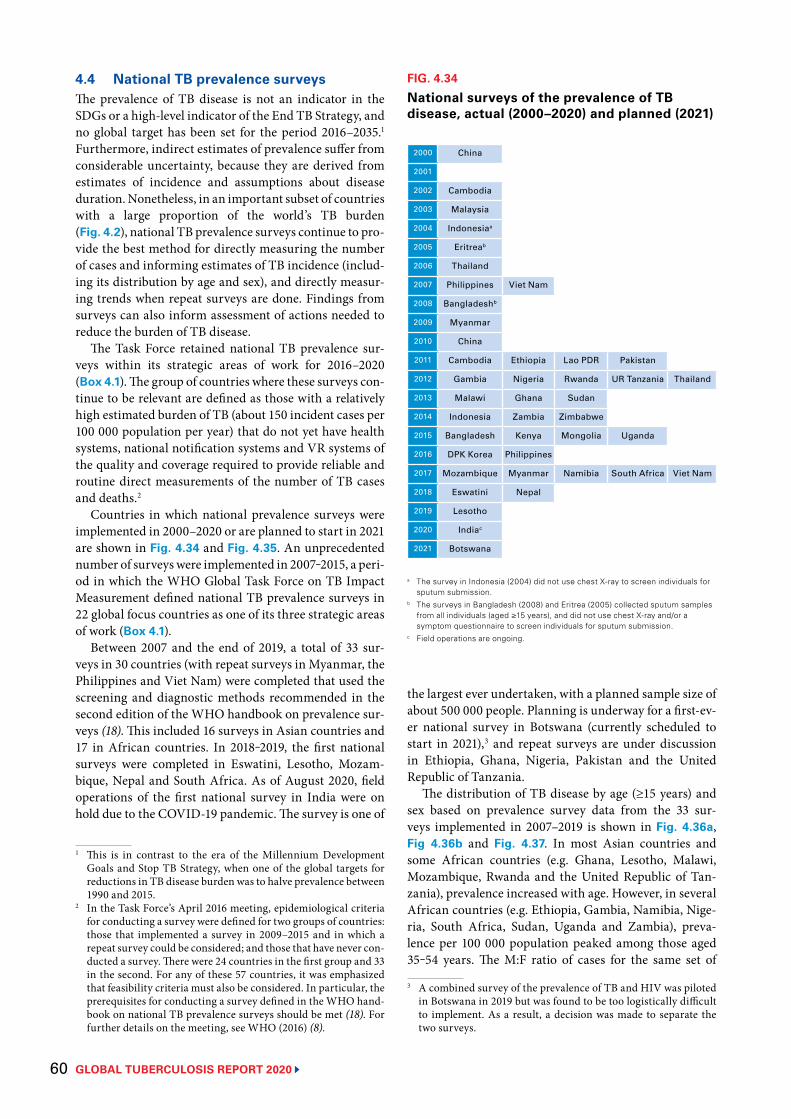
GLOBAL TUBERCULOSIS REPORT 2020 60
2000 China
2001
2002 Cambodia
2003 Malaysia
2004 Indonesiaa
2005 Eritreab
2006 Thailand
2007 Philippines Viet Nam
2008 Bangladeshb
2009 Myanmar
2010 China
2011 Cambodia Ethiopia Lao PDR Pakistan
2012 Gambia Nigeria Rwanda UR Tanzania Thailand
2013 Malawi Ghana Sudan
2014 Indonesia Zambia Zimbabwe
2015 Bangladesh Kenya Mongolia Uganda
2016 DPK Korea Philippines
2017 Mozambique Myanmar Namibia South Africa Viet Nam
2018 Eswatini Nepal
2019 Lesotho
2020 Indiac
2021 Botswana
FIG. 4.34
National surveys of the prevalence of TB disease, actual (2000–2020) and planned (2021)
a The survey in Indonesia (2004) did not use chest X-ray to screen individuals for sputum submission.
b The surveys in Bangladesh (2008) and Eritrea (2005) collected sputum samples from all individuals (aged ≥15 years), and did not use chest X-ray and/or a symptom questionnaire to screen individuals for sputum submission.
c Field operations are ongoing.
4.4 National TB prevalence surveysThe prevalence of TB disease is not an indicator in the SDGs or a high-level indicator of the End TB Strategy, and no global target has been set for the period 2016–2035.1 Furthermore, indirect estimates of prevalence suffer from considerable uncertainty, because they are derived from estimates of incidence and assumptions about disease duration. Nonetheless, in an important subset of countries with a large proportion of the world’s TB burden (Fig. 4.2), national TB prevalence surveys continue to pro-vide the best method for directly measuring the number of cases and informing estimates of TB incidence (includ-ing its distribution by age and sex), and directly measur-ing trends when repeat surveys are done. Findings from surveys can also inform assessment of actions needed to reduce the burden of TB disease.
The Task Force retained national TB prevalence sur-veys within its strategic areas of work for 2016–2020 (Box 4.1). The group of countries where these surveys con-tinue to be relevant are defined as those with a relatively high estimated burden of TB (about 150 incident cases per 100 000 population per year) that do not yet have health systems, national notification systems and VR systems of the quality and coverage required to provide reliable and routine direct measurements of the number of TB cases and deaths.2
Countries in which national prevalence surveys were implemented in 2000–2020 or are planned to start in 2021 are shown in Fig. 4.34 and Fig. 4.35. An unprecedented number of surveys were implemented in 2007‒2015, a peri-od in which the WHO Global Task Force on TB Impact Measurement defined national TB prevalence surveys in 22 global focus countries as one of its three strategic areas of work (Box 4.1).
Between 2007 and the end of 2019, a total of 33 sur-veys in 30 countries (with repeat surveys in Myanmar, the Philippines and Viet Nam) were completed that used the screening and diagnostic methods recommended in the second edition of the WHO handbook on prevalence sur-veys (18). This included 16 surveys in Asian countries and 17 in African countries. In 2018‒2019, the first national surveys were completed in Eswatini, Lesotho, Mozam-bique, Nepal and South Africa. As of August 2020, field operations of the first national survey in India were on hold due to the COVID-19 pandemic. The survey is one of
1 This is in contrast to the era of the Millennium Development Goals and Stop TB Strategy, when one of the global targets for reductions in TB disease burden was to halve prevalence between 1990 and 2015.
2 In the Task Force’s April 2016 meeting, epidemiological criteria for conducting a survey were defined for two groups of countries: those that implemented a survey in 2009–2015 and in which a repeat survey could be considered; and those that have never con-ducted a survey. There were 24 countries in the first group and 33 in the second. For any of these 57 countries, it was emphasized that feasibility criteria must also be considered. In particular, the prerequisites for conducting a survey defined in the WHO hand-book on national TB prevalence surveys should be met (18). For further details on the meeting, see WHO (2016) (8).
the largest ever undertaken, with a planned sample size of about 500 000 people. Planning is underway for a first-ev-er national survey in Botswana (currently scheduled to start in 2021),3 and repeat surveys are under discussion in Ethiopia, Ghana, Nigeria, Pakistan and the United Republic of Tanzania.
The distribution of TB disease by age (≥15 years) and sex based on prevalence survey data from the 33 sur-veys implemented in 2007–2019 is shown in Fig. 4.36a, Fig 4.36b and Fig. 4.37. In most Asian countries and some African countries (e.g. Ghana, Lesotho, Malawi, Mozambique, Rwanda and the United Republic of Tan-zania), prevalence increased with age. However, in several African countries (e.g. Ethiopia, Gambia, Namibia, Nige-ria, South Africa, Sudan, Uganda and Zambia), preva-lence per 100 000 population peaked among those aged 35‒54 years. The M:F ratio of cases for the same set of
3 A combined survey of the prevalence of TB and HIV was piloted in Botswana in 2019 but was found to be too logistically difficult to implement. As a result, a decision was made to separate the two surveys.
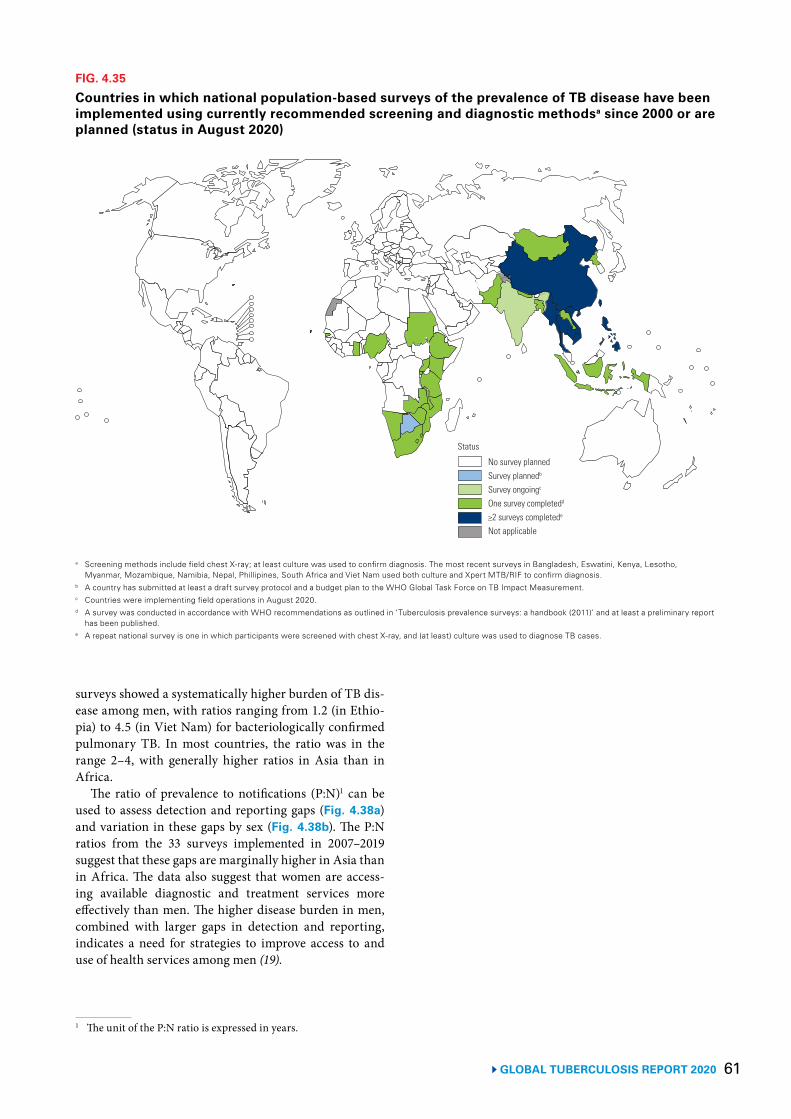
61GLOBAL TUBERCULOSIS REPORT 2020
FIG. 4.35
Countries in which national population-based surveys of the prevalence of TB disease have been implemented using currently recommended screening and diagnostic methodsa since 2000 or are planned (status in August 2020)
a Screening methods include field chest X-ray; at least culture was used to confirm diagnosis. The most recent surveys in Bangladesh, Eswatini, Kenya, Lesotho, Myanmar, Mozambique, Namibia, Nepal, Phillipines, South Africa and Viet Nam used both culture and Xpert MTB/RIF to confirm diagnosis.
b A country has submitted at least a draft survey protocol and a budget plan to the WHO Global Task Force on TB Impact Measurement.c Countries were implementing field operations in August 2020.d A survey was conducted in accordance with WHO recommendations as outlined in ‘Tuberculosis prevalence surveys: a handbook (2011)’ and at least a preliminary report
has been published.e A repeat national survey is one in which participants were screened with chest X-ray, and (at least) culture was used to diagnose TB cases.
No survey plannedSurvey plannedb
Survey ongoingc
One survey completedd
≥2 surveys completede
Not applicable
Status
surveys showed a systematically higher burden of TB dis-ease among men, with ratios ranging from 1.2 (in Ethio-pia) to 4.5 (in Viet Nam) for bacteriologically confirmed pulmonary TB. In most countries, the ratio was in the range 2–4, with generally higher ratios in Asia than in Africa.
The ratio of prevalence to notifications (P:N)1 can be used to assess detection and reporting gaps (Fig. 4.38a) and variation in these gaps by sex (Fig. 4.38b). The P:N ratios from the 33 surveys implemented in 2007–2019 suggest that these gaps are marginally higher in Asia than in Africa. The data also suggest that women are access-ing available diagnostic and treatment services more effectively than men. The higher disease burden in men, combined with larger gaps in detection and reporting, indicates a need for strategies to improve access to and use of health services among men (19).
1 The unit of the P:N ratio is expressed in years.
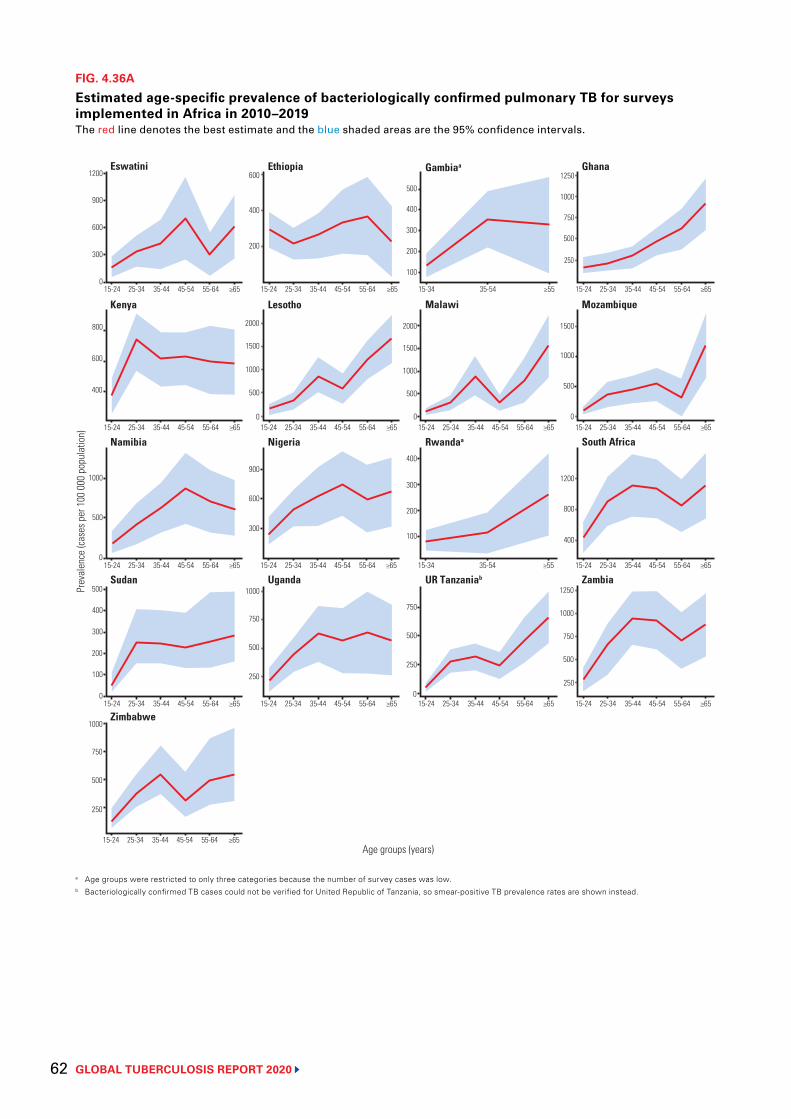
GLOBAL TUBERCULOSIS REPORT 2020 62
FIG. 4.36A
Estimated age-specific prevalence of bacteriologically confirmed pulmonary TB for surveys implemented in Africa in 2010–2019The red line denotes the best estimate and the blue shaded areas are the 95% confidence intervals.
a Age groups were restricted to only three categories because the number of survey cases was low.b Bacteriologically confirmed TB cases could not be verified for United Republic of Tanzania, so smear-positive TB prevalence rates are shown instead.
UR Tanzaniab Zambia
Namibia
Uganda
Eswatini Gambiaa Ghana
Malawi
Sudan
South Africa
MozambiqueKenya Lesotho
Nigeria
Ethiopia
Rwandaa
Prev
alen
ce (c
ases
per
100
000
pop
ulat
ion)
Age groups (years)
1200
900
600
300
015-24 25-34 35-44 45-54 55-64 ≥65 15-24 25-34 35-44 45-54 55-64 ≥65 15-34 35-54 ≥55 15-24 25-34 35-44 45-54 55-64 ≥65
15-24 25-34 35-44 45-54 55-64 ≥65 15-24 25-34 35-44 45-54 55-64 ≥65 15-24 25-34 35-44 45-54 55-64 ≥65 15-24 25-34 35-44 45-54 55-64 ≥65
15-24 25-34 35-44 45-54 55-64 ≥65 15-24 25-34 35-44 45-54 55-64 ≥65 15-24 25-34 35-44 45-54 55-64 ≥65
15-24 25-34 35-44 45-54 55-64 ≥65 15-24 25-34 35-44 45-54 55-64 ≥65 15-24 25-34 35-44 45-54 55-64 ≥65 15-24 25-34 35-44 45-54 55-64 ≥65
600
400
200
400
300
200
100
500
800
600
400
1000
500
500
400
300
900
600
300
2000
1500
1000
0
1500
1000
500
400
300
100
750
500
0
250
750
500
250
1200
800
400
1500
1000
500
0
1250
750
500
250
Zimbabwe
15-24 25-34 35-44 45-54 55-64 ≥65
1000
2000
0
500
0 15-34 35-54 ≥55
200
1250
1000750
500
250
1000
200
100
0
750
500
250
1000
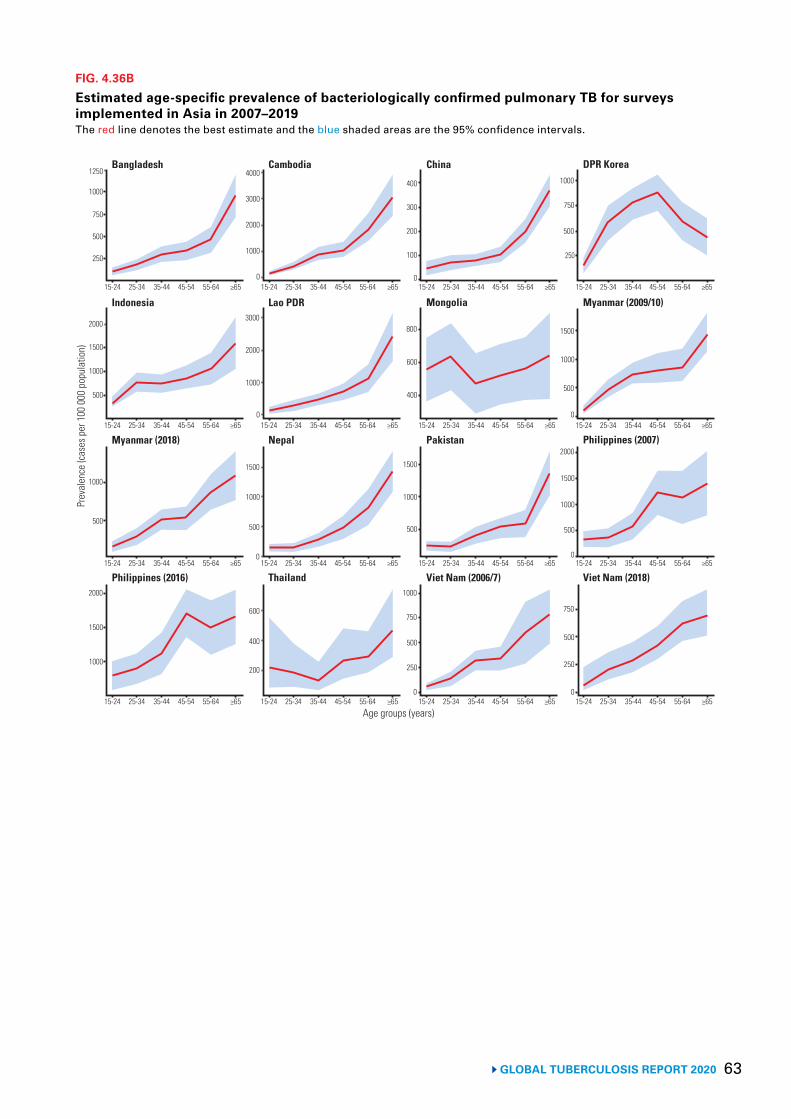
63 GLOBAL TUBERCULOSIS REPORT 2020
FIG. 4.36B
Estimated age-specific prevalence of bacteriologically confirmed pulmonary TB for surveys implemented in Asia in 2007–2019The red line denotes the best estimate and the blue shaded areas are the 95% confidence intervals.
Viet Nam (2006/7) Viet Nam (2018)
Myanmar (2018)
Thailand
Bangladesh China DPR Korea
Mongolia
Philippines (2016)
Philippines (2007)
Myanmar (2009/10)Indonesia Lao PDR
Nepal
Cambodia
Pakistan
Prev
alen
ce (c
ases
per
100
000
pop
ulat
ion)
Age groups (years)
1250
1000
750
500
250
15-24 25-34 35-44 45-54 55-64 ≥65 15-24 25-34 35-44 45-54 55-64 ≥65 15-24 25-34 35-44 45-54 55-64 ≥65 15-24 25-34 35-44 45-54 55-64 ≥65
15-24 25-34 35-44 45-54 55-64 ≥65 15-24 25-34 35-44 45-54 55-64 ≥65 15-24 25-34 35-44 45-54 55-64 ≥65 15-24 25-34 35-44 45-54 55-64 ≥65
15-24 25-34 35-44 45-54 55-64 ≥65 15-24 25-34 35-44 45-54 55-64 ≥65 15-24 25-34 35-44 45-54 55-64 ≥65 15-24 25-34 35-44 45-54 55-64 ≥65
15-24 25-34 35-44 45-54 55-64 ≥65 15-24 25-34 35-44 45-54 55-64 ≥65 15-24 25-34 35-44 45-54 55-64 ≥65 15-24 25-34 35-44 45-54 55-64 ≥65
4000
3000
2000
1000
0
400
300
200
100
0
2000
1500
1000
500
1000
500
2000
1500
1000
600
400
200
1500
1000
500
0
3000
2000
1000
0
800
600
400
1500
1000
500
1000
750
500
0
250
750
500
250
0
2000
1500
1000
500
0
1500
1000
500
0
1000
750
500
250
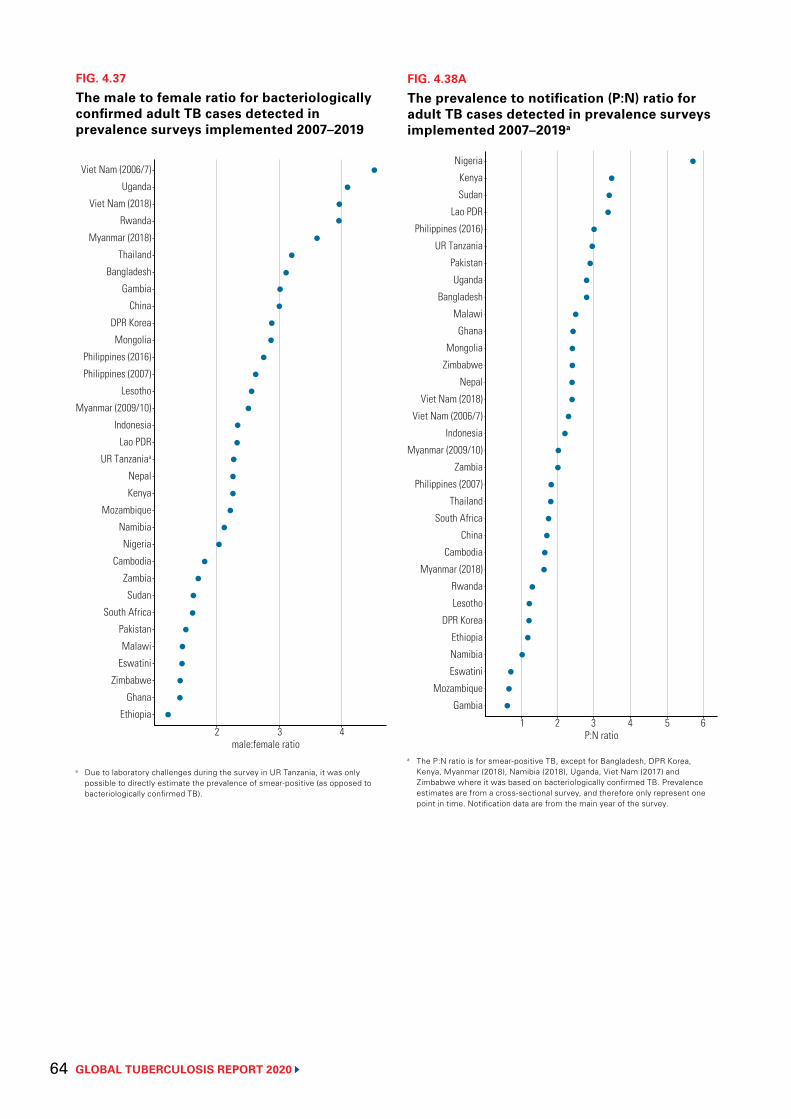
GLOBAL TUBERCULOSIS REPORT 2020 64
FIG. 4.37
The male to female ratio for bacteriologically confirmed adult TB cases detected in prevalence surveys implemented 2007–2019
a Due to laboratory challenges during the survey in UR Tanzania, it was only possible to directly estimate the prevalence of smear-positive (as opposed to bacteriologically confirmed TB).
Viet Nam (2006/7)
Uganda
Viet Nam (2018)
Rwanda
Myanmar (2018)
Thailand
Bangladesh
Gambia
China
DPR Korea
Mongolia
Philippines (2016)
Philippines (2007)
Lesotho
Myanmar (2009/10)
Indonesia
Lao PDR
UR Tanzaniaa
Nepal
Kenya
Mozambique
Namibia
Nigeria
Cambodia
Zambia
Sudan
South Africa
Pakistan
Malawi
Eswatini
Zimbabwe
Ghana
Ethiopia
2male:female ratio
3 4
FIG. 4.38A
The prevalence to notification (P:N) ratio for adult TB cases detected in prevalence surveys implemented 2007–2019a
a The P:N ratio is for smear-positive TB, except for Bangladesh, DPR Korea, Kenya, Myanmar (2018), Namibia (2018), Uganda, Viet Nam (2017) and Zimbabwe where it was based on bacteriologically confirmed TB. Prevalence estimates are from a cross-sectional survey, and therefore only represent one point in time. Notification data are from the main year of the survey.
Nigeria
Kenya
Sudan
Lao PDR
Philippines (2016)
UR Tanzania
Pakistan
Uganda
Bangladesh
Malawi
Ghana
Mongolia
Zimbabwe
Nepal
Viet Nam (2018)
Viet Nam (2006/7)
Indonesia
Myanmar (2009/10)
Zambia
Philippines (2007)
Thailand
South Africa
China
Cambodia
Myanmar (2018)
Rwanda
Lesotho
DPR Korea
Ethiopia
Namibia
Eswatini
Mozambique
Gambia
1P:N ratio
3 42 5 6
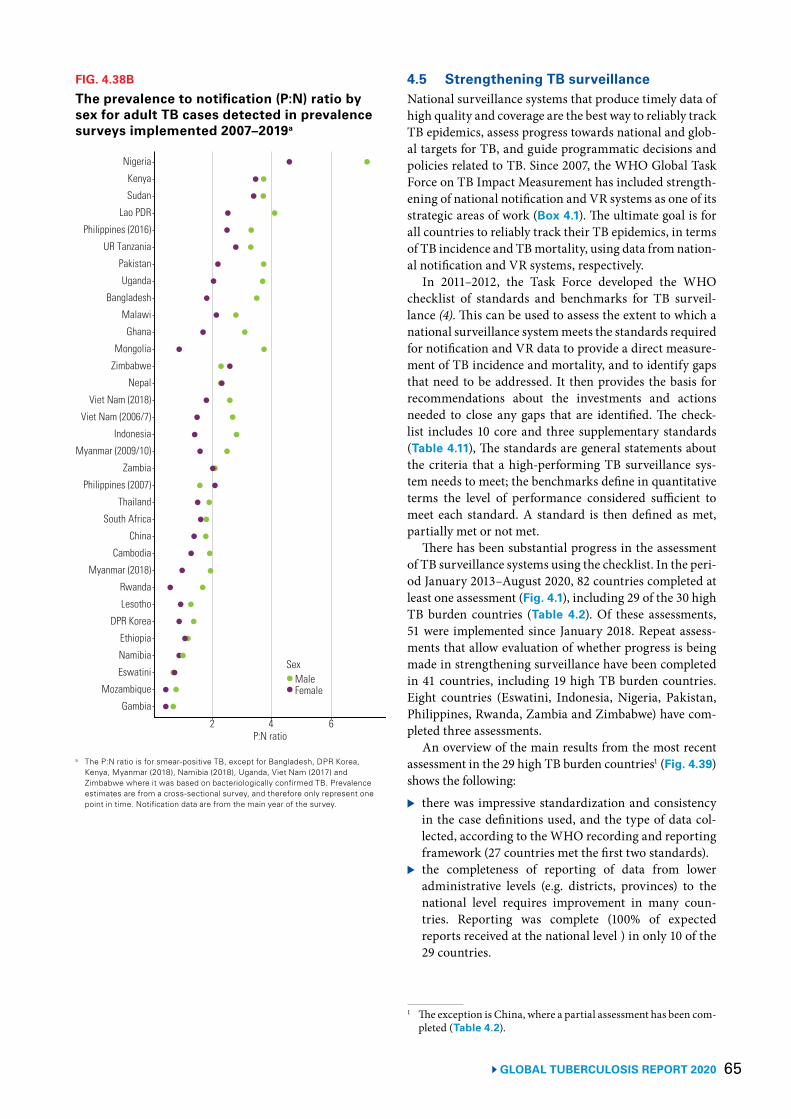
65GLOBAL TUBERCULOSIS REPORT 2020
FIG. 4.38B
The prevalence to notification (P:N) ratio by sex for adult TB cases detected in prevalence surveys implemented 2007–2019a
a The P:N ratio is for smear-positive TB, except for Bangladesh, DPR Korea, Kenya, Myanmar (2018), Namibia (2018), Uganda, Viet Nam (2017) and Zimbabwe where it was based on bacteriologically confirmed TB. Prevalence estimates are from a cross-sectional survey, and therefore only represent one point in time. Notification data are from the main year of the survey.
Nigeria
Kenya
Sudan
Lao PDR
Philippines (2016)
UR Tanzania
Pakistan
Uganda
Bangladesh
Malawi
Ghana
Mongolia
Zimbabwe
Nepal
Viet Nam (2018)
Viet Nam (2006/7)
Indonesia
Myanmar (2009/10)
Zambia
Philippines (2007)
Thailand
South Africa
China
Cambodia
Myanmar (2018)
Rwanda
Lesotho
DPR Korea
Ethiopia
Namibia
Eswatini
Mozambique
Gambia
P:N ratio42 6
FemaleMale
Sex
4.5 Strengthening TB surveillance National surveillance systems that produce timely data of high quality and coverage are the best way to reliably track TB epidemics, assess progress towards national and glob-al targets for TB, and guide programmatic decisions and policies related to TB. Since 2007, the WHO Global Task Force on TB Impact Measurement has included strength-ening of national notification and VR systems as one of its strategic areas of work (Box 4.1). The ultimate goal is for all countries to reliably track their TB epidemics, in terms of TB incidence and TB mortality, using data from nation-al notification and VR systems, respectively.
In 2011–2012, the Task Force developed the WHO checklist of standards and benchmarks for TB surveil-lance (4). This can be used to assess the extent to which a national surveillance system meets the standards required for notification and VR data to provide a direct measure-ment of TB incidence and mortality, and to identify gaps that need to be addressed. It then provides the basis for recommendations about the investments and actions needed to close any gaps that are identified. The check-list includes 10 core and three supplementary standards (Table 4.11), The standards are general statements about the criteria that a high-performing TB surveillance sys-tem needs to meet; the benchmarks define in quantitative terms the level of performance considered sufficient to meet each standard. A standard is then defined as met, partially met or not met.
There has been substantial progress in the assessment of TB surveillance systems using the checklist. In the peri-od January 2013–August 2020, 82 countries completed at least one assessment (Fig. 4.1), including 29 of the 30 high TB burden countries (Table 4.2). Of these assessments, 51 were implemented since January 2018. Repeat assess-ments that allow evaluation of whether progress is being made in strengthening surveillance have been completed in 41 countries, including 19 high TB burden countries. Eight countries (Eswatini, Indonesia, Nigeria, Pakistan, Philippines, Rwanda, Zambia and Zimbabwe) have com-pleted three assessments.
An overview of the main results from the most recent assessment in the 29 high TB burden countries1 (Fig. 4.39) shows the following:
▶ there was impressive standardization and consistencyin the case definitions used, and the type of data col-lected, according to the WHO recording and reportingframework (27 countries met the first two standards).
▶ the completeness of reporting of data from loweradministrative levels (e.g. districts, provinces) to thenational level requires improvement in many coun-tries. Reporting was complete (100% of expectedreports received at the national level ) in only 10 of the29 countries.
1 The exception is China, where a partial assessment has been com-pleted (Table 4.2).
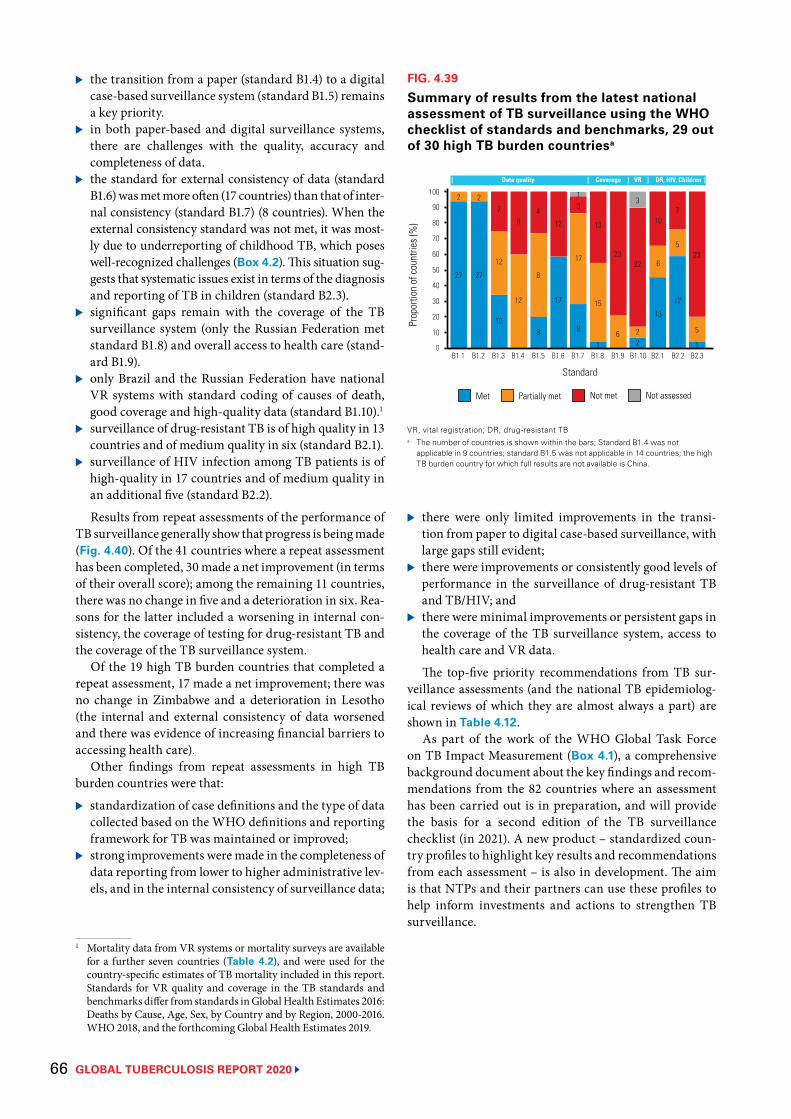
GLOBAL TUBERCULOSIS REPORT 2020 66
▶ the transition from a paper (standard B1.4) to a digital case-based surveillance system (standard B1.5) remains a key priority.
▶ in both paper-based and digital surveillance systems, there are challenges with the quality, accuracy and completeness of data.
▶ the standard for external consistency of data (standard B1.6) was met more often (17 countries) than that of inter-nal consistency (standard B1.7) (8 countries). When the external consistency standard was not met, it was most-ly due to underreporting of childhood TB, which poses well-recognized challenges (Box 4.2). This situation sug-gests that systematic issues exist in terms of the diagnosis and reporting of TB in children (standard B2.3).
▶ significant gaps remain with the coverage of the TB surveillance system (only the Russian Federation met standard B1.8) and overall access to health care (stand-ard B1.9).
▶ only Brazil and the Russian Federation have national VR systems with standard coding of causes of death, good coverage and high-quality data (standard B1.10).1
▶ surveillance of drug-resistant TB is of high quality in 13 countries and of medium quality in six (standard B2.1).
▶ surveillance of HIV infection among TB patients is of high-quality in 17 countries and of medium quality in an additional five (standard B2.2).
Results from repeat assessments of the performance of TB surveillance generally show that progress is being made (Fig. 4.40). Of the 41 countries where a repeat assessment has been completed, 30 made a net improvement (in terms of their overall score); among the remaining 11 countries, there was no change in five and a deterioration in six. Rea-sons for the latter included a worsening in internal con-sistency, the coverage of testing for drug-resistant TB and the coverage of the TB surveillance system.
Of the 19 high TB burden countries that completed a repeat assessment, 17 made a net improvement; there was no change in Zimbabwe and a deterioration in Lesotho (the internal and external consistency of data worsened and there was evidence of increasing financial barriers to accessing health care).
Other findings from repeat assessments in high TB burden countries were that:
▶ standardization of case definitions and the type of data collected based on the WHO definitions and reporting framework for TB was maintained or improved;
▶ strong improvements were made in the completeness of data reporting from lower to higher administrative lev-els, and in the internal consistency of surveillance data;
1 Mortality data from VR systems or mortality surveys are available for a further seven countries (Table 4.2), and were used for the country-specific estimates of TB mortality included in this report. Standards for VR quality and coverage in the TB standards and benchmarks differ from standards in Global Health Estimates 2016: Deaths by Cause, Age, Sex, by Country and by Region, 2000-2016. WHO 2018, and the forthcoming Global Health Estimates 2019.
FIG. 4.39
Summary of results from the latest national assessment of TB surveillance using the WHO checklist of standards and benchmarks, 29 out of 30 high TB burden countriesa
VR, vital registration; DR, drug-resistant TB a The number of countries is shown within the bars; Standard B1.4 was not
applicable in 9 countries; standard B1.5 was not applicable in 14 countries; the high TB burden country for which full results are not available is China.
Prop
ortio
n of
coun
tries
(%)
B1.1 B1.2 B1.3 B1.4 B1.5 B1.6 B1.7 B1.8 B1.9 B1.10 B2.1 B2.2 B2.3
60
30
0
100
40
10
50
20
80
70
90
Standard
2 2 13
27 27
10
12
78
12
3
8
4
17
12
8
17
3
1
15
6
2322
22
13
6
107
5
17
23
5
1
13
| Data quality | Coverage | VR | DR, HIV, Children |
Not assessedPartially met Not metMet
▶ there were only limited improvements in the transi-tion from paper to digital case-based surveillance, with large gaps still evident;
▶ there were improvements or consistently good levels of performance in the surveillance of drug-resistant TB and TB/HIV; and
▶ there were minimal improvements or persistent gaps in the coverage of the TB surveillance system, access to health care and VR data.
The top-five priority recommendations from TB sur-veillance assessments (and the national TB epidemiolog-ical reviews of which they are almost always a part) are shown in Table 4.12.
As part of the work of the WHO Global Task Force on TB Impact Measurement (Box 4.1), a comprehensive background document about the key findings and recom-mendations from the 82 countries where an assessment has been carried out is in preparation, and will provide the basis for a second edition of the TB surveillance checklist (in 2021). A new product – standardized coun-try profiles to highlight key results and recommendations from each assessment – is also in development. The aim is that NTPs and their partners can use these profiles to help inform investments and actions to strengthen TB surveillance.
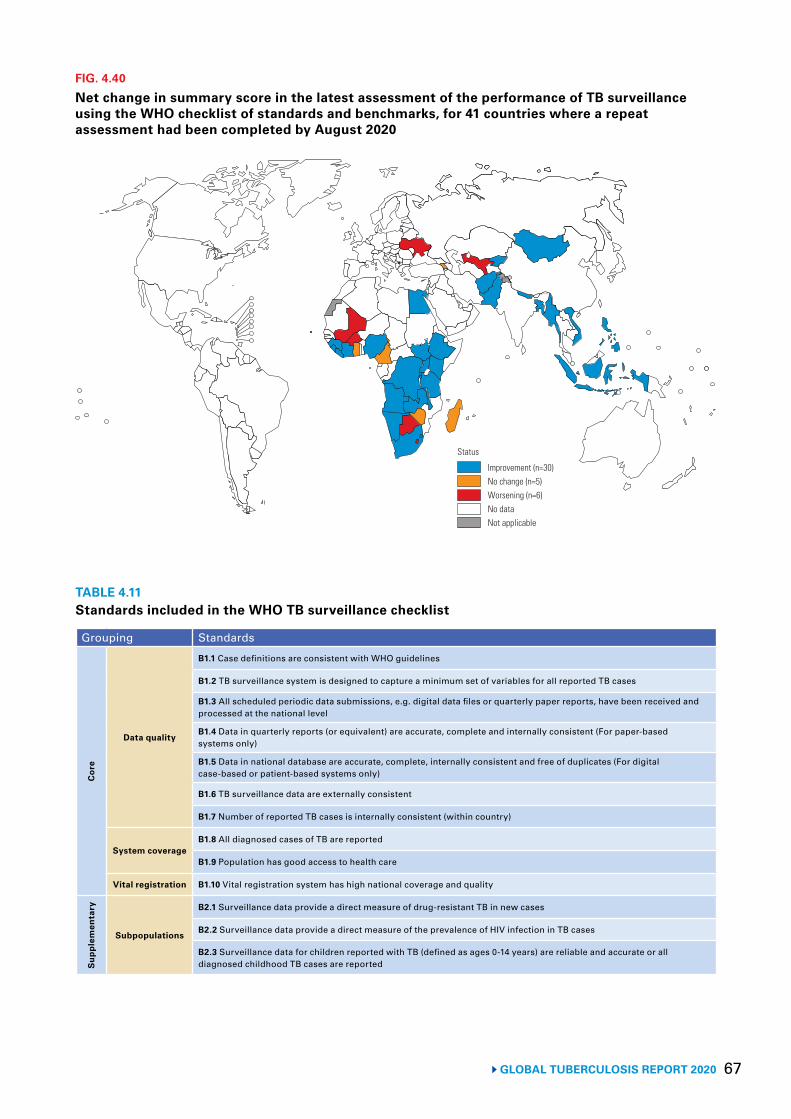
67 GLOBAL TUBERCULOSIS REPORT 2020
Improvement (n=30)No change (n=5)Worsening (n=6)No dataNot applicable
Status
FIG. 4.40
Net change in summary score in the latest assessment of the performance of TB surveillance using the WHO checklist of standards and benchmarks, for 41 countries where a repeat assessment had been completed by August 2020
TABLE 4.11Standards included in the WHO TB surveillance checklist
Grouping Standards
Cor
e
Data quality
B1.1 Case definitions are consistent with WHO guidelines
B1.2 TB surveillance system is designed to capture a minimum set of variables for all reported TB cases
B1.3 All scheduled periodic data submissions, e.g. digital data files or quarterly paper reports, have been received and processed at the national level
B1.4 Data in quarterly reports (or equivalent) are accurate, complete and internally consistent (For paper-based systems only)
B1.5 Data in national database are accurate, complete, internally consistent and free of duplicates (For digital case-based or patient-based systems only)
B1.6 TB surveillance data are externally consistent
B1.7 Number of reported TB cases is internally consistent (within country)
System coverageB1.8 All diagnosed cases of TB are reported
B1.9 Population has good access to health care
Vital registration B1.10 Vital registration system has high national coverage and quality
Sup
plem
enta
ry
Subpopulations
B2.1 Surveillance data provide a direct measure of drug-resistant TB in new cases
B2.2 Surveillance data provide a direct measure of the prevalence of HIV infection in TB cases
B2.3 Surveillance data for children reported with TB (defined as ages 0-14 years) are reliable and accurate or all diagnosed childhood TB cases are reported
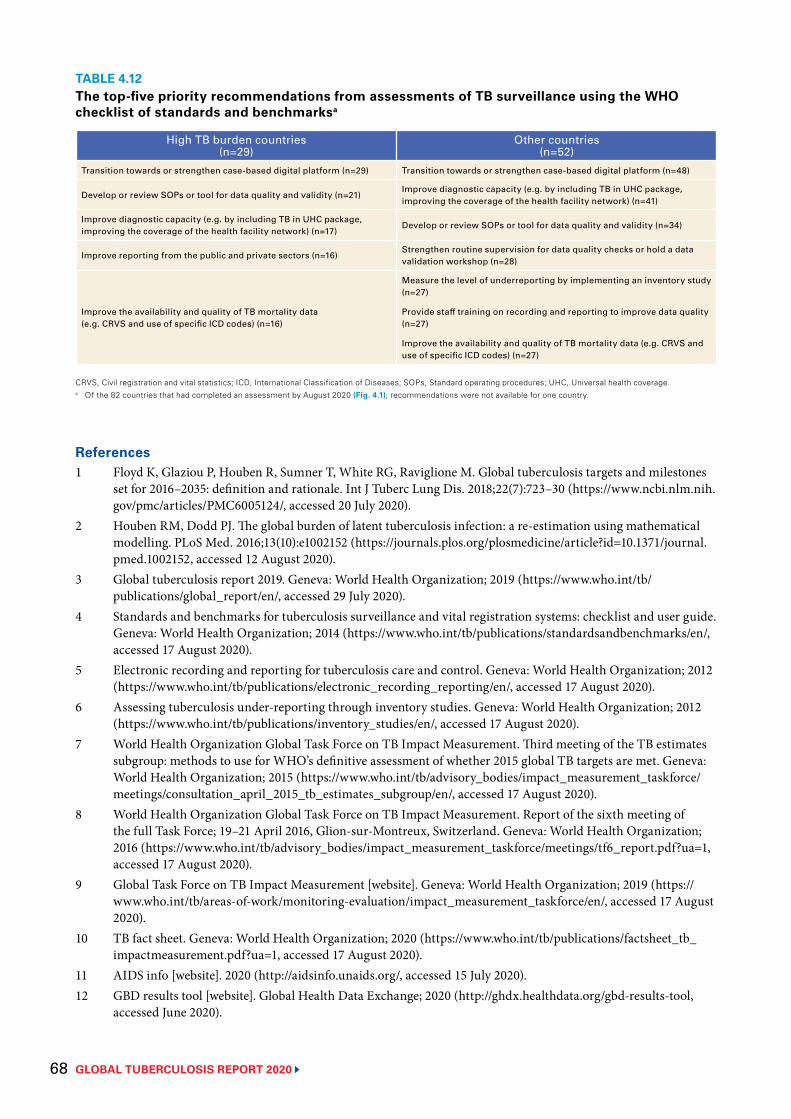
GLOBAL TUBERCULOSIS REPORT 2020 68
TABLE 4.12The top-five priority recommendations from assessments of TB surveillance using the WHO checklist of standards and benchmarksa
High TB burden countries(n=29)
Other countries(n=52)
Transition towards or strengthen case-based digital platform (n=29) Transition towards or strengthen case-based digital platform (n=48)
Develop or review SOPs or tool for data quality and validity (n=21)Improve diagnostic capacity (e.g. by including TB in UHC package, improving the coverage of the health facility network) (n=41)
Improve diagnostic capacity (e.g. by including TB in UHC package, improving the coverage of the health facility network) (n=17)
Develop or review SOPs or tool for data quality and validity (n=34)
Improve reporting from the public and private sectors (n=16)Strengthen routine supervision for data quality checks or hold a data validation workshop (n=28)
Improve the availability and quality of TB mortality data (e.g. CRVS and use of specific ICD codes) (n=16)
Measure the level of underreporting by implementing an inventory study (n=27)
Provide staff training on recording and reporting to improve data quality (n=27)
Improve the availability and quality of TB mortality data (e.g. CRVS and use of specific ICD codes) (n=27)
CRVS, Civil registration and vital statistics; ICD, International Classification of Diseases; SOPs, Standard operating procedures; UHC, Universal health coverage.a Of the 82 countries that had completed an assessment by August 2020 (Fig. 4.1), recommendations were not available for one country.
References1 Floyd K, Glaziou P, Houben R, Sumner T, White RG, Raviglione M. Global tuberculosis targets and milestones
set for 2016–2035: definition and rationale. Int J Tuberc Lung Dis. 2018;22(7):723–30 (https://www.ncbi.nlm.nih.gov/pmc/articles/PMC6005124/, accessed 20 July 2020).
2 Houben RM, Dodd PJ. The global burden of latent tuberculosis infection: a re-estimation using mathematical modelling. PLoS Med. 2016;13(10):e1002152 (https://journals.plos.org/plosmedicine/article?id=10.1371/journal.pmed.1002152, accessed 12 August 2020).
3 Global tuberculosis report 2019. Geneva: World Health Organization; 2019 (https://www.who.int/tb/publications/global_report/en/, accessed 29 July 2020).
4 Standards and benchmarks for tuberculosis surveillance and vital registration systems: checklist and user guide. Geneva: World Health Organization; 2014 (https://www.who.int/tb/publications/standardsandbenchmarks/en/, accessed 17 August 2020).
5 Electronic recording and reporting for tuberculosis care and control. Geneva: World Health Organization; 2012 (https://www.who.int/tb/publications/electronic_recording_reporting/en/, accessed 17 August 2020).
6 Assessing tuberculosis under-reporting through inventory studies. Geneva: World Health Organization; 2012 (https://www.who.int/tb/publications/inventory_studies/en/, accessed 17 August 2020).
7 World Health Organization Global Task Force on TB Impact Measurement. Third meeting of the TB estimates subgroup: methods to use for WHO’s definitive assessment of whether 2015 global TB targets are met. Geneva: World Health Organization; 2015 (https://www.who.int/tb/advisory_bodies/impact_measurement_taskforce/meetings/consultation_april_2015_tb_estimates_subgroup/en/, accessed 17 August 2020).
8 World Health Organization Global Task Force on TB Impact Measurement. Report of the sixth meeting of the full Task Force; 19–21 April 2016, Glion-sur-Montreux, Switzerland. Geneva: World Health Organization; 2016 (https://www.who.int/tb/advisory_bodies/impact_measurement_taskforce/meetings/tf6_report.pdf?ua=1, accessed 17 August 2020).
9 Global Task Force on TB Impact Measurement [website]. Geneva: World Health Organization; 2019 (https://www.who.int/tb/areas-of-work/monitoring-evaluation/impact_measurement_taskforce/en/, accessed 17 August 2020).
10 TB fact sheet. Geneva: World Health Organization; 2020 (https://www.who.int/tb/publications/factsheet_tb_impactmeasurement.pdf?ua=1, accessed 17 August 2020).
11 AIDS info [website]. 2020 (http://aidsinfo.unaids.org/, accessed 15 July 2020).12 GBD results tool [website]. Global Health Data Exchange; 2020 (http://ghdx.healthdata.org/gbd-results-tool,
accessed June 2020).
69 GLOBAL TUBERCULOSIS REPORT 2020
13 Dodd PJ, Gardiner E, Coghlan R, Seddon JA. Burden of childhood tuberculosis in 22 high-burden countries: a mathematical modelling study. Lancet Glob Health. 2014;2(8):e453–9 (https://www.ncbi.nlm.nih.gov/pubmed/25103518, accessed 17 August 2020).
14 Global tuberculosis report 2018. Geneva, World Health Organization; 2018 (http://apps.who.int/iris/handle/10665/274453, accessed 17 August 2020).
15 International statistical classification of diseases and health related problems (The) ICD-10. Geneva: World Health Organization; 2016 (https://icd.who.int/browse10/2016/en, accessed 17 August 2020).
16 Dodd PJ, Yuen CM, Sismanidis C, Seddon JA, Jenkins HE. The global burden of tuberculosis mortality in children: a mathematical modelling study. Lancet Glob Health. 2017;5(9):e898–e906 (https://www.ncbi.nlm.nih.gov/pubmed/28807188, accessed 17 August 2020).
17 Global health estimates 2016: disease burden by cause, age, sex, by country and by region, 2000–2016. Geneva: World Health Organization; 2018 (https://www.who.int/healthinfo/global_burden_disease/estimates/en/index1.html, accessed 8 August 2020).
18 Tuberculosis prevalence surveys: a handbook (WHO/HTM/TB/2010.17). Geneva: World Health Organization; 2011 (https://www.who.int/tb/advisory_bodies/impact_measurement_taskforce/resources_documents/thelimebook/en/, accessed 17 August 2020).
19 Horton KC, MacPherson P, Houben RM, White RG, Corbett EL. Sex differences in tuberculosis burden and notifications in low- and middle-income countries: a systematic review and meta-analysis. PLoS Med. 2016;13(9):e1002119 (https://www.ncbi.nlm.nih.gov/pubmed/27598345, accessed 17 August 2020).
GLOBAL TUBERCULOSIS REPORT 2020 70
A doctor examining a TB patient in a government TB hospital, India.Prabhat Kumar Verma/Pacific Press/Alamy
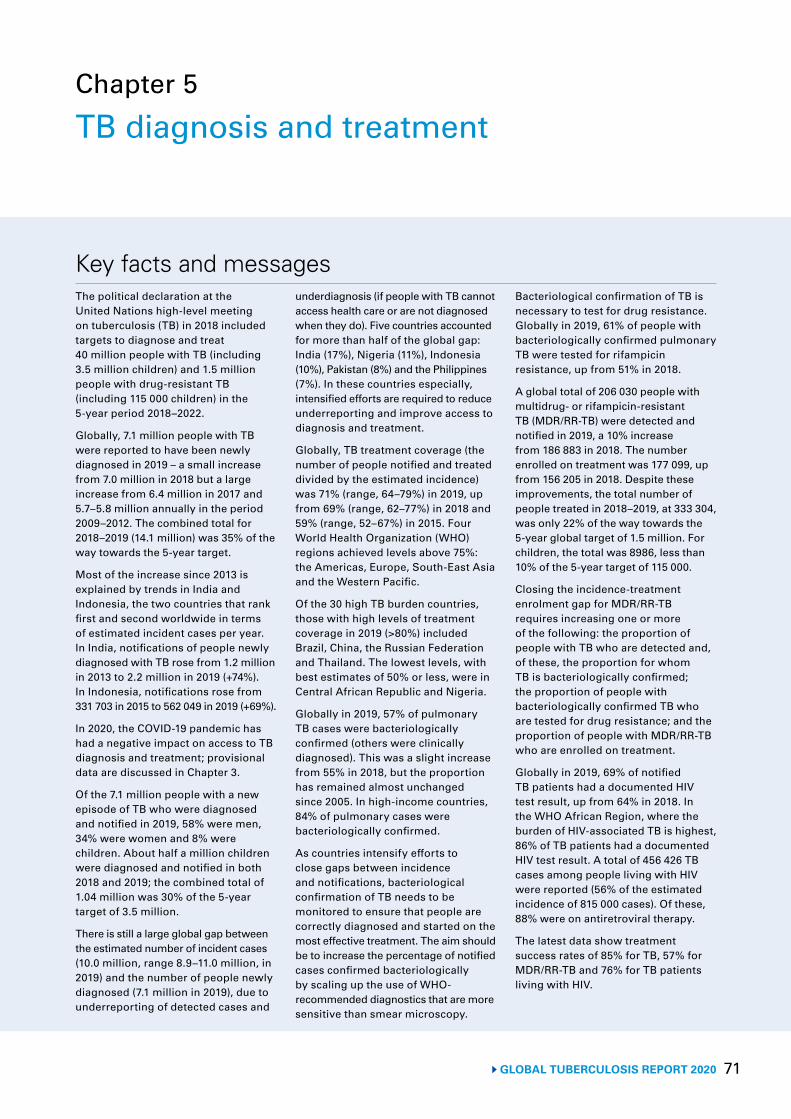
71 GLOBAL TUBERCULOSIS REPORT 2020
Chapter 5
TB diagnosis and treatment
Key facts and messagesThe political declaration at the United Nations high-level meeting on tuberculosis (TB) in 2018 included targets to diagnose and treat 40 million people with TB (including 3.5 million children) and 1.5 million people with drug-resistant TB (including 115 000 children) in the 5-year period 2018–2022.
Globally, 7.1 million people with TB were reported to have been newly diagnosed in 2019 – a small increase from 7.0 million in 2018 but a large increase from 6.4 million in 2017 and 5.7–5.8 million annually in the period 2009–2012. The combined total for 2018–2019 (14.1 million) was 35% of the way towards the 5-year target.
Most of the increase since 2013 is explained by trends in India and Indonesia, the two countries that rank first and second worldwide in terms of estimated incident cases per year. In India, notifications of people newly diagnosed with TB rose from 1.2 million in 2013 to 2.2 million in 2019 (+74%). In Indonesia, notifications rose from 331 703 in 2015 to 562 049 in 2019 (+69%).
In 2020, the COVID-19 pandemic has had a negative impact on access to TB diagnosis and treatment; provisional data are discussed in Chapter 3.
Of the 7.1 million people with a new episode of TB who were diagnosed and notified in 2019, 58% were men, 34% were women and 8% were children. About half a million children were diagnosed and notified in both 2018 and 2019; the combined total of 1.04 million was 30% of the 5-year target of 3.5 million.
There is still a large global gap between the estimated number of incident cases (10.0 million, range 8.9–11.0 million, in 2019) and the number of people newly diagnosed (7.1 million in 2019), due to underreporting of detected cases and
underdiagnosis (if people with TB cannot access health care or are not diagnosed when they do). Five countries accounted for more than half of the global gap: India (17%), Nigeria (11%), Indonesia (10%), Pakistan (8%) and the Philippines (7%). In these countries especially, intensified efforts are required to reduce underreporting and improve access to diagnosis and treatment.
Globally, TB treatment coverage (the number of people notified and treated divided by the estimated incidence) was 71% (range, 64–79%) in 2019, up from 69% (range, 62–77%) in 2018 and 59% (range, 52–67%) in 2015. Four World Health Organization (WHO) regions achieved levels above 75%: the Americas, Europe, South-East Asia and the Western Pacific.
Of the 30 high TB burden countries, those with high levels of treatment coverage in 2019 (>80%) included Brazil, China, the Russian Federation and Thailand. The lowest levels, with best estimates of 50% or less, were in Central African Republic and Nigeria.
Globally in 2019, 57% of pulmonary TB cases were bacteriologically confirmed (others were clinically diagnosed). This was a slight increase from 55% in 2018, but the proportion has remained almost unchanged since 2005. In high-income countries, 84% of pulmonary cases were bacteriologically confirmed.
As countries intensify efforts to close gaps between incidence and notifications, bacteriological confirmation of TB needs to be monitored to ensure that people are correctly diagnosed and started on the most effective treatment. The aim should be to increase the percentage of notified cases confirmed bacteriologically by scaling up the use of WHO-recommended diagnostics that are more sensitive than smear microscopy.
Bacteriological confirmation of TB is necessary to test for drug resistance. Globally in 2019, 61% of people with bacteriologically confirmed pulmonary TB were tested for rifampicin resistance, up from 51% in 2018.
A global total of 206 030 people with multidrug- or rifampicin-resistant TB (MDR/RR-TB) were detected and notified in 2019, a 10% increase from 186 883 in 2018. The number enrolled on treatment was 177 099, up from 156 205 in 2018. Despite these improvements, the total number of people treated in 2018–2019, at 333 304, was only 22% of the way towards the 5-year global target of 1.5 million. For children, the total was 8986, less than 10% of the 5-year target of 115 000. Closing the incidence-treatment enrolment gap for MDR/RR-TB requires increasing one or more of the following: the proportion of people with TB who are detected and, of these, the proportion for whom TB is bacteriologically confirmed; the proportion of people with bacteriologically confirmed TB who are tested for drug resistance; and the proportion of people with MDR/RR-TB who are enrolled on treatment.
Globally in 2019, 69% of notified TB patients had a documented HIV test result, up from 64% in 2018. In the WHO African Region, where the burden of HIV-associated TB is highest, 86% of TB patients had a documented HIV test result. A total of 456 426 TB cases among people living with HIV were reported (56% of the estimated incidence of 815 000 cases). Of these, 88% were on antiretroviral therapy.
The latest data show treatment success rates of 85% for TB, 57% for MDR/RR-TB and 76% for TB patients living with HIV.
GLOBAL TUBERCULOSIS REPORT 2020 72
Prompt and accurate diagnosis followed by provision of treatment in line with international standards prevents deaths and limits ill health among people who develop tuberculosis (TB). It also prevents further transmission of the infection to others. The 2020 and 2025 milestones for reductions in TB incidence and TB deaths set in the End TB Strategy (Chapter 2) require the case fatality ratio (i.e. the proportion of people with TB who die from the disease) to fall to 10% by 2020 and 6.5% by 2025. The latter is only feasible if all people with TB are diagnosed promptly and treated effectively. Patient-centred care and prevention – backed by bold policies and supportive sys-tems such as universal health coverage (UHC) and social protection – are Pillars 1 and 2 of the End TB Strategy (Box 5.1).
The political declaration at the first United Nations (UN) high-level meeting on TB, held in 2018, included commitments by Member States to global targets for TB treatment (Chapter 2) (1). The targets are to diagnose and treat 40 million people with TB in the 5-year period 2018–2022 (including 3.5 million children) and 1.5 million peo-ple with drug-resistant TB (including 115 000 children). The annual breakdown of the 40 million target is about 7 million in 2018 and about 8 million in subsequent years.
This chapter provides the latest national data reported to the World Health Organization (WHO) on the diag-nosis and treatment of TB in 2019, as well as data for previous years. Section 5.1 presents and discusses data on notifications of TB cases (overall, and disaggregat-ed by age and sex, and by type and site of disease) and the coverage of diagnostic testing. It includes data on the contribution to case-finding efforts of public–public and public–private mix (PPM) and community engagement initiatives. Section 5.2 focuses on treatment coverage (and on detection and treatment gaps) for people with TB, HIV-associated TB and drug-resistant TB, comparing numbers detected and treated with underlying estimates of disease burden. Section 5.3 contains the most recent data on treatment outcomes and time trends for three groups: new and relapse TB patients, TB patients living with HIV, and patients with multidrug- or rifampicin-re-sistant TB (MDR/RR-TB).
Throughout the chapter, data are presented at global, regional and country levels, giving particular attention to high burden countries.1 Further country-specific details for all of the indicators covered in this chapter are available online and in the global TB report mobile app (Annex 1).
In 2020, the COVID-19 pandemic has had a negative impact on access to TB diagnosis and treatment. Provi-sional data on trends in monthly TB notifications in 2020 in selected high TB burden countries are discussed in Chapter 3. Impacts on approaches to service delivery and mitigation strategies reported by 184 countries in WHO’s 2020 round of global TB data collection are also summarized.
5.1 Case notifications and testing coverage
5.1.1 TB case notifications in 2019 and trends since 2000
Globally in 2019, 7.1 million people with a new episode of TB (new and relapse cases) were diagnosed and noti-fied to national TB programmes (NTPs) and reported to WHO (Table 5.1). This was an increase from 7.0 million in 2018 and 6.4 million in 2017. The first milestone required to reach the UN high-level meeting target of 40 million between 2018 and 2022 was reached in 2018, but the num-ber in 2019 fell short of the approximately 8 million need-ed to be on track to reach the target. The combined total for 2018–2019 (14.1 million) was 35% of the way towards the 5-year target.
1 The three WHO lists of high burden countries (for TB, HIV-asso-ciated TB and multidrug-resistant TB [MDR-TB]) are explained in Annex 2.
BOX 5.1
Pillars 1 and 2 of the End TB Strategy
Pillar 1 of the End TB Strategy is “Integrated, patient-centred care and prevention”. It has four components:
▶ early diagnosis of TB, including universal drug susceptibility testing, and systematic screening of contacts and high-risk groups;
▶ treatment of all people with TB, including drug-resistant TB, and patient support;
▶ collaborative TB/HIV activities and management of comorbidities; and
▶ preventive treatment of persons at high risk and vaccination against TB.
The fourth component of Pillar 1 is the topic of Chapter 6.
Pillar 2 of the End TB Strategy is “Bold policies and supportive systems”. This pillar also has four components:
▶ political commitment with adequate resources for TB care and prevention;
▶ engagement of communities, civil society organizations and providers of public and private care;
▶ UHC policy and regulatory frameworks for case notification, vital registration, quality and rational use of medicines, and infection control; and
▶ social protection, poverty alleviation and actions on other determinants of TB.
The components of Pillar 2 are primarily discussed in Chapter 8.
For an overview of all aspects of the End TB Strategy, see Chapter 2.
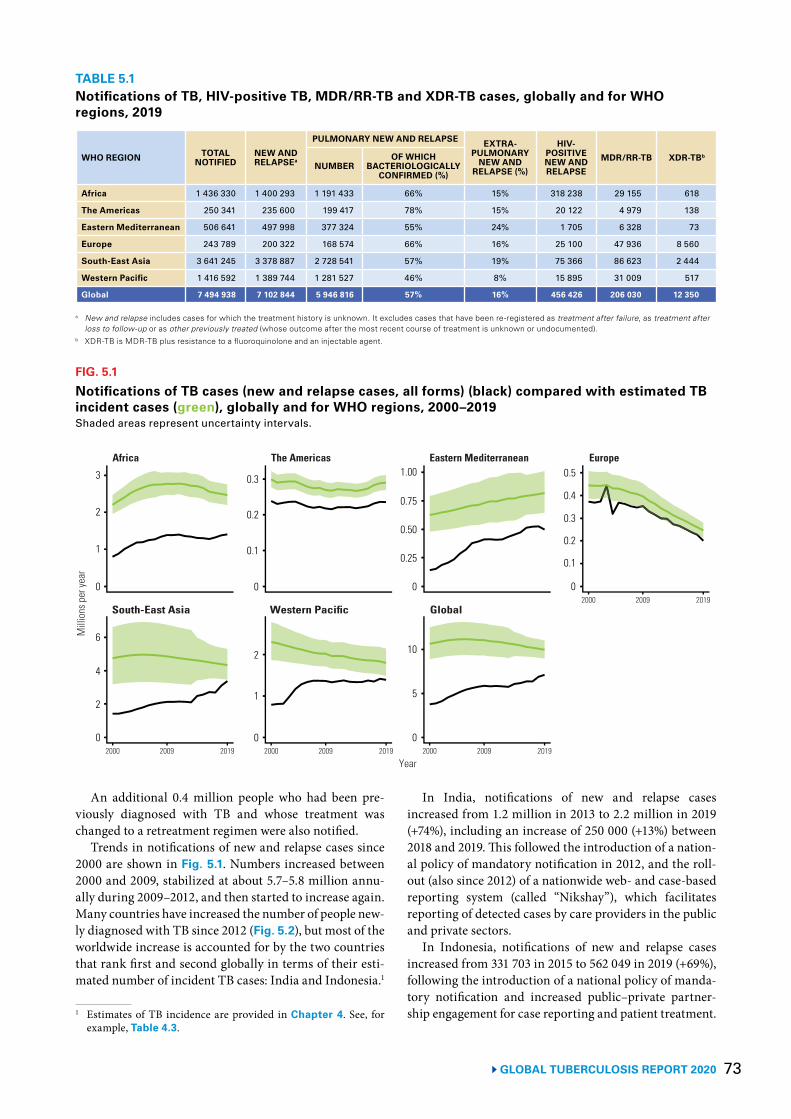
73 GLOBAL TUBERCULOSIS REPORT 2020
An additional 0.4 million people who had been pre-viously diagnosed with TB and whose treatment was changed to a retreatment regimen were also notified.
Trends in notifications of new and relapse cases since 2000 are shown in Fig. 5.1. Numbers increased between 2000 and 2009, stabilized at about 5.7–5.8 million annu-ally during 2009–2012, and then started to increase again. Many countries have increased the number of people new-ly diagnosed with TB since 2012 (Fig. 5.2), but most of the worldwide increase is accounted for by the two countries that rank first and second globally in terms of their esti-mated number of incident TB cases: India and Indonesia.1
1 Estimates of TB incidence are provided in Chapter 4. See, for example, Table 4.3.
In India, notifications of new and relapse cases increased from 1.2 million in 2013 to 2.2 million in 2019 (+74%), including an increase of 250 000 (+13%) between 2018 and 2019. This followed the introduction of a nation-al policy of mandatory notification in 2012, and the roll-out (also since 2012) of a nationwide web- and case-based reporting system (called “Nikshay”), which facilitates reporting of detected cases by care providers in the public and private sectors.
In Indonesia, notifications of new and relapse cases increased from 331 703 in 2015 to 562 049 in 2019 (+69%), following the introduction of a national policy of manda-tory notification and increased public–private partner-ship engagement for case reporting and patient treatment.
TABLE 5.1Notifications of TB, HIV-positive TB, MDR/RR-TB and XDR-TB cases, globally and for WHO regions, 2019
WHO REGION TOTAL NOTIFIED
NEW AND RELAPSEa
PULMONARY NEW AND RELAPSE EXTRA-PULMONARY
NEW AND RELAPSE (%)
HIV-POSITIVE NEW AND RELAPSE
MDR/RR-TB XDR-TBb
NUMBEROF WHICH
BACTERIOLOGICALLY CONFIRMED (%)
Africa 1 436 330 1 400 293 1 191 433 66% 15% 318 238 29 155 618
The Americas 250 341 235 600 199 417 78% 15% 20 122 4 979 138
Eastern Mediterranean 506 641 497 998 377 324 55% 24% 1 705 6 328 73
Europe 243 789 200 322 168 574 66% 16% 25 100 47 936 8 560
South-East Asia 3 641 245 3 378 887 2 728 541 57% 19% 75 366 86 623 2 444
Western Pacific 1 416 592 1 389 744 1 281 527 46% 8% 15 895 31 009 517
Global 7 494 938 7 102 844 5 946 816 57% 16% 456 426 206 030 12 350
a New and relapse includes cases for which the treatment history is unknown. It excludes cases that have been re-registered as treatment after failure, as treatment after loss to follow-up or as other previously treated (whose outcome after the most recent course of treatment is unknown or undocumented).
b XDR-TB is MDR-TB plus resistance to a fluoroquinolone and an injectable agent.
FIG. 5.1
Notifications of TB cases (new and relapse cases, all forms) (black) compared with estimated TB incident cases (green), globally and for WHO regions, 2000–2019Shaded areas represent uncertainty intervals.
Africa The Americas Eastern Mediterranean Europe
Mill
ions
per
year
2000 2009 2019
Year
South-East Asia Western Pacific Global
3
2
1
0
6
4
2
0 2000 2009 2019 2000 2009 2019
2000 2009 2019
0.3
0.1
0
2
1
0
1.00
0
10
5
0.5
0
0.4
0.3
0.2
0.1
0.20.75
0.50
0.25
0
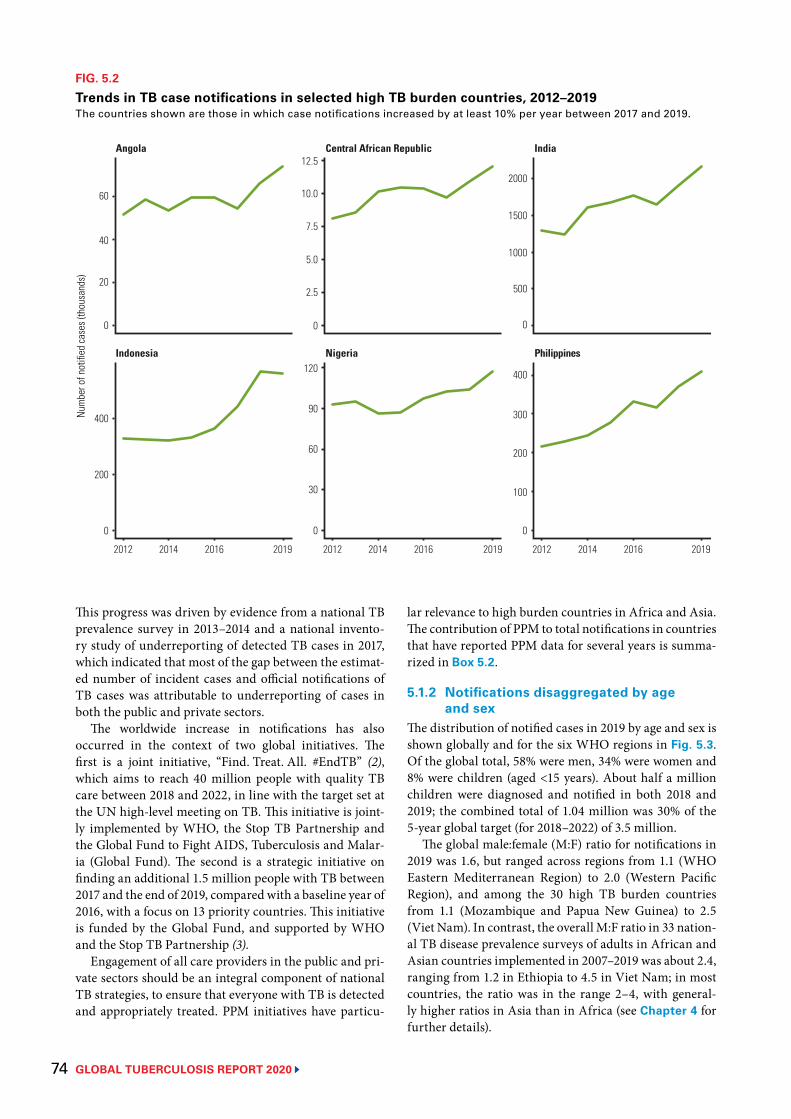
GLOBAL TUBERCULOSIS REPORT 2020 74
This progress was driven by evidence from a national TB prevalence survey in 2013–2014 and a national invento-ry study of underreporting of detected TB cases in 2017, which indicated that most of the gap between the estimat-ed number of incident cases and official notifications of TB cases was attributable to underreporting of cases in both the public and private sectors.
The worldwide increase in notifications has also occurred in the context of two global initiatives. The first is a joint initiative, “Find. Treat. All. #EndTB” (2), which aims to reach 40 million people with quality TB care between 2018 and 2022, in line with the target set at the UN high-level meeting on TB. This initiative is joint-ly implemented by WHO, the Stop TB Partnership and the Global Fund to Fight AIDS, Tuberculosis and Malar-ia (Global Fund). The second is a strategic initiative on finding an additional 1.5 million people with TB between 2017 and the end of 2019, compared with a baseline year of 2016, with a focus on 13 priority countries. This initiative is funded by the Global Fund, and supported by WHO and the Stop TB Partnership (3).
Engagement of all care providers in the public and pri-vate sectors should be an integral component of national TB strategies, to ensure that everyone with TB is detected and appropriately treated. PPM initiatives have particu-
lar relevance to high burden countries in Africa and Asia. The contribution of PPM to total notifications in countries that have reported PPM data for several years is summa-rized in Box 5.2.
5.1.2 Notifications disaggregated by age and sex
The distribution of notified cases in 2019 by age and sex is shown globally and for the six WHO regions in Fig. 5.3. Of the global total, 58% were men, 34% were women and 8% were children (aged <15 years). About half a million children were diagnosed and notified in both 2018 and 2019; the combined total of 1.04 million was 30% of the 5-year global target (for 2018–2022) of 3.5 million.
The global male:female (M:F) ratio for notifications in 2019 was 1.6, but ranged across regions from 1.1 (WHO Eastern Mediterranean Region) to 2.0 (Western Pacific Region), and among the 30 high TB burden countries from 1.1 (Mozambique and Papua New Guinea) to 2.5 (Viet Nam). In contrast, the overall M:F ratio in 33 nation-al TB disease prevalence surveys of adults in African and Asian countries implemented in 2007–2019 was about 2.4, ranging from 1.2 in Ethiopia to 4.5 in Viet Nam; in most countries, the ratio was in the range 2–4, with general-ly higher ratios in Asia than in Africa (see Chapter 4 for further details).
FIG. 5.2
Trends in TB case notifications in selected high TB burden countries, 2012–2019 The countries shown are those in which case notifications increased by at least 10% per year between 2017 and 2019.
2012 2014 2016 2019 2012 2014 2016 2019
0
1000
2000
100
200
400
5.0
12.5
0
60
90
20
40
200
2012 2014 2016 2019
400Num
ber o
f not
ified
case
s (th
ousa
nds)
Indonesia Nigeria Philippines
Angola Central African Republic India
10.0
2.5
0
300
60
0
1500
0
7.5
120
30
500
0
BOX 5.2
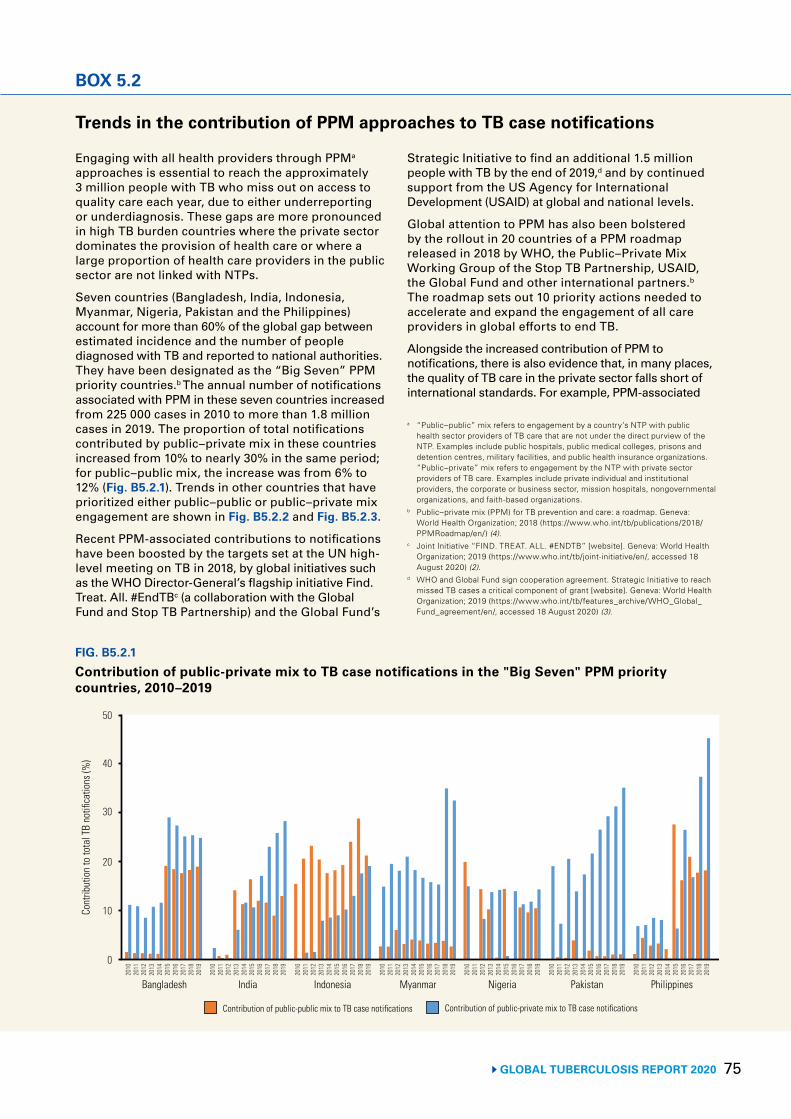
75 GLOBAL TUBERCULOSIS REPORT 2020
BOX 5.2
FIG. B5.2.1
Contribution of public-private mix to TB case notifications in the "Big Seven" PPM priority countries, 2010–2019
Cont
ribut
ion
to to
tal T
B no
tifica
tions
(%)
2010
2011
2012
2013
2014
2015
2016
2017
2018
2019
20
10
0
30
50
40
Bangladesh India Indonesia Myanmar Nigeria Pakistan Philippines
2010
2011
2012
2013
2014
2015
2016
2017
2018
2019
2010
2011
2012
2013
2014
2015
2016
2017
2018
2019
2010
2011
2012
2013
2014
2015
2016
2017
2018
2019
2010
2011
2012
2013
2014
2015
2016
2017
2018
2019
2010
2011
2012
2013
2014
2015
2016
2017
2018
2019
2010
2011
2012
2013
2014
2015
2016
2017
2018
2019
Contribution of public-public mix to TB case notifications Contribution of public-private mix to TB case notifications
Trends in the contribution of PPM approaches to TB case notifications
Engaging with all health providers through PPMa approaches is essential to reach the approximately 3 million people with TB who miss out on access to quality care each year, due to either underreporting or underdiagnosis. These gaps are more pronounced in high TB burden countries where the private sector dominates the provision of health care or where a large proportion of health care providers in the public sector are not linked with NTPs.
Seven countries (Bangladesh, India, Indonesia, Myanmar, Nigeria, Pakistan and the Philippines) account for more than 60% of the global gap between estimated incidence and the number of people diagnosed with TB and reported to national authorities. They have been designated as the “Big Seven” PPM priority countries.b The annual number of notifications associated with PPM in these seven countries increased from 225 000 cases in 2010 to more than 1.8 million cases in 2019. The proportion of total notifications contributed by public–private mix in these countries increased from 10% to nearly 30% in the same period; for public–public mix, the increase was from 6% to 12% (Fig. B5.2.1). Trends in other countries that have prioritized either public–public or public–private mix engagement are shown in Fig. B5.2.2 and Fig. B5.2.3.
Recent PPM-associated contributions to notifications have been boosted by the targets set at the UN high-level meeting on TB in 2018, by global initiatives such as the WHO Director-General’s flagship initiative Find. Treat. All. #EndTBc (a collaboration with the Global Fund and Stop TB Partnership) and the Global Fund’s
Strategic Initiative to find an additional 1.5 million people with TB by the end of 2019,d and by continued support from the US Agency for International Development (USAID) at global and national levels.
Global attention to PPM has also been bolstered by the rollout in 20 countries of a PPM roadmap released in 2018 by WHO, the Public–Private Mix Working Group of the Stop TB Partnership, USAID, the Global Fund and other international partners.b The roadmap sets out 10 priority actions needed to accelerate and expand the engagement of all care providers in global efforts to end TB.
Alongside the increased contribution of PPM to notifications, there is also evidence that, in many places, the quality of TB care in the private sector falls short of international standards. For example, PPM-associated
a “Public–public” mix refers to engagement by a country’s NTP with public health sector providers of TB care that are not under the direct purview of the NTP. Examples include public hospitals, public medical colleges, prisons and detention centres, military facilities, and public health insurance organizations. “Public–private” mix refers to engagement by the NTP with private sector providers of TB care. Examples include private individual and institutional providers, the corporate or business sector, mission hospitals, nongovernmental organizations, and faith-based organizations.
b Public–private mix (PPM) for TB prevention and care: a roadmap. Geneva: World Health Organization; 2018 (https://www.who.int/tb/publications/2018/PPMRoadmap/en/) (4).
c Joint Initiative “FIND. TREAT. ALL. #ENDTB” [website]. Geneva: World Health Organization; 2019 (https://www.who.int/tb/joint-initiative/en/, accessed 18 August 2020) (2).
d WHO and Global Fund sign cooperation agreement. Strategic Initiative to reach missed TB cases a critical component of grant [website]. Geneva: World Health Organization; 2019 (https://www.who.int/tb/features_archive/WHO_Global_Fund_agreement/en/, accessed 18 August 2020) (3).
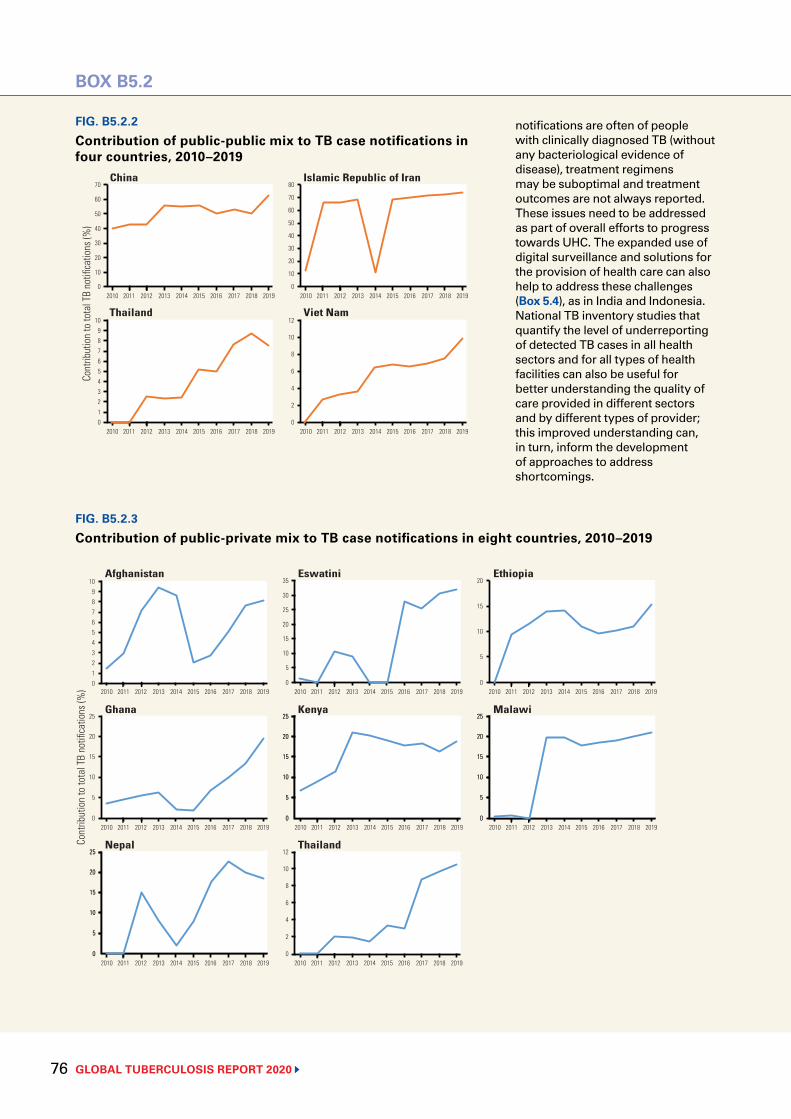
GLOBAL TUBERCULOSIS REPORT 2020 76
FIG. B5.2.3
Contribution of public-private mix to TB case notifications in eight countries, 2010–2019
BOX B5.2
2010 2011 2012 2013 2014 2015 2016 2017 2018 2019
5
20
10
0
15
Cont
ribut
ion
to to
tal T
B no
tifica
tions
(%)
Afghanistan Eswatini Ethiopia
Ghana Kenya Malawi
7
4
2
10
6
3
1
9
0
8
5
2010 2011 2012 2013 2014 2015 2016 2017 2018 2019
2010 2011 2012 2013 2014 2015 2016 2017 2018 2019
2010 2011 2012 2013 2014 2015 2016 2017 2018 2019
5
25
10
0
20
15
20
10
35
30
15
5
0
25
Nepal Thailand
2010 2011 2012 2013 2014 2015 2016 2017 2018 2019
2010 2011 2012 2013 2014 2015 2016 2017 2018 2019
2010 2011 2012 2013 2014 2015 2016 2017 2018 2019
2010 2011 2012 2013 2014 2015 2016 2017 2018 2019
2
12
4
10
0
8
6
5
25
10
0
20
15
5
25
10
0
20
15
5
25
10
0
20
15
5
25
10
0
20
15
5
25
10
0
20
15
5
25
10
0
20
15
FIG. B5.2.2
Contribution of public-public mix to TB case notifications in four countries, 2010–2019
Cont
ribut
ion
to to
tal T
B no
tifica
tions
(%)
China Islamic Republic of Iran
Thailand Viet Nam
7
4
2
10
2010 2011 2012 2013 2014 2015 2016 2017 2018 2019
6
3
1
9
0
8
5
40
20
70
2010 2011 2012 2013 2014 2015 2016 2017 2018 2019
60
30
10
0
50
2010 2011 2012 2013 2014 2015 2016 2017 2018 2019
2010 2011 2012 2013 2014 2015 2016 2017 2018 2019
2
12
4
10
0
8
6
70
40
20
80
60
30
10
0
50
notifications are often of people with clinically diagnosed TB (without any bacteriological evidence of disease), treatment regimens may be suboptimal and treatment outcomes are not always reported. These issues need to be addressed as part of overall efforts to progress towards UHC. The expanded use of digital surveillance and solutions for the provision of health care can also help to address these challenges (Box 5.4), as in India and Indonesia. National TB inventory studies that quantify the level of underreporting of detected TB cases in all health sectors and for all types of health facilities can also be useful for better understanding the quality of care provided in different sectors and by different types of provider; this improved understanding can, in turn, inform the development of approaches to address shortcomings.
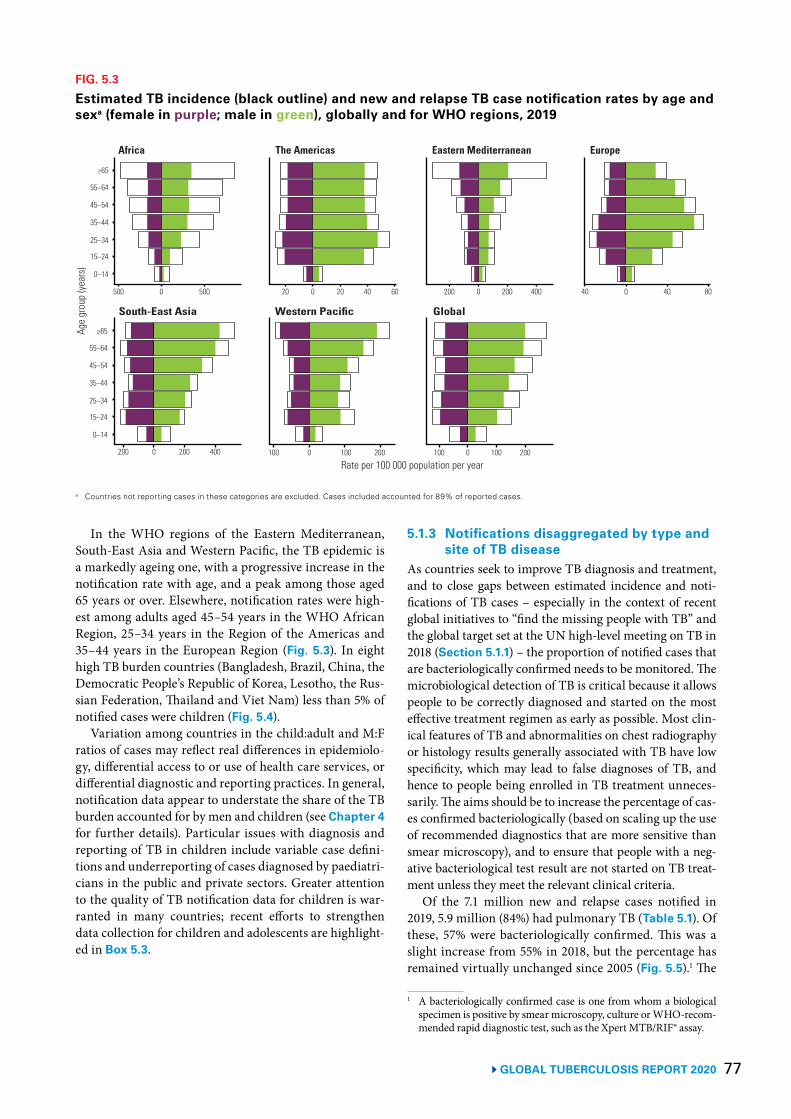
77 GLOBAL TUBERCULOSIS REPORT 2020
In the WHO regions of the Eastern Mediterranean, South-East Asia and Western Pacific, the TB epidemic is a markedly ageing one, with a progressive increase in the notification rate with age, and a peak among those aged 65 years or over. Elsewhere, notification rates were high-est among adults aged 45–54 years in the WHO African Region, 25–34 years in the Region of the Americas and 35–44 years in the European Region (Fig. 5.3). In eight high TB burden countries (Bangladesh, Brazil, China, the Democratic People’s Republic of Korea, Lesotho, the Rus-sian Federation, Thailand and Viet Nam) less than 5% of notified cases were children (Fig. 5.4).
Variation among countries in the child:adult and M:F ratios of cases may reflect real differences in epidemiolo-gy, differential access to or use of health care services, or differential diagnostic and reporting practices. In general, notification data appear to understate the share of the TB burden accounted for by men and children (see Chapter 4 for further details). Particular issues with diagnosis and reporting of TB in children include variable case defini-tions and underreporting of cases diagnosed by paediatri-cians in the public and private sectors. Greater attention to the quality of TB notification data for children is war-ranted in many countries; recent efforts to strengthen data collection for children and adolescents are highlight-ed in Box 5.3.
5.1.3 Notifications disaggregated by type and site of TB disease
As countries seek to improve TB diagnosis and treatment, and to close gaps between estimated incidence and noti-fications of TB cases – especially in the context of recent global initiatives to “find the missing people with TB” and the global target set at the UN high-level meeting on TB in 2018 (Section 5.1.1) – the proportion of notified cases that are bacteriologically confirmed needs to be monitored. The microbiological detection of TB is critical because it allows people to be correctly diagnosed and started on the most effective treatment regimen as early as possible. Most clin-ical features of TB and abnormalities on chest radiography or histology results generally associated with TB have low specificity, which may lead to false diagnoses of TB, and hence to people being enrolled in TB treatment unneces-sarily. The aims should be to increase the percentage of cas-es confirmed bacteriologically (based on scaling up the use of recommended diagnostics that are more sensitive than smear microscopy), and to ensure that people with a neg-ative bacteriological test result are not started on TB treat-ment unless they meet the relevant clinical criteria.
Of the 7.1 million new and relapse cases notified in 2019, 5.9 million (84%) had pulmonary TB (Table 5.1). Of these, 57% were bacteriologically confirmed. This was a slight increase from 55% in 2018, but the percentage has remained virtually unchanged since 2005 (Fig. 5.5).1 The
1 A bacteriologically confirmed case is one from whom a biological specimen is positive by smear microscopy, culture or WHO-recom-mended rapid diagnostic test, such as the Xpert MTB/RIF® assay.
FIG. 5.3
Estimated TB incidence (black outline) and new and relapse TB case notification rates by age and sexa (female in purple; male in green), globally and for WHO regions, 2019
Age
grou
p (ye
ars)
Africa The Americas Eastern Mediterranean Europe
200 0 200 400
Rate per 100 000 population per year
South-East Asia Western Pacific Global
100 0 100 200
25–34
0–14
≥65
45–54
15–24
55–64
35–44
500 0 500 20 0 20 40 60
25–34
0–14
≥65
45–54
15–24
55–64
35–44
100 0 100 200
200 0 200 400 40 0 40 80
a Countries not reporting cases in these categories are excluded. Cases included accounted for 89% of reported cases.
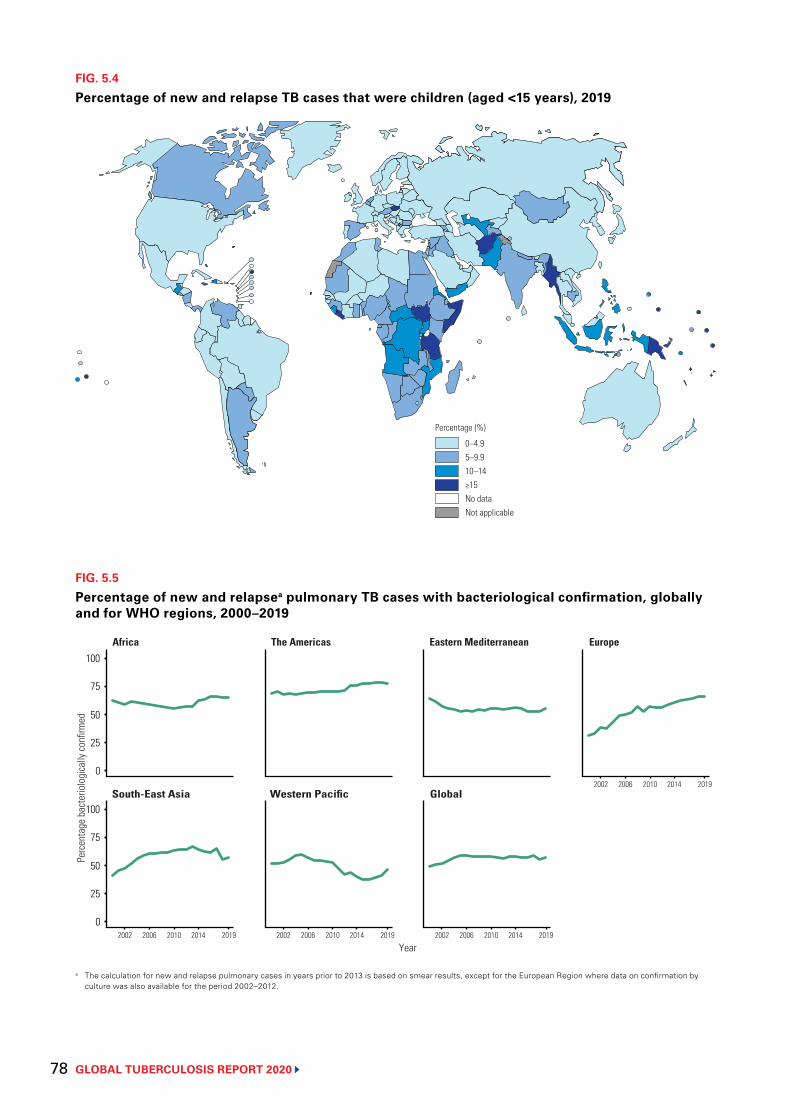
GLOBAL TUBERCULOSIS REPORT 2020 78
FIG. 5.4
Percentage of new and relapse TB cases that were children (aged <15 years), 2019
0–4.95–9.910–14≥15No dataNot applicable
Percentage (%)
FIG. 5.5
Percentage of new and relapsea pulmonary TB cases with bacteriological confirmation, globally and for WHO regions, 2000–2019
a The calculation for new and relapse pulmonary cases in years prior to 2013 is based on smear results, except for the European Region where data on confirmation by culture was also available for the period 2002–2012.
Per
cent
age
bact
erio
logi
cally
confi
rmed
Africa The Americas Eastern Mediterranean Europe
2002 2006 2010 2014 2019
Year
South-East Asia Western Pacific Global
100
75
50
25
0
100
75
50
25
0 2002 2006 2010 2014 2019 2002 2006 2010 2014 2019
2002 2006 2010 2014 2019
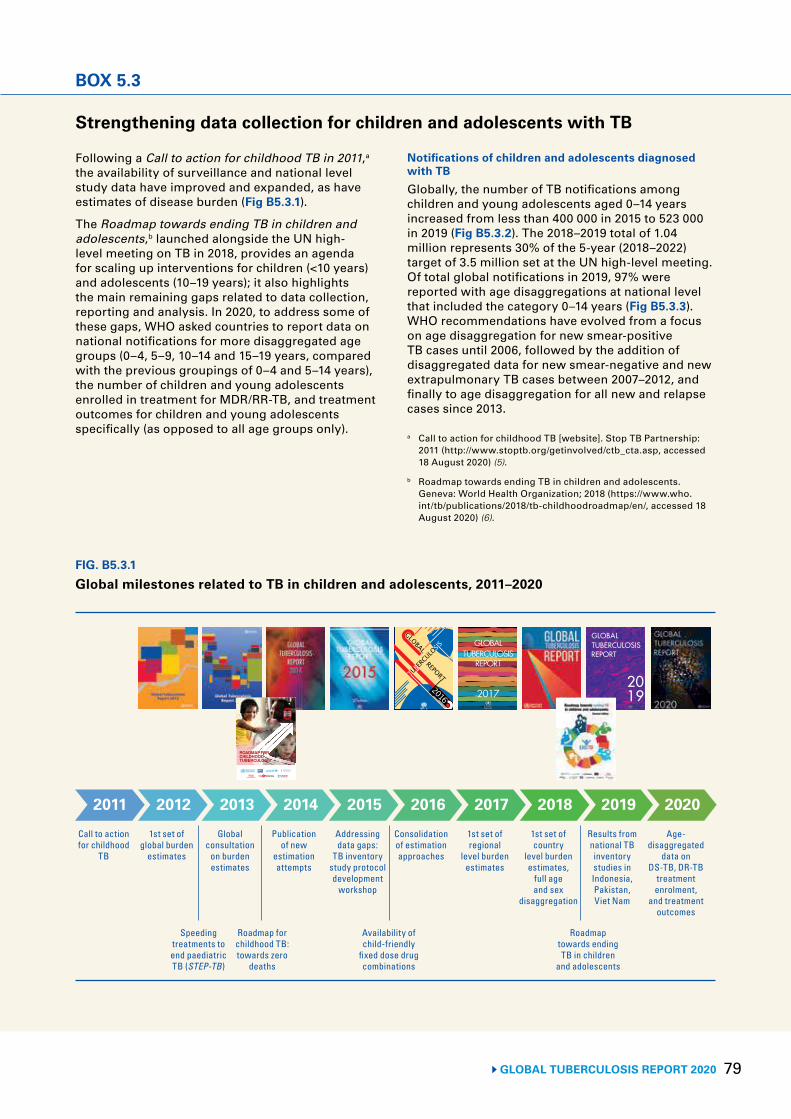
79 GLOBAL TUBERCULOSIS REPORT 2020
BOX 5.3
FIG. B5.3.1
Global milestones related to TB in children and adolescents, 2011–2020
GLOBAL
TUBERCULOSIS
REPORT
2016
deaths
tOWaRds
zeRO
ROadmap fOR childhOOd tubeRculOsis
Call to action for childhood
TB
1st set of global burden
estimates
Global consultation
on burden estimates
Publication of new
estimation attempts
Addressing data gaps:
TB inventory study protocol development
workshop
Consolidation of estimation approaches
1st set of regional
level burden estimates
1st set of country
level burden estimates,
full age and sex
disaggregation
Results from national TB inventory studies in Indonesia, Pakistan, Viet Nam
Age-disaggregated
data on DS-TB, DR-TB
treatment enrolment,
and treatment outcomes
Speeding treatments to end paediatric TB (STEP-TB)
Roadmap for childhood TB: towards zero
deaths
Availability of child-friendly
fixed dose drug combinations
Roadmap towards ending TB in children
and adolescents
2011 2012 2013 2014 2015 2016 2017 2018 2019 2020
Strengthening data collection for children and adolescents with TB
Following a Call to action for childhood TB in 2011,a the availability of surveillance and national level study data have improved and expanded, as have estimates of disease burden (Fig B5.3.1).
The Roadmap towards ending TB in children and adolescents,b launched alongside the UN high-level meeting on TB in 2018, provides an agenda for scaling up interventions for children (<10 years) and adolescents (10–19 years); it also highlights the main remaining gaps related to data collection, reporting and analysis. In 2020, to address some of these gaps, WHO asked countries to report data on national notifications for more disaggregated age groups (0–4, 5–9, 10–14 and 15–19 years, compared with the previous groupings of 0–4 and 5–14 years), the number of children and young adolescents enrolled in treatment for MDR/RR-TB, and treatment outcomes for children and young adolescents specifically (as opposed to all age groups only).
Notifications of children and adolescents diagnosed with TBGlobally, the number of TB notifications among children and young adolescents aged 0–14 years increased from less than 400 000 in 2015 to 523 000 in 2019 (Fig B5.3.2). The 2018–2019 total of 1.04 million represents 30% of the 5-year (2018–2022) target of 3.5 million set at the UN high-level meeting. Of total global notifications in 2019, 97% were reported with age disaggregations at national level that included the category 0–14 years (Fig B5.3.3). WHO recommendations have evolved from a focus on age disaggregation for new smear-positive TB cases until 2006, followed by the addition of disaggregated data for new smear-negative and new extrapulmonary TB cases between 2007–2012, and finally to age disaggregation for all new and relapse cases since 2013.
a Call to action for childhood TB [website]. Stop TB Partnership: 2011 (http://www.stoptb.org/getinvolved/ctb_cta.asp, accessed 18 August 2020) (5).
b Roadmap towards ending TB in children and adolescents. Geneva: World Health Organization; 2018 (https://www.who.int/tb/publications/2018/tb-childhoodroadmap/en/, accessed 18 August 2020) (6).
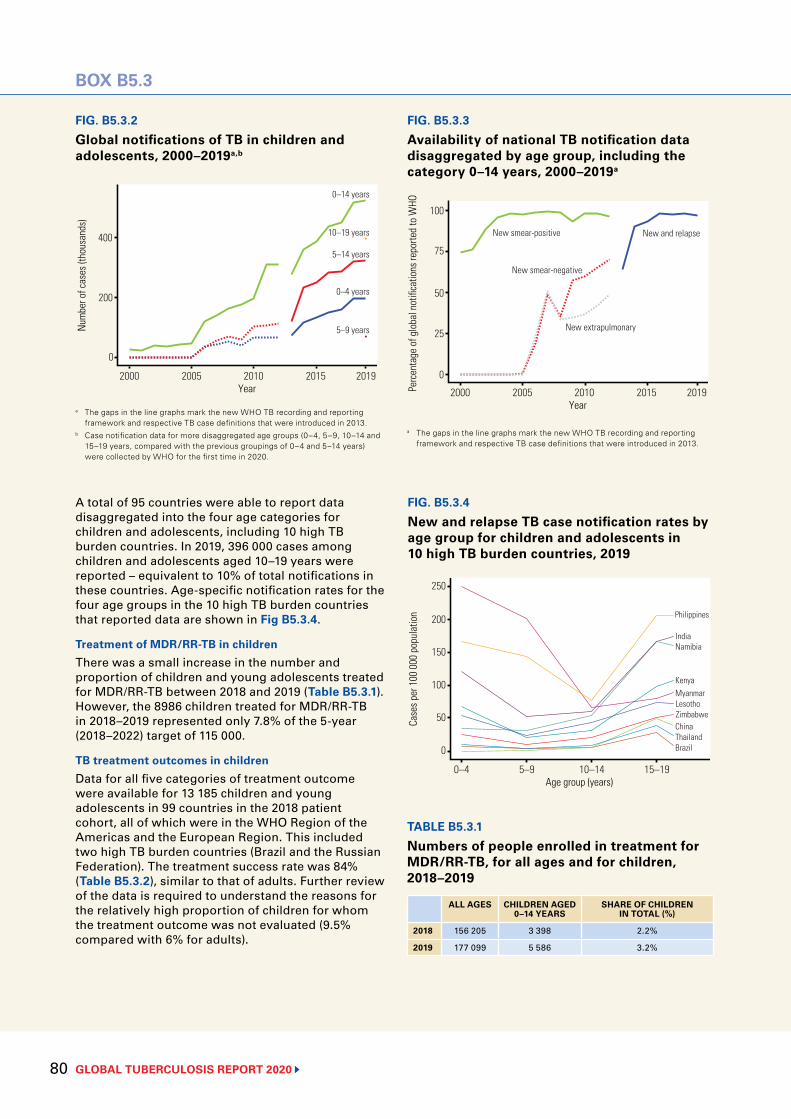
GLOBAL TUBERCULOSIS REPORT 2020 80
BOX B5.3
FIG. B5.3.3
Availability of national TB notification data disaggregated by age group, including the category 0–14 years, 2000–2019a
Perc
enta
ge o
f glo
bal n
otifi
catio
ns re
porte
d to
WHO
50
2000 2005 2010 2015 2019
75
0
Year
New smear-positive
100
25
New smear-negative
New extrapulmonary
New and relapse
FIG. B5.3.4
New and relapse TB case notification rates by age group for children and adolescents in 10 high TB burden countries, 2019
Case
s per
100
000
pop
ulat
ion 200
0–4 5–9 10–14 15–19
250
0
Age group (years)
Philippines
India
MyanmarKenya
Namibia150
100
50Lesotho
ThailandChina
Brazil
Zimbabwe
a The gaps in the line graphs mark the new WHO TB recording and reporting framework and respective TB case definitions that were introduced in 2013.
A total of 95 countries were able to report data disaggregated into the four age categories for children and adolescents, including 10 high TB burden countries. In 2019, 396 000 cases among children and adolescents aged 10–19 years were reported – equivalent to 10% of total notifications in these countries. Age-specific notification rates for the four age groups in the 10 high TB burden countries that reported data are shown in Fig B5.3.4.
Treatment of MDR/RR-TB in childrenThere was a small increase in the number and proportion of children and young adolescents treated for MDR/RR-TB between 2018 and 2019 (Table B5.3.1). However, the 8986 children treated for MDR/RR-TB in 2018–2019 represented only 7.8% of the 5-year (2018–2022) target of 115 000.
TB treatment outcomes in childrenData for all five categories of treatment outcome were available for 13 185 children and young adolescents in 99 countries in the 2018 patient cohort, all of which were in the WHO Region of the Americas and the European Region. This included two high TB burden countries (Brazil and the Russian Federation). The treatment success rate was 84% (Table B5.3.2), similar to that of adults. Further review of the data is required to understand the reasons for the relatively high proportion of children for whom the treatment outcome was not evaluated (9.5% compared with 6% for adults).
TABLE B5.3.1
Numbers of people enrolled in treatment for MDR/RR-TB, for all ages and for children, 2018–2019
ALL AGES CHILDREN AGED 0–14 YEARS
SHARE OF CHILDREN IN TOTAL (%)
2018 156 205 3 398 2.2%
2019 177 099 5 586 3.2%
FIG. B5.3.2
Global notifications of TB in children and adolescents, 2000–2019a,b
Num
ber o
f cas
es (t
hous
ands
)
200
2000 2005 2010 2015 2019
400
0
Year
0–14 years
10–19 years
5–9 years
0–4 years
5–14 years
a The gaps in the line graphs mark the new WHO TB recording and reporting framework and respective TB case definitions that were introduced in 2013.
b Case notification data for more disaggregated age groups (0–4, 5–9, 10–14 and 15–19 years, compared with the previous groupings of 0–4 and 5–14 years) were collected by WHO for the first time in 2020.
BOX B5.3
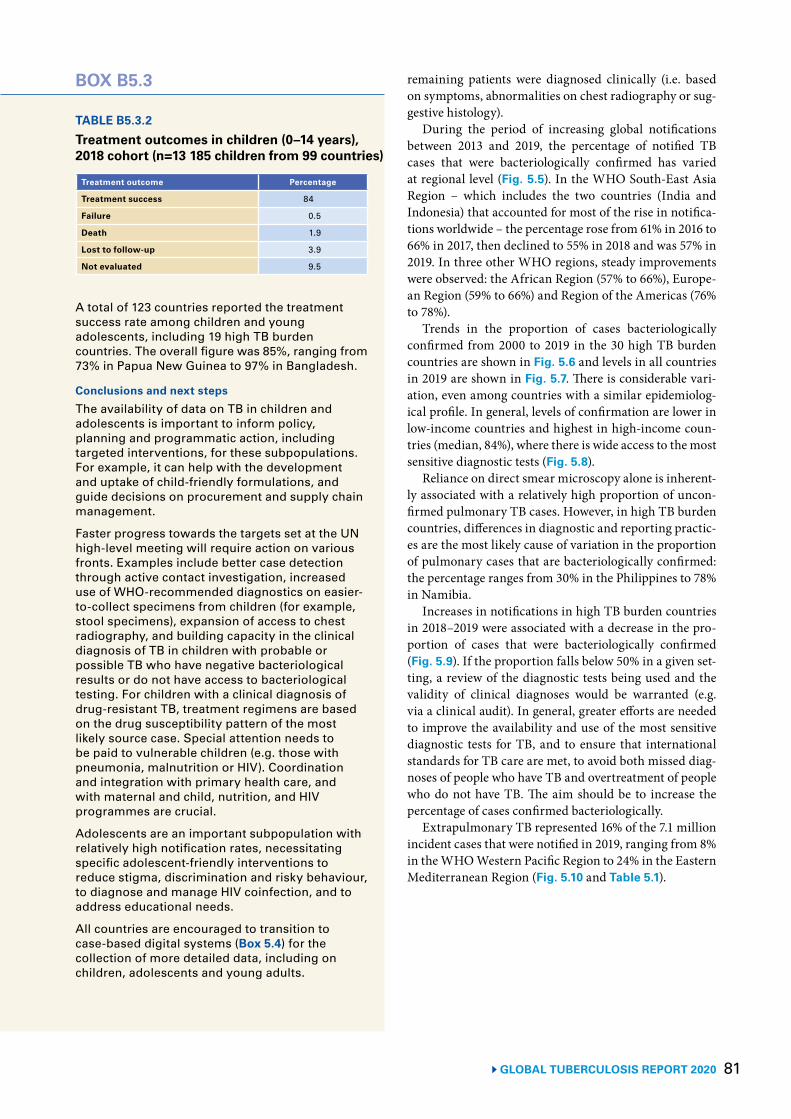
81 GLOBAL TUBERCULOSIS REPORT 2020
remaining patients were diagnosed clinically (i.e. based on symptoms, abnormalities on chest radiography or sug-gestive histology).
During the period of increasing global notifications between 2013 and 2019, the percentage of notified TB cases that were bacteriologically confirmed has varied at regional level (Fig. 5.5). In the WHO South-East Asia Region – which includes the two countries (India and Indonesia) that accounted for most of the rise in notifica-tions worldwide – the percentage rose from 61% in 2016 to 66% in 2017, then declined to 55% in 2018 and was 57% in 2019. In three other WHO regions, steady improvements were observed: the African Region (57% to 66%), Europe-an Region (59% to 66%) and Region of the Americas (76% to 78%).
Trends in the proportion of cases bacteriologically confirmed from 2000 to 2019 in the 30 high TB burden countries are shown in Fig. 5.6 and levels in all countries in 2019 are shown in Fig. 5.7. There is considerable vari-ation, even among countries with a similar epidemiolog-ical profile. In general, levels of confirmation are lower in low-income countries and highest in high-income coun-tries (median, 84%), where there is wide access to the most sensitive diagnostic tests (Fig. 5.8).
Reliance on direct smear microscopy alone is inherent-ly associated with a relatively high proportion of uncon-firmed pulmonary TB cases. However, in high TB burden countries, differences in diagnostic and reporting practic-es are the most likely cause of variation in the proportion of pulmonary cases that are bacteriologically confirmed: the percentage ranges from 30% in the Philippines to 78% in Namibia.
Increases in notifications in high TB burden countries in 2018–2019 were associated with a decrease in the pro-portion of cases that were bacteriologically confirmed (Fig. 5.9). If the proportion falls below 50% in a given set-ting, a review of the diagnostic tests being used and the validity of clinical diagnoses would be warranted (e.g. via a clinical audit). In general, greater efforts are needed to improve the availability and use of the most sensitive diagnostic tests for TB, and to ensure that international standards for TB care are met, to avoid both missed diag-noses of people who have TB and overtreatment of people who do not have TB. The aim should be to increase the percentage of cases confirmed bacteriologically.
Extrapulmonary TB represented 16% of the 7.1 million incident cases that were notified in 2019, ranging from 8% in the WHO Western Pacific Region to 24% in the Eastern Mediterranean Region (Fig. 5.10 and Table 5.1).
TABLE B5.3.2
Treatment outcomes in children (0–14 years), 2018 cohort (n=13 185 children from 99 countries)
Treatment outcome Percentage
Treatment success 84
Failure 0.5
Death 1.9
Lost to follow-up 3.9
Not evaluated 9.5
A total of 123 countries reported the treatment success rate among children and young adolescents, including 19 high TB burden countries. The overall figure was 85%, ranging from 73% in Papua New Guinea to 97% in Bangladesh.
Conclusions and next stepsThe availability of data on TB in children and adolescents is important to inform policy, planning and programmatic action, including targeted interventions, for these subpopulations. For example, it can help with the development and uptake of child-friendly formulations, and guide decisions on procurement and supply chain management.
Faster progress towards the targets set at the UN high-level meeting will require action on various fronts. Examples include better case detection through active contact investigation, increased use of WHO-recommended diagnostics on easier-to-collect specimens from children (for example, stool specimens), expansion of access to chest radiography, and building capacity in the clinical diagnosis of TB in children with probable or possible TB who have negative bacteriological results or do not have access to bacteriological testing. For children with a clinical diagnosis of drug-resistant TB, treatment regimens are based on the drug susceptibility pattern of the most likely source case. Special attention needs to be paid to vulnerable children (e.g. those with pneumonia, malnutrition or HIV). Coordination and integration with primary health care, and with maternal and child, nutrition, and HIV programmes are crucial.
Adolescents are an important subpopulation with relatively high notification rates, necessitating specific adolescent-friendly interventions to reduce stigma, discrimination and risky behaviour, to diagnose and manage HIV coinfection, and to address educational needs.
All countries are encouraged to transition to case-based digital systems (Box 5.4) for the collection of more detailed data, including on children, adolescents and young adults.
BOX B5.3
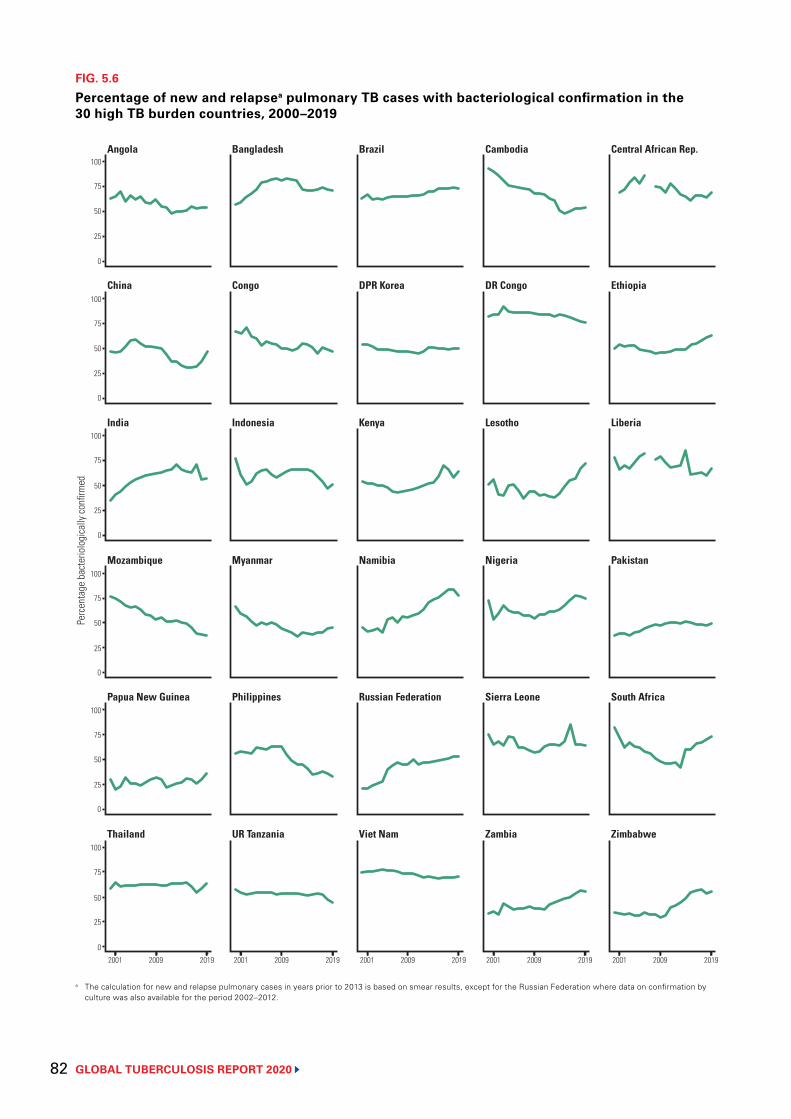
GLOBAL TUBERCULOSIS REPORT 2020 82
FIG. 5.6
Percentage of new and relapsea pulmonary TB cases with bacteriological confirmation in the 30 high TB burden countries, 2000–2019
a The calculation for new and relapse pulmonary cases in years prior to 2013 is based on smear results, except for the Russian Federation where data on confirmation by culture was also available for the period 2002–2012.
0
25
50
75
Per
cent
age
bact
erio
logi
cally
confi
rmed
100
2001 2009 2019 2001 2009 2019 2001 2009 2019 2001 2009 2019 2001 2009 2019
0
25
50
75
100
0
25
50
75
100
0
25
50
75
100
0
25
50
75
100
0
25
50
75
100
Year
Thailand UR Tanzania Viet Nam Zambia Zimbabwe
Papua New Guinea Philippines Russian Federation Sierra Leone South Africa
India Indonesia Kenya Lesotho Liberia
China Congo DPR Korea DR Congo Ethiopia
Angola Bangladesh Brazil Cambodia Central African Rep.
Mozambique Myanmar Namibia PakistanNigeria
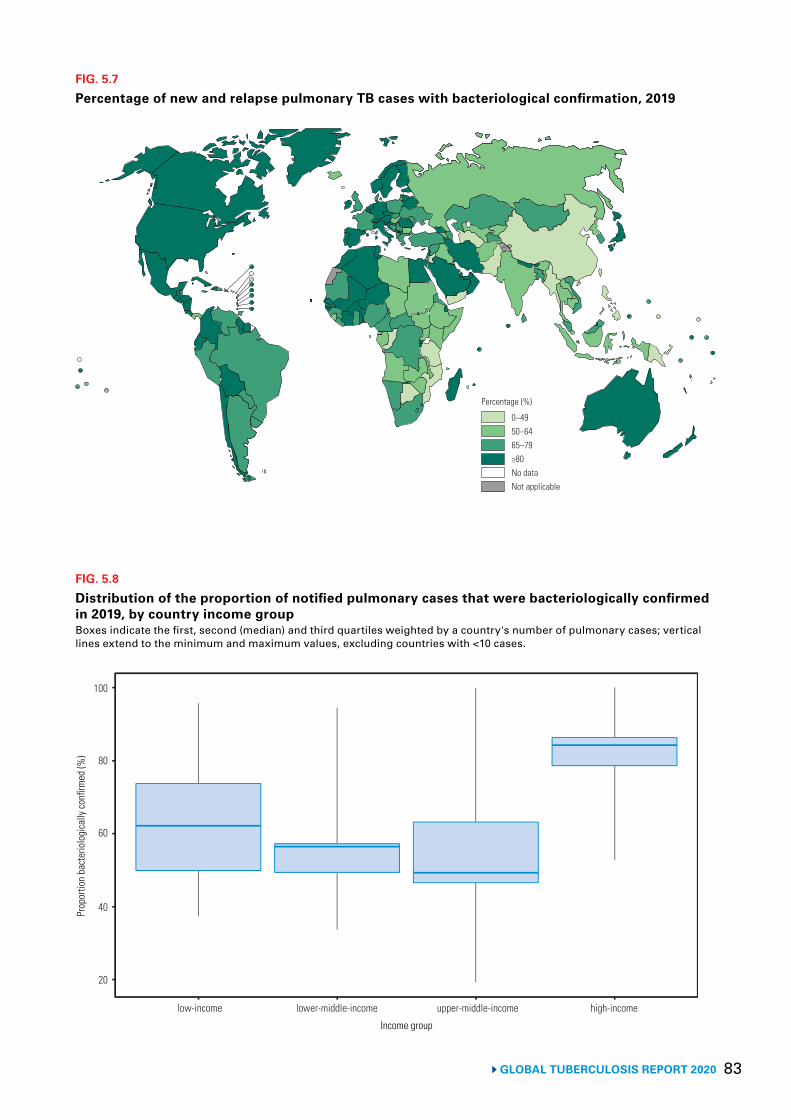
83 GLOBAL TUBERCULOSIS REPORT 2020
FIG. 5.7
Percentage of new and relapse pulmonary TB cases with bacteriological confirmation, 2019
0–4950–6465–79≥80No dataNot applicable
Percentage (%)
FIG. 5.8
Distribution of the proportion of notified pulmonary cases that were bacteriologically confirmed in 2019, by country income groupBoxes indicate the first, second (median) and third quartiles weighted by a country's number of pulmonary cases; vertical lines extend to the minimum and maximum values, excluding countries with <10 cases.
20
40Prop
ortio
n ba
cter
iolo
gica
lly co
nfirm
ed (%
)
Income group
low-income lower-middle-income upper-middle-income high-income
60
80
100
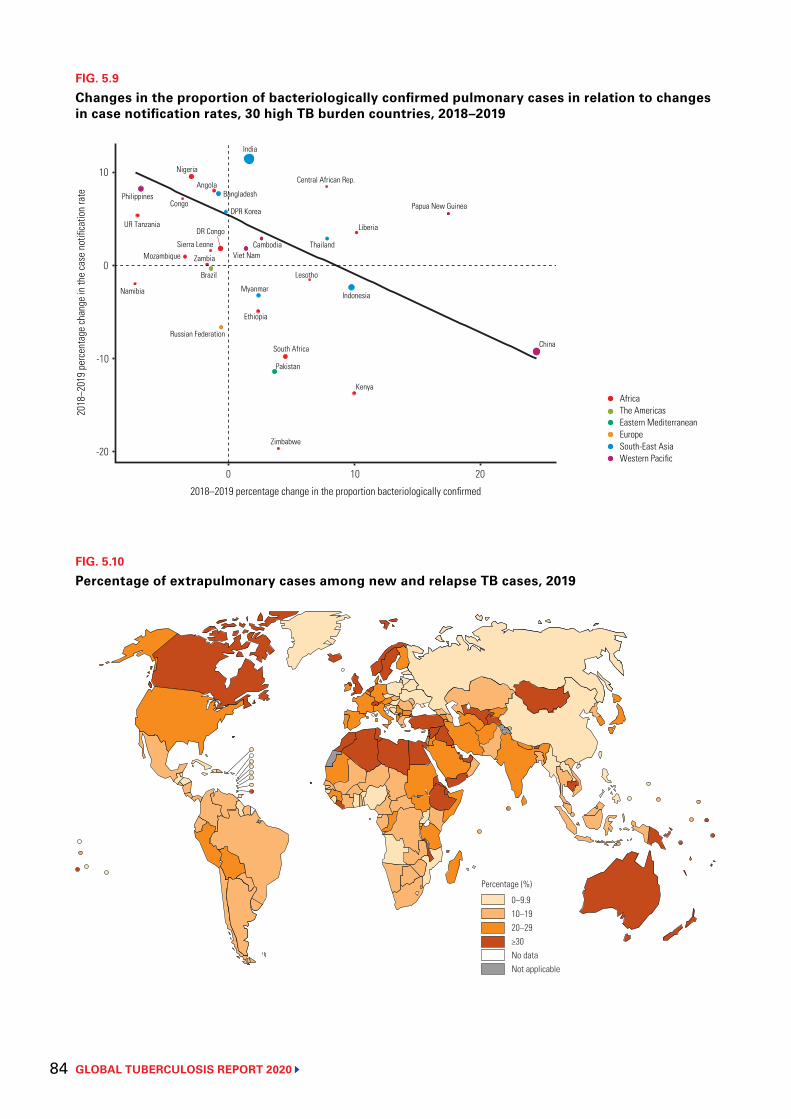
GLOBAL TUBERCULOSIS REPORT 2020 84
FIG. 5.9
Changes in the proportion of bacteriologically confirmed pulmonary cases in relation to changes in case notification rates, 30 high TB burden countries, 2018–2019
AngolaBangladesh
Brazil
Central African Rep.
China
DR Congo
Congo
Ethiopia
Indonesia
India
Kenya
Cambodia
Liberia
Lesotho
Myanmar
Mozambique
Namibia
Nigeria
Pakistan
PhilippinesPapua New Guinea
DPR Korea
Russian Federation
Sierra Leone Thailand
UR Tanzania
Viet Nam
South Africa
Zambia
Zimbabwe
AfricaThe AmericasEastern Mediterranean Europe South-East Asia Western Pacific
-20
-10
2018
–201
9 pe
rcen
tage
chan
ge in
the
case
not
ifica
tion
rate
2018–2019 percentage change in the proportion bacteriologically confirmed
0 10 20
0
10
FIG. 5.10
Percentage of extrapulmonary cases among new and relapse TB cases, 2019
0–9.910–1920–29≥30No dataNot applicable
Percentage (%)
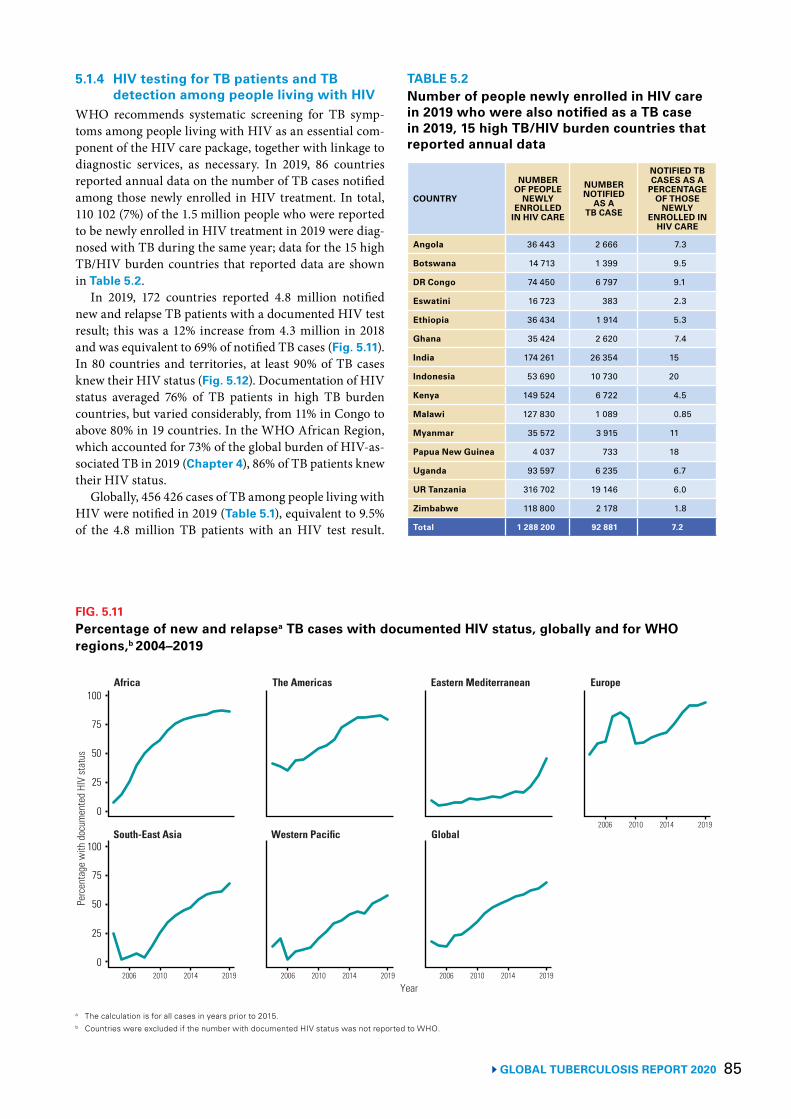
85GLOBAL TUBERCULOSIS REPORT 2020
5.1.4 HIV testing for TB patients and TB detection among people living with HIV
WHO recommends systematic screening for TB symp-toms among people living with HIV as an essential com-ponent of the HIV care package, together with linkage to diagnostic services, as necessary. In 2019, 86 countries reported annual data on the number of TB cases notified among those newly enrolled in HIV treatment. In total, 110 102 (7%) of the 1.5 million people who were reported to be newly enrolled in HIV treatment in 2019 were diag-nosed with TB during the same year; data for the 15 high TB/HIV burden countries that reported data are shown in Table 5.2.
In 2019, 172 countries reported 4.8 million notified new and relapse TB patients with a documented HIV test result; this was a 12% increase from 4.3 million in 2018 and was equivalent to 69% of notified TB cases (Fig. 5.11). In 80 countries and territories, at least 90% of TB cases knew their HIV status (Fig. 5.12). Documentation of HIV status averaged 76% of TB patients in high TB burden countries, but varied considerably, from 11% in Congo to above 80% in 19 countries. In the WHO African Region, which accounted for 73% of the global burden of HIV-as-sociated TB in 2019 (Chapter 4), 86% of TB patients knew their HIV status.
Globally, 456 426 cases of TB among people living with HIV were notified in 2019 (Table 5.1), equivalent to 9.5% of the 4.8 million TB patients with an HIV test result.
TABLE 5.2Number of people newly enrolled in HIV care in 2019 who were also notified as a TB case in 2019, 15 high TB/HIV burden countries that reported annual data
COUNTRY
NUMBER OF PEOPLE
NEWLY ENROLLED
IN HIV CARE
NUMBER NOTIFIED
AS A TB CASE
NOTIFIED TB CASES AS A
PERCENTAGE OF THOSE
NEWLY ENROLLED IN
HIV CARE
Angola 36 443 2 666 7.3
Botswana 14 713 1 399 9.5
DR Congo 74 450 6 797 9.1
Eswatini 16 723 383 2.3
Ethiopia 36 434 1 914 5.3
Ghana 35 424 2 620 7.4
India 174 261 26 354 15
Indonesia 53 690 10 730 20
Kenya 149 524 6 722 4.5
Malawi 127 830 1 089 0.85
Myanmar 35 572 3 915 11
Papua New Guinea 4 037 733 18
Uganda 93 597 6 235 6.7
UR Tanzania 316 702 19 146 6.0
Zimbabwe 118 800 2 178 1.8
Total 1 288 200 92 881 7.2
FIG. 5.11Percentage of new and relapsea TB cases with documented HIV status, globally and for WHO regions,b 2004–2019
a The calculation is for all cases in years prior to 2015.b Countries were excluded if the number with documented HIV status was not reported to WHO.
Per
cent
age
with
doc
umen
ted
HIV
stat
us
Africa The Americas Eastern Mediterranean Europe
Year
South-East Asia Western Pacific Global
100
75
50
25
0
100
75
50
25
0
2006 2010 2014 2019
2006 2010 2014 20192006 2010 2014 2019 2006 2010 2014 2019
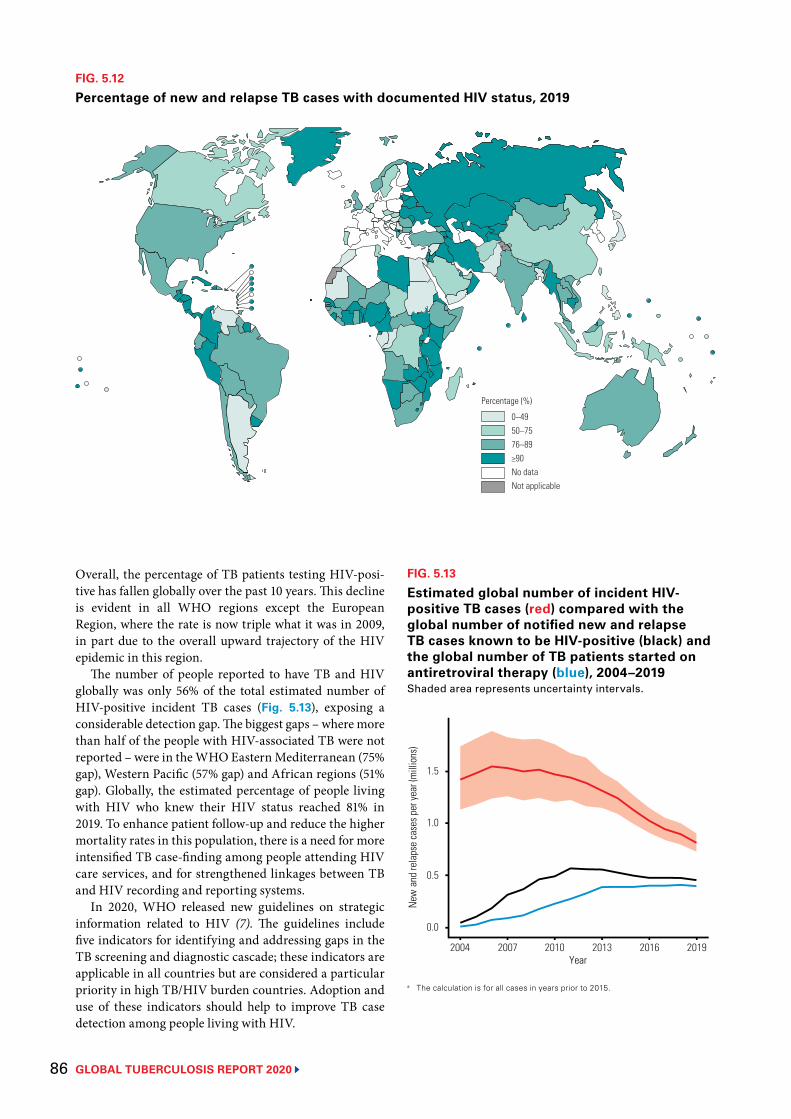
GLOBAL TUBERCULOSIS REPORT 2020 86
FIG. 5.12
Percentage of new and relapse TB cases with documented HIV status, 2019
0–4950–7576–89≥90No dataNot applicable
Percentage (%)
Overall, the percentage of TB patients testing HIV-posi-tive has fallen globally over the past 10 years. This decline is evident in all WHO regions except the European Region, where the rate is now triple what it was in 2009, in part due to the overall upward trajectory of the HIV epidemic in this region.
The number of people reported to have TB and HIV globally was only 56% of the total estimated number of HIV-positive incident TB cases (Fig. 5.13), exposing a considerable detection gap. The biggest gaps – where more than half of the people with HIV-associated TB were not reported – were in the WHO Eastern Mediterranean (75% gap), Western Pacific (57% gap) and African regions (51% gap). Globally, the estimated percentage of people living with HIV who knew their HIV status reached 81% in 2019. To enhance patient follow-up and reduce the higher mortality rates in this population, there is a need for more intensified TB case-finding among people attending HIV care services, and for strengthened linkages between TB and HIV recording and reporting systems.
In 2020, WHO released new guidelines on strategic information related to HIV (7). The guidelines include five indicators for identifying and addressing gaps in the TB screening and diagnostic cascade; these indicators are applicable in all countries but are considered a particular priority in high TB/HIV burden countries. Adoption and use of these indicators should help to improve TB case detection among people living with HIV.
FIG. 5.13
Estimated global number of incident HIV-positive TB cases (red) compared with the global number of notified new and relapse TB cases known to be HIV-positive (black) and the global number of TB patients started on antiretroviral therapy (blue), 2004–2019Shaded area represents uncertainty intervals.
New
and
rela
pse
case
s per
year
(mill
ions
)
0.5
1.5
2004 2007 2010 2013 2016 2019
1.0
0.0
Year
a The calculation is for all cases in years prior to 2015.
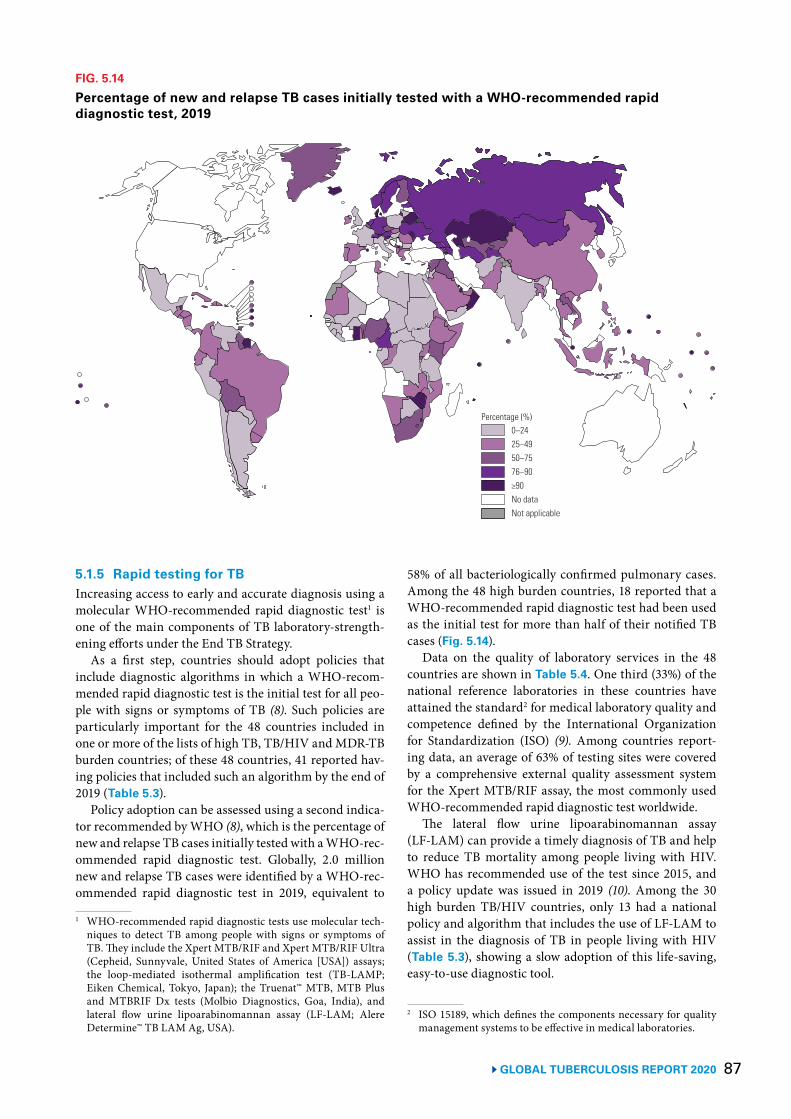
87 GLOBAL TUBERCULOSIS REPORT 2020
5.1.5 Rapid testing for TBIncreasing access to early and accurate diagnosis using a molecular WHO-recommended rapid diagnostic test1 is one of the main components of TB laboratory-strength-ening efforts under the End TB Strategy.
As a first step, countries should adopt policies that include diagnostic algorithms in which a WHO-recom-mended rapid diagnostic test is the initial test for all peo-ple with signs or symptoms of TB (8). Such policies are particularly important for the 48 countries included in one or more of the lists of high TB, TB/HIV and MDR-TB burden countries; of these 48 countries, 41 reported hav-ing policies that included such an algorithm by the end of 2019 (Table 5.3).
Policy adoption can be assessed using a second indica-tor recommended by WHO (8), which is the percentage of new and relapse TB cases initially tested with a WHO-rec-ommended rapid diagnostic test. Globally, 2.0 million new and relapse TB cases were identified by a WHO-rec-ommended rapid diagnostic test in 2019, equivalent to
1 WHO-recommended rapid diagnostic tests use molecular tech-niques to detect TB among people with signs or symptoms of TB. They include the Xpert MTB/RIF and Xpert MTB/RIF Ultra (Cepheid, Sunnyvale, United States of America [USA]) assays; the loop-mediated isothermal amplification test (TB-LAMP; Eiken Chemical, Tokyo, Japan); the Truenat™ MTB, MTB Plus and MTBRIF Dx tests (Molbio Diagnostics, Goa, India), and lateral flow urine lipoarabinomannan assay (LF-LAM; Alere Determine™ TB LAM Ag, USA).
58% of all bacteriologically confirmed pulmonary cases. Among the 48 high burden countries, 18 reported that a WHO-recommended rapid diagnostic test had been used as the initial test for more than half of their notified TB cases (Fig. 5.14).
Data on the quality of laboratory services in the 48 countries are shown in Table 5.4. One third (33%) of the national reference laboratories in these countries have attained the standard2 for medical laboratory quality and competence defined by the International Organization for Standardization (ISO) (9). Among countries report-ing data, an average of 63% of testing sites were covered by a comprehensive external quality assessment system for the Xpert MTB/RIF assay, the most commonly used WHO-recommended rapid diagnostic test worldwide.
The lateral flow urine lipoarabinomannan assay (LF-LAM) can provide a timely diagnosis of TB and help to reduce TB mortality among people living with HIV. WHO has recommended use of the test since 2015, and a policy update was issued in 2019 (10). Among the 30 high burden TB/HIV countries, only 13 had a national policy and algorithm that includes the use of LF-LAM to assist in the diagnosis of TB in people living with HIV (Table 5.3), showing a slow adoption of this life-saving, easy-to-use diagnostic tool.
2 ISO 15189, which defines the components necessary for quality management systems to be effective in medical laboratories.
FIG. 5.14
Percentage of new and relapse TB cases initially tested with a WHO-recommended rapid diagnostic test, 2019
0–2425–4950–7576–90≥90No dataNot applicable
Percentage (%)
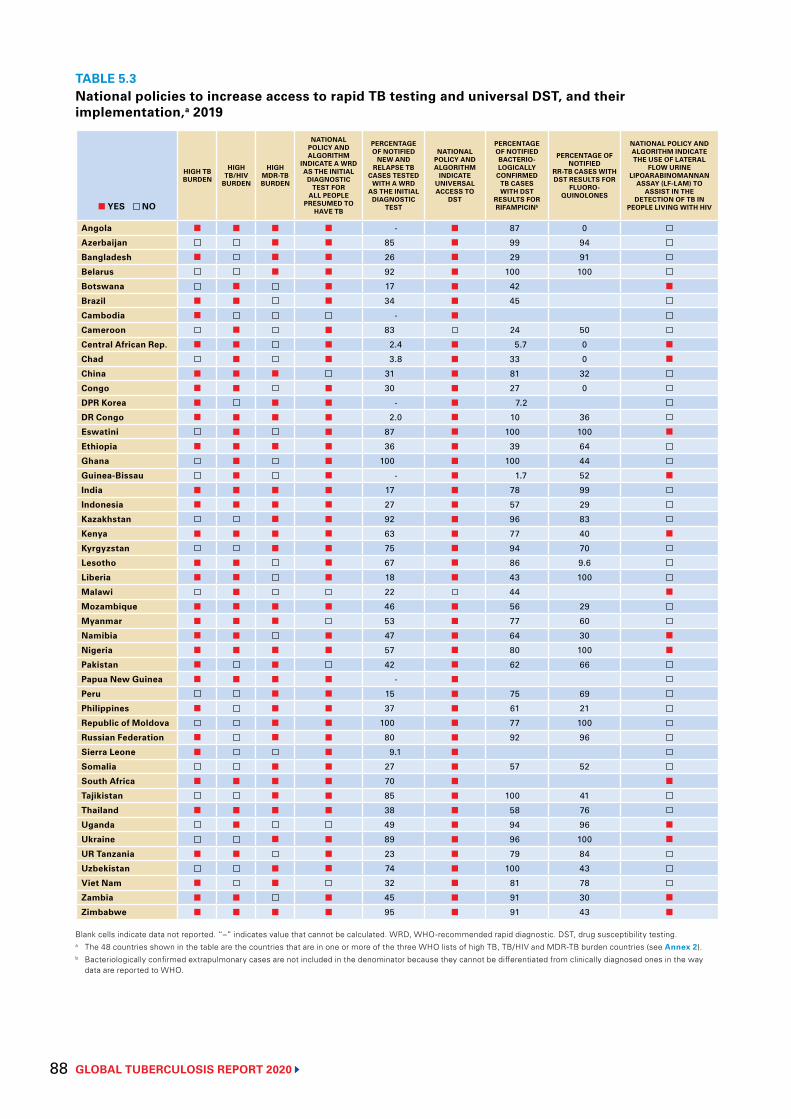
GLOBAL TUBERCULOSIS REPORT 2020 88
TABLE 5.3National policies to increase access to rapid TB testing and universal DST, and their implementation,a 2019
■ YES NO
HIGH TB BURDEN
HIGH TB/HIV
BURDEN
HIGH MDR-TB BURDEN
NATIONAL POLICY AND ALGORITHM
INDICATE A WRD AS THE INITIAL
DIAGNOSTIC TEST FOR
ALL PEOPLE PRESUMED TO
HAVE TB
PERCENTAGE OF NOTIFIED
NEW AND RELAPSE TB
CASES TESTED WITH A WRD
AS THE INITIAL DIAGNOSTIC
TEST
NATIONAL POLICY AND ALGORITHM
INDICATE UNIVERSAL ACCESS TO
DST
PERCENTAGE OF NOTIFIED BACTERIO-LOGICALLY
CONFIRMED TB CASES WITH DST
RESULTS FOR RIFAMPICINb
PERCENTAGE OF NOTIFIED
RR-TB CASES WITH DST RESULTS FOR
FLUORO- QUINOLONES
NATIONAL POLICY AND ALGORITHM INDICATE THE USE OF LATERAL
FLOW URINE LIPOARABINOMANNAN
ASSAY (LF-LAM) TO ASSIST IN THE
DETECTION OF TB IN PEOPLE LIVING WITH HIV
Angola ■ ■ ■ ■ - ■ 87 0
Azerbaijan ■ ■ 85 ■ 99 94
Bangladesh ■ ■ ■ 26 ■ 29 91
Belarus ■ ■ 92 ■ 100 100
Botswana ■ ■ 17 ■ 42 ■
Brazil ■ ■ ■ 34 ■ 45
Cambodia ■ - ■
Cameroon ■ ■ 83 24 50
Central African Rep. ■ ■ ■ 2.4 ■ 5.7 0 ■
Chad ■ ■ 3.8 ■ 33 0 ■
China ■ ■ ■ 31 ■ 81 32
Congo ■ ■ ■ 30 ■ 27 0
DPR Korea ■ ■ ■ - ■ 7.2
DR Congo ■ ■ ■ ■ 2.0 ■ 10 36
Eswatini ■ ■ 87 ■ 100 100 ■
Ethiopia ■ ■ ■ ■ 36 ■ 39 64
Ghana ■ ■ 100 ■ 100 44
Guinea-Bissau ■ ■ - ■ 1.7 52 ■
India ■ ■ ■ ■ 17 ■ 78 99
Indonesia ■ ■ ■ ■ 27 ■ 57 29
Kazakhstan ■ ■ 92 ■ 96 83
Kenya ■ ■ ■ ■ 63 ■ 77 40 ■
Kyrgyzstan ■ ■ 75 ■ 94 70
Lesotho ■ ■ ■ 67 ■ 86 9.6
Liberia ■ ■ ■ 18 ■ 43 100
Malawi ■ 22 44 ■
Mozambique ■ ■ ■ ■ 46 ■ 56 29
Myanmar ■ ■ ■ 53 ■ 77 60
Namibia ■ ■ ■ 47 ■ 64 30 ■
Nigeria ■ ■ ■ ■ 57 ■ 80 100 ■
Pakistan ■ ■ 42 ■ 62 66
Papua New Guinea ■ ■ ■ ■ - ■
Peru ■ ■ 15 ■ 75 69
Philippines ■ ■ ■ 37 ■ 61 21
Republic of Moldova ■ ■ 100 ■ 77 100
Russian Federation ■ ■ ■ 80 ■ 92 96
Sierra Leone ■ ■ 9.1 ■
Somalia ■ ■ 27 ■ 57 52
South Africa ■ ■ ■ ■ 70 ■ ■
Tajikistan ■ ■ 85 ■ 100 41
Thailand ■ ■ ■ ■ 38 ■ 58 76
Uganda ■ 49 ■ 94 96 ■
Ukraine ■ ■ 89 ■ 96 100 ■
UR Tanzania ■ ■ ■ 23 ■ 79 84
Uzbekistan ■ ■ 74 ■ 100 43
Viet Nam ■ ■ 32 ■ 81 78
Zambia ■ ■ ■ 45 ■ 91 30 ■
Zimbabwe ■ ■ ■ ■ 95 ■ 91 43 ■
Blank cells indicate data not reported. “–” indicates value that cannot be calculated. WRD, WHO-recommended rapid diagnostic. DST, drug susceptibility testing.a The 48 countries shown in the table are the countries that are in one or more of the three WHO lists of high TB, TB/HIV and MDR-TB burden countries (see Annex 2).b Bacteriologically confirmed extrapulmonary cases are not included in the denominator because they cannot be differentiated from clinically diagnosed ones in the way
data are reported to WHO.
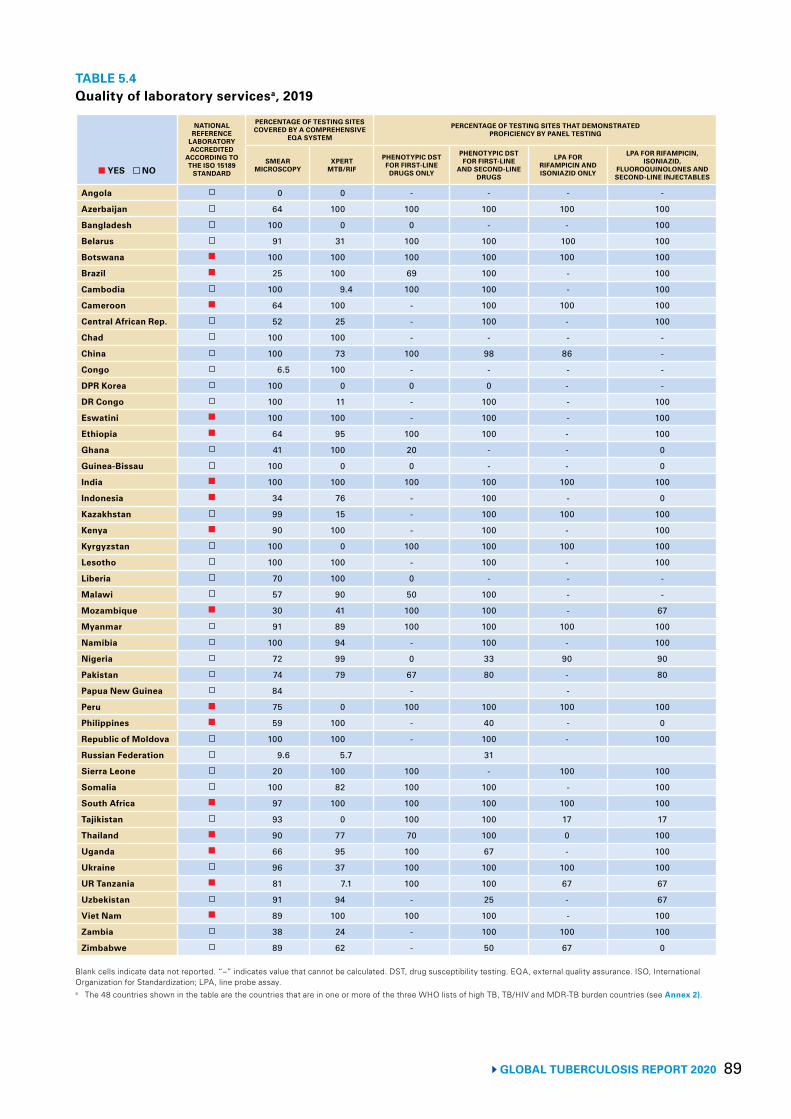
89 GLOBAL TUBERCULOSIS REPORT 2020
TABLE 5.4Quality of laboratory servicesa, 2019
■ YES NO
NATIONAL REFERENCE
LABORATORY ACCREDITED
ACCORDING TO THE ISO 15189
STANDARD
PERCENTAGE OF TESTING SITES COVERED BY A COMPREHENSIVE
EQA SYSTEM
PERCENTAGE OF TESTING SITES THAT DEMONSTRATED PROFICIENCY BY PANEL TESTING
SMEAR MICROSCOPY
XPERT MTB/RIF
PHENOTYPIC DST FOR FIRST-LINE
DRUGS ONLY
PHENOTYPIC DST FOR FIRST-LINE
AND SECOND-LINE DRUGS
LPA FOR RIFAMPICIN AND ISONIAZID ONLY
LPA FOR RIFAMPICIN, ISONIAZID,
FLUOROQUINOLONES AND SECOND-LINE INJECTABLES
Angola 0 0 - - - -
Azerbaijan 64 100 100 100 100 100
Bangladesh 100 0 0 - - 100
Belarus 91 31 100 100 100 100
Botswana ■ 100 100 100 100 100 100
Brazil ■ 25 100 69 100 - 100
Cambodia 100 9.4 100 100 - 100
Cameroon ■ 64 100 - 100 100 100
Central African Rep. 52 25 - 100 - 100
Chad 100 100 - - - -
China 100 73 100 98 86 -
Congo 6.5 100 - - - -
DPR Korea 100 0 0 0 - -
DR Congo 100 11 - 100 - 100
Eswatini ■ 100 100 - 100 - 100
Ethiopia ■ 64 95 100 100 - 100
Ghana 41 100 20 - - 0
Guinea-Bissau 100 0 0 - - 0
India ■ 100 100 100 100 100 100
Indonesia ■ 34 76 - 100 - 0
Kazakhstan 99 15 - 100 100 100
Kenya ■ 90 100 - 100 - 100
Kyrgyzstan 100 0 100 100 100 100
Lesotho 100 100 - 100 - 100
Liberia 70 100 0 - - -
Malawi 57 90 50 100 - -
Mozambique ■ 30 41 100 100 - 67
Myanmar 91 89 100 100 100 100
Namibia 100 94 - 100 - 100
Nigeria 72 99 0 33 90 90
Pakistan 74 79 67 80 - 80
Papua New Guinea 84 - -
Peru ■ 75 0 100 100 100 100
Philippines ■ 59 100 - 40 - 0
Republic of Moldova 100 100 - 100 - 100
Russian Federation 9.6 5.7 31
Sierra Leone 20 100 100 - 100 100
Somalia 100 82 100 100 - 100
South Africa ■ 97 100 100 100 100 100
Tajikistan 93 0 100 100 17 17
Thailand ■ 90 77 70 100 0 100
Uganda ■ 66 95 100 67 - 100
Ukraine 96 37 100 100 100 100
UR Tanzania ■ 81 7.1 100 100 67 67
Uzbekistan 91 94 - 25 - 67
Viet Nam ■ 89 100 100 100 - 100
Zambia 38 24 - 100 100 100
Zimbabwe 89 62 - 50 67 0
Blank cells indicate data not reported. “–” indicates value that cannot be calculated. DST, drug susceptibility testing. EQA, external quality assurance. ISO, International Organization for Standardization; LPA, line probe assay.a The 48 countries shown in the table are the countries that are in one or more of the three WHO lists of high TB, TB/HIV and MDR-TB burden countries (see Annex 2).
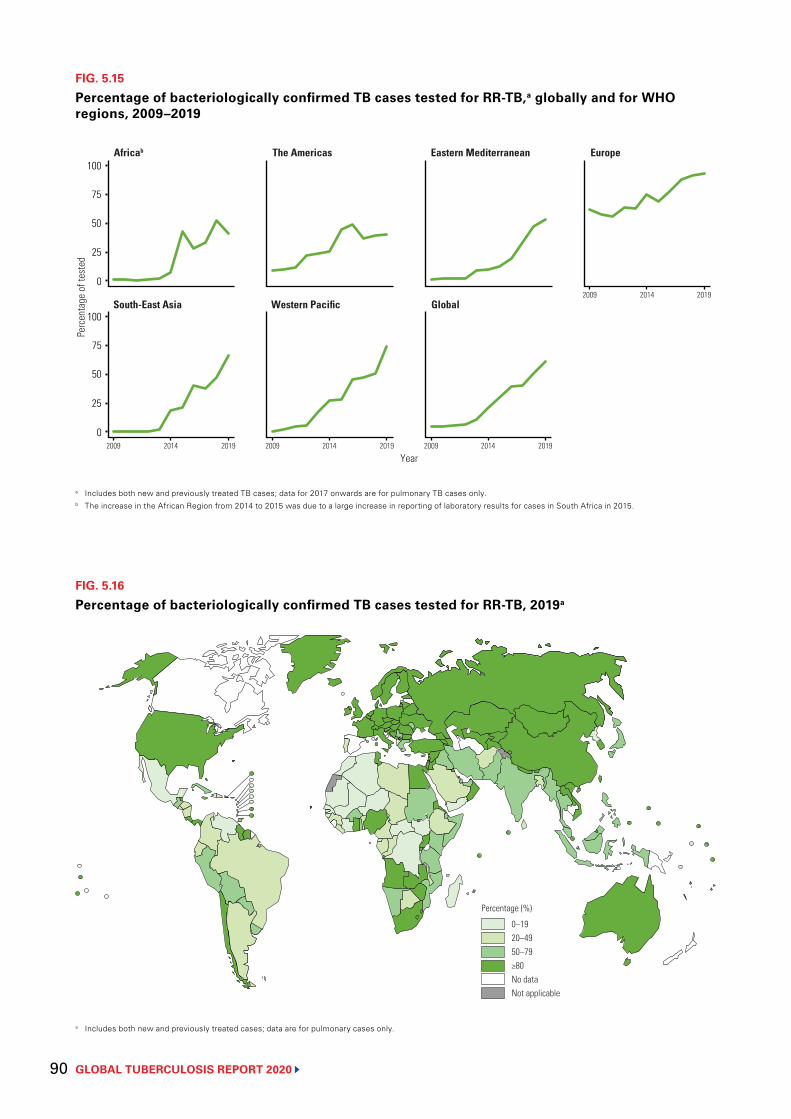
GLOBAL TUBERCULOSIS REPORT 2020 90
FIG. 5.16
Percentage of bacteriologically confirmed TB cases tested for RR-TB, 2019a
0–1920–4950–79≥80No dataNot applicable
Percentage (%)
a Includes both new and previously treated cases; data are for pulmonary cases only.
FIG. 5.15
Percentage of bacteriologically confirmed TB cases tested for RR-TB,a globally and for WHO regions, 2009–2019
a Includes both new and previously treated TB cases; data for 2017 onwards are for pulmonary TB cases only.b The increase in the African Region from 2014 to 2015 was due to a large increase in reporting of laboratory results for cases in South Africa in 2015.
Per
cent
age
of te
sted
Africab The Americas Eastern Mediterranean Europe
Year
South-East Asia Western Pacific Global
100
75
50
25
0
100
75
50
25
0
2009 2014 2019
2009 2014 2019 2009 2014 2019 2009 2014 2019
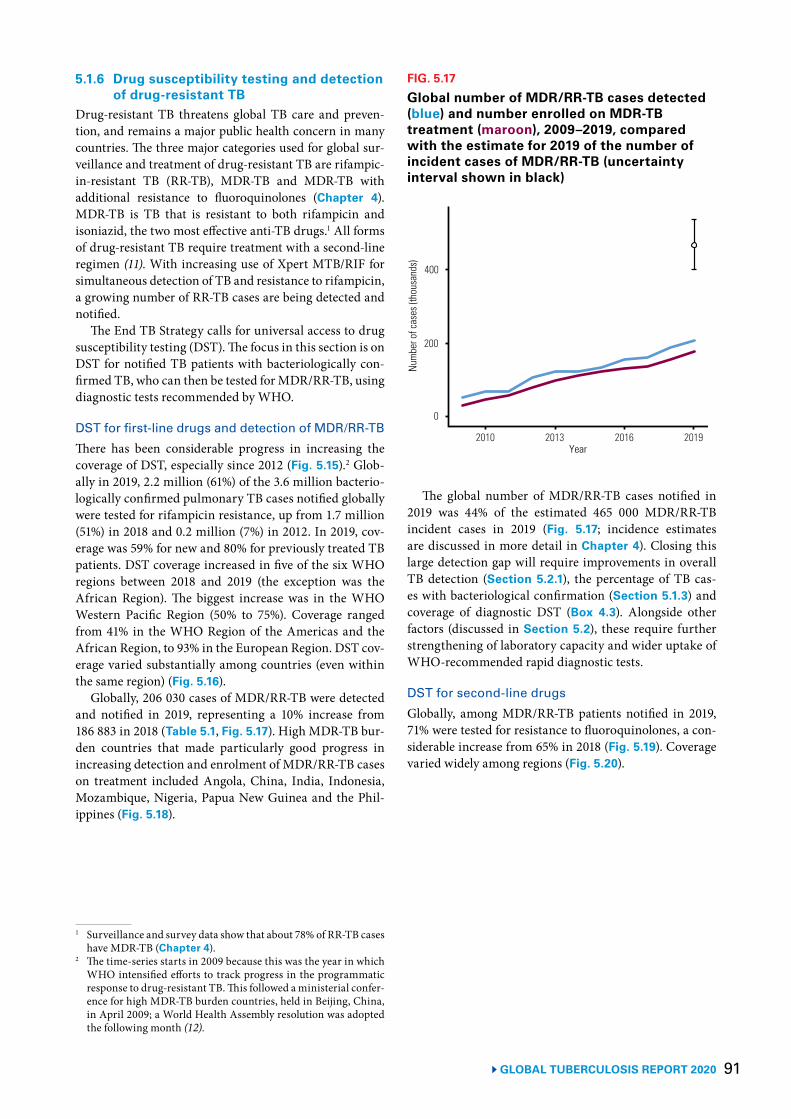
91 GLOBAL TUBERCULOSIS REPORT 2020
5.1.6 Drug susceptibility testing and detection of drug-resistant TB
Drug-resistant TB threatens global TB care and preven-tion, and remains a major public health concern in many countries. The three major categories used for global sur-veillance and treatment of drug-resistant TB are rifampic-in-resistant TB (RR-TB), MDR-TB and MDR-TB with additional resistance to fluoroquinolones (Chapter 4). MDR-TB is TB that is resistant to both rifampicin and isoniazid, the two most effective anti-TB drugs.1 All forms of drug-resistant TB require treatment with a second-line regimen (11). With increasing use of Xpert MTB/RIF for simultaneous detection of TB and resistance to rifampicin, a growing number of RR-TB cases are being detected and notified.
The End TB Strategy calls for universal access to drug susceptibility testing (DST). The focus in this section is on DST for notified TB patients with bacteriologically con-firmed TB, who can then be tested for MDR/RR-TB, using diagnostic tests recommended by WHO.
DST for first-line drugs and detection of MDR/RR-TBThere has been considerable progress in increasing the coverage of DST, especially since 2012 (Fig. 5.15).2 Glob-ally in 2019, 2.2 million (61%) of the 3.6 million bacterio-logically confirmed pulmonary TB cases notified globally were tested for rifampicin resistance, up from 1.7 million (51%) in 2018 and 0.2 million (7%) in 2012. In 2019, cov-erage was 59% for new and 80% for previously treated TB patients. DST coverage increased in five of the six WHO regions between 2018 and 2019 (the exception was the African Region). The biggest increase was in the WHO Western Pacific Region (50% to 75%). Coverage ranged from 41% in the WHO Region of the Americas and the African Region, to 93% in the European Region. DST cov-erage varied substantially among countries (even within the same region) (Fig. 5.16).
Globally, 206 030 cases of MDR/RR-TB were detected and notified in 2019, representing a 10% increase from 186 883 in 2018 (Table 5.1, Fig. 5.17). High MDR-TB bur-den countries that made particularly good progress in increasing detection and enrolment of MDR/RR-TB cases on treatment included Angola, China, India, Indonesia, Mozambique, Nigeria, Papua New Guinea and the Phil-ippines (Fig. 5.18).
1 Surveillance and survey data show that about 78% of RR-TB cases have MDR-TB (Chapter 4).
2 The time-series starts in 2009 because this was the year in which WHO intensified efforts to track progress in the programmatic response to drug-resistant TB. This followed a ministerial confer-ence for high MDR-TB burden countries, held in Beijing, China, in April 2009; a World Health Assembly resolution was adopted the following month (12).
The global number of MDR/RR-TB cases notified in 2019 was 44% of the estimated 465 000 MDR/RR-TB incident cases in 2019 (Fig. 5.17; incidence estimates are discussed in more detail in Chapter 4). Closing this large detection gap will require improvements in overall TB detection (Section 5.2.1), the percentage of TB cas-es with bacteriological confirmation (Section 5.1.3) and coverage of diagnostic DST (Box 4.3). Alongside other factors (discussed in Section 5.2), these require further strengthening of laboratory capacity and wider uptake of WHO-recommended rapid diagnostic tests.
DST for second-line drugs Globally, among MDR/RR-TB patients notified in 2019, 71% were tested for resistance to fluoroquinolones, a con-siderable increase from 65% in 2018 (Fig. 5.19). Coverage varied widely among regions (Fig. 5.20).
FIG. 5.17
Global number of MDR/RR-TB cases detected (blue) and number enrolled on MDR-TB treatment (maroon), 2009–2019, compared with the estimate for 2019 of the number of incident cases of MDR/RR-TB (uncertainty interval shown in black)
Num
ber o
f cas
es (t
hous
ands
)
200
400
0
Year 2010 2013 2016 2019
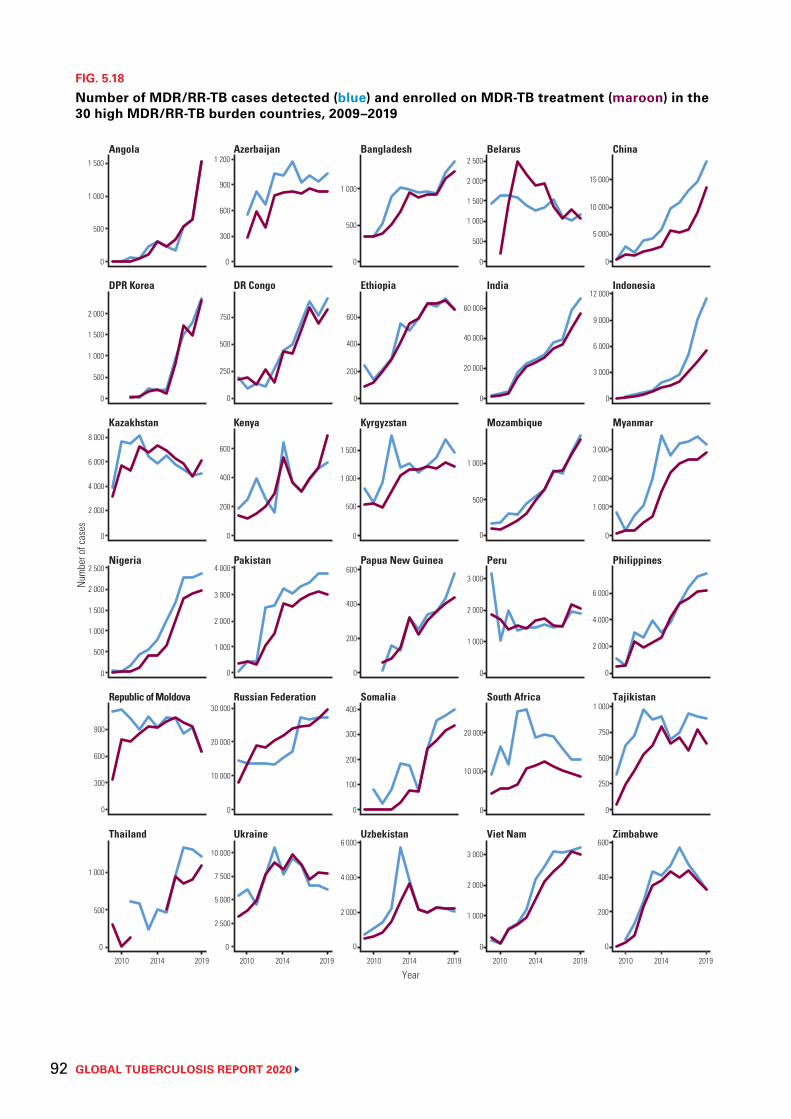
GLOBAL TUBERCULOSIS REPORT 2020 92
FIG. 5.18
Number of MDR/RR-TB cases detected (blue) and enrolled on MDR-TB treatment (maroon) in the 30 high MDR/RR-TB burden countries, 2009–2019
0
1 000
1 500
0
2 000
0
8 000
0
0
300
600
900
0
500
1 000
Num
ber o
f cas
es
0
500
1 000
0
200
400
600
0
500
1 500
0
200
400
600
0
200
400
0
6 000
0
5 000
15 000
0
9 000
12 000
0
1 000
2 000
3 000
0
2 000
4 000
6 000
0
500
750
1 000
0
200
400
600
500
2 000
2 500
60 000
500
1 000
1 000
2 000
3 000
0
0
0
0
20 000
0
1 000
2 000
3 000
0
600
900
1 200
0
250
500
750
0
200
400
600
0
1 000
2 000
3 000
4 000
0
0
2 500
5 000
7 500
10 000
0
Year 2010 2014 2019 2010 2014 2019 2010 2014 2019 2010 2014 2019 2010 2014 2019
500
1 500
1 000
500
6 000
4 000
2 000
2 500
2 000
1 500
1 000
500
30 000
20 000
10 000
300
1 000
300
100
4 000
2 000
10 000
40 000
20 000
1 500
1 000
10 000
6 000
3 000
250
Thailand Ukraine Uzbekistan Viet Nam Zimbabwe
Republic of Moldova Russian Federation Somalia South Africa Tajikistan
Kazakhstan Kenya Kyrgyzstan Mozambique Myanmar
DPR Korea DR Congo Ethiopia India Indonesia
Angola Azerbaijan Bangladesh Belarus China
Nigeria Pakistan Papua New Guinea PhilippinesPeru
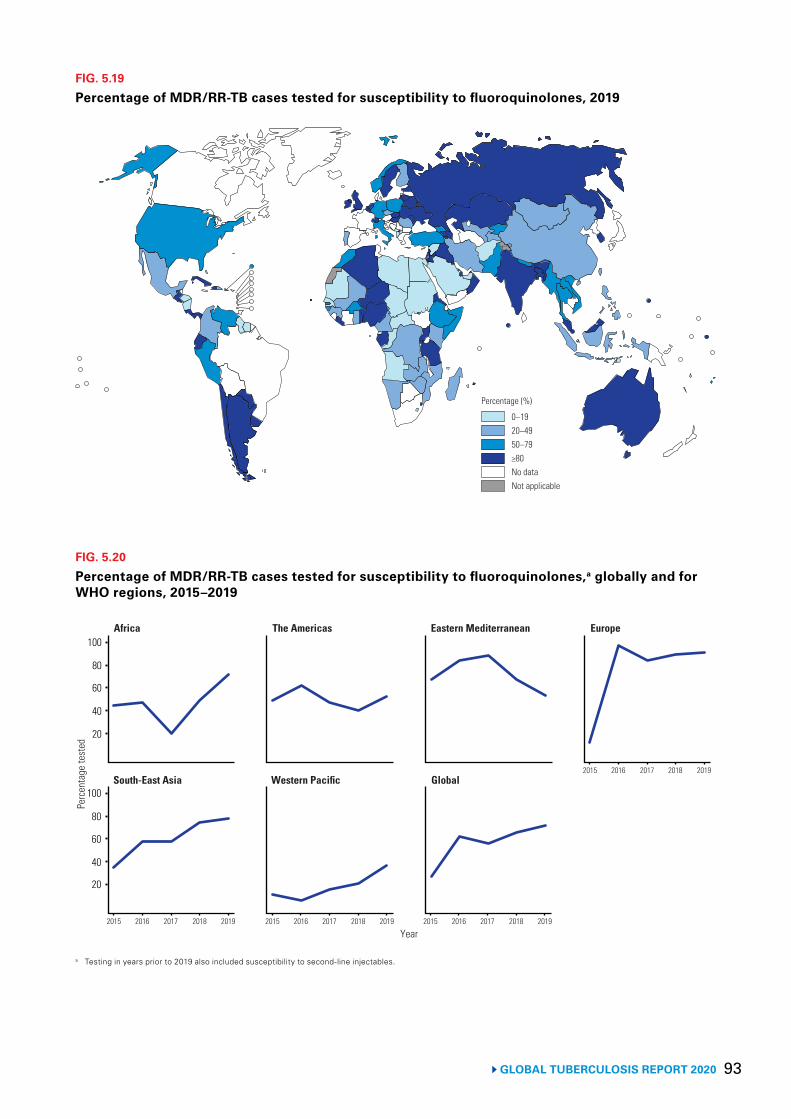
93 GLOBAL TUBERCULOSIS REPORT 2020
FIG. 5.19
Percentage of MDR/RR-TB cases tested for susceptibility to fluoroquinolones, 2019
0–1920–4950–79≥80No dataNot applicable
Percentage (%)
FIG. 5.20
Percentage of MDR/RR-TB cases tested for susceptibility to fluoroquinolones,a globally and for WHO regions, 2015–2019
a Testing in years prior to 2019 also included susceptibility to second-line injectables.
Per
cent
age
test
ed
Africa The Americas Eastern Mediterranean Europe
2015 2016 2017 2018 2019
Year
South-East Asia Western Pacific Global
100
60
40
20
100
80
40
20
2015 2016 2017 2018 2019 2015 2016 2017 2018 2019
2015 2016 2017 2018 2019
60
80
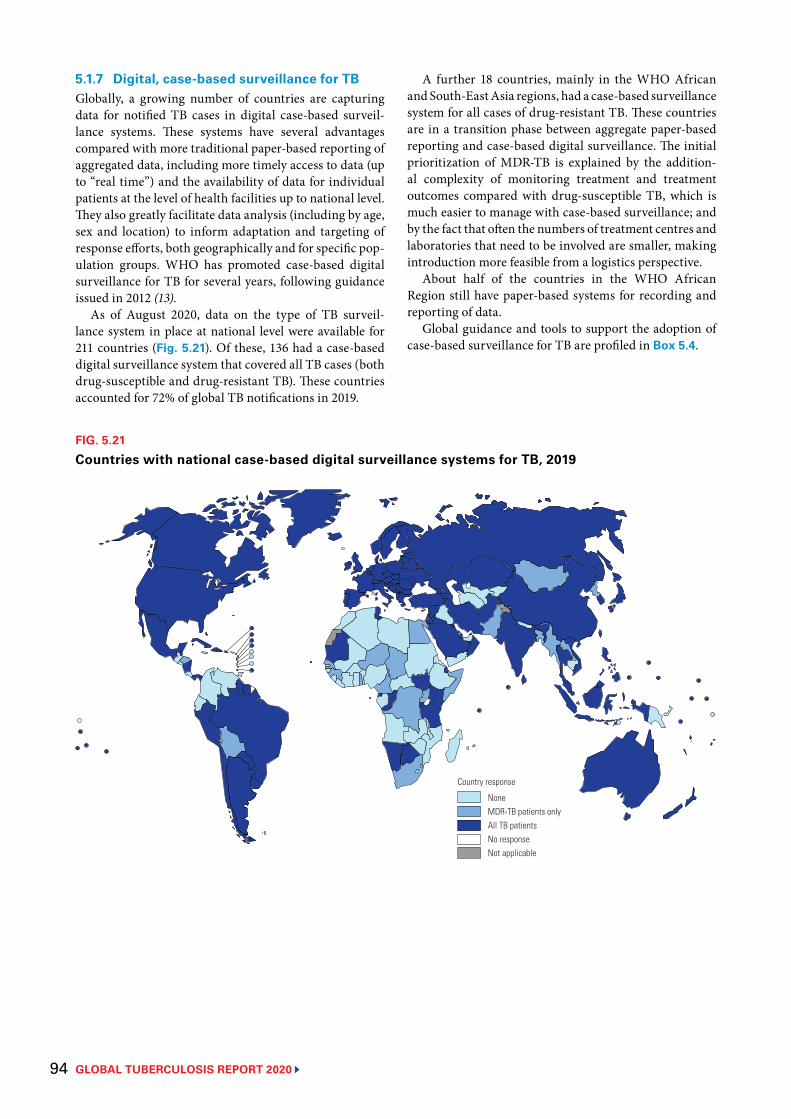
GLOBAL TUBERCULOSIS REPORT 2020 94
5.1.7 Digital, case-based surveillance for TBGlobally, a growing number of countries are capturing data for notified TB cases in digital case-based surveil-lance systems. These systems have several advantages compared with more traditional paper-based reporting of aggregated data, including more timely access to data (up to “real time”) and the availability of data for individual patients at the level of health facilities up to national level. They also greatly facilitate data analysis (including by age, sex and location) to inform adaptation and targeting of response efforts, both geographically and for specific pop-ulation groups. WHO has promoted case-based digital surveillance for TB for several years, following guidance issued in 2012 (13).
As of August 2020, data on the type of TB surveil-lance system in place at national level were available for 211 countries (Fig. 5.21). Of these, 136 had a case-based digital surveillance system that covered all TB cases (both drug-susceptible and drug-resistant TB). These countries accounted for 72% of global TB notifications in 2019.
FIG. 5.21
Countries with national case-based digital surveillance systems for TB, 2019
NoneMDR-TB patients onlyAll TB patientsNo responseNot applicable
Country response
A further 18 countries, mainly in the WHO African and South-East Asia regions, had a case-based surveillance system for all cases of drug-resistant TB. These countries are in a transition phase between aggregate paper-based reporting and case-based digital surveillance. The initial prioritization of MDR-TB is explained by the addition-al complexity of monitoring treatment and treatment outcomes compared with drug-susceptible TB, which is much easier to manage with case-based surveillance; and by the fact that often the numbers of treatment centres and laboratories that need to be involved are smaller, making introduction more feasible from a logistics perspective.
About half of the countries in the WHO African Region still have paper-based systems for recording and reporting of data.
Global guidance and tools to support the adoption of case-based surveillance for TB are profiled in Box 5.4.
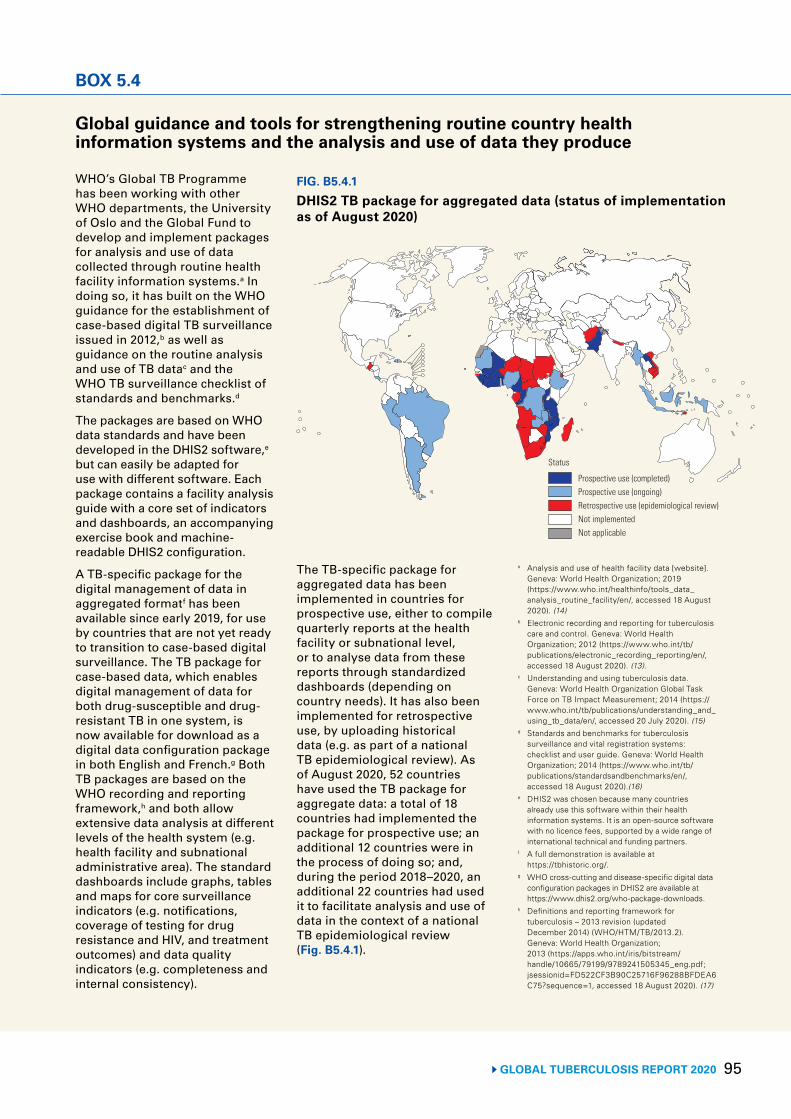
95GLOBAL TUBERCULOSIS REPORT 2020
BOX 5.4
Prospective use (completed)Prospective use (ongoing)Retrospective use (epidemiological review)Not implementedNot applicable
Status
Global guidance and tools for strengthening routine country health information systems and the analysis and use of data they produce
WHO’s Global TB Programme has been working with other WHO departments, the University of Oslo and the Global Fund to develop and implement packages for analysis and use of data collected through routine health facility information systems.a In doing so, it has built on the WHO guidance for the establishment of case-based digital TB surveillance issued in 2012,b as well as guidance on the routine analysis and use of TB datac and the WHO TB surveillance checklist of standards and benchmarks.d
The packages are based on WHO data standards and have been developed in the DHIS2 software,e but can easily be adapted for use with different software. Each package contains a facility analysis guide with a core set of indicators and dashboards, an accompanying exercise book and machine-readable DHIS2 configuration.
A TB-specific package for the digital management of data in aggregated formatf has been available since early 2019, for use by countries that are not yet ready to transition to case-based digital surveillance. The TB package for case-based data, which enables digital management of data for both drug-susceptible and drug-resistant TB in one system, is now available for download as a digital data configuration package in both English and French.g Both TB packages are based on the WHO recording and reporting framework,h and both allow extensive data analysis at different levels of the health system (e.g. health facility and subnational administrative area). The standard dashboards include graphs, tables and maps for core surveillance indicators (e.g. notifications, coverage of testing for drug resistance and HIV, and treatment outcomes) and data quality indicators (e.g. completeness and internal consistency).
The TB-specific package for aggregated data has been implemented in countries for prospective use, either to compile quarterly reports at the health facility or subnational level, or to analyse data from these reports through standardized dashboards (depending on country needs). It has also been implemented for retrospective use, by uploading historical data (e.g. as part of a national TB epidemiological review). As of August 2020, 52 countries have used the TB package for aggregate data: a total of 18 countries had implemented the package for prospective use; an additional 12 countries were in the process of doing so; and, during the period 2018–2020, an additional 22 countries had used it to facilitate analysis and use of data in the context of a national TB epidemiological review (Fig. B5.4.1).
a Analysis and use of health facility data [website]. Geneva: World Health Organization; 2019 (https://www.who.int/healthinfo/tools_data_analysis_routine_facility/en/, accessed 18 August 2020). (14)
b Electronic recording and reporting for tuberculosis care and control. Geneva: World Health Organization; 2012 (https://www.who.int/tb/publications/electronic_recording_reporting/en/, accessed 18 August 2020). (13).
c Understanding and using tuberculosis data. Geneva: World Health Organization Global Task Force on TB Impact Measurement; 2014 (https://www.who.int/tb/publications/understanding_and_using_tb_data/en/, accessed 20 July 2020). (15)
d Standards and benchmarks for tuberculosis surveillance and vital registration systems: checklist and user guide. Geneva: World Health Organization; 2014 (https://www.who.int/tb/publications/standardsandbenchmarks/en/, accessed 18 August 2020).(16)
e DHIS2 was chosen because many countries already use this software within their health information systems. It is an open-source software with no licence fees, supported by a wide range of international technical and funding partners.
f A full demonstration is available at https://tbhistoric.org/.
g WHO cross-cutting and disease-specific digital data configuration packages in DHIS2 are available at https://www.dhis2.org/who-package-downloads.
h Definitions and reporting framework for tuberculosis – 2013 revision (updated December 2014) (WHO/HTM/TB/2013.2). Geneva: World Health Organization; 2013 (https://apps.who.int/iris/bitstream/handle/10665/79199/9789241505345_eng.pdf; jsessionid=FD522CF3B90C25716F96288BFDEA6 C75?sequence=1, accessed 18 August 2020). (17)
FIG. B5.4.1
DHIS2 TB package for aggregated data (status of implementation as of August 2020)
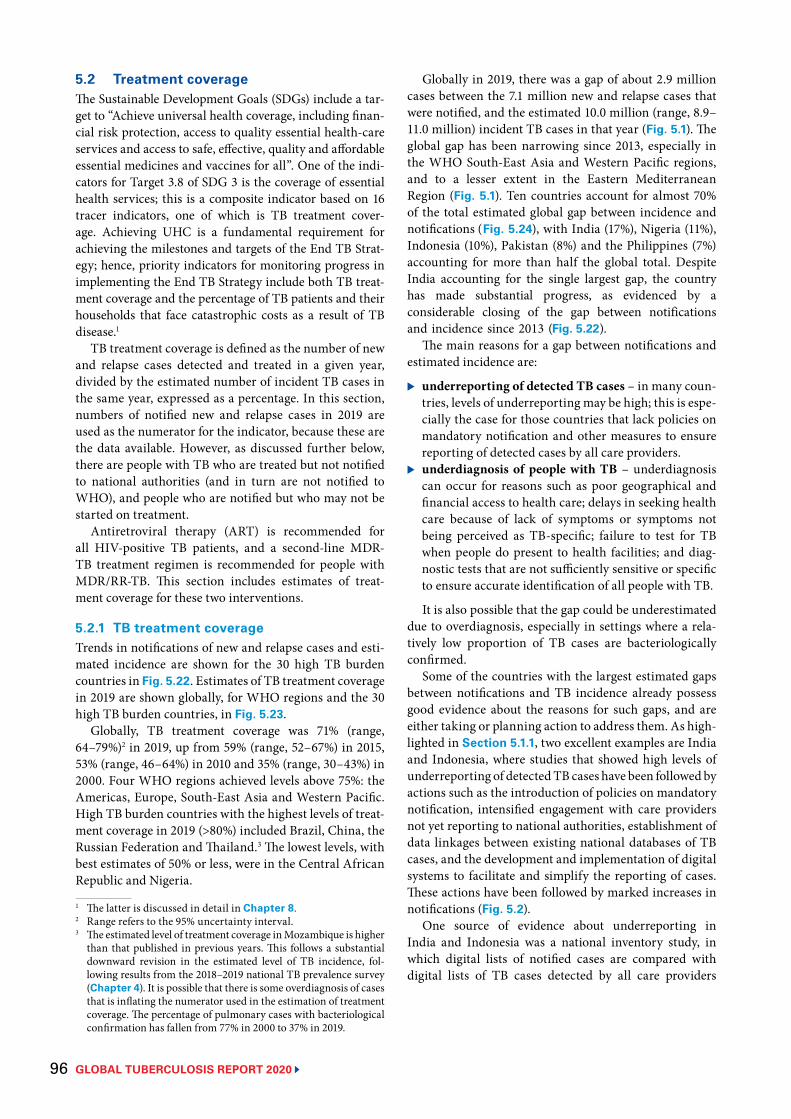
GLOBAL TUBERCULOSIS REPORT 2020 96
5.2 Treatment coverage The Sustainable Development Goals (SDGs) include a tar-get to “Achieve universal health coverage, including finan-cial risk protection, access to quality essential health-care services and access to safe, effective, quality and affordable essential medicines and vaccines for all”. One of the indi-cators for Target 3.8 of SDG 3 is the coverage of essential health services; this is a composite indicator based on 16 tracer indicators, one of which is TB treatment cover-age. Achieving UHC is a fundamental requirement for achieving the milestones and targets of the End TB Strat-egy; hence, priority indicators for monitoring progress in implementing the End TB Strategy include both TB treat-ment coverage and the percentage of TB patients and their households that face catastrophic costs as a result of TB disease.1
TB treatment coverage is defined as the number of new and relapse cases detected and treated in a given year, divided by the estimated number of incident TB cases in the same year, expressed as a percentage. In this section, numbers of notified new and relapse cases in 2019 are used as the numerator for the indicator, because these are the data available. However, as discussed further below, there are people with TB who are treated but not notified to national authorities (and in turn are not notified to WHO), and people who are notified but who may not be started on treatment.
Antiretroviral therapy (ART) is recommended for all HIV-positive TB patients, and a second-line MDR-TB treatment regimen is recommended for people with MDR/RR-TB. This section includes estimates of treat-ment coverage for these two interventions.
5.2.1 TB treatment coverage Trends in notifications of new and relapse cases and esti-mated incidence are shown for the 30 high TB burden countries in Fig. 5.22. Estimates of TB treatment coverage in 2019 are shown globally, for WHO regions and the 30 high TB burden countries, in Fig. 5.23.
Globally, TB treatment coverage was 71% (range, 64–79%)2 in 2019, up from 59% (range, 52–67%) in 2015, 53% (range, 46–64%) in 2010 and 35% (range, 30–43%) in 2000. Four WHO regions achieved levels above 75%: the Americas, Europe, South-East Asia and Western Pacific. High TB burden countries with the highest levels of treat-ment coverage in 2019 (>80%) included Brazil, China, the Russian Federation and Thailand.3 The lowest levels, with best estimates of 50% or less, were in the Central African Republic and Nigeria.
1 The latter is discussed in detail in Chapter 8.2 Range refers to the 95% uncertainty interval.3 The estimated level of treatment coverage in Mozambique is higher
than that published in previous years. This follows a substantial downward revision in the estimated level of TB incidence, fol-lowing results from the 2018–2019 national TB prevalence survey (Chapter 4). It is possible that there is some overdiagnosis of cases that is inflating the numerator used in the estimation of treatment coverage. The percentage of pulmonary cases with bacteriological confirmation has fallen from 77% in 2000 to 37% in 2019.
Globally in 2019, there was a gap of about 2.9 million cases between the 7.1 million new and relapse cases that were notified, and the estimated 10.0 million (range, 8.9–11.0 million) incident TB cases in that year (Fig. 5.1). The global gap has been narrowing since 2013, especially in the WHO South-East Asia and Western Pacific regions, and to a lesser extent in the Eastern Mediterranean Region (Fig. 5.1). Ten countries account for almost 70% of the total estimated global gap between incidence and notifications (Fig. 5.24), with India (17%), Nigeria (11%), Indonesia (10%), Pakistan (8%) and the Philippines (7%) accounting for more than half the global total. Despite India accounting for the single largest gap, the country has made substantial progress, as evidenced by a considerable closing of the gap between notifications and incidence since 2013 ( Fig. 5.22).
The main reasons for a gap between notifications and estimated incidence are:
▶ underreporting of detected TB cases – in many coun-tries, levels of underreporting may be high; this is espe-cially the case for those countries that lack policies onmandatory notification and other measures to ensurereporting of detected cases by all care providers.
▶ underdiagnosis of people with TB – underdiagnosiscan occur for reasons such as poor geographical andfinancial access to health care; delays in seeking healthcare because of lack of symptoms or symptoms notbeing perceived as TB-specific; failure to test for TBwhen people do present to health facilities; and diag-nostic tests that are not sufficiently sensitive or specificto ensure accurate identification of all people with TB.
It is also possible that the gap could be underestimateddue to overdiagnosis, especially in settings where a rela-tively low proportion of TB cases are bacteriologically confirmed.
Some of the countries with the largest estimated gaps between notifications and TB incidence already possess good evidence about the reasons for such gaps, and are either taking or planning action to address them. As high-lighted in Section 5.1.1, two excellent examples are India and Indonesia, where studies that showed high levels of underreporting of detected TB cases have been followed by actions such as the introduction of policies on mandatory notification, intensified engagement with care providers not yet reporting to national authorities, establishment of data linkages between existing national databases of TB cases, and the development and implementation of digital systems to facilitate and simplify the reporting of cases. These actions have been followed by marked increases in notifications (Fig. 5.2).
One source of evidence about underreporting in India and Indonesia was a national inventory study, in which digital lists of notified cases are compared with digital lists of TB cases detected by all care providers
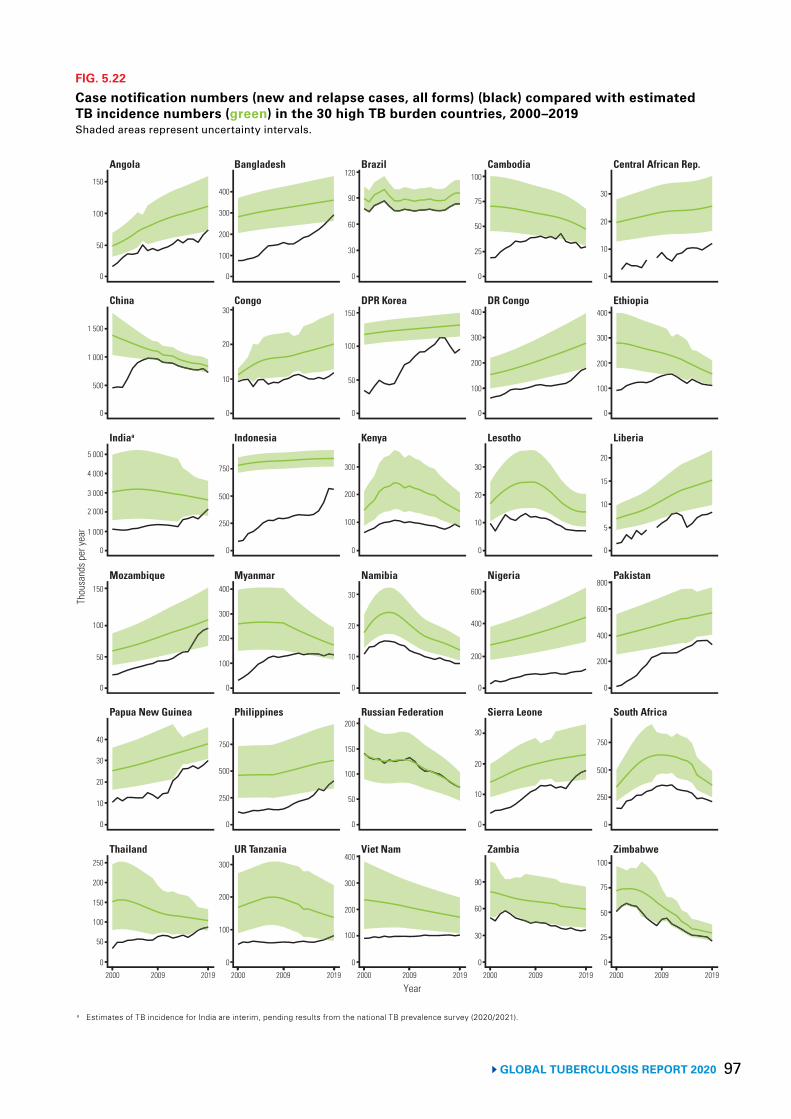
97GLOBAL TUBERCULOSIS REPORT 2020
FIG. 5.22
Case notification numbers (new and relapse cases, all forms) (black) compared with estimated TB incidence numbers (green) in the 30 high TB burden countries, 2000–2019Shaded areas represent uncertainty intervals.
0
50
150
200
Thou
sand
s per
year
250
2000 2009 2019 2000 2009 2019 2000 2009 2019 2000 2009 2019 2000 2009 2019
0
20
30
40
0
50
100
150
0
3 000
4 000
5 000
0
500
1 000
1 500
0
50
100
150
0
100
200
300
0
250
500
750
0
100
200
300
400
0
250
500
750
0
10
20
30
0
100
200
400
0
100
200
300
400
0
50
100
150
200
0
10
20
30
0
100
200
300
0
50
100
150
0
30
60
90
120
0
30
60
90
0
10
20
30
0
200
400
600
0
10
20
30
0
100
200
300
400
0
25
50
75
100
0
25
50
75
100
0
250
500
750
0
200
400
600
800
0
5
10
15
20
0
100
200
300
400
0
10
20
30
Year
2 000
1 000
10
100
300
Thailand UR Tanzania Viet Nam Zambia Zimbabwe
Papua New Guinea Philippines Russian Federation Sierra Leone South Africa
Indiaa Indonesia Kenya Lesotho Liberia
China Congo DPR Korea DR Congo Ethiopia
Angola Bangladesh Brazil Cambodia Central African Rep.
Mozambique Myanmar Namibia PakistanNigeria
a Estimates of TB incidence for India are interim, pending results from the national TB prevalence survey (2020/2021).
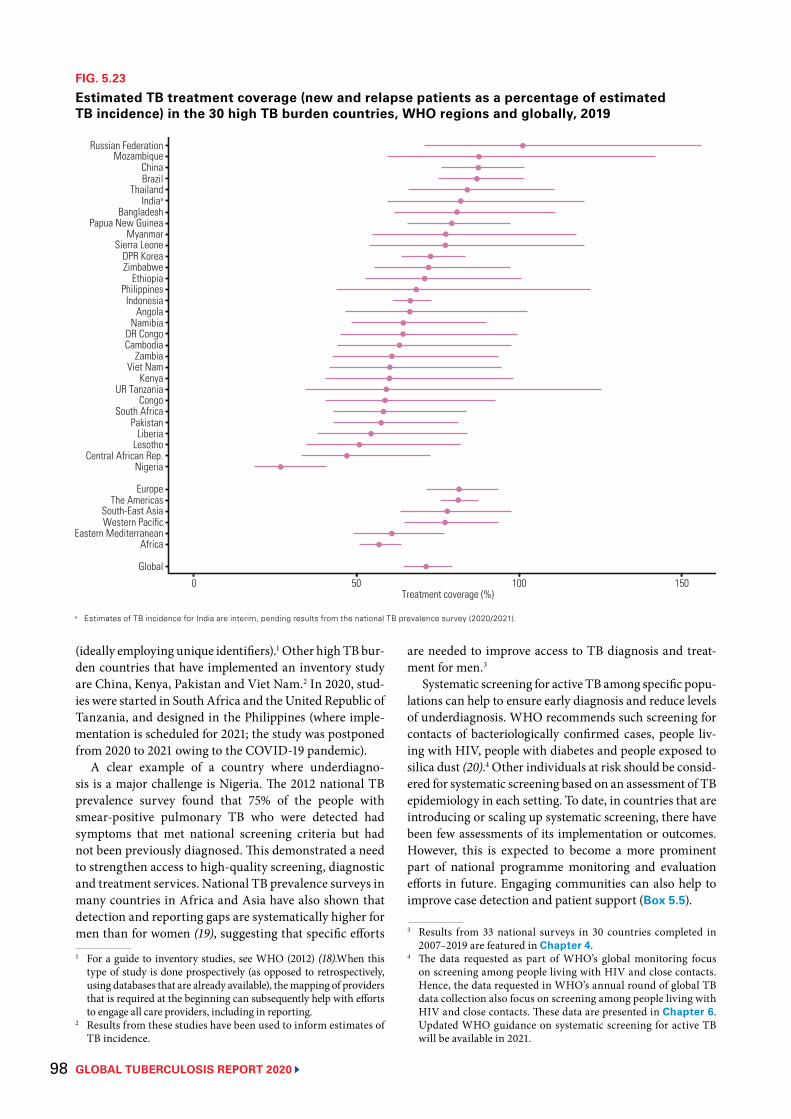
GLOBAL TUBERCULOSIS REPORT 2020 98
FIG. 5.23
Estimated TB treatment coverage (new and relapse patients as a percentage of estimated TB incidence) in the 30 high TB burden countries, WHO regions and globally, 2019
a Estimates of TB incidence for India are interim, pending results from the national TB prevalence survey (2020/2021).
Russian FederationMozambique
ChinaBrazil
ThailandIndiaa
BangladeshPapua New Guinea
MyanmarSierra Leone
DPR KoreaZimbabwe
EthiopiaPhilippines
IndonesiaAngola
NamibiaDR CongoCambodia
ZambiaViet Nam
KenyaUR Tanzania
CongoSouth Africa
PakistanLiberia
LesothoCentral African Rep.
Nigeria
EuropeThe Americas
0 50 100 150Treatment coverage (%)
South-East AsiaWestern Pacific
Eastern MediterraneanAfrica
Global
(ideally employing unique identifiers).1 Other high TB bur-den countries that have implemented an inventory study are China, Kenya, Pakistan and Viet Nam.2 In 2020, stud-ies were started in South Africa and the United Republic of Tanzania, and designed in the Philippines (where imple-mentation is scheduled for 2021; the study was postponed from 2020 to 2021 owing to the COVID-19 pandemic).
A clear example of a country where underdiagno-sis is a major challenge is Nigeria. The 2012 national TB prevalence survey found that 75% of the people with smear-positive pulmonary TB who were detected had symptoms that met national screening criteria but had not been previously diagnosed. This demonstrated a need to strengthen access to high-quality screening, diagnostic and treatment services. National TB prevalence surveys in many countries in Africa and Asia have also shown that detection and reporting gaps are systematically higher for men than for women (19), suggesting that specific efforts 1 For a guide to inventory studies, see WHO (2012) (18).When this
type of study is done prospectively (as opposed to retrospectively, using databases that are already available), the mapping of providers that is required at the beginning can subsequently help with efforts to engage all care providers, including in reporting.
2 Results from these studies have been used to inform estimates of TB incidence.
are needed to improve access to TB diagnosis and treat-ment for men.3
Systematic screening for active TB among specific popu-lations can help to ensure early diagnosis and reduce levels of underdiagnosis. WHO recommends such screening for contacts of bacteriologically confirmed cases, people liv-ing with HIV, people with diabetes and people exposed to silica dust (20).4 Other individuals at risk should be consid-ered for systematic screening based on an assessment of TB epidemiology in each setting. To date, in countries that are introducing or scaling up systematic screening, there have been few assessments of its implementation or outcomes. However, this is expected to become a more prominent part of national programme monitoring and evaluation efforts in future. Engaging communities can also help to improve case detection and patient support (Box 5.5).
3 Results from 33 national surveys in 30 countries completed in 2007–2019 are featured in Chapter 4.
4 The data requested as part of WHO’s global monitoring focus on screening among people living with HIV and close contacts. Hence, the data requested in WHO’s annual round of global TB data collection also focus on screening among people living with HIV and close contacts. These data are presented in Chapter 6. Updated WHO guidance on systematic screening for active TB will be available in 2021.
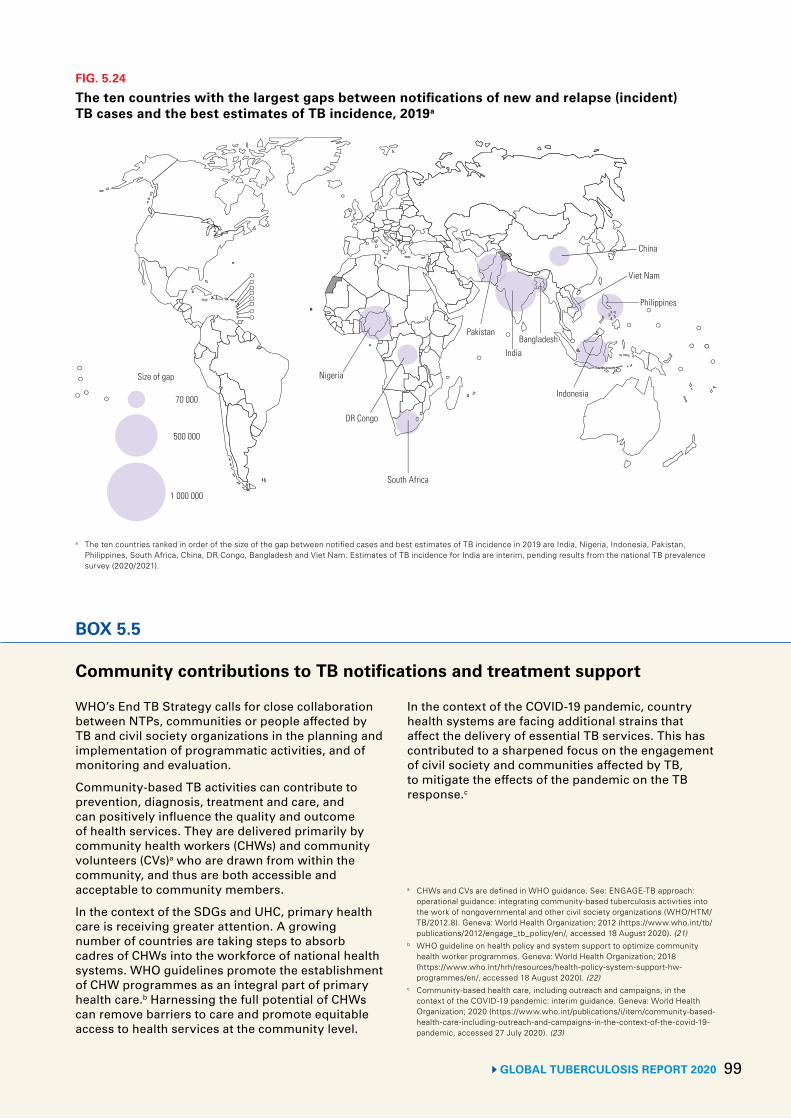
GLOBAL TUBERCULOSIS REPORT 2020 99
FIG. 5.24
The ten countries with the largest gaps between notifications of new and relapse (incident) TB cases and the best estimates of TB incidence, 2019a
70 000
500 000
1 000 000
Nigeria
South Africa
Pakistan
India
Indonesia
Philippines
China
Bangladesh
DR Congo
Viet Nam
Size of gap
a The ten countries ranked in order of the size of the gap between notified cases and best estimates of TB incidence in 2019 are India, Nigeria, Indonesia, Pakistan, Philippines, South Africa, China, DR Congo, Bangladesh and Viet Nam. Estimates of TB incidence for India are interim, pending results from the national TB prevalence survey (2020/2021).
BOX 5.5
Community contributions to TB notifications and treatment support
WHO’s End TB Strategy calls for close collaboration between NTPs, communities or people affected by TB and civil society organizations in the planning and implementation of programmatic activities, and of monitoring and evaluation.
Community-based TB activities can contribute to prevention, diagnosis, treatment and care, and can positively influence the quality and outcome of health services. They are delivered primarily by community health workers (CHWs) and community volunteers (CVs)a who are drawn from within the community, and thus are both accessible and acceptable to community members.
In the context of the SDGs and UHC, primary health care is receiving greater attention. A growing number of countries are taking steps to absorb cadres of CHWs into the workforce of national health systems. WHO guidelines promote the establishment of CHW programmes as an integral part of primary health care.b Harnessing the full potential of CHWs can remove barriers to care and promote equitable access to health services at the community level.
In the context of the COVID-19 pandemic, country health systems are facing additional strains that affect the delivery of essential TB services. This has contributed to a sharpened focus on the engagement of civil society and communities affected by TB, to mitigate the effects of the pandemic on the TB response.c
a CHWs and CVs are defined in WHO guidance. See: ENGAGE-TB approach: operational guidance: integrating community-based tuberculosis activities into the work of nongovernmental and other civil society organizations (WHO/HTM/TB/2012.8). Geneva: World Health Organization; 2012 (https://www.who.int/tb/publications/2012/engage_tb_policy/en/, accessed 18 August 2020). (21)
b WHO guideline on health policy and system support to optimize community health worker programmes. Geneva: World Health Organization; 2018 (https://www.who.int/hrh/resources/health-policy-system-support-hw-programmes/en/, accessed 18 August 2020). (22)
c Community-based health care, including outreach and campaigns, in the context of the COVID-19 pandemic: interim guidance. Geneva: World Health Organization; 2020 (https://www.who.int/publications/i/item/community-based-health-care-including-outreach-and-campaigns-in-the-context-of-the-covid-19-pandemic, accessed 27 July 2020). (23)
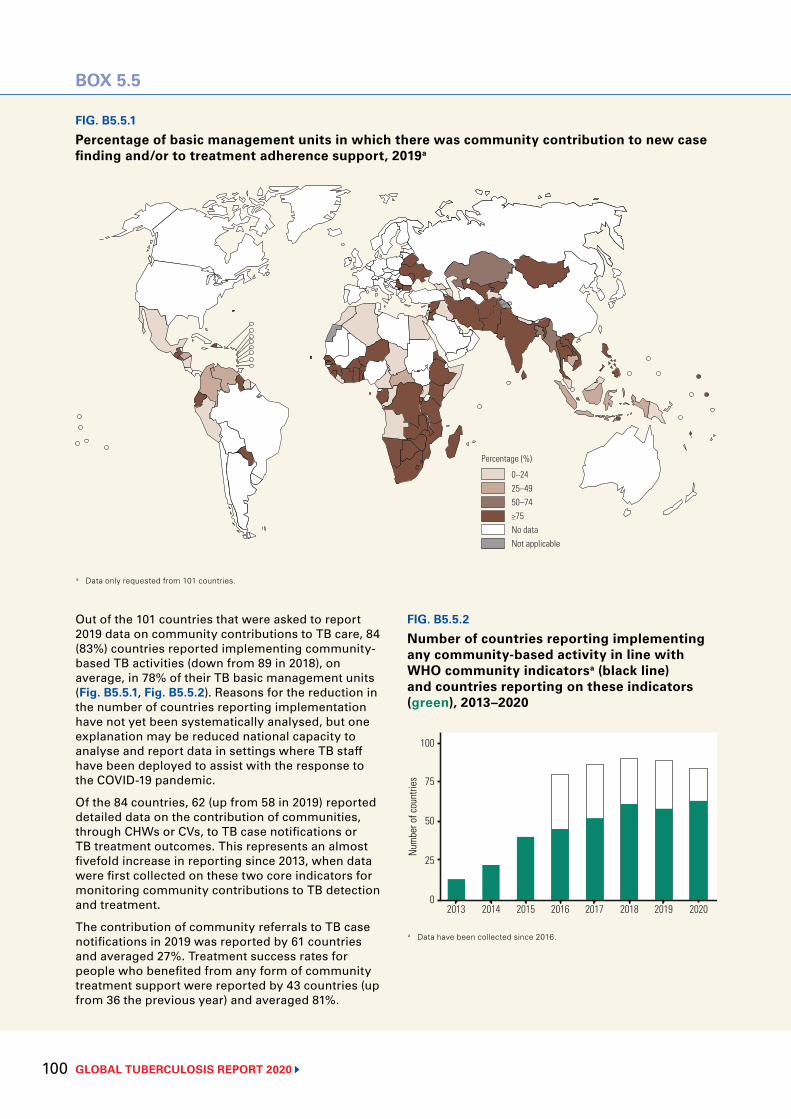
GLOBAL TUBERCULOSIS REPORT 2020 100
FIG. B5.5.1
Percentage of basic management units in which there was community contribution to new case finding and/or to treatment adherence support, 2019a
0–2425–4950–74≥75No dataNot applicable
Percentage (%)
FIG. B5.5.2
Number of countries reporting implementing any community-based activity in line with WHO community indicatorsa (black line) and countries reporting on these indicators (green), 2013–2020
a Data have been collected since 2016.
2013 2014 2015 2016 2017 2018 2019 2020
Num
ber o
f cou
ntrie
s
100
75
25
0
50
a Data only requested from 101 countries.
BOX 5.5
Out of the 101 countries that were asked to report 2019 data on community contributions to TB care, 84 (83%) countries reported implementing community-based TB activities (down from 89 in 2018), on average, in 78% of their TB basic management units (Fig. B5.5.1, Fig. B5.5.2). Reasons for the reduction in the number of countries reporting implementation have not yet been systematically analysed, but one explanation may be reduced national capacity to analyse and report data in settings where TB staff have been deployed to assist with the response to the COVID-19 pandemic.
Of the 84 countries, 62 (up from 58 in 2019) reported detailed data on the contribution of communities, through CHWs or CVs, to TB case notifications or TB treatment outcomes. This represents an almost fivefold increase in reporting since 2013, when data were first collected on these two core indicators for monitoring community contributions to TB detection and treatment.
The contribution of community referrals to TB case notifications in 2019 was reported by 61 countries and averaged 27%. Treatment success rates for people who benefited from any form of community treatment support were reported by 43 countries (up from 36 the previous year) and averaged 81%.
101GLOBAL TUBERCULOSIS REPORT 2020
5.2.2 Treatment coverage of ART for HIV-positive TB cases
WHO recommends ART for all HIV-positive TB patients as soon as possible, but within the first 8 weeks of starting TB treatment, and within 2 weeks of starting treatment in profoundly immunosuppressed HIV-positive TB patients with CD4 counts of less than 50. The number of notified HIV-positive TB patients on ART reached 398 719 in 2019, equivalent to 88% of the notified TB patients known to be HIV-positive (Fig. 5.13).1 In the 30 high TB/HIV bur-den countries, overall, 89% of the TB patients known to be HIV-positive were on ART; 12 countries (Botswana, Cameroon, Eswatini, Ethiopia, Kenya, Lesotho, Malawi, Mozambique, Namibia, Uganda, the United Republic of Tanzania and Zambia) maintained coverage of at least 90% in the three years 2017–2019. Coverage in India was 95% in 2019, demonstrating what can be achieved in the context of a concentrated HIV epidemic; contributory factors include the strategic decentralization of services, and provision of HIV and TB services in the same health facilities. In contrast, coverage was less than 50% in two other high TB/HIV burden countries with concentrated epidemics: Brazil and Indonesia.
Coverage of ART for all HIV-positive people with TB is shown in Fig. 5.25 and Fig. 5.26. Globally in 2019, the number of HIV-positive TB patients on ART was 49% of the estimated global number of incident TB cases among people living with HIV; this is considerably lower than the global ART coverage of 67% among all people living with HIV in 2019 (24). Among the high TB/HIV burden coun-tries, best estimates of coverage varied widely, from 7% in Congo to 83% in Mozambique. Only 14 of the 30 countries achieved ART coverage among TB patients of more than 50% (Eswatini, Ethiopia, India, Kenya, Malawi, Mozam-bique, Myanmar, Namibia, Papua New Guinea, Thailand, Uganda, the United Republic of Tanzania, Zambia and Zimbabwe).
Improvements are still needed in the detection of active TB disease among people living with HIV, coverage of HIV testing among TB patients and enrolment of HIV-positive TB patients on ART. An overview of progress and gaps in TB preventive treatment among people living with HIV is provided in Chapter 6.
5.2.3 Treatment coverage for MDR/RR-TB Trends in the number of patients enrolled on MDR-TB treatment globally and in the 30 high MDR-TB countries since 2009 are shown in Fig. 5.17 and Fig. 5.18, respectively. The number of people enrolled on treatment globally was 177 099 in 2019, up from 156 205 in 2018 and almost a sixfold increase from 30 500 in 2009 (when WHO first asked countries to report data). Despite these improvements, the total number of people treated in 2018–2019, 1 There may be discrepancies in data on provision of ART to
HIV-positive TB patients as reported by NTPs and national HIV programmes. These discrepancies have reduced in recent years and have mostly been resolved through follow-up and validation efforts.
at 333 304, was only 22% of the way towards the 5-year (2018–2022) global target of 1.5 million that was set at the UN high-level meeting on TB. For children, the total was 8986, less than 10% of the 5-year target of 115 000 (Table 5.3.1). The number of enrolments also fell in 11 high MDR-TB burden countries (Fig. 5.18).
The number of people starting MDR-TB treatment in 2019 was equivalent to 86% of the 206 030 people report-ed to have been diagnosed with MDR/RR-TB in 2019 (Fig. 5.17). The figure exceeded 90% in 14 high MDR-TB burden countries (Fig. 5.18), including several in the WHO European Region; however, it was lower in many countries of the African and Western Pacific regions.2 These percentages show that progress in detection is out-stripping the capacity to provide treatment; they may also reflect weaknesses in data collection systems. In many countries, one of the barriers to adequate access to treat-ment of drug-resistant TB may be that the network for the programmatic management of drug-resistant TB is too centralized and too reliant on hospital-based models of care. Greater decentralization of services and expansion of ambulatory models of care are needed.
Globally, the 177 099 patients starting second-line MDR-TB treatment in 2019 represented 38% of the esti-mated 465 000 (range, 400 000–535 000)3 incident cases of MDR/RR-TB in 2019 (Fig. 5.17). Estimates of treatment coverage in the 30 high TB burden countries and WHO regions varied widely (Fig. 5.27).
Ten countries accounted for 77% of the global gap between the estimated global incidence of MDR/RR-TB and the number of people enrolled on treatment in 2019 (Fig. 5.28). Substantial improvements in treatment cover-age at the global level require an intensification of efforts to diagnose and treat MDR/RR-TB in these countries, particularly in China and India.4 Closing the gap between incidence and treatment enrolment requires one or more of the following to be increased: the proportion of people with TB who are detected and, of these, the proportion for whom TB is bacteriologically confirmed; the proportion of people with bacteriologically confirmed TB who are test-ed for drug resistance; and the proportion of people diag-nosed with MDR/RR-TB who are enrolled in treatment.
Globally, 12 960 patients with MDR-TB and resist-ance to fluoroquinolones were enrolled on treatment in 80 countries and territories – a 13% increase compared with 2018. In 25 of these countries, the number of people with such resistance patterns enrolled on treatment was less than the number notified.
2 Data for WHO regions are available online and in the Global TB Report mobile app (Annex 1, Annex 3).
3 Range refers to the 95% uncertainty interval.4 In combination, China and India accounted for 41% of the global
gap in 2019.
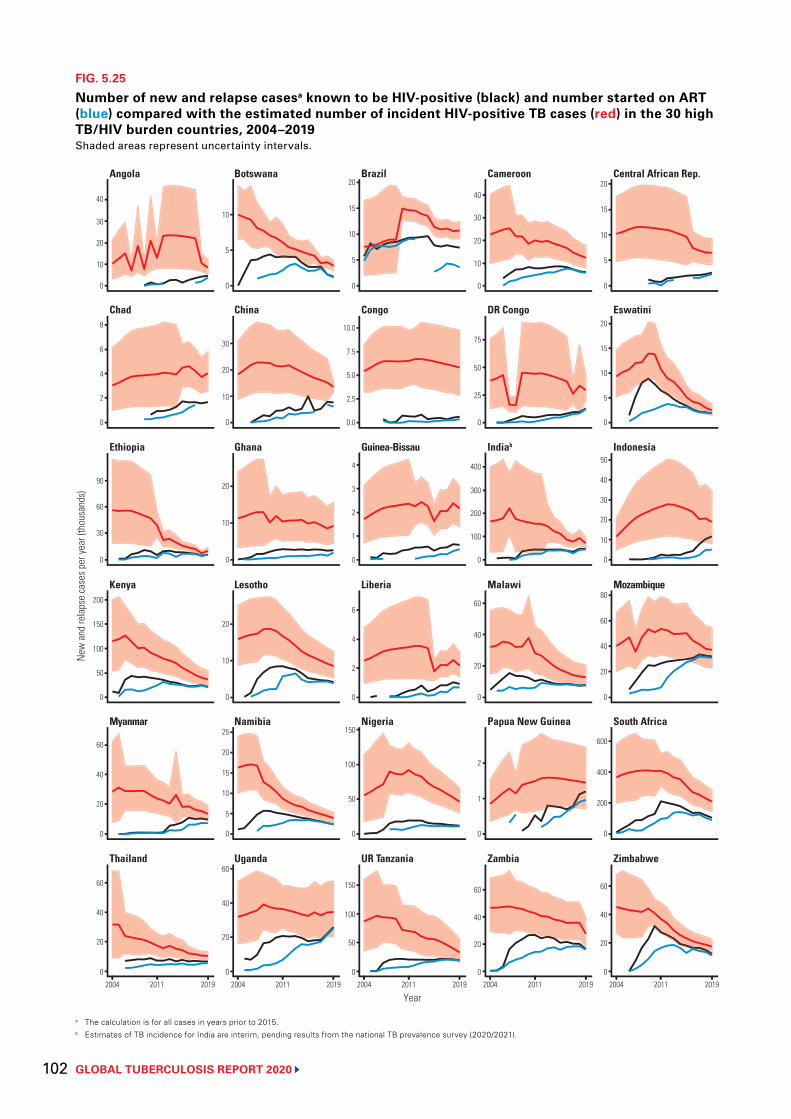
GLOBAL TUBERCULOSIS REPORT 2020 102
FIG. 5.25
Number of new and relapse casesa known to be HIV-positive (black) and number started on ART (blue) compared with the estimated number of incident HIV-positive TB cases (red) in the 30 high TB/HIV burden countries, 2004–2019Shaded areas represent uncertainty intervals.
a The calculation is for all cases in years prior to 2015.b Estimates of TB incidence for India are interim, pending results from the national TB prevalence survey (2020/2021).
0
20
40
60
New
and
rela
pse
case
s per
year
(tho
usan
ds)
2004 2011 2019 2004 2011 2019 2004 2011 2019 2004 2011 2019 2004 2011 2019
0
20
40
60
0
100
150
200
0
60
90
0
4
6
8
0
20
30
40
0
20
40
60
0
5
10
25
0
10
20
0
10
20
0
10
20
30
0
5
0
50
100
150
0
50
100
150
0
2
4
6
0
2
3
4
0.0
5.0
7.5
10.0
0
5
10
15
20
0
20
40
60
0
1
2
0
20
40
60
0
100
300
400
0
25
50
75
0
10
20
30
40
0
20
40
60
0
200
400
600
0
20
40
60
80
0
10
30
40
50
0
5
10
15
20
0
10
15
20
Year
30
10
10
2
50
20
15
2.5
1
200
5
20
Thailand Uganda UR Tanzania Zambia Zimbabwe
Myanmar Namibia Nigeria Papua New Guinea South Africa
Ethiopia Ghana Guinea-Bissau Indiab Indonesia
Chad China Congo DR Congo Eswatini
Angola Botswana Brazil Cameroon Central African Rep.
Kenya Lesotho Liberia MozambiqueMalawi
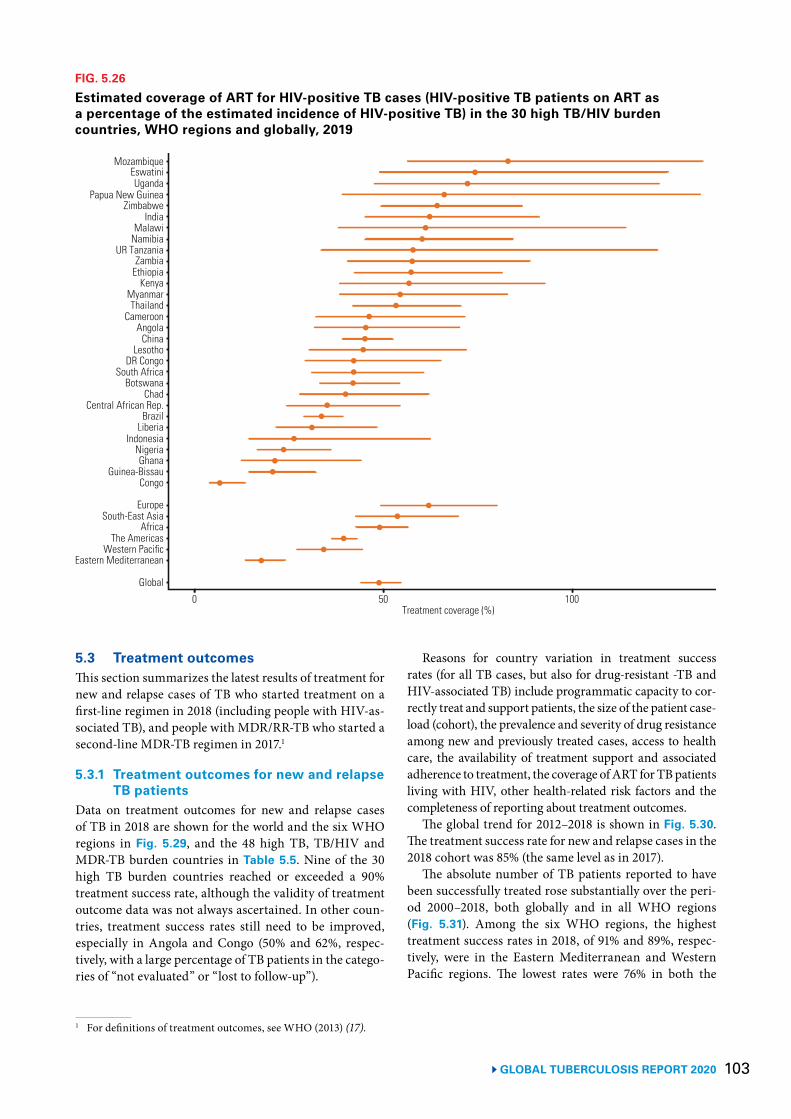
103 GLOBAL TUBERCULOSIS REPORT 2020
FIG. 5.26
Estimated coverage of ART for HIV-positive TB cases (HIV-positive TB patients on ART as a percentage of the estimated incidence of HIV-positive TB) in the 30 high TB/HIV burden countries, WHO regions and globally, 2019
MozambiqueEswatiniUganda
Papua New GuineaZimbabwe
IndiaMalawi
NamibiaUR Tanzania
ZambiaEthiopia
KenyaMyanmarThailand
CameroonAngola
ChinaLesotho
DR CongoSouth Africa
BotswanaChad
Central African Rep.Brazil
LiberiaIndonesia
NigeriaGhana
Guinea-BissauCongo
EuropeSouth-East Asia
0 50 100Treatment coverage (%)
AfricaThe Americas
Western PacificEastern Mediterranean
Global
5.3 Treatment outcomes This section summarizes the latest results of treatment for new and relapse cases of TB who started treatment on a first-line regimen in 2018 (including people with HIV-as-sociated TB), and people with MDR/RR-TB who started a second-line MDR-TB regimen in 2017.1
5.3.1 Treatment outcomes for new and relapse TB patients
Data on treatment outcomes for new and relapse cases of TB in 2018 are shown for the world and the six WHO regions in Fig. 5.29, and the 48 high TB, TB/HIV and MDR-TB burden countries in Table 5.5. Nine of the 30 high TB burden countries reached or exceeded a 90% treatment success rate, although the validity of treatment outcome data was not always ascertained. In other coun-tries, treatment success rates still need to be improved, especially in Angola and Congo (50% and 62%, respec-tively, with a large percentage of TB patients in the catego-ries of “not evaluated” or “lost to follow-up”).
1 For definitions of treatment outcomes, see WHO (2013) (17).
Reasons for country variation in treatment success rates (for all TB cases, but also for drug-resistant -TB and HIV-associated TB) include programmatic capacity to cor-rectly treat and support patients, the size of the patient case-load (cohort), the prevalence and severity of drug resistance among new and previously treated cases, access to health care, the availability of treatment support and associated adherence to treatment, the coverage of ART for TB patients living with HIV, other health-related risk factors and the completeness of reporting about treatment outcomes.
The global trend for 2012–2018 is shown in Fig. 5.30. The treatment success rate for new and relapse cases in the 2018 cohort was 85% (the same level as in 2017).
The absolute number of TB patients reported to have been successfully treated rose substantially over the peri-od 2000–2018, both globally and in all WHO regions (Fig. 5.31). Among the six WHO regions, the highest treatment success rates in 2018, of 91% and 89%, respec-tively, were in the Eastern Mediterranean and Western Pacific regions. The lowest rates were 76% in both the
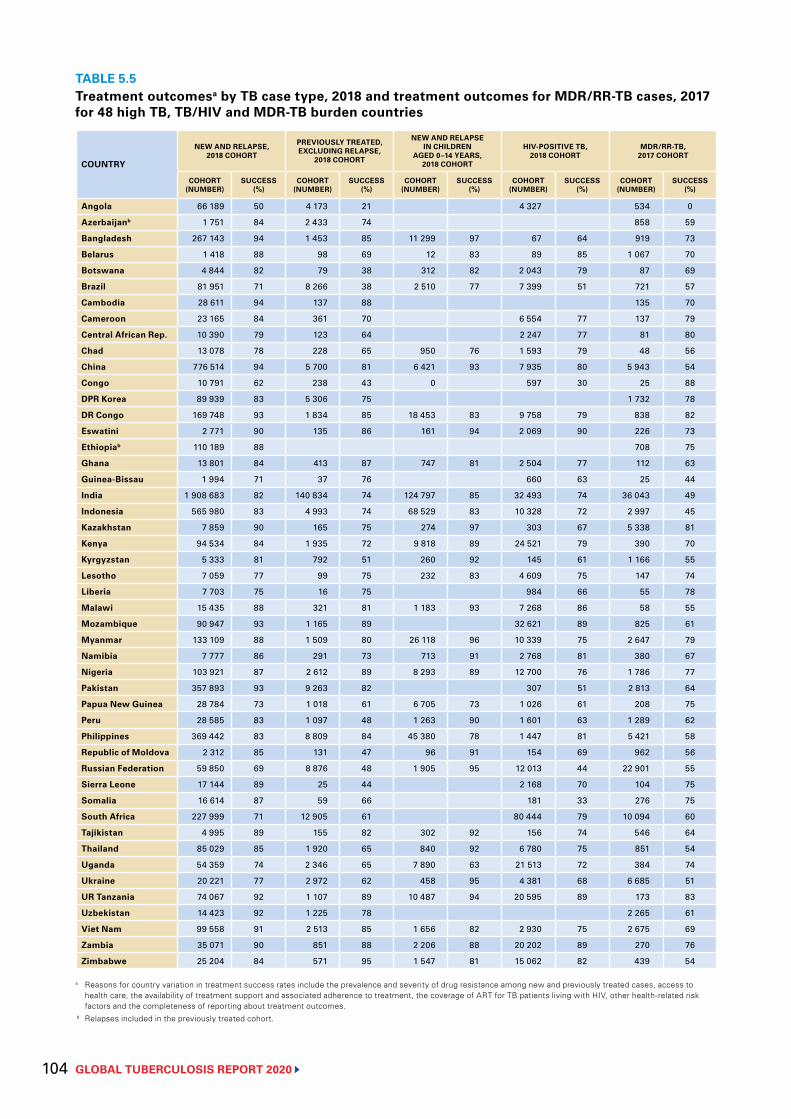
GLOBAL TUBERCULOSIS REPORT 2020 104
TABLE 5.5Treatment outcomesa by TB case type, 2018 and treatment outcomes for MDR/RR-TB cases, 2017 for 48 high TB, TB/HIV and MDR-TB burden countries
COUNTRY
NEW AND RELAPSE, 2018 COHORT
PREVIOUSLY TREATED, EXCLUDING RELAPSE,
2018 COHORT
NEW AND RELAPSE IN CHILDREN
AGED 0–14 YEARS, 2018 COHORT
HIV-POSITIVE TB, 2018 COHORT
MDR/RR-TB, 2017 COHORT
COHORT (NUMBER)
SUCCESS (%)
COHORT (NUMBER)
SUCCESS (%)
COHORT (NUMBER)
SUCCESS (%)
COHORT (NUMBER)
SUCCESS (%)
COHORT (NUMBER)
SUCCESS (%)
Angola 66 189 50 4 173 21 4 327 534 0
Azerbaijanb 1 751 84 2 433 74 858 59
Bangladesh 267 143 94 1 453 85 11 299 97 67 64 919 73
Belarus 1 418 88 98 69 12 83 89 85 1 067 70
Botswana 4 844 82 79 38 312 82 2 043 79 87 69
Brazil 81 951 71 8 266 38 2 510 77 7 399 51 721 57
Cambodia 28 611 94 137 88 135 70
Cameroon 23 165 84 361 70 6 554 77 137 79
Central African Rep. 10 390 79 123 64 2 247 77 81 80
Chad 13 078 78 228 65 950 76 1 593 79 48 56
China 776 514 94 5 700 81 6 421 93 7 935 80 5 943 54
Congo 10 791 62 238 43 0 597 30 25 88
DPR Korea 89 939 83 5 306 75 1 732 78
DR Congo 169 748 93 1 834 85 18 453 83 9 758 79 838 82
Eswatini 2 771 90 135 86 161 94 2 069 90 226 73
Ethiopiab 110 189 88 708 75
Ghana 13 801 84 413 87 747 81 2 504 77 112 63
Guinea-Bissau 1 994 71 37 76 660 63 25 44
India 1 908 683 82 140 834 74 124 797 85 32 493 74 36 043 49
Indonesia 565 980 83 4 993 74 68 529 83 10 328 72 2 997 45
Kazakhstan 7 859 90 165 75 274 97 303 67 5 338 81
Kenya 94 534 84 1 935 72 9 818 89 24 521 79 390 70
Kyrgyzstan 5 333 81 792 51 260 92 145 61 1 166 55
Lesotho 7 059 77 99 75 232 83 4 609 75 147 74
Liberia 7 703 75 16 75 984 66 55 78
Malawi 15 435 88 321 81 1 183 93 7 268 86 58 55
Mozambique 90 947 93 1 165 89 32 621 89 825 61
Myanmar 133 109 88 1 509 80 26 118 96 10 339 75 2 647 79
Namibia 7 777 86 291 73 713 91 2 768 81 380 67
Nigeria 103 921 87 2 612 89 8 293 89 12 700 76 1 786 77
Pakistan 357 893 93 9 263 82 307 51 2 813 64
Papua New Guinea 28 784 73 1 018 61 6 705 73 1 026 61 208 75
Peru 28 585 83 1 097 48 1 263 90 1 601 63 1 289 62
Philippines 369 442 83 8 809 84 45 380 78 1 447 81 5 421 58
Republic of Moldova 2 312 85 131 47 96 91 154 69 962 56
Russian Federation 59 850 69 8 876 48 1 905 95 12 013 44 22 901 55
Sierra Leone 17 144 89 25 44 2 168 70 104 75
Somalia 16 614 87 59 66 181 33 276 75
South Africa 227 999 71 12 905 61 80 444 79 10 094 60
Tajikistan 4 995 89 155 82 302 92 156 74 546 64
Thailand 85 029 85 1 920 65 840 92 6 780 75 851 54
Uganda 54 359 74 2 346 65 7 890 63 21 513 72 384 74
Ukraine 20 221 77 2 972 62 458 95 4 381 68 6 685 51
UR Tanzania 74 067 92 1 107 89 10 487 94 20 595 89 173 83
Uzbekistan 14 423 92 1 225 78 2 265 61
Viet Nam 99 558 91 2 513 85 1 656 82 2 930 75 2 675 69
Zambia 35 071 90 851 88 2 206 88 20 202 89 270 76
Zimbabwe 25 204 84 571 95 1 547 81 15 062 82 439 54
a Reasons for country variation in treatment success rates include the prevalence and severity of drug resistance among new and previously treated cases, access to health care, the availability of treatment support and associated adherence to treatment, the coverage of ART for TB patients living with HIV, other health-related risk factors and the completeness of reporting about treatment outcomes.
b Relapses included in the previously treated cohort.
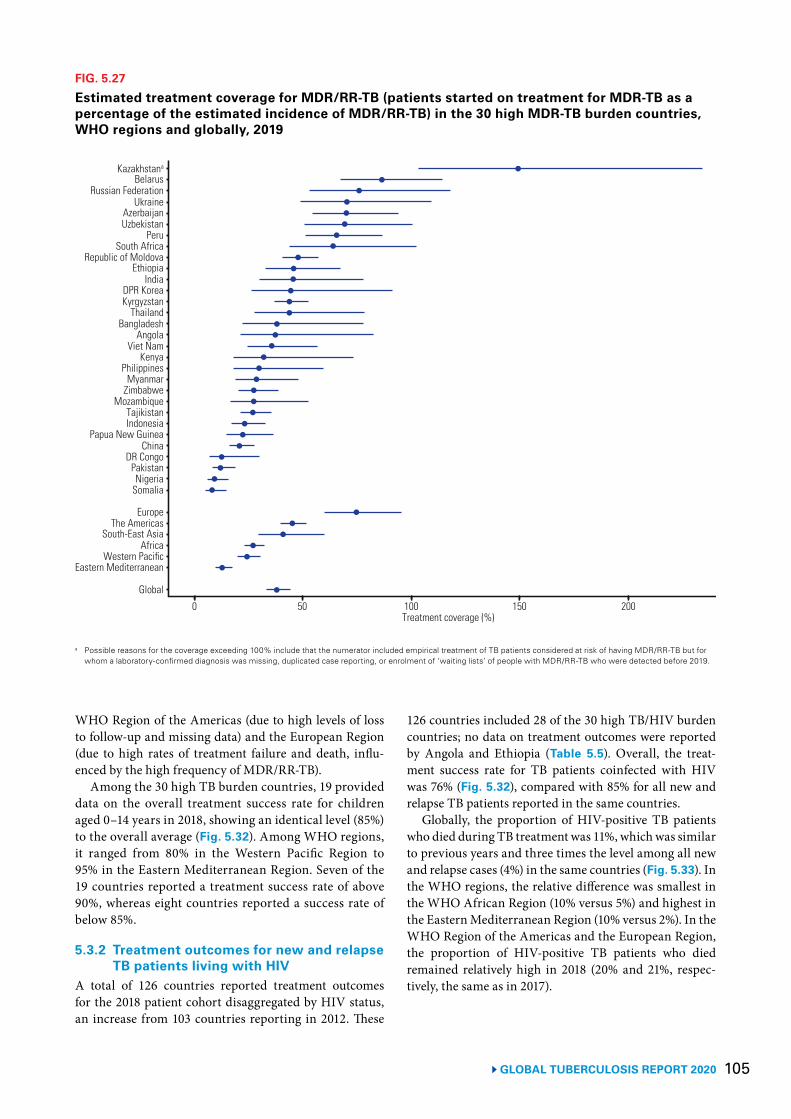
105 GLOBAL TUBERCULOSIS REPORT 2020
FIG. 5.27
Estimated treatment coverage for MDR/RR-TB (patients started on treatment for MDR-TB as a percentage of the estimated incidence of MDR/RR-TB) in the 30 high MDR-TB burden countries, WHO regions and globally, 2019
a Possible reasons for the coverage exceeding 100% include that the numerator included empirical treatment of TB patients considered at risk of having MDR/RR-TB but for whom a laboratory-confirmed diagnosis was missing, duplicated case reporting, or enrolment of ‘waiting lists’ of people with MDR/RR-TB who were detected before 2019.
Kazakhstana
BelarusRussian Federation
UkraineAzerbaijanUzbekistan
PeruSouth Africa
Republic of MoldovaEthiopia
IndiaDPR KoreaKyrgyzstan
ThailandBangladesh
AngolaViet Nam
KenyaPhilippines
MyanmarZimbabwe
MozambiqueTajikistanIndonesia
Papua New GuineaChina
DR CongoPakistanNigeria
Somalia
EuropeThe Americas
0 50 100 150 200Treatment coverage (%)
South-East AsiaAfrica
Western PacificEastern Mediterranean
Global
WHO Region of the Americas (due to high levels of loss to follow-up and missing data) and the European Region (due to high rates of treatment failure and death, influ-enced by the high frequency of MDR/RR-TB).
Among the 30 high TB burden countries, 19 provided data on the overall treatment success rate for children aged 0–14 years in 2018, showing an identical level (85%) to the overall average (Fig. 5.32). Among WHO regions, it ranged from 80% in the Western Pacific Region to 95% in the Eastern Mediterranean Region. Seven of the 19 countries reported a treatment success rate of above 90%, whereas eight countries reported a success rate of below 85%.
5.3.2 Treatment outcomes for new and relapse TB patients living with HIV
A total of 126 countries reported treatment outcomes for the 2018 patient cohort disaggregated by HIV status, an increase from 103 countries reporting in 2012. These
126 countries included 28 of the 30 high TB/HIV burden countries; no data on treatment outcomes were reported by Angola and Ethiopia (Table 5.5). Overall, the treat-ment success rate for TB patients coinfected with HIV was 76% (Fig. 5.32), compared with 85% for all new and relapse TB patients reported in the same countries.
Globally, the proportion of HIV-positive TB patients who died during TB treatment was 11%, which was similar to previous years and three times the level among all new and relapse cases (4%) in the same countries (Fig. 5.33). In the WHO regions, the relative difference was smallest in the WHO African Region (10% versus 5%) and highest in the Eastern Mediterranean Region (10% versus 2%). In the WHO Region of the Americas and the European Region, the proportion of HIV-positive TB patients who died remained relatively high in 2018 (20% and 21%, respec-tively, the same as in 2017).
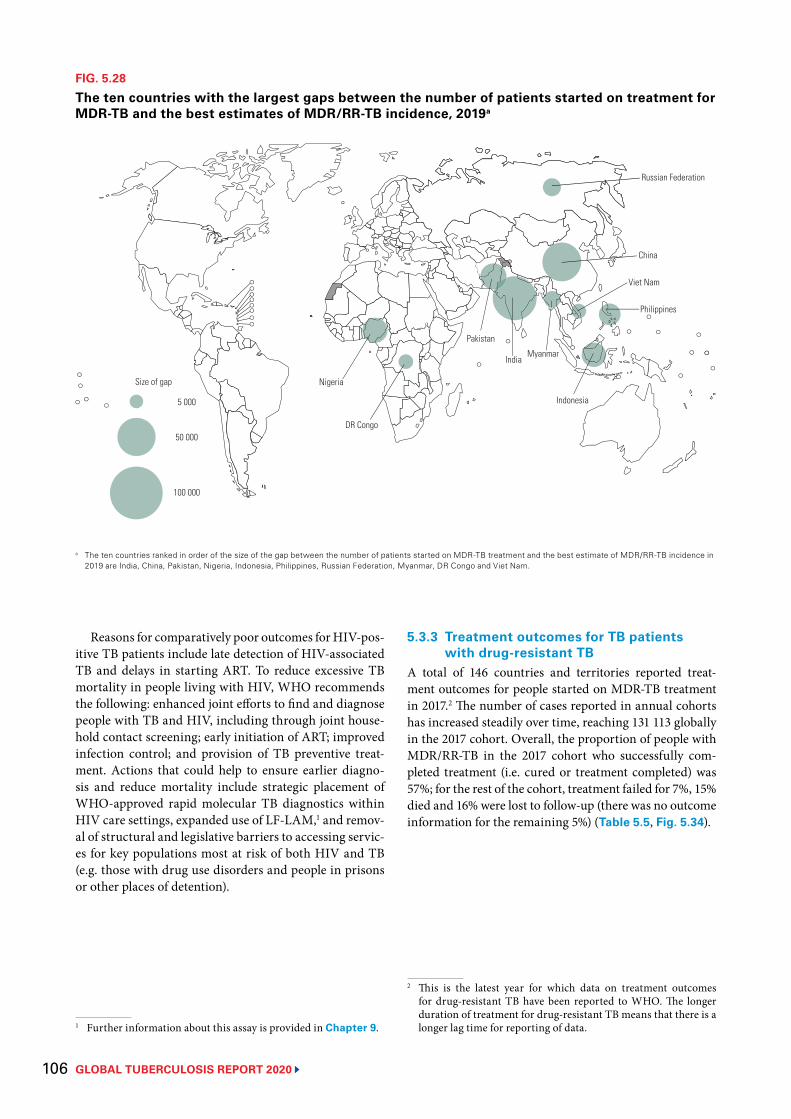
GLOBAL TUBERCULOSIS REPORT 2020 106
FIG. 5.28
The ten countries with the largest gaps between the number of patients started on treatment for MDR-TB and the best estimates of MDR/RR-TB incidence, 2019a
5 000
50 000
100 000
Nigeria
Pakistan
India
Indonesia
Philippines
China
Myanmar
DR Congo
Viet Nam
Russian Federation
Size of gap
a The ten countries ranked in order of the size of the gap between the number of patients started on MDR-TB treatment and the best estimate of MDR/RR-TB incidence in 2019 are India, China, Pakistan, Nigeria, Indonesia, Philippines, Russian Federation, Myanmar, DR Congo and Viet Nam.
Reasons for comparatively poor outcomes for HIV-pos-itive TB patients include late detection of HIV-associated TB and delays in starting ART. To reduce excessive TB mortality in people living with HIV, WHO recommends the following: enhanced joint efforts to find and diagnose people with TB and HIV, including through joint house-hold contact screening; early initiation of ART; improved infection control; and provision of TB preventive treat-ment. Actions that could help to ensure earlier diagno-sis and reduce mortality include strategic placement of WHO-approved rapid molecular TB diagnostics within HIV care settings, expanded use of LF-LAM,1 and remov-al of structural and legislative barriers to accessing servic-es for key populations most at risk of both HIV and TB (e.g. those with drug use disorders and people in prisons or other places of detention).
1 Further information about this assay is provided in Chapter 9.
5.3.3 Treatment outcomes for TB patients with drug-resistant TB
A total of 146 countries and territories reported treat-ment outcomes for people started on MDR-TB treatment in 2017.2 The number of cases reported in annual cohorts has increased steadily over time, reaching 131 113 globally in the 2017 cohort. Overall, the proportion of people with MDR/RR-TB in the 2017 cohort who successfully com-pleted treatment (i.e. cured or treatment completed) was 57%; for the rest of the cohort, treatment failed for 7%, 15% died and 16% were lost to follow-up (there was no outcome information for the remaining 5%) (Table 5.5, Fig. 5.34).
2 This is the latest year for which data on treatment outcomes for drug-resistant TB have been reported to WHO. The longer duration of treatment for drug-resistant TB means that there is a longer lag time for reporting of data.
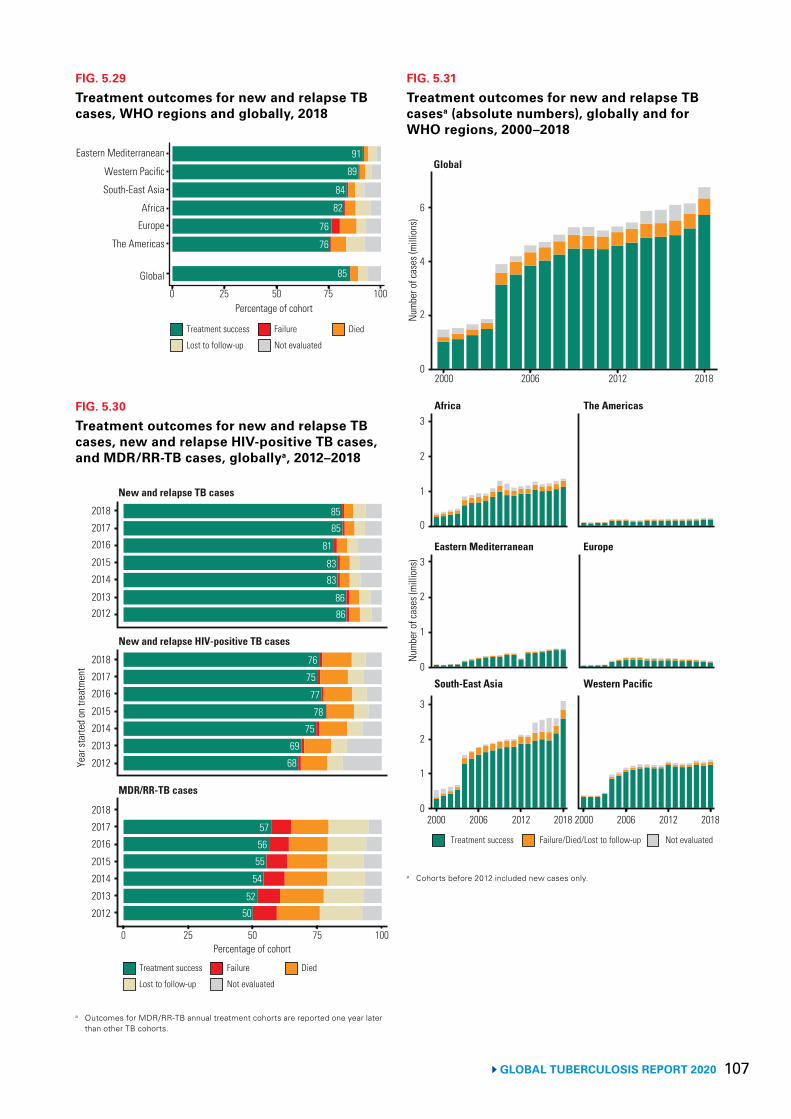
107 GLOBAL TUBERCULOSIS REPORT 2020
FIG. 5.30
Treatment outcomes for new and relapse TB cases, new and relapse HIV-positive TB cases, and MDR/RR-TB cases, globallya, 2012–2018
0 25 50 75 100Percentage of cohort
Year
star
ted
on tr
eatm
ent
2018
New and relapse TB cases
2017
2016
2015
2014
20132012
New and relapse HIV-positive TB cases
2018
2017
2016
2015
2014
2013
2012
2018
2017
2016
2015
2014
2013
2012
MDR/RR-TB cases
8585
81
8383
8686
76
75
77
78
75
69
68
57
56
55
54
52
50
Treatment success Failure
Lost to follow-up
Died
Not evaluated
a Outcomes for MDR/RR-TB annual treatment cohorts are reported one year later than other TB cohorts.
FIG. 5.31
Treatment outcomes for new and relapse TB casesa (absolute numbers), globally and for WHO regions, 2000–2018
2000 2006 2012 2018
Treatment success Failure/Died/Lost to follow-up Not evaluated
Num
ber o
f cas
es (m
illio
ns)
6
Global
4
2
0
Africa The Americas
Eastern Mediterranean Europe
South-East Asia Western Pacific
2000 2006 2012 2018
Num
ber o
f cas
es (m
illio
ns)
3
2
1
0
3
2
1
0
3
2
1
0 2000 2006 2012 2018
a Cohorts before 2012 included new cases only.
FIG. 5.29
Treatment outcomes for new and relapse TB cases, WHO regions and globally, 2018
85
76
76
82
84
89
91Eastern Mediterranean
Western Pacific
South-East Asia
Africa
Europe
The Americas
Global
0 25 50 75 100Percentage of cohort
Treatment success Failure
Lost to follow-up
Died
Not evaluated
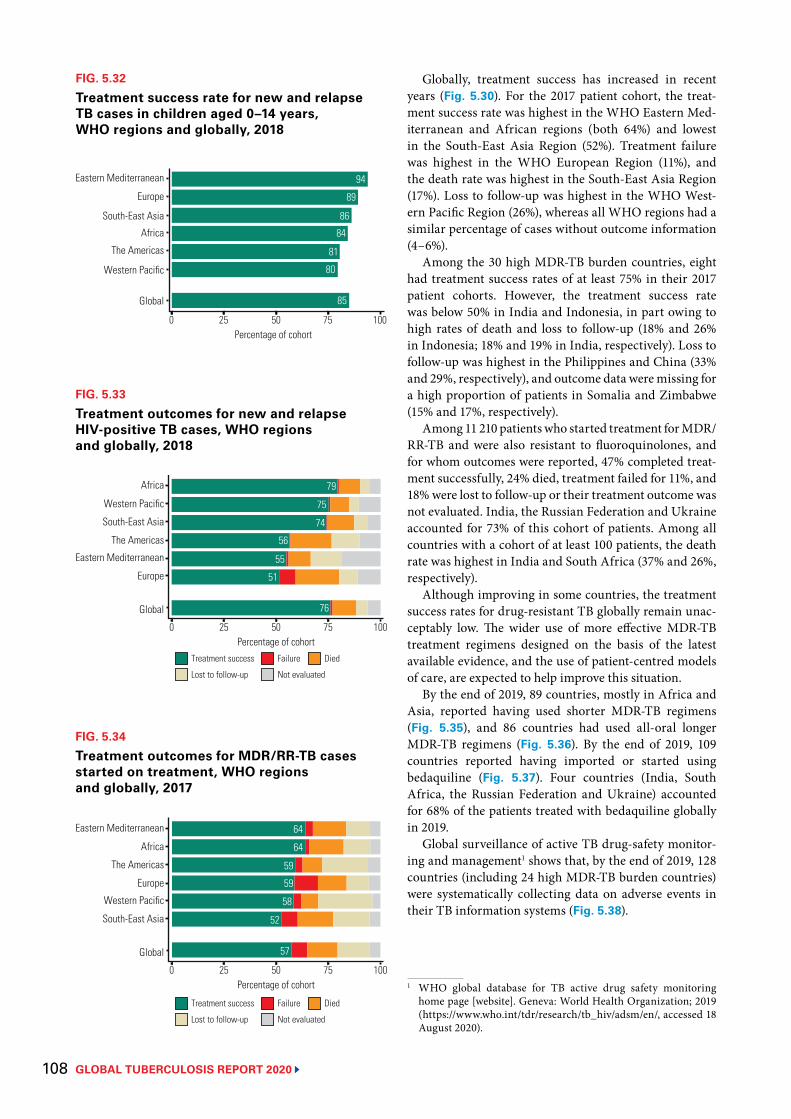
GLOBAL TUBERCULOSIS REPORT 2020 108
FIG. 5.32
Treatment success rate for new and relapse TB cases in children aged 0–14 years, WHO regions and globally, 2018
85
80
81
84
86
89
94Eastern Mediterranean
Europe
South-East Asia
Africa
The Americas
Western Pacific
Global
0 25 50 75 100Percentage of cohort
FIG. 5.33
Treatment outcomes for new and relapse HIV-positive TB cases, WHO regions and globally, 2018
76
51
55
56
74
75
79Africa
Western Pacific
South-East Asia
The Americas
Eastern Mediterranean
Europe
Global
0 25 50 75 100Percentage of cohort
Treatment success Failure
Lost to follow-up Not evaluated
Died
FIG. 5.34
Treatment outcomes for MDR/RR-TB cases started on treatment, WHO regions and globally, 2017
57
52
58
59
59
64
64Eastern Mediterranean
Africa
The Americas
Europe
Western Pacific
South-East Asia
Global
0 25 50 75 100Percentage of cohort
Treatment success Failure
Lost to follow-up Not evaluated
Died
Globally, treatment success has increased in recent years (Fig. 5.30). For the 2017 patient cohort, the treat-ment success rate was highest in the WHO Eastern Med-iterranean and African regions (both 64%) and lowest in the South-East Asia Region (52%). Treatment failure was highest in the WHO European Region (11%), and the death rate was highest in the South-East Asia Region (17%). Loss to follow-up was highest in the WHO West-ern Pacific Region (26%), whereas all WHO regions had a similar percentage of cases without outcome information (4–6%).
Among the 30 high MDR-TB burden countries, eight had treatment success rates of at least 75% in their 2017 patient cohorts. However, the treatment success rate was below 50% in India and Indonesia, in part owing to high rates of death and loss to follow-up (18% and 26% in Indonesia; 18% and 19% in India, respectively). Loss to follow-up was highest in the Philippines and China (33% and 29%, respectively), and outcome data were missing for a high proportion of patients in Somalia and Zimbabwe (15% and 17%, respectively).
Among 11 210 patients who started treatment for MDR/RR-TB and were also resistant to fluoroquinolones, and for whom outcomes were reported, 47% completed treat-ment successfully, 24% died, treatment failed for 11%, and 18% were lost to follow-up or their treatment outcome was not evaluated. India, the Russian Federation and Ukraine accounted for 73% of this cohort of patients. Among all countries with a cohort of at least 100 patients, the death rate was highest in India and South Africa (37% and 26%, respectively).
Although improving in some countries, the treatment success rates for drug-resistant TB globally remain unac-ceptably low. The wider use of more effective MDR-TB treatment regimens designed on the basis of the latest available evidence, and the use of patient-centred models of care, are expected to help improve this situation.
By the end of 2019, 89 countries, mostly in Africa and Asia, reported having used shorter MDR-TB regimens (Fig. 5.35), and 86 countries had used all-oral longer MDR-TB regimens (Fig. 5.36). By the end of 2019, 109 countries reported having imported or started using bedaquiline (Fig. 5.37). Four countries (India, South Africa, the Russian Federation and Ukraine) accounted for 68% of the patients treated with bedaquiline globally in 2019.
Global surveillance of active TB drug-safety monitor-ing and management1 shows that, by the end of 2019, 128 countries (including 24 high MDR-TB burden countries) were systematically collecting data on adverse events in their TB information systems (Fig. 5.38).
1 WHO global database for TB active drug safety monitoring home page [website]. Geneva: World Health Organization; 2019 (https://www.who.int/tdr/research/tb_hiv/adsm/en/, accessed 18 August 2020).
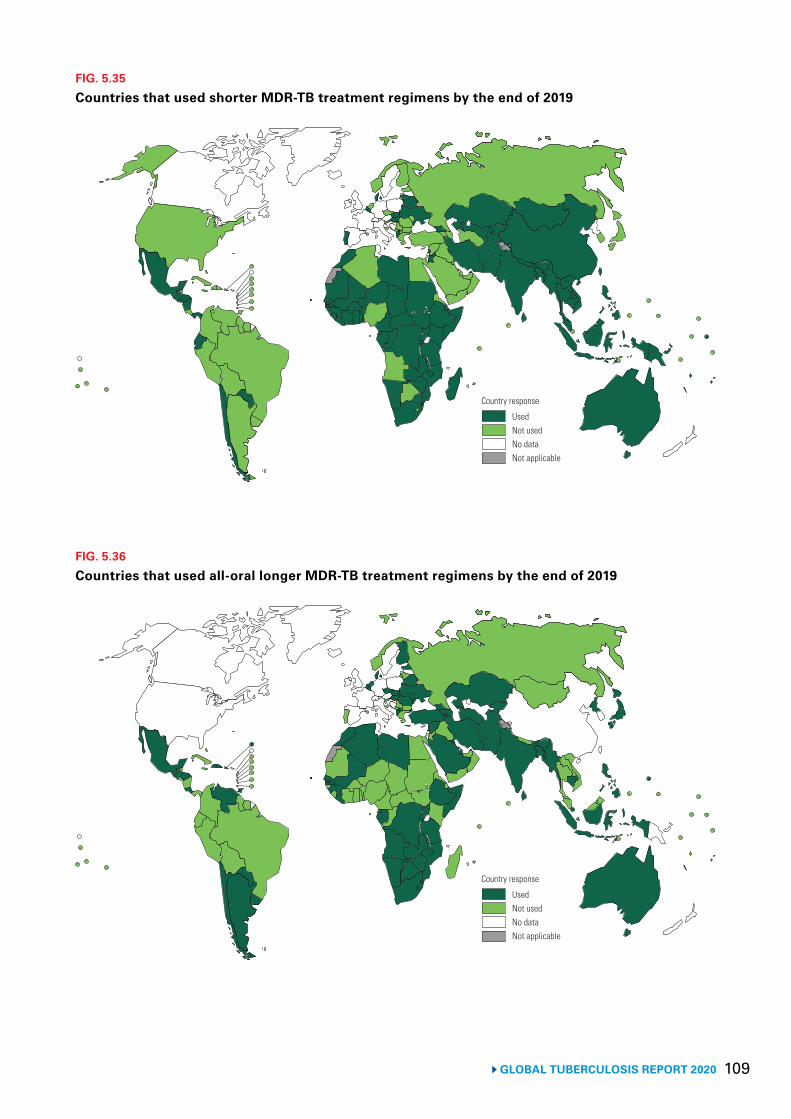
109 GLOBAL TUBERCULOSIS REPORT 2020
FIG. 5.35
Countries that used shorter MDR-TB treatment regimens by the end of 2019
Country response
UsedNot usedNo dataNot applicable
FIG. 5.36
Countries that used all-oral longer MDR-TB treatment regimens by the end of 2019
Country response
UsedNot usedNo dataNot applicable
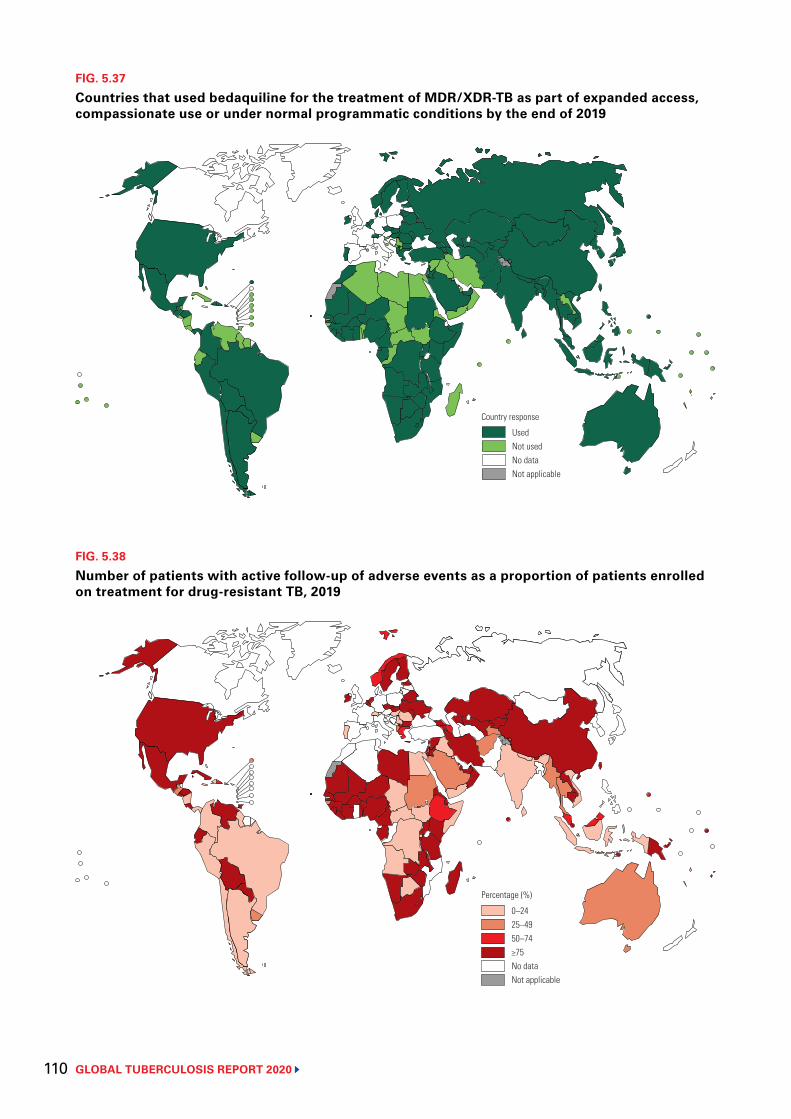
GLOBAL TUBERCULOSIS REPORT 2020 110
FIG. 5.38
Number of patients with active follow-up of adverse events as a proportion of patients enrolled on treatment for drug-resistant TB, 2019
0–2425–4950–74≥75No dataNot applicable
Percentage (%)
FIG. 5.37
Countries that used bedaquiline for the treatment of MDR/XDR-TB as part of expanded access, compassionate use or under normal programmatic conditions by the end of 2019
Country response
UsedNot usedNo dataNot applicable
111 GLOBAL TUBERCULOSIS REPORT 2020
References1 United Nations General Assembly. Resolution 73/3: Political declaration of the high-level meeting of the
General Assembly on the fight against tuberculosis. United Nations; 2018 (https://www.un.org/en/ga/search/view_doc.asp?symbol=A/RES/73/3, accessed 20 July 2020).
2 Joint Initiative “FIND. TREAT. ALL. #ENDTB” [website]. Geneva: World Health Organization; 2019 (https://www.who.int/tb/joint-initiative/en/, accessed 18 August 2020).
3 WHO and Global Fund sign cooperation agreement. Strategic Initiative to reach missed TB cases a critical component of grant [website]. Geneva: World Health Organization; 2019 (https://www.who.int/tb/features_archive/WHO_Global_Fund_agreement/en/, accessed 18 August 2020).
4 Public–private mix for TB prevention and care: a roadmap (WHO/CDS/TB/2018.32). Geneva: World Health Organization; 2018 (https://www.who.int/tb/publications/2018/PPMRoadmap/en/, accessed 18 August 2020).
5 Call to action for childhood TB [website]. Stop TB Partnership: 2011 (http://www.stoptb.org/getinvolved/ctb_cta.asp, accessed 18 August 2020).
6 Roadmap towards ending TB in children and adolescents. Geneva: World Health Organization; 2018 (https://www.who.int/tb/publications/2018/tb-childhoodroadmap/en/, accessed 18 August 2020).
7 Consolidated HIV strategic information guidelines: Driving impact through programme and management. Geneva: World Health Organization; 2020 (https://www.who.int/publications/i/item/consolidated-hiv-strategic-information-guidelines, accessed 26 August 2020).
8 Framework of indicators and targets for laboratory strengthening under the End TB Strategy (WHO/HTM/TB/2016.18). Geneva: World Health Organization; 2016 (https://www.who.int/tb/publications/labindicators/en/, accessed 18 August 2020).
9 ISO15189:2012 Medical laboratories – requirements for quality and competence. Geneva: International Standardisation Organisation; 2012 (https://www.iso.org/standard/56115.html, accessed 18 August 2020).
10 Lateral flow urine lipoarabinomannan assay (LF-LAM) for the diagnosis of active tuberculosis in people living with HIV. Policy update 2019. Geneva: World Health Organization; 2019 (https://apps.who.int/iris/bitstream/handle/10665/329479/9789241550604-eng.pdf?sequence=1&isAllowed=y&ua=1, accessed 26 August 2020).
11 WHO treatment guidelines for drug-resistant tuberculosis (2016 update) (WHO/HTM/TB/2016.04). Geneva: World Health Organization; 2016 (https://apps.who.int/iris/bitstream/handle/10665/250125/9789241549639-eng.pdf?sequence=1, accessed 18 August 2020).
12 WHA62.15. Prevention and control of multidrug-resistant tuberculosis and extensively drug-resistant tuberculosis. Sixty-second World Health Assembly. Resolutions and decisions (annexes). Geneva: World Health Organization; 2009 (https://apps.who.int/gb/ebwha/pdf_files/WHA62-REC1/WHA62_REC1-en.pdf, accessed 18 August 2020).
13 Electronic recording and reporting for tuberculosis care and control. Geneva: World Health Organization; 2012 (https://www.who.int/tb/publications/electronic_recording_reporting/en/, accessed 18 August 2020).
14 Analysis and use of health facility data [website]. Geneva: World Health Organization; 2019 (https://www.who.int/healthinfo/tools_data_analysis_routine_facility/en/, accessed 18 August 2020).
15 Understanding and using tuberculosis data (WHO/HTM/TB/2014.09). Geneva: World Health Organization Global Task Force on TB Impact Measurement; 2014 (https://www.who.int/tb/publications/understanding_and_using_tb_data/en/, accessed 20 July 2020).
16 Standards and benchmarks for tuberculosis surveillance and vital registration systems: checklist and user guide (WHO/HTM/TB/2014.02). Geneva: World Health Organization; 2014 (https://www.who.int/tb/publications/standardsandbenchmarks/en/, accessed 18 August 2020).
17 Definitions and reporting framework for tuberculosis – 2013 revision (updated December 2014) (WHO/HTM/TB/2013.2). Geneva: World Health Organization; 2013 (https://apps.who.int/iris/bitstream/handle/10665/79199/9789241505345_eng.pdf;jsessionid=FD522CF3B90C25716F96288BFDEA6C75?sequence=1, accessed 18 August 2020).
18 Assessing tuberculosis under-reporting through inventory studies (WHO/HTM/TB/2012.12). Geneva: World Health Organization; 2012 (https://www.who.int/tb/publications/inventory_studies/en/, accessed 18 August 2020).
19 Onozaki I, Law I. National TB prevalence surveys: 2009–2015. Geneva: TB Monitoring & Evaluation Global TB Programme, World Health Organization; 2016 (https://www.who.int/tb/advisory_bodies/impact_measurement_taskforce/meetings/tf6_p06_prevalence_surveys_2009_2015.pdf, accessed 18 August 2020).
GLOBAL TUBERCULOSIS REPORT 2020 112
20 Systematic screening for active tuberculosis: principles and recommendations (WHO/HTM/TB.2013.04). Geneva: World Health Organization; 2013 (https://www.who.int/tb/tbscreening/en/, accessed 18 August 2020).
21 ENGAGE-TB approach: operational guidance: integrating community-based tuberculosis activities into the work of nongovernmental and other civil society organizations (WHO/HTM/TB/2012.8). Geneva: World Health Organization; 2012 (https://www.who.int/tb/publications/2012/engage_tb_policy/en/, accessed 18 August 2020).
22 WHO guideline on health policy and system support to optimize community health worker programmes. Geneva: World Health Organization; 2018 (https://www.who.int/hrh/resources/health-policy-system-support-hw-programmes/en/, accessed 18 August 2020).
23 Community-based health care, including outreach and campaigns, in the context of the COVID-19 pandemic: interim guidance. Geneva: World Health Organization; 2020 (https://www.who.int/publications/i/item/community-based-health-care-including-outreach-and-campaigns-in-the-context-of-the-covid-19-pandemic, accessed 27 July 2020).
24 AIDS info [website]. 2020 (http://aidsinfo.unaids.org/, accessed 15 July 2020).

113 GLOBAL TUBERCULOSIS REPORT 2020
GLOBAL TUBERCULOSIS REPORT 2020 114
A family affected by TB outside their home in Haiti.Jake Lyell/Alamy
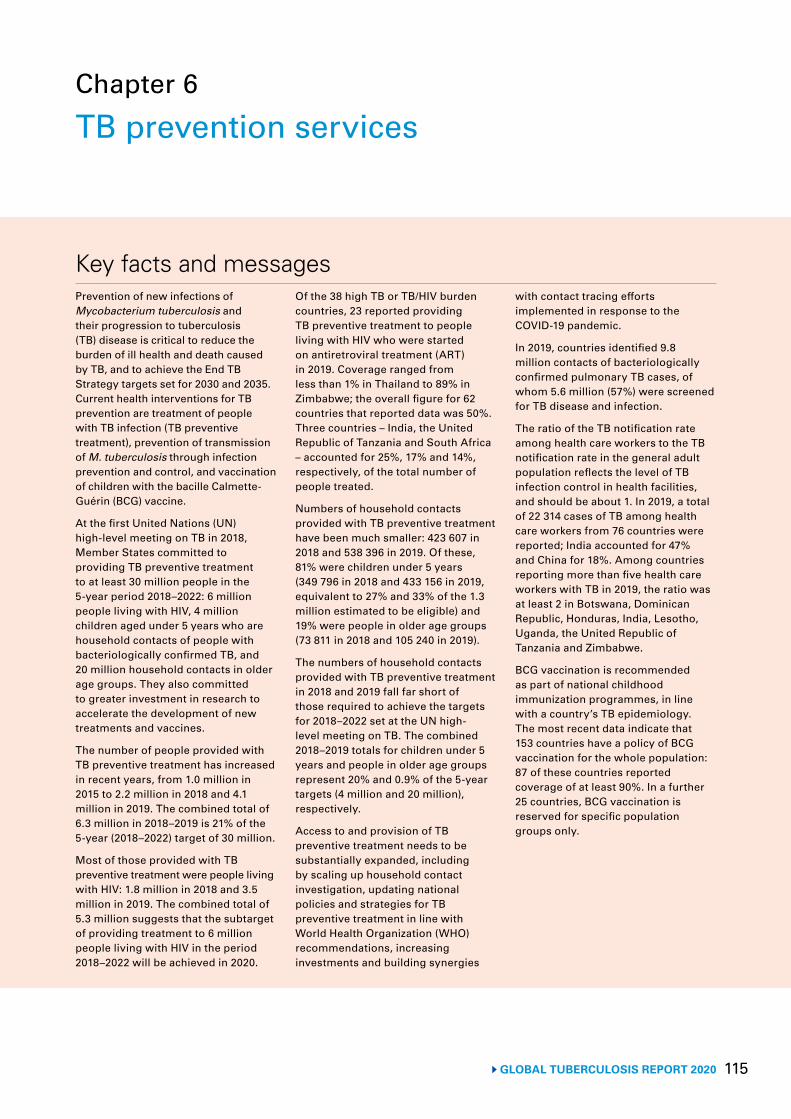
115 GLOBAL TUBERCULOSIS REPORT 2020
Chapter 6
TB prevention services
Key facts and messagesPrevention of new infections of Mycobacterium tuberculosis and their progression to tuberculosis (TB) disease is critical to reduce the burden of ill health and death caused by TB, and to achieve the End TB Strategy targets set for 2030 and 2035. Current health interventions for TB prevention are treatment of people with TB infection (TB preventive treatment), prevention of transmission of M. tuberculosis through infection prevention and control, and vaccination of children with the bacille Calmette-Guérin (BCG) vaccine.
At the first United Nations (UN) high-level meeting on TB in 2018, Member States committed to providing TB preventive treatment to at least 30 million people in the 5-year period 2018–2022: 6 million people living with HIV, 4 million children aged under 5 years who are household contacts of people with bacteriologically confirmed TB, and 20 million household contacts in older age groups. They also committed to greater investment in research to accelerate the development of new treatments and vaccines.
The number of people provided with TB preventive treatment has increased in recent years, from 1.0 million in 2015 to 2.2 million in 2018 and 4.1 million in 2019. The combined total of 6.3 million in 2018–2019 is 21% of the 5-year (2018–2022) target of 30 million.
Most of those provided with TB preventive treatment were people living with HIV: 1.8 million in 2018 and 3.5 million in 2019. The combined total of 5.3 million suggests that the subtarget of providing treatment to 6 million people living with HIV in the period 2018–2022 will be achieved in 2020.
Of the 38 high TB or TB/HIV burden countries, 23 reported providing TB preventive treatment to people living with HIV who were started on antiretroviral treatment (ART) in 2019. Coverage ranged from less than 1% in Thailand to 89% in Zimbabwe; the overall figure for 62 countries that reported data was 50%. Three countries – India, the United Republic of Tanzania and South Africa – accounted for 25%, 17% and 14%, respectively, of the total number of people treated.
Numbers of household contacts provided with TB preventive treatment have been much smaller: 423 607 in 2018 and 538 396 in 2019. Of these, 81% were children under 5 years (349 796 in 2018 and 433 156 in 2019, equivalent to 27% and 33% of the 1.3 million estimated to be eligible) and 19% were people in older age groups (73 811 in 2018 and 105 240 in 2019).
The numbers of household contacts provided with TB preventive treatment in 2018 and 2019 fall far short of those required to achieve the targets for 2018–2022 set at the UN high-level meeting on TB. The combined 2018–2019 totals for children under 5 years and people in older age groups represent 20% and 0.9% of the 5-year targets (4 million and 20 million), respectively.
Access to and provision of TB preventive treatment needs to be substantially expanded, including by scaling up household contact investigation, updating national policies and strategies for TB preventive treatment in line with World Health Organization (WHO) recommendations, increasing investments and building synergies
with contact tracing efforts implemented in response to the COVID-19 pandemic.
In 2019, countries identified 9.8 million contacts of bacteriologically confirmed pulmonary TB cases, of whom 5.6 million (57%) were screened for TB disease and infection.
The ratio of the TB notification rate among health care workers to the TB notification rate in the general adult population reflects the level of TB infection control in health facilities, and should be about 1. In 2019, a total of 22 314 cases of TB among health care workers from 76 countries were reported; India accounted for 47% and China for 18%. Among countries reporting more than five health care workers with TB in 2019, the ratio was at least 2 in Botswana, Dominican Republic, Honduras, India, Lesotho, Uganda, the United Republic of Tanzania and Zimbabwe.
BCG vaccination is recommended as part of national childhood immunization programmes, in line with a country’s TB epidemiology. The most recent data indicate that 153 countries have a policy of BCG vaccination for the whole population: 87 of these countries reported coverage of at least 90%. In a further 25 countries, BCG vaccination is reserved for specific population groups only.
GLOBAL TUBERCULOSIS REPORT 2020 116
Prevention of new infections of Mycobacterium tuberculosis and action to reduce progression to tuberculosis (TB) disease are critical to reduce the burden of ill health and death caused by TB, and to achieve the End TB Strategy targets set for 2030 and 2035. The targets of an 80% reduc-tion in TB incidence from the 2015 level by 2030, and a 90% reduction by 2035, require a historically unprece-dented acceleration in the rate at which TB incidence falls after 2025 (Chapter 2).
Achieving this accelerated rate (which averages 17% per year between 2025 and 2035) will require substan-tial reductions in the probability of progression from TB infection to TB disease among the approximately 2 billion people already infected worldwide (1).1 Health care interventions that could help to cut the risk of progression from infection to TB disease include new diagnostic tests that are better at predicting who is at risk of developing TB disease, more effective treatments for people infected with M. tuberculosis, and development of a vaccine to pre-vent reactivation of TB in adults. Action on the broader determinants of TB could also cut the risk, as discussed in Chapter 8.
Currently, three major categories of health care inter-ventions are available for TB prevention:
▶ TB preventive treatment; ▶ prevention of transmission of M. tuberculosis through
infection prevention and control; and ▶ vaccination of children with the bacille Calmette-
Guérin (BCG) vaccine.
At the first United Nations (UN) high-level meeting on TB, held in 2018, Member States made a range of com-mitments to accelerate progress towards ending the TB epidemic (3). This included setting a new global target of providing TB preventive treatment to at least 30 million people in the 5-year period 2018–2022: 6 million people living with HIV, 4 million children aged under 5 years who are household contacts of people diagnosed with TB and 20 million household contacts in older age groups. Member States also committed to greater investment in research to accelerate the development of new treatments and vaccines.
The recent availability of shorter drug regimens for TB preventive treatment, combined with the global targets, provide an opportunity to galvanize national and global efforts to scale up effective preventive interventions. There are also now possibilities to build synergies with contact tracing efforts implemented in response to the COVID-19 pandemic.
This chapter presents and discusses the latest data about progress in TB preventive treatment (Section 6.1), infection prevention and control (Section 6.2), and pro-vision of BCG vaccination (Section 6.3). Particular atten-tion is given to the 30 high TB burden countries and the 30 high TB/HIV burden countries.2 1 The lifetime risk is about 5–10% (2). 2 The lists of high TB burden countries defined by WHO for the
period 2016–2020 are explained in Annex 2.
6.1 TB preventive treatment The World Health Organization (WHO) guidance for TB preventive treatment recommends systematic treatment for three high-risk population groups: household contacts of people diagnosed with bacteriologically confirmed pulmonary TB, people living with HIV and clinical risk groups. Updated recommendations were published in March 2020, alongside operational guidance and other implementation aids to support the rapid uptake of rec-ommendations at country level (Box 6.1).
Recommended options for TB preventive treatment include a weekly dose of rifapentine and isoniazid for 3 months (3HP), a daily dose of rifampicin plus isoniazid for 3 months (3HR), a daily dose of rifapentine plus iso-niazid for 1 month (1HP), a daily dose of rifampicin for 4 months (4R) and a daily dose of isoniazid for 6 months (6H) or longer.
This section presents the latest data (for 2019) report-ed to WHO on provision of TB preventive treatment, and data available for previous years. Data are presented over-all and also for the priority groups for which targets were set at the UN high-level meeting on TB: people living with HIV, household contacts aged under 5 years and house-hold contacts in older age groups.
The period for which WHO has gathered data for these groups reflects the evolution of WHO guidance. Initial-ly, attention was given to monitoring the provision of TB preventive treatment to people living with HIV, and data are available for 2005–2019. In 2016, this was expanded to household contacts aged under 5 years and, in 2019, it was expanded to all age groups; for these two groups, data are available for 2015–2019 and 2018–2019, respectively.
6.1.1 Number of people provided with TB preventive treatment, 2015–2019
The number of people provided with TB preventive treat-ment has increased considerably in recent years, from 1.0 million in 2015, to 2.2 million in 2018 and 4.1 mil-lion in 2019 (Fig. 6.1). The combined total of 6.3 million in 2018–2019 is 21% of the 5-year (2018–2022) target of 30 million (Fig. 6.2).
Most of those provided with TB preventive treatment were people living with HIV: 1.8 million in 2018 and 3.5 million in 2019. The combined total for 2018–2019 of 5.3 million suggests that the subtarget of providing treat-ment to 6 million people living with HIV in the period 2018–2022 could be achieved in 2020 (Fig. 6.2).
Numbers of household contacts provided with TB preventive treatment have been much smaller (Fig. 6.1), although they are growing (423 607 in 2018 and 538 396 in 2019). In 2019, 433 196 children aged under 5 years were provided with TB preventive treatment, up from 349 796 in 2018 and a large increase from 87 242 in 2015. For other age groups, the number was 105 240 in 2019, up from 73 811 in 2018 (the first year for which global data are available).
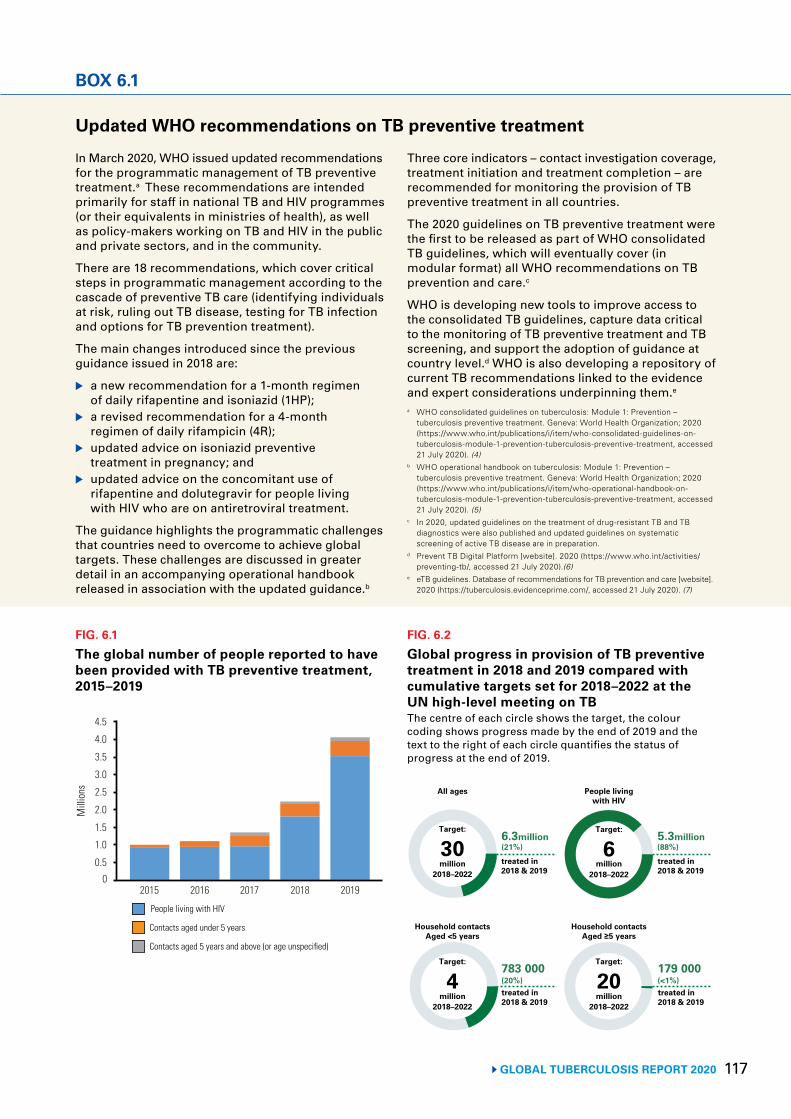
117 GLOBAL TUBERCULOSIS REPORT 2020
Updated WHO recommendations on TB preventive treatment
In March 2020, WHO issued updated recommendations for the programmatic management of TB preventive treatment.a These recommendations are intended primarily for staff in national TB and HIV programmes (or their equivalents in ministries of health), as well as policy-makers working on TB and HIV in the public and private sectors, and in the community.
There are 18 recommendations, which cover critical steps in programmatic management according to the cascade of preventive TB care (identifying individuals at risk, ruling out TB disease, testing for TB infection and options for TB prevention treatment).
The main changes introduced since the previous guidance issued in 2018 are:
▶ a new recommendation for a 1-month regimen of daily rifapentine and isoniazid (1HP);
▶ a revised recommendation for a 4-month regimen of daily rifampicin (4R);
▶ updated advice on isoniazid preventive treatment in pregnancy; and
▶ updated advice on the concomitant use of rifapentine and dolutegravir for people living with HIV who are on antiretroviral treatment.
The guidance highlights the programmatic challenges that countries need to overcome to achieve global targets. These challenges are discussed in greater detail in an accompanying operational handbook released in association with the updated guidance.b
Three core indicators – contact investigation coverage, treatment initiation and treatment completion – are recommended for monitoring the provision of TB preventive treatment in all countries.
The 2020 guidelines on TB preventive treatment were the first to be released as part of WHO consolidated TB guidelines, which will eventually cover (in modular format) all WHO recommendations on TB prevention and care.c
WHO is developing new tools to improve access to the consolidated TB guidelines, capture data critical to the monitoring of TB preventive treatment and TB screening, and support the adoption of guidance at country level.d WHO is also developing a repository of current TB recommendations linked to the evidence and expert considerations underpinning them.e
a WHO consolidated guidelines on tuberculosis: Module 1: Prevention – tuberculosis preventive treatment. Geneva: World Health Organization; 2020 (https://www.who.int/publications/i/item/who-consolidated-guidelines-on-tuberculosis-module-1-prevention-tuberculosis-preventive-treatment, accessed 21 July 2020). (4)
b WHO operational handbook on tuberculosis: Module 1: Prevention – tuberculosis preventive treatment. Geneva: World Health Organization; 2020 (https://www.who.int/publications/i/item/who-operational-handbook-on-tuberculosis-module-1-prevention-tuberculosis-preventive-treatment, accessed 21 July 2020). (5)
c In 2020, updated guidelines on the treatment of drug-resistant TB and TB diagnostics were also published and updated guidelines on systematic screening of active TB disease are in preparation.
d Prevent TB Digital Platform [website]. 2020 (https://www.who.int/activities/preventing-tb/, accessed 21 July 2020).(6)
e eTB guidelines. Database of recommendations for TB prevention and care [website]. 2020 (https://tuberculosis.evidenceprime.com/, accessed 21 July 2020). (7)
BOX 6.1
FIG. 6.1
The global number of people reported to have been provided with TB preventive treatment, 2015–2019
Mill
ions
2015 2016 2017 2018 2019
1.5
0
4.5
People living with HIV
Contacts aged under 5 years
3.0
Contacts aged 5 years and above (or age unspecified)
0.5
2.0
1.0
2.5
4.0
3.5
FIG. 6.2
Global progress in provision of TB preventive treatment in 2018 and 2019 compared with cumulative targets set for 2018–2022 at the UN high-level meeting on TBThe centre of each circle shows the target, the colour coding shows progress made by the end of 2019 and the text to the right of each circle quantifies the status of progress at the end of 2019.
6.3million(21%)
5.3million(88%)
783 000(20%)
179 000(<1%)
All ages People livingwith HIV
Household contactsAged <5 years
Household contactsAged ≥5 years
treated in2018 & 2019
treated in2018 & 2019
treated in2018 & 2019
treated in2018 & 2019
Target:
30million
2018–2022
Target:
6million
2018–2022
Target:
4million
2018–2022
Target:
20million
2018–2022
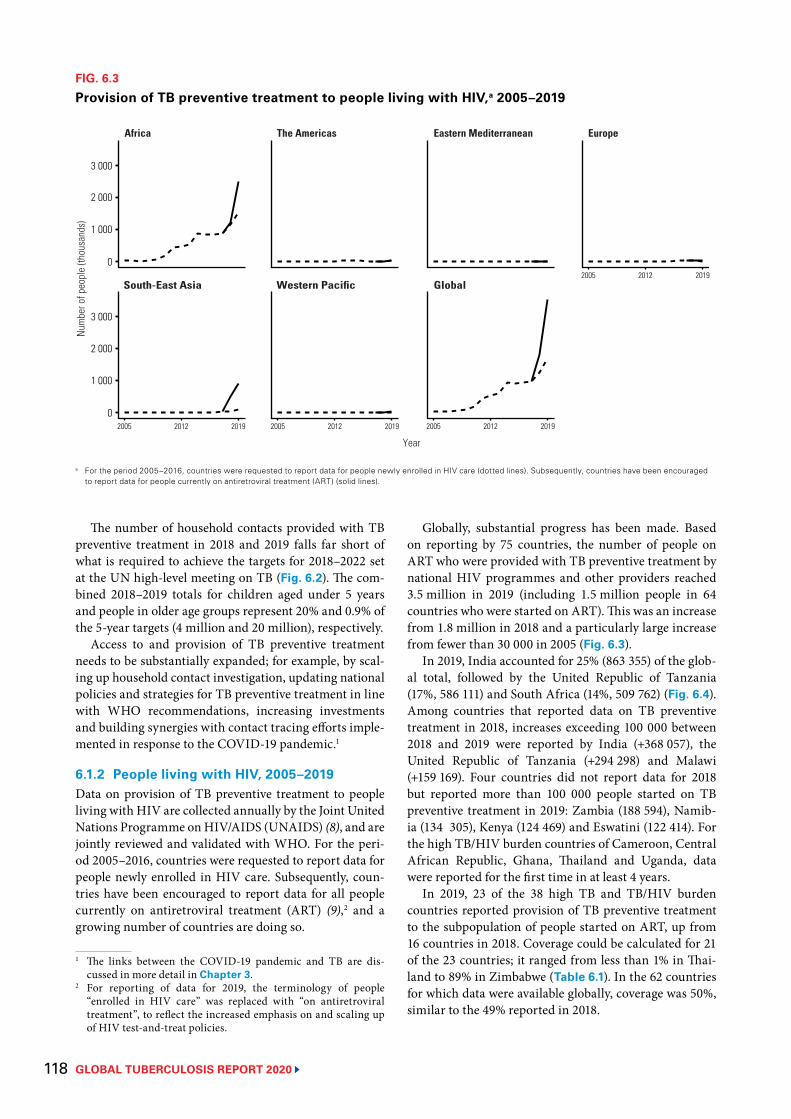
GLOBAL TUBERCULOSIS REPORT 2020 118
The number of household contacts provided with TB preventive treatment in 2018 and 2019 falls far short of what is required to achieve the targets for 2018–2022 set at the UN high-level meeting on TB (Fig. 6.2). The com-bined 2018–2019 totals for children aged under 5 years and people in older age groups represent 20% and 0.9% of the 5-year targets (4 million and 20 million), respectively.
Access to and provision of TB preventive treatment needs to be substantially expanded; for example, by scal-ing up household contact investigation, updating national policies and strategies for TB preventive treatment in line with WHO recommendations, increasing investments and building synergies with contact tracing efforts imple-mented in response to the COVID-19 pandemic.1
6.1.2 People living with HIV, 2005–2019Data on provision of TB preventive treatment to people living with HIV are collected annually by the Joint United Nations Programme on HIV/AIDS (UNAIDS) (8), and are jointly reviewed and validated with WHO. For the peri-od 2005–2016, countries were requested to report data for people newly enrolled in HIV care. Subsequently, coun-tries have been encouraged to report data for all people currently on antiretroviral treatment (ART) (9),2 and a growing number of countries are doing so.
1 The links between the COVID-19 pandemic and TB are dis-cussed in more detail in Chapter 3.
2 For reporting of data for 2019, the terminology of people “enrolled in HIV care” was replaced with “on antiretroviral treatment”, to reflect the increased emphasis on and scaling up of HIV test-and-treat policies.
Globally, substantial progress has been made. Based on reporting by 75 countries, the number of people on ART who were provided with TB preventive treatment by national HIV programmes and other providers reached 3.5 million in 2019 (including 1.5 million people in 64 countries who were started on ART). This was an increase from 1.8 million in 2018 and a particularly large increase from fewer than 30 000 in 2005 (Fig. 6.3).
In 2019, India accounted for 25% (863 355) of the glob-al total, followed by the United Republic of Tanzania (17%, 586 111) and South Africa (14%, 509 762) (Fig. 6.4). Among countries that reported data on TB preventive treatment in 2018, increases exceeding 100 000 between 2018 and 2019 were reported by India (+368 057), the United Republic of Tanzania (+294 298) and Malawi (+159 169). Four countries did not report data for 2018 but reported more than 100 000 people started on TB preventive treatment in 2019: Zambia (188 594), Namib-ia (134 305), Kenya (124 469) and Eswatini (122 414). For the high TB/HIV burden countries of Cameroon, Central African Republic, Ghana, Thailand and Uganda, data were reported for the first time in at least 4 years.
In 2019, 23 of the 38 high TB and TB/HIV burden countries reported provision of TB preventive treatment to the subpopulation of people started on ART, up from 16 countries in 2018. Coverage could be calculated for 21 of the 23 countries; it ranged from less than 1% in Thai-land to 89% in Zimbabwe (Table 6.1). In the 62 countries for which data were available globally, coverage was 50%, similar to the 49% reported in 2018.
FIG. 6.3
Provision of TB preventive treatment to people living with HIV,a 2005–2019
a For the period 2005–2016, countries were requested to report data for people newly enrolled in HIV care (dotted lines). Subsequently, countries have been encouraged to report data for people currently on antiretroviral treatment (ART) (solid lines).
Num
ber o
f peo
ple
(thou
sand
s)
2005 2012 2019
Year
South-East Asia Western Pacific Global
3 000
0
3 000
0 2005 2012 2019 2005 2012 2019
2005 2012 2019
Africa The Americas Eastern Mediterranean Europe
2 000
1 000
2 000
1 000
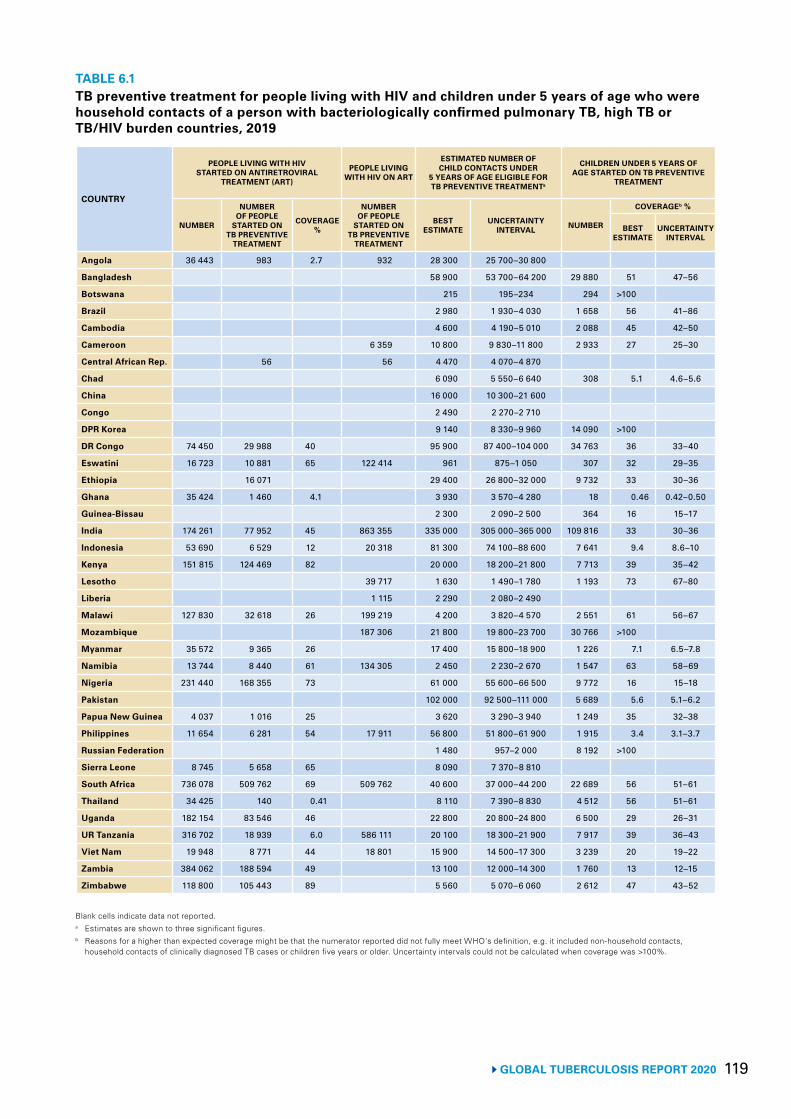
119 GLOBAL TUBERCULOSIS REPORT 2020
TABLE 6.1 TB preventive treatment for people living with HIV and children under 5 years of age who were household contacts of a person with bacteriologically confirmed pulmonary TB, high TB or TB/HIV burden countries, 2019
COUNTRY
PEOPLE LIVING WITH HIV STARTED ON ANTIRETROVIRAL
TREATMENT (ART)
PEOPLE LIVING WITH HIV ON ART
ESTIMATED NUMBER OF CHILD CONTACTS UNDER
5 YEARS OF AGE ELIGIBLE FOR TB PREVENTIVE TREATMENTa
CHILDREN UNDER 5 YEARS OF AGE STARTED ON TB PREVENTIVE
TREATMENT
NUMBER
NUMBER OF PEOPLE
STARTED ON TB PREVENTIVE
TREATMENT
COVERAGE %
NUMBER OF PEOPLE
STARTED ON TB PREVENTIVE
TREATMENT
BEST ESTIMATE
UNCERTAINTY INTERVAL NUMBER
COVERAGEb %
BEST ESTIMATE
UNCERTAINTY INTERVAL
Angola 36 443 983 2.7 932 28 300 25 700–30 800
Bangladesh 58 900 53 700–64 200 29 880 51 47–56
Botswana 215 195–234 294 >100
Brazil 2 980 1 930–4 030 1 658 56 41–86
Cambodia 4 600 4 190–5 010 2 088 45 42–50
Cameroon 6 359 10 800 9 830–11 800 2 933 27 25–30
Central African Rep. 56 56 4 470 4 070–4 870
Chad 6 090 5 550–6 640 308 5.1 4.6–5.6
China 16 000 10 300–21 600
Congo 2 490 2 270–2 710
DPR Korea 9 140 8 330–9 960 14 090 >100
DR Congo 74 450 29 988 40 95 900 87 400–104 000 34 763 36 33–40
Eswatini 16 723 10 881 65 122 414 961 875–1 050 307 32 29–35
Ethiopia 16 071 29 400 26 800–32 000 9 732 33 30–36
Ghana 35 424 1 460 4.1 3 930 3 570–4 280 18 0.46 0.42–0.50
Guinea-Bissau 2 300 2 090–2 500 364 16 15–17
India 174 261 77 952 45 863 355 335 000 305 000–365 000 109 816 33 30–36
Indonesia 53 690 6 529 12 20 318 81 300 74 100–88 600 7 641 9.4 8.6–10
Kenya 151 815 124 469 82 20 000 18 200–21 800 7 713 39 35–42
Lesotho 39 717 1 630 1 490–1 780 1 193 73 67–80
Liberia 1 115 2 290 2 080–2 490
Malawi 127 830 32 618 26 199 219 4 200 3 820–4 570 2 551 61 56–67
Mozambique 187 306 21 800 19 800–23 700 30 766 >100
Myanmar 35 572 9 365 26 17 400 15 800–18 900 1 226 7.1 6.5–7.8
Namibia 13 744 8 440 61 134 305 2 450 2 230–2 670 1 547 63 58–69
Nigeria 231 440 168 355 73 61 000 55 600–66 500 9 772 16 15–18
Pakistan 102 000 92 500–111 000 5 689 5.6 5.1–6.2
Papua New Guinea 4 037 1 016 25 3 620 3 290–3 940 1 249 35 32–38
Philippines 11 654 6 281 54 17 911 56 800 51 800–61 900 1 915 3.4 3.1–3.7
Russian Federation 1 480 957–2 000 8 192 >100
Sierra Leone 8 745 5 658 65 8 090 7 370–8 810
South Africa 736 078 509 762 69 509 762 40 600 37 000–44 200 22 689 56 51–61
Thailand 34 425 140 0.41 8 110 7 390–8 830 4 512 56 51–61
Uganda 182 154 83 546 46 22 800 20 800–24 800 6 500 29 26–31
UR Tanzania 316 702 18 939 6.0 586 111 20 100 18 300–21 900 7 917 39 36–43
Viet Nam 19 948 8 771 44 18 801 15 900 14 500–17 300 3 239 20 19–22
Zambia 384 062 188 594 49 13 100 12 000–14 300 1 760 13 12–15
Zimbabwe 118 800 105 443 89 5 560 5 070–6 060 2 612 47 43–52
Blank cells indicate data not reported.a Estimates are shown to three significant figures.b Reasons for a higher than expected coverage might be that the numerator reported did not fully meet WHO's definition, e.g. it included non-household contacts,
household contacts of clinically diagnosed TB cases or children five years or older. Uncertainty intervals could not be calculated when coverage was >100%.
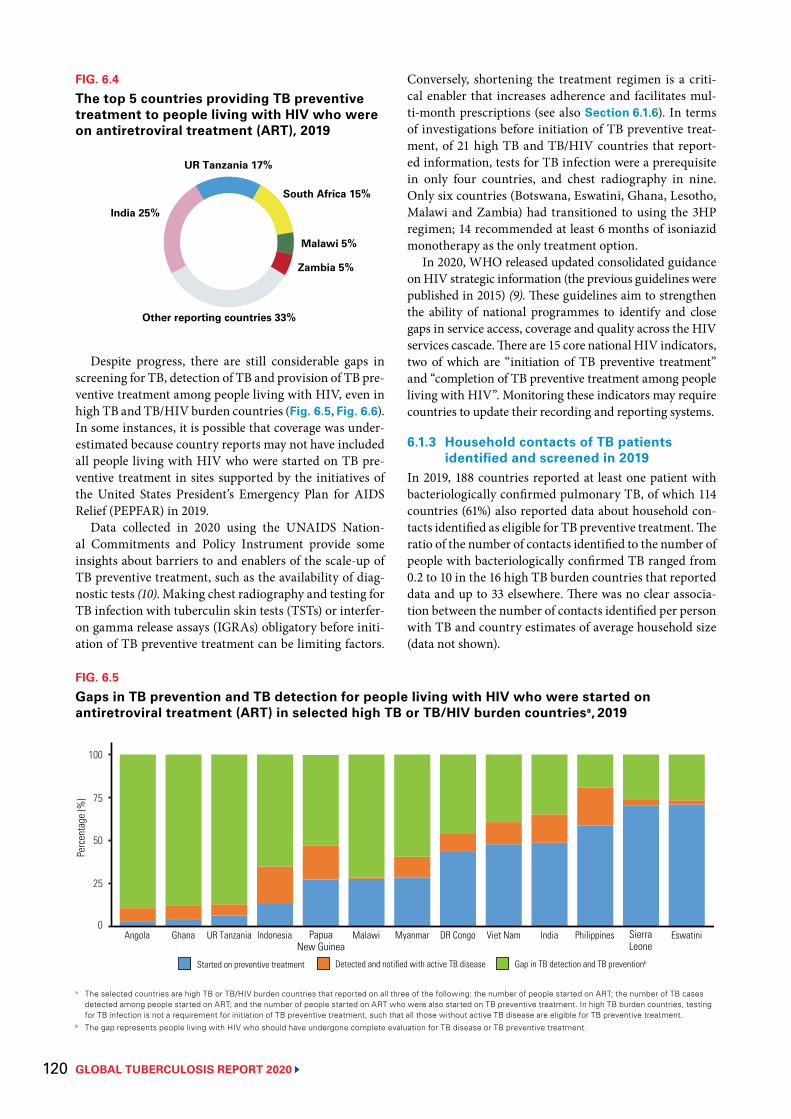
GLOBAL TUBERCULOSIS REPORT 2020 120
Despite progress, there are still considerable gaps in screening for TB, detection of TB and provision of TB pre-ventive treatment among people living with HIV, even in high TB and TB/HIV burden countries (Fig. 6.5, Fig. 6.6). In some instances, it is possible that coverage was under-estimated because country reports may not have included all people living with HIV who were started on TB pre-ventive treatment in sites supported by the initiatives of the United States President’s Emergency Plan for AIDS Relief (PEPFAR) in 2019.
Data collected in 2020 using the UNAIDS Nation-al Commitments and Policy Instrument provide some insights about barriers to and enablers of the scale-up of TB preventive treatment, such as the availability of diag-nostic tests (10). Making chest radiography and testing for TB infection with tuberculin skin tests (TSTs) or interfer-on gamma release assays (IGRAs) obligatory before initi-ation of TB preventive treatment can be limiting factors.
Conversely, shortening the treatment regimen is a criti-cal enabler that increases adherence and facilitates mul-ti-month prescriptions (see also Section 6.1.6). In terms of investigations before initiation of TB preventive treat-ment, of 21 high TB and TB/HIV countries that report-ed information, tests for TB infection were a prerequisite in only four countries, and chest radiography in nine. Only six countries (Botswana, Eswatini, Ghana, Lesotho, Malawi and Zambia) had transitioned to using the 3HP regimen; 14 recommended at least 6 months of isoniazid monotherapy as the only treatment option.
In 2020, WHO released updated consolidated guidance on HIV strategic information (the previous guidelines were published in 2015) (9). These guidelines aim to strengthen the ability of national programmes to identify and close gaps in service access, coverage and quality across the HIV services cascade. There are 15 core national HIV indicators, two of which are “initiation of TB preventive treatment” and “completion of TB preventive treatment among people living with HIV”. Monitoring these indicators may require countries to update their recording and reporting systems.
6.1.3 Household contacts of TB patients identified and screened in 2019
In 2019, 188 countries reported at least one patient with bacteriologically confirmed pulmonary TB, of which 114 countries (61%) also reported data about household con-tacts identified as eligible for TB preventive treatment. The ratio of the number of contacts identified to the number of people with bacteriologically confirmed TB ranged from 0.2 to 10 in the 16 high TB burden countries that reported data and up to 33 elsewhere. There was no clear associa-tion between the number of contacts identified per person with TB and country estimates of average household size (data not shown).
FIG. 6.4
The top 5 countries providing TB preventive treatment to people living with HIV who were on antiretroviral treatment (ART), 2019
FIG. 6.5
Gaps in TB prevention and TB detection for people living with HIV who were started on antiretroviral treatment (ART) in selected high TB or TB/HIV burden countriesa, 2019
Started on preventive treatment Detected and notified with active TB disease Gap in TB detection and TB preventionb
Perc
enta
ge (%
)
50
25
0
100
75
Angola Ghana UR Tanzania Indonesia Malawi Myanmar DR Congo Viet Nam India Philippines EswatiniPapuaNew Guinea
SierraLeone
a The selected countries are high TB or TB/HIV burden countries that reported on all three of the following: the number of people started on ART; the number of TB cases detected among people started on ART; and the number of people started on ART who were also started on TB preventive treatment. In high TB burden countries, testing for TB infection is not a requirement for initiation of TB preventive treatment, such that all those without active TB disease are eligible for TB preventive treatment.
b The gap represents people living with HIV who should have undergone complete evaluation for TB disease or TB preventive treatment.
UR Tanzania 17%
South Africa 15%
Malawi 5%
Zambia 5%
India 25%
Other reporting countries 33%
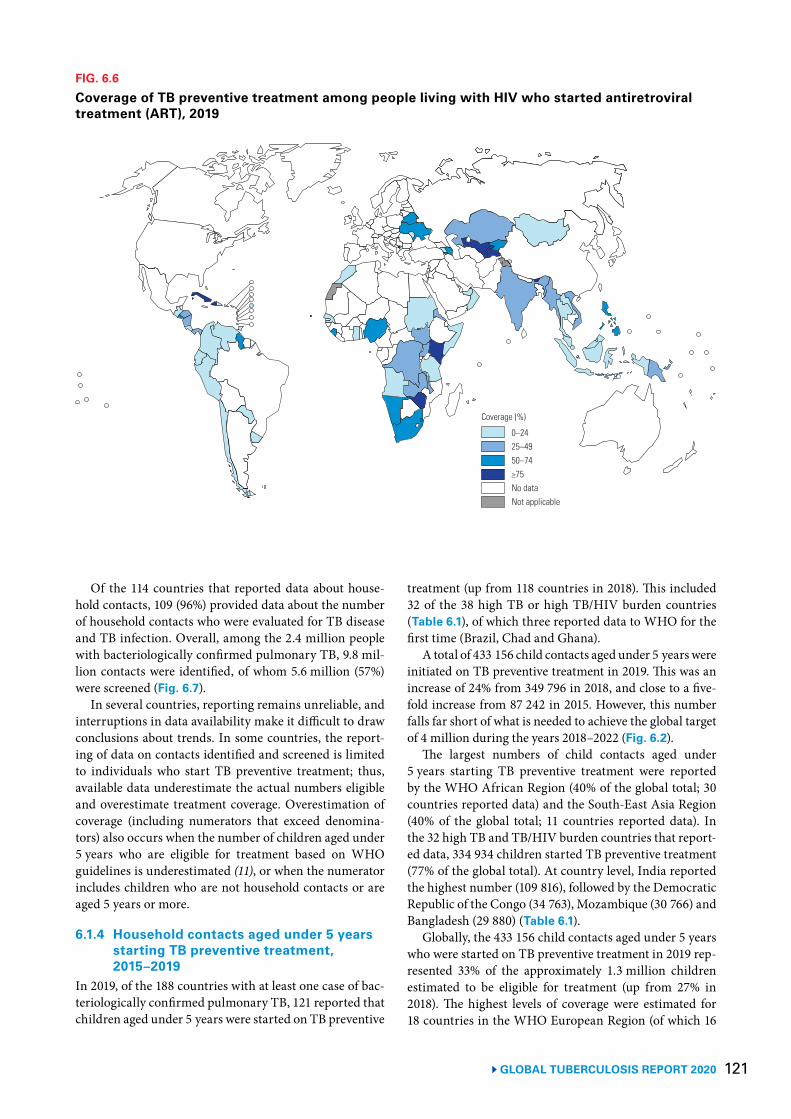
121 GLOBAL TUBERCULOSIS REPORT 2020
Of the 114 countries that reported data about house-hold contacts, 109 (96%) provided data about the number of household contacts who were evaluated for TB disease and TB infection. Overall, among the 2.4 million people with bacteriologically confirmed pulmonary TB, 9.8 mil-lion contacts were identified, of whom 5.6 million (57%) were screened (Fig. 6.7).
In several countries, reporting remains unreliable, and interruptions in data availability make it difficult to draw conclusions about trends. In some countries, the report-ing of data on contacts identified and screened is limited to individuals who start TB preventive treatment; thus, available data underestimate the actual numbers eligible and overestimate treatment coverage. Overestimation of coverage (including numerators that exceed denomina-tors) also occurs when the number of children aged under 5 years who are eligible for treatment based on WHO guidelines is underestimated (11), or when the numerator includes children who are not household contacts or are aged 5 years or more.
6.1.4 Household contacts aged under 5 years starting TB preventive treatment, 2015–2019
In 2019, of the 188 countries with at least one case of bac-teriologically confirmed pulmonary TB, 121 reported that children aged under 5 years were started on TB preventive
treatment (up from 118 countries in 2018). This included 32 of the 38 high TB or high TB/HIV burden countries (Table 6.1), of which three reported data to WHO for the first time (Brazil, Chad and Ghana).
A total of 433 156 child contacts aged under 5 years were initiated on TB preventive treatment in 2019. This was an increase of 24% from 349 796 in 2018, and close to a five-fold increase from 87 242 in 2015. However, this number falls far short of what is needed to achieve the global target of 4 million during the years 2018–2022 (Fig. 6.2).
The largest numbers of child contacts aged under 5 years starting TB preventive treatment were reported by the WHO African Region (40% of the global total; 30 countries reported data) and the South-East Asia Region (40% of the global total; 11 countries reported data). In the 32 high TB and TB/HIV burden countries that report-ed data, 334 934 children started TB preventive treatment (77% of the global total). At country level, India reported the highest number (109 816), followed by the Democratic Republic of the Congo (34 763), Mozambique (30 766) and Bangladesh (29 880) (Table 6.1).
Globally, the 433 156 child contacts aged under 5 years who were started on TB preventive treatment in 2019 rep-resented 33% of the approximately 1.3 million children estimated to be eligible for treatment (up from 27% in 2018). The highest levels of coverage were estimated for 18 countries in the WHO European Region (of which 16
FIG. 6.6
Coverage of TB preventive treatment among people living with HIV who started antiretroviral treatment (ART), 2019
0–2425–4950–74≥75No dataNot applicable
Coverage (%)
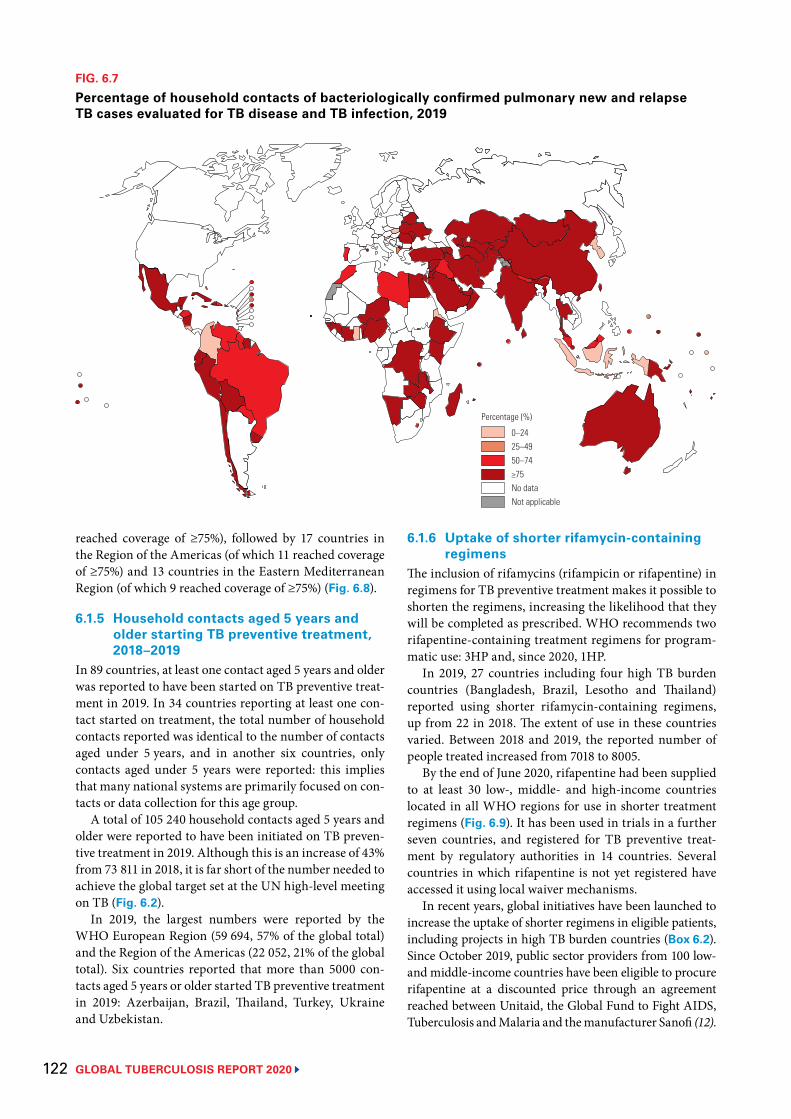
GLOBAL TUBERCULOSIS REPORT 2020 122
reached coverage of ≥75%), followed by 17 countries in the Region of the Americas (of which 11 reached coverage of ≥75%) and 13 countries in the Eastern Mediterranean Region (of which 9 reached coverage of ≥75%) (Fig. 6.8).
6.1.5 Household contacts aged 5 years and older starting TB preventive treatment, 2018–2019
In 89 countries, at least one contact aged 5 years and older was reported to have been started on TB preventive treat-ment in 2019. In 34 countries reporting at least one con-tact started on treatment, the total number of household contacts reported was identical to the number of contacts aged under 5 years, and in another six countries, only contacts aged under 5 years were reported: this implies that many national systems are primarily focused on con-tacts or data collection for this age group.
A total of 105 240 household contacts aged 5 years and older were reported to have been initiated on TB preven-tive treatment in 2019. Although this is an increase of 43% from 73 811 in 2018, it is far short of the number needed to achieve the global target set at the UN high-level meeting on TB (Fig. 6.2).
In 2019, the largest numbers were reported by the WHO European Region (59 694, 57% of the global total) and the Region of the Americas (22 052, 21% of the global total). Six countries reported that more than 5000 con-tacts aged 5 years or older started TB preventive treatment in 2019: Azerbaijan, Brazil, Thailand, Turkey, Ukraine and Uzbekistan.
6.1.6 Uptake of shorter rifamycin-containing regimens
The inclusion of rifamycins (rifampicin or rifapentine) in regimens for TB preventive treatment makes it possible to shorten the regimens, increasing the likelihood that they will be completed as prescribed. WHO recommends two rifapentine-containing treatment regimens for program-matic use: 3HP and, since 2020, 1HP.
In 2019, 27 countries including four high TB burden countries (Bangladesh, Brazil, Lesotho and Thailand) reported using shorter rifamycin-containing regimens, up from 22 in 2018. The extent of use in these countries varied. Between 2018 and 2019, the reported number of people treated increased from 7018 to 8005.
By the end of June 2020, rifapentine had been supplied to at least 30 low-, middle- and high-income countries located in all WHO regions for use in shorter treatment regimens (Fig. 6.9). It has been used in trials in a further seven countries, and registered for TB preventive treat-ment by regulatory authorities in 14 countries. Several countries in which rifapentine is not yet registered have accessed it using local waiver mechanisms.
In recent years, global initiatives have been launched to increase the uptake of shorter regimens in eligible patients, including projects in high TB burden countries (Box 6.2). Since October 2019, public sector providers from 100 low- and middle-income countries have been eligible to procure rifapentine at a discounted price through an agreement reached between Unitaid, the Global Fund to Fight AIDS, Tuberculosis and Malaria and the manufacturer Sanofi (12).
FIG. 6.7
Percentage of household contacts of bacteriologically confirmed pulmonary new and relapse TB cases evaluated for TB disease and TB infection, 2019
0–2425–4950–74≥75No dataNot applicable
Percentage (%)
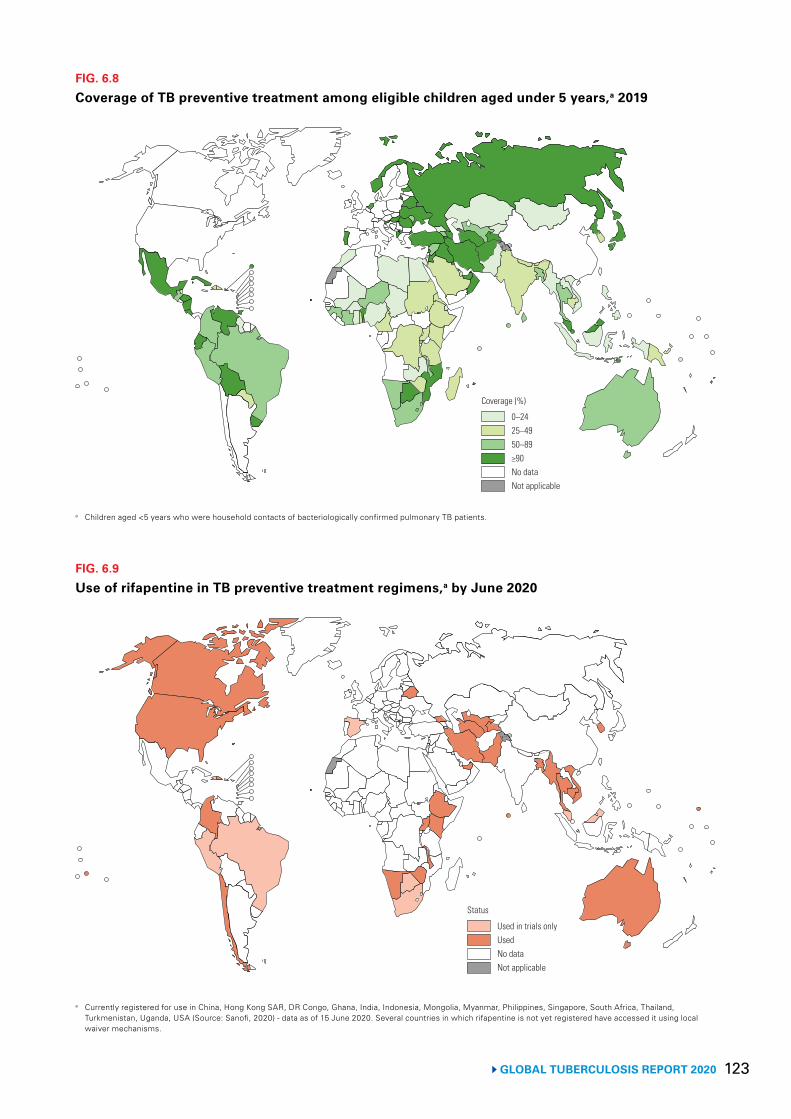
123 GLOBAL TUBERCULOSIS REPORT 2020
FIG. 6.8
Coverage of TB preventive treatment among eligible children aged under 5 years,a 2019
0–2425–4950–89≥90No dataNot applicable
Coverage (%)
a Children aged <5 years who were household contacts of bacteriologically confirmed pulmonary TB patients.
FIG. 6.9
Use of rifapentine in TB preventive treatment regimens,a by June 2020
Used in trials onlyUsedNo dataNot applicable
Status
a Currently registered for use in China, Hong Kong SAR, DR Congo, Ghana, India, Indonesia, Mongolia, Myanmar, Philippines, Singapore, South Africa, Thailand, Turkmenistan, Uganda, USA (Source: Sanofi, 2020) - data as of 15 June 2020. Several countries in which rifapentine is not yet registered have accessed it using local waiver mechanisms.
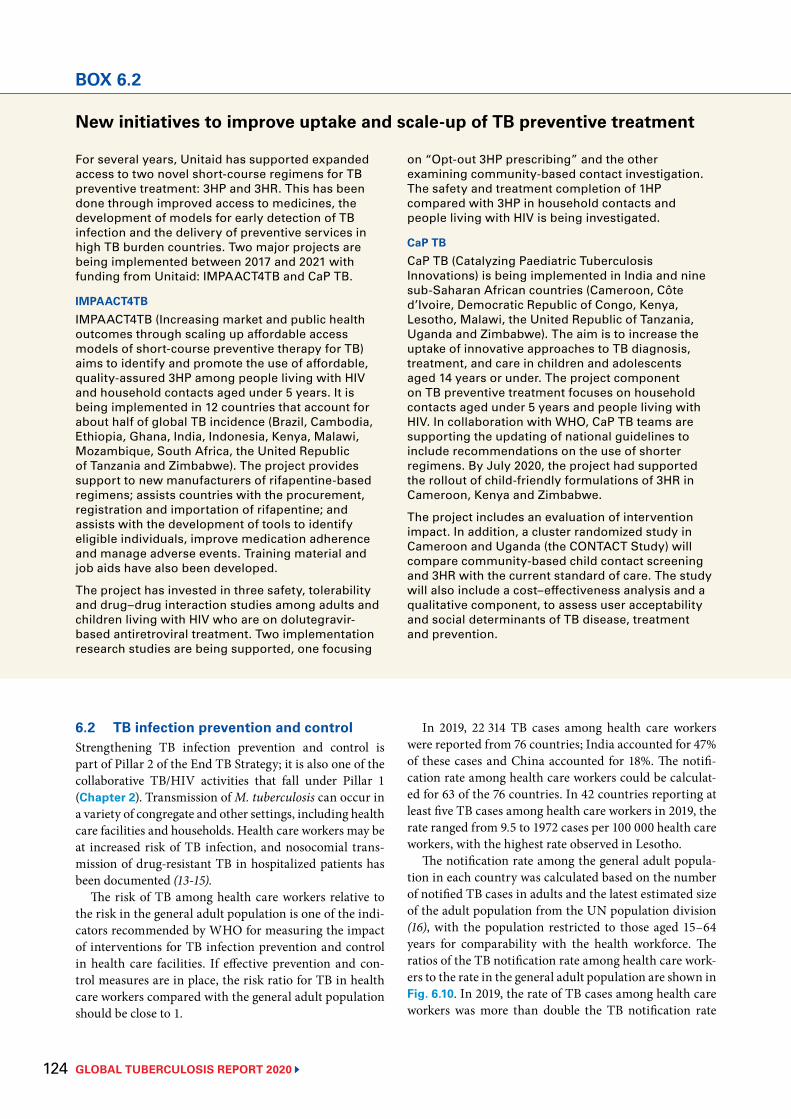
GLOBAL TUBERCULOSIS REPORT 2020 124
6.2 TB infection prevention and controlStrengthening TB infection prevention and control is part of Pillar 2 of the End TB Strategy; it is also one of the collaborative TB/HIV activities that fall under Pillar 1 (Chapter 2). Transmission of M. tuberculosis can occur in a variety of congregate and other settings, including health care facilities and households. Health care workers may be at increased risk of TB infection, and nosocomial trans-mission of drug-resistant TB in hospitalized patients has been documented (13-15).
The risk of TB among health care workers relative to the risk in the general adult population is one of the indi-cators recommended by WHO for measuring the impact of interventions for TB infection prevention and control in health care facilities. If effective prevention and con-trol measures are in place, the risk ratio for TB in health care workers compared with the general adult population should be close to 1.
BOX 6.2
New initiatives to improve uptake and scale-up of TB preventive treatment
For several years, Unitaid has supported expanded access to two novel short-course regimens for TB preventive treatment: 3HP and 3HR. This has been done through improved access to medicines, the development of models for early detection of TB infection and the delivery of preventive services in high TB burden countries. Two major projects are being implemented between 2017 and 2021 with funding from Unitaid: IMPAACT4TB and CaP TB.
IMPAACT4TB IMPAACT4TB (Increasing market and public health outcomes through scaling up affordable access models of short-course preventive therapy for TB) aims to identify and promote the use of affordable, quality-assured 3HP among people living with HIV and household contacts aged under 5 years. It is being implemented in 12 countries that account for about half of global TB incidence (Brazil, Cambodia, Ethiopia, Ghana, India, Indonesia, Kenya, Malawi, Mozambique, South Africa, the United Republic of Tanzania and Zimbabwe). The project provides support to new manufacturers of rifapentine-based regimens; assists countries with the procurement, registration and importation of rifapentine; and assists with the development of tools to identify eligible individuals, improve medication adherence and manage adverse events. Training material and job aids have also been developed.
The project has invested in three safety, tolerability and drug–drug interaction studies among adults and children living with HIV who are on dolutegravir-based antiretroviral treatment. Two implementation research studies are being supported, one focusing
on “Opt-out 3HP prescribing” and the other examining community-based contact investigation. The safety and treatment completion of 1HP compared with 3HP in household contacts and people living with HIV is being investigated.
CaP TBCaP TB (Catalyzing Paediatric Tuberculosis Innovations) is being implemented in India and nine sub-Saharan African countries (Cameroon, Côte d’Ivoire, Democratic Republic of Congo, Kenya, Lesotho, Malawi, the United Republic of Tanzania, Uganda and Zimbabwe). The aim is to increase the uptake of innovative approaches to TB diagnosis, treatment, and care in children and adolescents aged 14 years or under. The project component on TB preventive treatment focuses on household contacts aged under 5 years and people living with HIV. In collaboration with WHO, CaP TB teams are supporting the updating of national guidelines to include recommendations on the use of shorter regimens. By July 2020, the project had supported the rollout of child-friendly formulations of 3HR in Cameroon, Kenya and Zimbabwe.
The project includes an evaluation of intervention impact. In addition, a cluster randomized study in Cameroon and Uganda (the CONTACT Study) will compare community-based child contact screening and 3HR with the current standard of care. The study will also include a cost–effectiveness analysis and a qualitative component, to assess user acceptability and social determinants of TB disease, treatment and prevention.
In 2019, 22 314 TB cases among health care workers were reported from 76 countries; India accounted for 47% of these cases and China accounted for 18%. The notifi-cation rate among health care workers could be calculat-ed for 63 of the 76 countries. In 42 countries reporting at least five TB cases among health care workers in 2019, the rate ranged from 9.5 to 1972 cases per 100 000 health care workers, with the highest rate observed in Lesotho.
The notification rate among the general adult popula-tion in each country was calculated based on the number of notified TB cases in adults and the latest estimated size of the adult population from the UN population division (16), with the population restricted to those aged 15–64 years for comparability with the health workforce. The ratios of the TB notification rate among health care work-ers to the rate in the general adult population are shown in Fig. 6.10. In 2019, the rate of TB cases among health care workers was more than double the TB notification rate
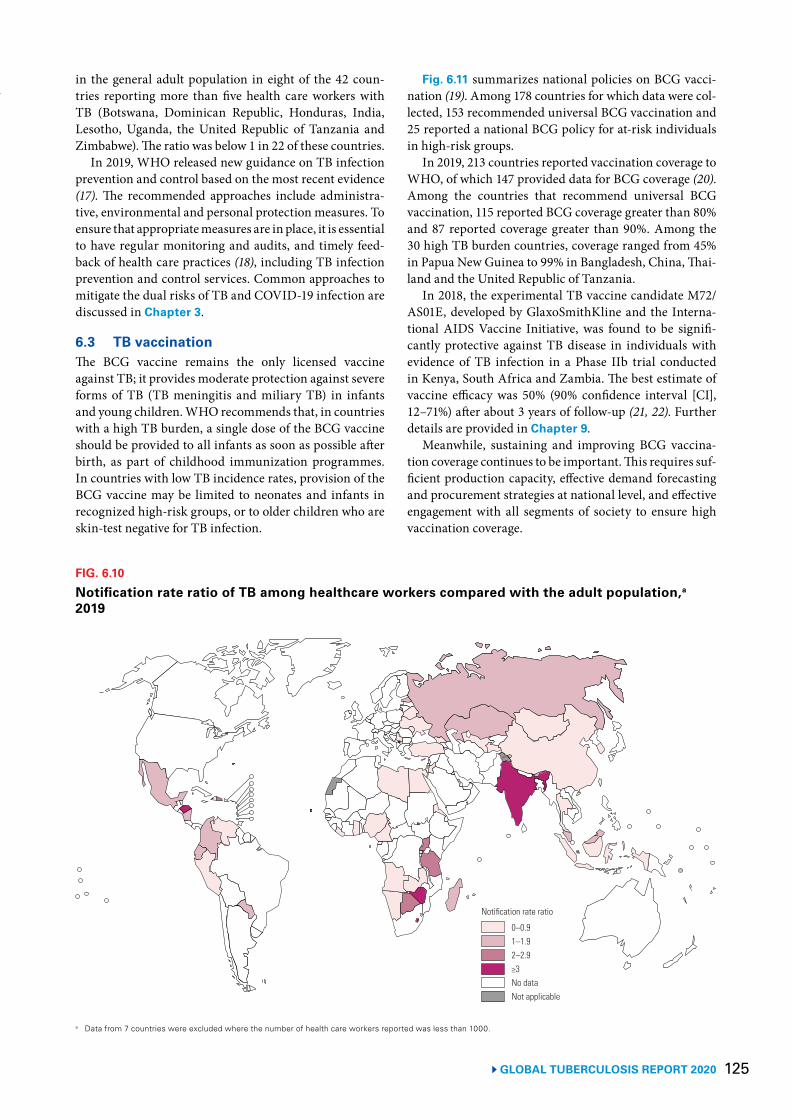
125 GLOBAL TUBERCULOSIS REPORT 2020
in the general adult population in eight of the 42 coun-tries reporting more than five health care workers with TB (Botswana, Dominican Republic, Honduras, India, Lesotho, Uganda, the United Republic of Tanzania and Zimbabwe). The ratio was below 1 in 22 of these countries.
In 2019, WHO released new guidance on TB infection prevention and control based on the most recent evidence (17). The recommended approaches include administra-tive, environmental and personal protection measures. To ensure that appropriate measures are in place, it is essential to have regular monitoring and audits, and timely feed-back of health care practices (18), including TB infection prevention and control services. Common approaches to mitigate the dual risks of TB and COVID-19 infection are discussed in Chapter 3.
6.3 TB vaccinationThe BCG vaccine remains the only licensed vaccine against TB; it provides moderate protection against severe forms of TB (TB meningitis and miliary TB) in infants and young children. WHO recommends that, in countries with a high TB burden, a single dose of the BCG vaccine should be provided to all infants as soon as possible after birth, as part of childhood immunization programmes. In countries with low TB incidence rates, provision of the BCG vaccine may be limited to neonates and infants in recognized high-risk groups, or to older children who are skin-test negative for TB infection.
BOX 6.2 Fig. 6.11 summarizes national policies on BCG vacci-nation (19). Among 178 countries for which data were col-lected, 153 recommended universal BCG vaccination and 25 reported a national BCG policy for at-risk individuals in high-risk groups.
In 2019, 213 countries reported vaccination coverage to WHO, of which 147 provided data for BCG coverage (20). Among the countries that recommend universal BCG vaccination, 115 reported BCG coverage greater than 80% and 87 reported coverage greater than 90%. Among the 30 high TB burden countries, coverage ranged from 45% in Papua New Guinea to 99% in Bangladesh, China, Thai-land and the United Republic of Tanzania.
In 2018, the experimental TB vaccine candidate M72/AS01E, developed by GlaxoSmithKline and the Interna-tional AIDS Vaccine Initiative, was found to be signifi-cantly protective against TB disease in individuals with evidence of TB infection in a Phase IIb trial conducted in Kenya, South Africa and Zambia. The best estimate of vaccine efficacy was 50% (90% confidence interval [CI], 12–71%) after about 3 years of follow-up (21, 22). Further details are provided in Chapter 9.
Meanwhile, sustaining and improving BCG vaccina-tion coverage continues to be important. This requires suf-ficient production capacity, effective demand forecasting and procurement strategies at national level, and effective engagement with all segments of society to ensure high vaccination coverage.
FIG. 6.10
Notification rate ratio of TB among healthcare workers compared with the adult population,a 2019
0–0.91–1.92–2.9≥3No dataNot applicable
Notification rate ratio
a Data from 7 countries were excluded where the number of health care workers reported was less than 1000.
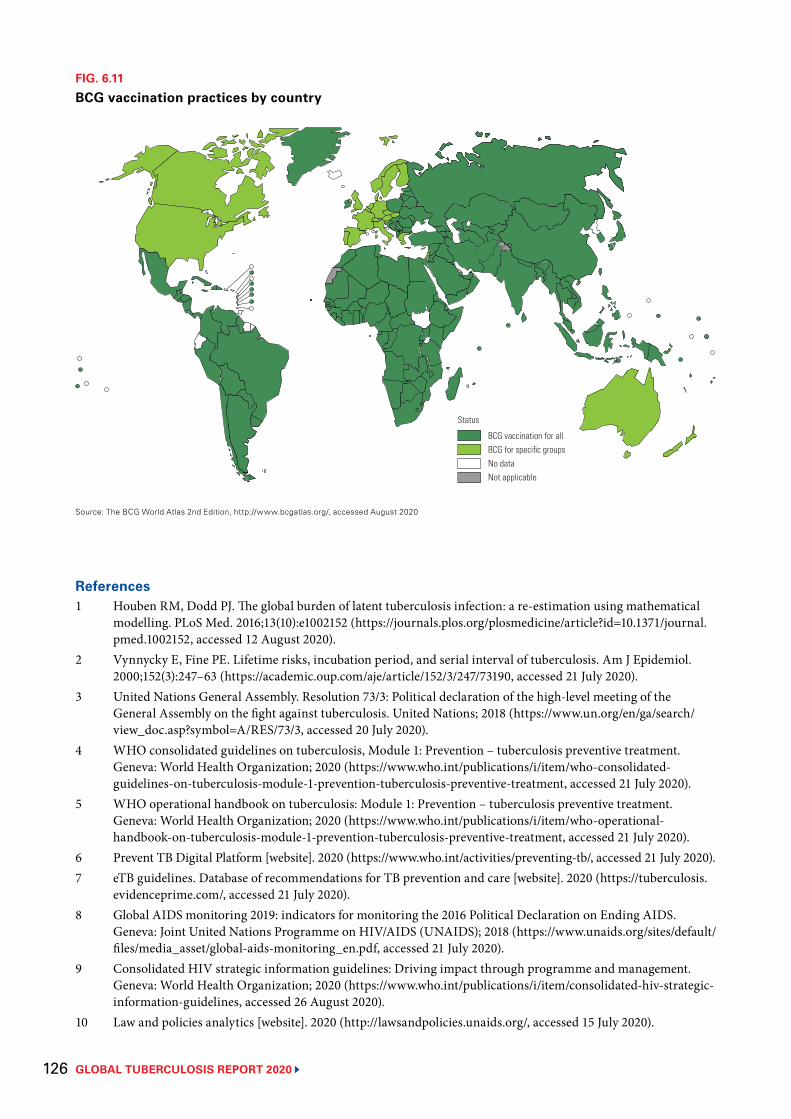
GLOBAL TUBERCULOSIS REPORT 2020 126
References1 Houben RM, Dodd PJ. The global burden of latent tuberculosis infection: a re-estimation using mathematical
modelling. PLoS Med. 2016;13(10):e1002152 (https://journals.plos.org/plosmedicine/article?id=10.1371/journal.pmed.1002152, accessed 12 August 2020).
2 Vynnycky E, Fine PE. Lifetime risks, incubation period, and serial interval of tuberculosis. Am J Epidemiol. 2000;152(3):247–63 (https://academic.oup.com/aje/article/152/3/247/73190, accessed 21 July 2020).
3 United Nations General Assembly. Resolution 73/3: Political declaration of the high-level meeting of the General Assembly on the fight against tuberculosis. United Nations; 2018 (https://www.un.org/en/ga/search/view_doc.asp?symbol=A/RES/73/3, accessed 20 July 2020).
4 WHO consolidated guidelines on tuberculosis, Module 1: Prevention – tuberculosis preventive treatment. Geneva: World Health Organization; 2020 (https://www.who.int/publications/i/item/who-consolidated-guidelines-on-tuberculosis-module-1-prevention-tuberculosis-preventive-treatment, accessed 21 July 2020).
5 WHO operational handbook on tuberculosis: Module 1: Prevention – tuberculosis preventive treatment. Geneva: World Health Organization; 2020 (https://www.who.int/publications/i/item/who-operational-handbook-on-tuberculosis-module-1-prevention-tuberculosis-preventive-treatment, accessed 21 July 2020).
6 Prevent TB Digital Platform [website]. 2020 (https://www.who.int/activities/preventing-tb/, accessed 21 July 2020).7 eTB guidelines. Database of recommendations for TB prevention and care [website]. 2020 (https://tuberculosis.
evidenceprime.com/, accessed 21 July 2020).8 Global AIDS monitoring 2019: indicators for monitoring the 2016 Political Declaration on Ending AIDS.
Geneva: Joint United Nations Programme on HIV/AIDS (UNAIDS); 2018 (https://www.unaids.org/sites/default/files/media_asset/global-aids-monitoring_en.pdf, accessed 21 July 2020).
9 Consolidated HIV strategic information guidelines: Driving impact through programme and management. Geneva: World Health Organization; 2020 (https://www.who.int/publications/i/item/consolidated-hiv-strategic-information-guidelines, accessed 26 August 2020).
10 Law and policies analytics [website]. 2020 (http://lawsandpolicies.unaids.org/, accessed 15 July 2020).
FIG. 6.11
BCG vaccination practices by country
BCG vaccination for allBCG for specific groupsNo dataNot applicable
Status
Source: The BCG World Atlas 2nd Edition, http://www.bcgatlas.org/, accessed August 2020
127 GLOBAL TUBERCULOSIS REPORT 2020
11 Methods to estimate number of child household contacts less than 5 years old eligible for latent tuberculosis treatment. Geneva: World Health Organization; 2018 (https://www.who.int/tb/publications/global_report/gtbr2018_online_technical_appendix_child_contacts.pdf, accessed 21 July 2020).
12 Landmark deal secures significant discount on price of medicine to prevent TB. Geneva: Unitaid; 2019 (https://unitaid.org/news-blog/landmark-deal-secures-significant-discount-on-price-of-medicine-to-prevent-tb/, accessed 5 August 2020).
13 Gandhi NR, Weissman D, Moodley P, Ramathal M, Elson I, Kreiswirth BN et al. Nosocomial transmission of extensively drug-resistant tuberculosis in a rural hospital in South Africa. J Infec Dis. 2013;207(1):9–17 (https://www.ncbi.nlm.nih.gov/pmc/articles/PMC3523793/, accessed 21 July 2020).
14 Moro ML, Errante I, Infuso A, Sodano L, Gori A, Orcese CA et al. Effectiveness of infection control measures in controlling a nosocomial outbreak of multidrug-resistant tuberculosis among HIV patients in Italy. Int J Tuberc Lung Dis. 2000;4(1):61–8 (https://www.ingentaconnect.com/content/iuatld/ijtld/2000/00000004/00000001/art00012%3bjsessionid=1vofc8l9gccg6.x-ic-live-01, accessed 21 July 2020).
15 Moro ML, Gori A, Errante I, Infuso A, Franzetti F, Sodano L et al. An outbreak of multidrug-resistant tuberculosis involving HIV-infected patients of two hospitals in Milan, Italy. AIDS. 1998;12(9):1095–102 (https://journals.lww.com/aidsonline/Fulltext/1998/09000/An_outbreak_of_multidrug_resistant_tuberculosis.18.aspx, accessed 21 July 2020).
16 Revision of world population prospects [website]. 2019 (https://population.un.org/wpp/, accessed 21 July 2020).17 WHO guidelines on tuberculosis infection prevention and control, 2019 update (WHO/CDS/
TB/2019.1). Geneva: World Health Organization; 2019 (https://apps.who.int/iris/bitstream/handle/10665/311259/9789241550512-eng.pdf, accessed 21 July 2020).
18 Guidelines on core components of infection prevention and control programmes at the national and acute health care facility level. Geneva: World Health Organization; 2016 (https://www.who.int/gpsc/core-components.pdf, accessed 21 July 2020).
19 The BCG world atlas: a database of global BCG vaccination policies and practices, 2nd edition [website]. 2017 (http://www.bcgatlas.org/, accessed 21 July 2020).
20 Reported estimates of BCG coverage [website]. Geneva: World Health Organization; 2019 (https://apps.who.int/immunization_monitoring/globalsummary/timeseries/tscoveragebcg.html, accessed 21 July 2020).
21 Van Der Meeren O, Hatherill M, Nduba V, Wilkinson RJ, Muyoyeta M, Van Brakel E et al. Phase 2b controlled trial of M72/AS01E vaccine to prevent tuberculosis. N Engl J Med. 2018;379(17):1621–34 (https://www.nejm.org/doi/10.1056/NEJMoa1803484, accessed 5 August 2020).
22 Tait DR, Hatherill M, Van Der Meeren O, Ginsberg AM, Van Brakel E, Salaun B et al. Final analysis of a trial of M72/AS01E vaccine to prevent tuberculosis. N Eng J Med. 2019;381(25):2429–39 (https://pubmed.ncbi.nlm.nih.gov/31661198/, accessed 5 August 2020).
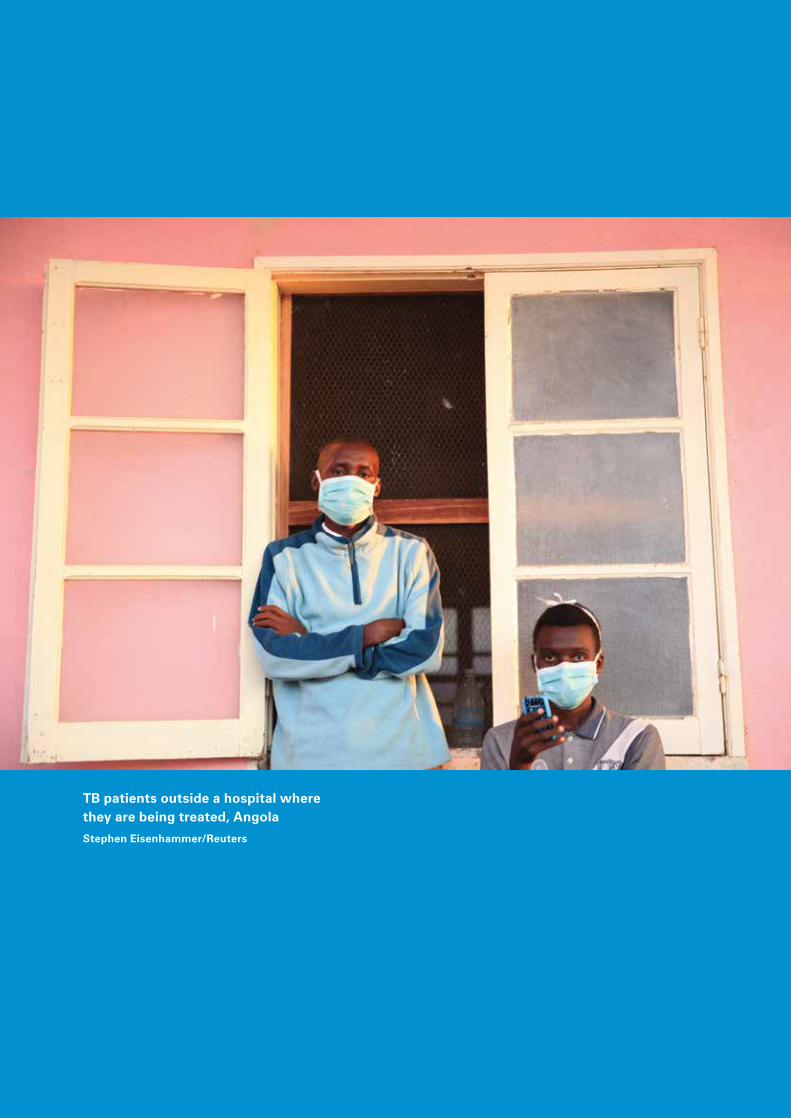
GLOBAL TUBERCULOSIS REPORT 2020 128
TB patients outside a hospital where they are being treated, Angola Stephen Eisenhammer/Reuters
129 GLOBAL TUBERCULOSIS REPORT 2020
Key facts and messagesThe political declaration at the first United Nations (UN) high-level meeting on tuberculosis (TB), held in September 2018, includes a target to mobilize at least US$ 13 billiona,b annually by 2022 for TB prevention, diagnosis and treatment. The Stop TB Partnership’s Global Plan to End TB, 2018–2022 (the Global Plan), released in December 2019, estimates that US$ 13 billion is required in low- and middle-income countries in 2020, rising to US$ 15 billion in 2022.
Based on data reported to the World Health Organization (WHO) by 121 low- and middle-income countries that account for 98% of the world’s notified TB cases, US$ 6.5 billion is available in 2020, up from US$ 6.0 billion in 2019 and US$ 5.0 billion in 2010.a However, funding needs to double to reach the funding target set at the UN high-level meeting. There is an urgent need to step up efforts to mobilize additional funding from domestic sources and international donors.
Of the total of US$ 6.5 billion available in 2020, US$ 4.2 billion is for diagnosis and treatment of drug-susceptible TB, and US$ 2.26 billion is for diagnosis and treatment of multidrug-resistant TB (MDR-TB); both these amounts are only slightly more than half of what the Global Plan estimates is required. The remaining amount (<US$ 0.1 billion) includes funding for TB preventive treatment (covering drugs only), interventions specifically related to HIV-associated TB and miscellaneous items.
Overall, of the US$ 6.5 billion available in 2020, US$ 5.5 billion (85% of the total) is from domestic sources. However, this aggregate figure is strongly influenced by the BRICS group of countries (Brazil, the Russian Federation, India, China and South Africa). The BRICS group accounts for 57% (US$ 3.7 billion) of available funding in 2020 and 47% of the world’s TB cases; 97% of their funding is from domestic sources (81% in South Africa, 92% in India, and 100% in Brazil, China and the Russian Federation).
In other low- and middle-income countries, international donor funding remains crucial. In 2020, such funding accounts for 44% of total funding in the 25 high TB burden countries outside BRICS (which have 40% of the world’s notified TB cases) and for 57% of total funding in low-income countries.
International donor funding, as reported by national TB programmes (NTPs), increased from US$ 0.9 billion in 2019 to US$ 1.0 billion in 2020. The single largest source (77% of the total in 2020) is the Global Fund to Fight AIDS, Tuberculosis and Malaria (the Global Fund).
International donor funding documented in the Organisation for Economic Co-operation and Development (OECD) creditor reporting system includes funding for TB that flows through NTPs, as well as funding provided to other recipients. The total amount recorded in 2018 (the latest year for which data
are available) was US$ 0.9 billion, of which 58% was from the Global Fund (from 2006 to 2018, the Global Fund’s contribution averaged 63%).
The OECD documented that funding for TB (US$ 0.9 billion) in 2018 was much lower than for HIV (US$ 6.9 billion) and malaria (US$ 1.8 billion). To provide some context for these amounts, the latest estimates (for 2018) of the burden of disease in terms of disability-adjusted life-years (DALYs) lost owing to illness and death are 49 million for HIV/AIDS, 46 million for malaria and 48 million for TB.
The median cost per person treated for TB in 2019 was US$ 860 for drug-susceptible TB and US$ 5659 for MDR-TB.
Health financing data from national health accounts provide important insights into the status of progress towards universal health coverage. This is discussed in Chapter 8.a All values are in constant 2020 US$.b The declaration also includes a funding target for
TB research and development of US$ 2 billion per year, 2018–2022 (Chapter 2).
Chapter 7
Financing for TB prevention, diagnosis and treatment
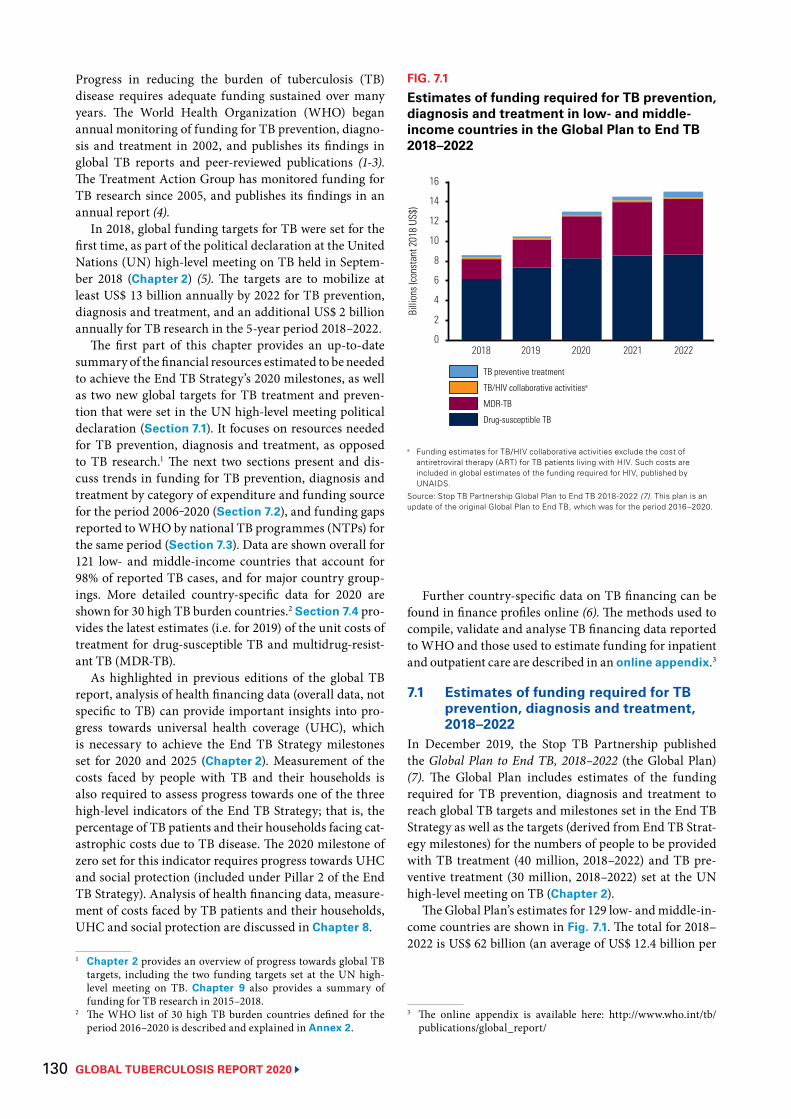
GLOBAL TUBERCULOSIS REPORT 2020 130
Progress in reducing the burden of tuberculosis (TB) disease requires adequate funding sustained over many years. The World Health Organization (WHO) began annual monitoring of funding for TB prevention, diagno-sis and treatment in 2002, and publishes its findings in global TB reports and peer-reviewed publications (1-3). The Treatment Action Group has monitored funding for TB research since 2005, and publishes its findings in an annual report (4).
In 2018, global funding targets for TB were set for the first time, as part of the political declaration at the United Nations (UN) high-level meeting on TB held in Septem-ber 2018 (Chapter 2) (5). The targets are to mobilize at least US$ 13 billion annually by 2022 for TB prevention, diagnosis and treatment, and an additional US$ 2 billion annually for TB research in the 5-year period 2018–2022.
The first part of this chapter provides an up-to-date summary of the financial resources estimated to be needed to achieve the End TB Strategy’s 2020 milestones, as well as two new global targets for TB treatment and preven-tion that were set in the UN high-level meeting political declaration (Section 7.1). It focuses on resources needed for TB prevention, diagnosis and treatment, as opposed to TB research.1 The next two sections present and dis-cuss trends in funding for TB prevention, diagnosis and treatment by category of expenditure and funding source for the period 2006‒2020 (Section 7.2), and funding gaps reported to WHO by national TB programmes (NTPs) for the same period (Section 7.3). Data are shown overall for 121 low- and middle-income countries that account for 98% of reported TB cases, and for major country group-ings. More detailed country-specific data for 2020 are shown for 30 high TB burden countries.2 Section 7.4 pro-vides the latest estimates (i.e. for 2019) of the unit costs of treatment for drug-susceptible TB and multidrug-resist-ant TB (MDR-TB).
As highlighted in previous editions of the global TB report, analysis of health financing data (overall data, not specific to TB) can provide important insights into pro-gress towards universal health coverage (UHC), which is necessary to achieve the End TB Strategy milestones set for 2020 and 2025 (Chapter 2). Measurement of the costs faced by people with TB and their households is also required to assess progress towards one of the three high-level indicators of the End TB Strategy; that is, the percentage of TB patients and their households facing cat-astrophic costs due to TB disease. The 2020 milestone of zero set for this indicator requires progress towards UHC and social protection (included under Pillar 2 of the End TB Strategy). Analysis of health financing data, measure-ment of costs faced by TB patients and their households, UHC and social protection are discussed in Chapter 8.
1 Chapter 2 provides an overview of progress towards global TB targets, including the two funding targets set at the UN high- level meeting on TB. Chapter 9 also provides a summary of funding for TB research in 2015–2018.
2 The WHO list of 30 high TB burden countries defined for the period 2016–2020 is described and explained in Annex 2.
Further country-specific data on TB financing can be found in finance profiles online (6). The methods used to compile, validate and analyse TB financing data reported to WHO and those used to estimate funding for inpatient and outpatient care are described in an online appendix.3
7.1 Estimates of funding required for TB prevention, diagnosis and treatment, 2018–2022
In December 2019, the Stop TB Partnership published the Global Plan to End TB, 2018–2022 (the Global Plan) (7). The Global Plan includes estimates of the funding required for TB prevention, diagnosis and treatment to reach global TB targets and milestones set in the End TB Strategy as well as the targets (derived from End TB Strat-egy milestones) for the numbers of people to be provided with TB treatment (40 million, 2018–2022) and TB pre-ventive treatment (30 million, 2018–2022) set at the UN high-level meeting on TB (Chapter 2).
The Global Plan’s estimates for 129 low- and middle-in-come countries are shown in Fig. 7.1. The total for 2018–2022 is US$ 62 billion (an average of US$ 12.4 billion per
3 The online appendix is available here: http://www.who.int/tb/publications/global_report/
FIG. 7.1
Estimates of funding required for TB prevention, diagnosis and treatment in low- and middle-income countries in the Global Plan to End TB 2018–2022
a Funding estimates for TB/HIV collaborative activities exclude the cost of antiretroviral therapy (ART) for TB patients living with HIV. Such costs are included in global estimates of the funding required for HIV, published by UNAIDS.
Source: Stop TB Partnership Global Plan to End TB 2018-2022 (7). This plan is an update of the original Global Plan to End TB, which was for the period 2016–2020.
TB preventive treatment
TB/HIV collaborative activitiesa
MDR-TB
Drug-susceptible TBBi
llion
s (co
nsta
nt 2
018
US$)
2018 2019 2020 2021 2022
8
4
0
16
12
14
10
6
2
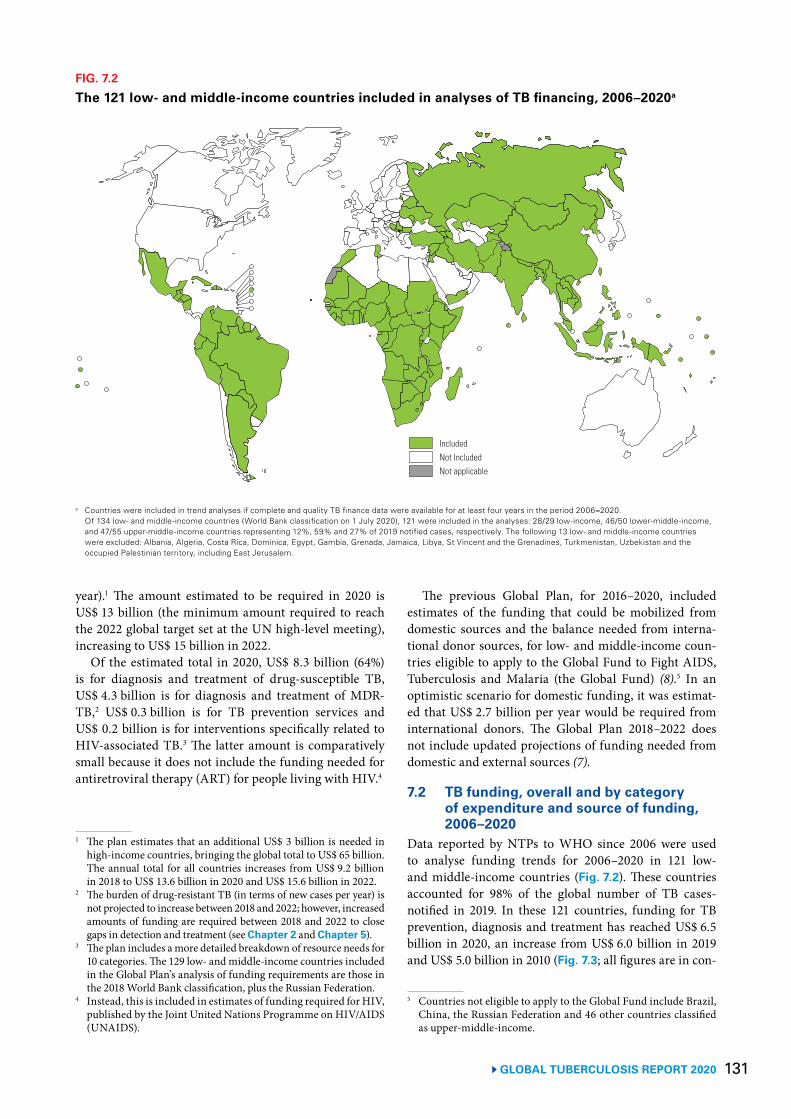
131GLOBAL TUBERCULOSIS REPORT 2020
year).1 The amount estimated to be required in 2020 is US$ 13 billion (the minimum amount required to reach the 2022 global target set at the UN high-level meeting), increasing to US$ 15 billion in 2022.
Of the estimated total in 2020, US$ 8.3 billion (64%) is for diagnosis and treatment of drug-susceptible TB, US$ 4.3 billion is for diagnosis and treatment of MDR-TB,2 US$ 0.3 billion is for TB prevention services and US$ 0.2 billion is for interventions specifically related to HIV-associated TB.3 The latter amount is comparatively small because it does not include the funding needed for antiretroviral therapy (ART) for people living with HIV.4
1 The plan estimates that an additional US$ 3 billion is needed in high-income countries, bringing the global total to US$ 65 billion. The annual total for all countries increases from US$ 9.2 billion in 2018 to US$ 13.6 billion in 2020 and US$ 15.6 billion in 2022.
2 The burden of drug-resistant TB (in terms of new cases per year) is not projected to increase between 2018 and 2022; however, increased amounts of funding are required between 2018 and 2022 to close gaps in detection and treatment (see Chapter 2 and Chapter 5).
3 The plan includes a more detailed breakdown of resource needs for 10 categories. The 129 low- and middle-income countries included in the Global Plan’s analysis of funding requirements are those in the 2018 World Bank classification, plus the Russian Federation.
4 Instead, this is included in estimates of funding required for HIV, published by the Joint United Nations Programme on HIV/AIDS (UNAIDS).
The previous Global Plan, for 2016–2020, included estimates of the funding that could be mobilized from domestic sources and the balance needed from interna-tional donor sources, for low- and middle-income coun-tries eligible to apply to the Global Fund to Fight AIDS, Tuberculosis and Malaria (the Global Fund) (8).5 In an optimistic scenario for domestic funding, it was estimat-ed that US$ 2.7 billion per year would be required from international donors. The Global Plan 2018–2022 does not include updated projections of funding needed from domestic and external sources (7).
7.2 TB funding, overall and by category of expenditure and source of funding, 2006–2020
Data reported by NTPs to WHO since 2006 were used to analyse funding trends for 2006–2020 in 121 low- and middle-income countries (Fig. 7.2). These countries accounted for 98% of the global number of TB cases-notified in 2019. In these 121 countries, funding for TB prevention, diagnosis and treatment has reached US$ 6.5 billion in 2020, an increase from US$ 6.0 billion in 2019 and US$ 5.0 billion in 2010 (Fig. 7.3; all figures are in con-
5 Countries not eligible to apply to the Global Fund include Brazil, China, the Russian Federation and 46 other countries classified as upper-middle-income.
FIG. 7.2
The 121 low- and middle-income countries included in analyses of TB financing, 2006–2020a
a Countries were included in trend analyses if complete and quality TB finance data were available for at least four years in the period 2006–2020. Of 134 low- and middle-income countries (World Bank classification on 1 July 2020), 121 were included in the analyses: 28/29 low-income, 46/50 lower-middle-income, and 47/55 upper-middle-income countries representing 12%, 59% and 27% of 2019 notified cases, respectively. The following 13 low- and middle-income countries were excluded: Albania, Algeria, Costa Rica, Dominica, Egypt, Gambia, Grenada, Jamaica, Libya, St Vincent and the Grenadines, Turkmenistan, Uzbekistan and the occupied Palestinian territory, including East Jerusalem.
IncludedNot IncludedNot applicable
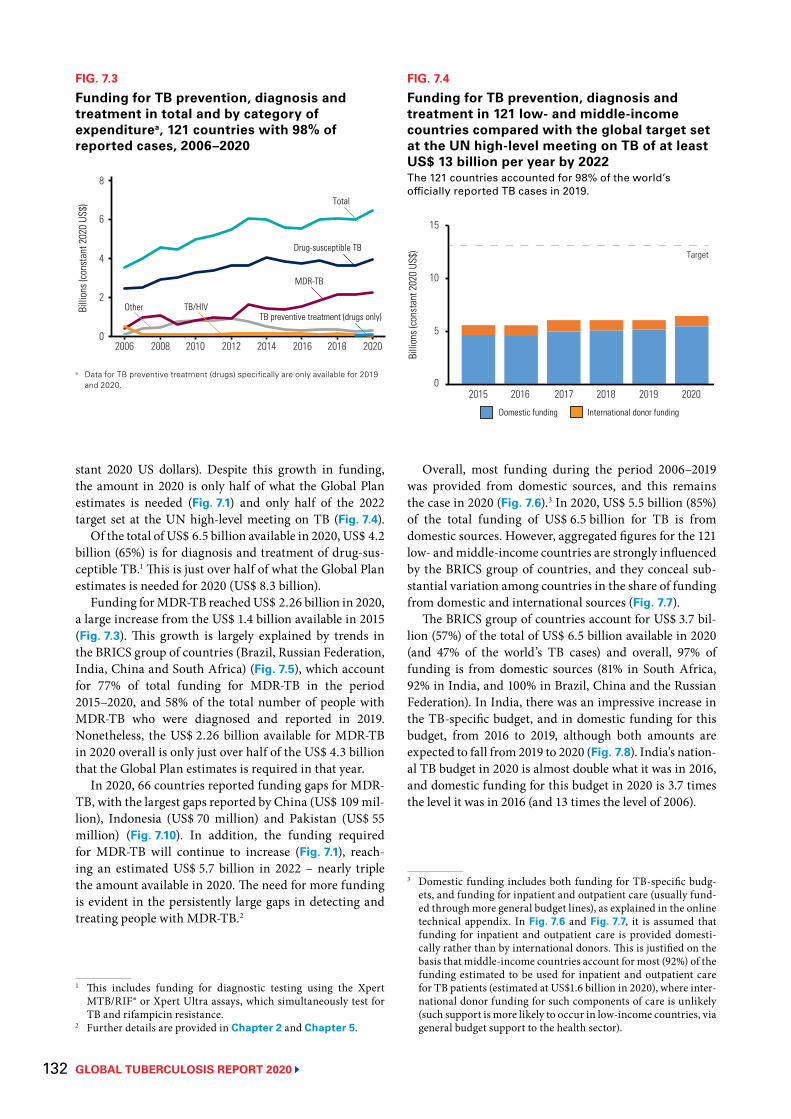
GLOBAL TUBERCULOSIS REPORT 2020 132
stant 2020 US dollars). Despite this growth in funding, the amount in 2020 is only half of what the Global Plan estimates is needed (Fig. 7.1) and only half of the 2022 target set at the UN high-level meeting on TB (Fig. 7.4).
Of the total of US$ 6.5 billion available in 2020, US$ 4.2 billion (65%) is for diagnosis and treatment of drug-sus-ceptible TB.1 This is just over half of what the Global Plan estimates is needed for 2020 (US$ 8.3 billion).
Funding for MDR-TB reached US$ 2.26 billion in 2020, a large increase from the US$ 1.4 billion available in 2015 (Fig. 7.3). This growth is largely explained by trends in the BRICS group of countries (Brazil, Russian Federation, India, China and South Africa) (Fig. 7.5), which account for 77% of total funding for MDR-TB in the period 2015–2020, and 58% of the total number of people with MDR-TB who were diagnosed and reported in 2019. Nonetheless, the US$ 2.26 billion available for MDR-TB in 2020 overall is only just over half of the US$ 4.3 billion that the Global Plan estimates is required in that year.
In 2020, 66 countries reported funding gaps for MDR-TB, with the largest gaps reported by China (US$ 109 mil-lion), Indonesia (US$ 70 million) and Pakistan (US$ 55 million) (Fig. 7.10). In addition, the funding required for MDR-TB will continue to increase (Fig. 7.1), reach-ing an estimated US$ 5.7 billion in 2022 – nearly triple the amount available in 2020. The need for more funding is evident in the persistently large gaps in detecting and treating people with MDR-TB.2
1 This includes funding for diagnostic testing using the Xpert MTB/RIF® or Xpert Ultra assays, which simultaneously test for TB and rifampicin resistance.
2 Further details are provided in Chapter 2 and Chapter 5.
FIG. 7.3
Funding for TB prevention, diagnosis and treatment in total and by category of expenditurea, 121 countries with 98% of reported cases, 2006–2020
Billi
ons (
cons
tant
202
0 US
$)
2006 2008 2010 2012 2014 2016 2018 2020
4
2
0
6
8
MDR-TB
Other TB/HIV
Total
Drug-susceptible TB
TB preventive treatment (drugs only)
a Data for TB preventive treatment (drugs) specifically are only available for 2019 and 2020.
FIG. 7.4
Funding for TB prevention, diagnosis and treatment in 121 low- and middle-income countries compared with the global target set at the UN high-level meeting on TB of at least US$ 13 billion per year by 2022The 121 countries accounted for 98% of the world’s officially reported TB cases in 2019.
Billi
ons (
cons
tant
202
0 US
$)
2015 2016 2017 2018 2019 2020
10
5
0
15
Target
Domestic funding International donor funding
Overall, most funding during the period 2006–2019 was provided from domestic sources, and this remains the case in 2020 (Fig. 7.6).3 In 2020, US$ 5.5 billion (85%) of the total funding of US$ 6.5 billion for TB is from domestic sources. However, aggregated figures for the 121 low- and middle-income countries are strongly influenced by the BRICS group of countries, and they conceal sub-stantial variation among countries in the share of funding from domestic and international sources (Fig. 7.7).
The BRICS group of countries account for US$ 3.7 bil-lion (57%) of the total of US$ 6.5 billion available in 2020 (and 47% of the world’s TB cases) and overall, 97% of funding is from domestic sources (81% in South Africa, 92% in India, and 100% in Brazil, China and the Russian Federation). In India, there was an impressive increase in the TB-specific budget, and in domestic funding for this budget, from 2016 to 2019, although both amounts are expected to fall from 2019 to 2020 (Fig. 7.8). India’s nation-al TB budget in 2020 is almost double what it was in 2016, and domestic funding for this budget in 2020 is 3.7 times the level it was in 2016 (and 13 times the level of 2006).
3 Domestic funding includes both funding for TB-specific budg-ets, and funding for inpatient and outpatient care (usually fund-ed through more general budget lines), as explained in the online technical appendix. In Fig. 7.6 and Fig. 7.7, it is assumed that funding for inpatient and outpatient care is provided domesti-cally rather than by international donors. This is justified on the basis that middle-income countries account for most (92%) of the funding estimated to be used for inpatient and outpatient care for TB patients (estimated at US$1.6 billion in 2020), where inter-national donor funding for such components of care is unlikely (such support is more likely to occur in low-income countries, via general budget support to the health sector).
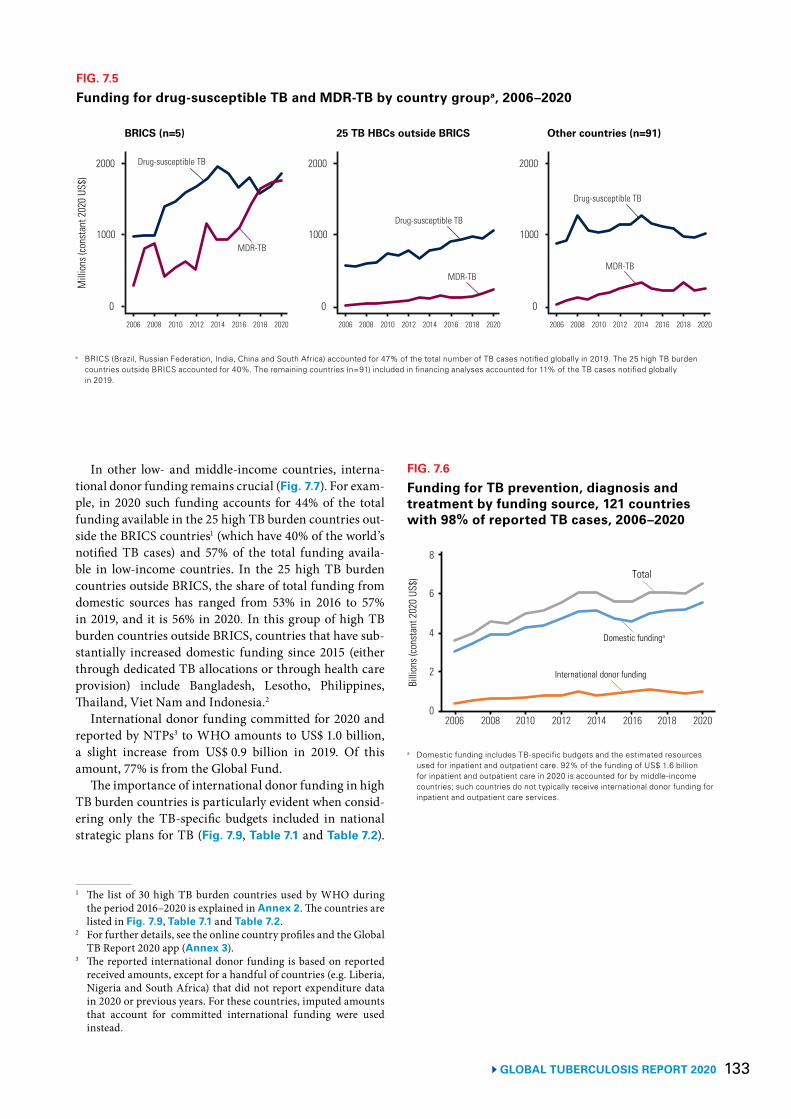
133 GLOBAL TUBERCULOSIS REPORT 2020
FIG. 7.5
Funding for drug-susceptible TB and MDR-TB by country groupa, 2006–2020
a BRICS (Brazil, Russian Federation, India, China and South Africa) accounted for 47% of the total number of TB cases notified globally in 2019. The 25 high TB burden countries outside BRICS accounted for 40%. The remaining countries (n=91) included in financing analyses accounted for 11% of the TB cases notified globally in 2019.
Mill
ions
(con
stan
t 202
0 US
$)
0
BRICS (n=5) 25 TB HBCs outside BRICS Other countries (n=91)
1000
2000
0
1000
2000
0
2006 2008 2010 2012 2014 2016 2018 2020
1000
2000
2006 2008 2010 2012 2014 2016 2018 2020 2006 2008 2010 2012 2014 2016 2018 2020
Drug-susceptible TB
MDR-TB
Drug-susceptible TB
MDR-TB
Drug-susceptible TB
MDR-TB
FIG. 7.6
Funding for TB prevention, diagnosis and treatment by funding source, 121 countries with 98% of reported TB cases, 2006–2020
a Domestic funding includes TB-specific budgets and the estimated resources used for inpatient and outpatient care. 92% of the funding of US$ 1.6 billion for inpatient and outpatient care in 2020 is accounted for by middle-income countries; such countries do not typically receive international donor funding for inpatient and outpatient care services.
Billi
ons (
cons
tant
202
0 US
$)
2006 2008 2010 2012 2014 2016 2018 2020
4
2
0
6
8
Domestic fundinga
Total
International donor funding
In other low- and middle-income countries, interna-tional donor funding remains crucial (Fig. 7.7). For exam-ple, in 2020 such funding accounts for 44% of the total funding available in the 25 high TB burden countries out-side the BRICS countries1 (which have 40% of the world’s notified TB cases) and 57% of the total funding availa-ble in low-income countries. In the 25 high TB burden countries outside BRICS, the share of total funding from domestic sources has ranged from 53% in 2016 to 57% in 2019, and it is 56% in 2020. In this group of high TB burden countries outside BRICS, countries that have sub-stantially increased domestic funding since 2015 (either through dedicated TB allocations or through health care provision) include Bangladesh, Lesotho, Philippines, Thailand, Viet Nam and Indonesia.2
International donor funding committed for 2020 and reported by NTPs3 to WHO amounts to US$ 1.0 billion, a slight increase from US$ 0.9 billion in 2019. Of this amount, 77% is from the Global Fund.
The importance of international donor funding in high TB burden countries is particularly evident when consid-ering only the TB-specific budgets included in national strategic plans for TB (Fig. 7.9, Table 7.1 and Table 7.2).
1 The list of 30 high TB burden countries used by WHO during the period 2016–2020 is explained in Annex 2. The countries are listed in Fig. 7.9, Table 7.1 and Table 7.2.
2 For further details, see the online country profiles and the Global TB Report 2020 app (Annex 3).
3 The reported international donor funding is based on reported received amounts, except for a handful of countries (e.g. Liberia, Nigeria and South Africa) that did not report expenditure data in 2020 or previous years. For these countries, imputed amounts that account for committed international funding were used instead.
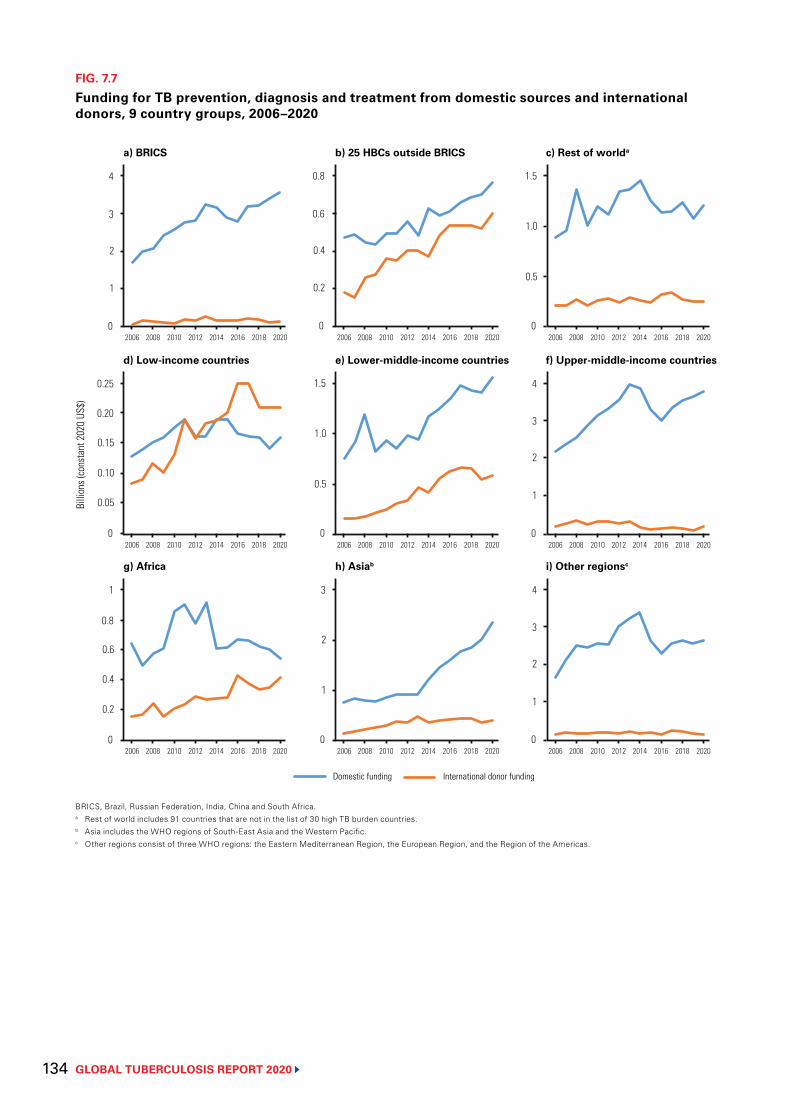
GLOBAL TUBERCULOSIS REPORT 2020 134
FIG. 7.7
Funding for TB prevention, diagnosis and treatment from domestic sources and international donors, 9 country groups, 2006–2020
BRICS, Brazil, Russian Federation, India, China and South Africa.a Rest of world includes 91 countries that are not in the list of 30 high TB burden countries.b Asia includes the WHO regions of South-East Asia and the Western Pacific.c Other regions consist of three WHO regions: the Eastern Mediterranean Region, the European Region, and the Region of the Americas.
0
a) BRICS b) 25 HBCs outside BRICS c) Rest of worlda
0.5
1.5
0 2006 2008 2010 2012 2014 2016 2018 2020
2
4
2006 2008 2010 2012 2014 2016 2018 2020 2006 2008 2010 2012 2014 2016 2018 2020
Billi
ons (
cons
tant
202
0 US
$)
0
d) Low-income countries e) Lower-middle-income countries f) Upper-middle-income countries
2
4
0 2006 2008 2010 2012 2014 2016 2018 2020 2006 2008 2010 2012 2014 2016 2018 2020 2006 2008 2010 2012 2014 2016 2018 2020
0
g) Africa h) Asiab i) Other regionsc
1
3
0 2006 2008 2010 2012 2014 2016 2018 2020
1
2006 2008 2010 2012 2014 2016 2018 2020 2006 2008 2010 2012 2014 2016 2018 2020
Domestic funding International donor funding
1
3
0
0.4
0.8
0.2
0.61.0
0.15
0.25
0.05
0.20
0.100.5
1.5
0
1.0
1
3
0.6
0.2
0.8
0.4
2
2
4
0
1
3
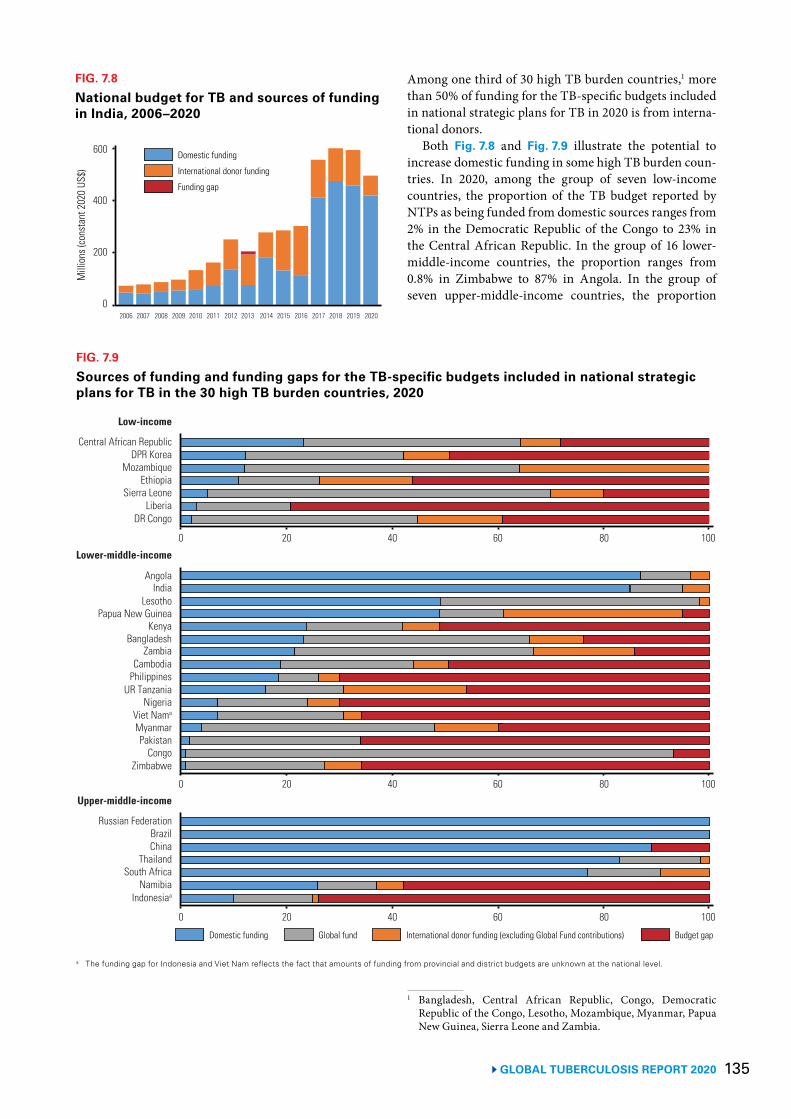
135 GLOBAL TUBERCULOSIS REPORT 2020
FIG. 7.8
National budget for TB and sources of funding in India, 2006–2020
Mill
ions
(con
stan
t 202
0 US
$)
2006 2007 2008 2009 2010 2011 2012 2013 2014 2015 2016 2017 2018 2019 2020
400
200
0
600 Domestic funding
International donor funding
Funding gap
FIG. 7.9
Sources of funding and funding gaps for the TB-specific budgets included in national strategic plans for TB in the 30 high TB burden countries, 2020
a The funding gap for Indonesia and Viet Nam reflects the fact that amounts of funding from provincial and district budgets are unknown at the national level.
DPR KoreaCentral African Republic
EthiopiaMozambique
LiberiaSierra Leone
DR Congo
0 20 40 60 80 100
Low-income
IndiaAngola
Kenya
Lesotho
ZambiaBangladesh
Cambodia
Lower-middle-income
Papua New Guinea
Philippines
NigeriaUR Tanzania
MyanmarViet Nama
PakistanCongo
Zimbabwe
0 20 40 60 80 100
BrazilRussian Federation
ThailandChina
NamibiaSouth Africa
Indonesiaa
Upper-middle-income
0 20 40 60 80 100
Domestic funding Global fund International donor funding (excluding Global Fund contributions) Budget gap
Among one third of 30 high TB burden countries,1 more than 50% of funding for the TB-specific budgets included in national strategic plans for TB in 2020 is from interna-tional donors.
Both Fig. 7.8 and Fig. 7.9 illustrate the potential to increase domestic funding in some high TB burden coun-tries. In 2020, among the group of seven low-income countries, the proportion of the TB budget reported by NTPs as being funded from domestic sources ranges from 2% in the Democratic Republic of the Congo to 23% in the Central African Republic. In the group of 16 lower- middle-income countries, the proportion ranges from 0.8% in Zimbabwe to 87% in Angola. In the group of seven upper-middle-income countries, the proportion
1 Bangladesh, Central African Republic, Congo, Democratic Republic of the Congo, Lesotho, Mozambique, Myanmar, Papua New Guinea, Sierra Leone and Zambia.
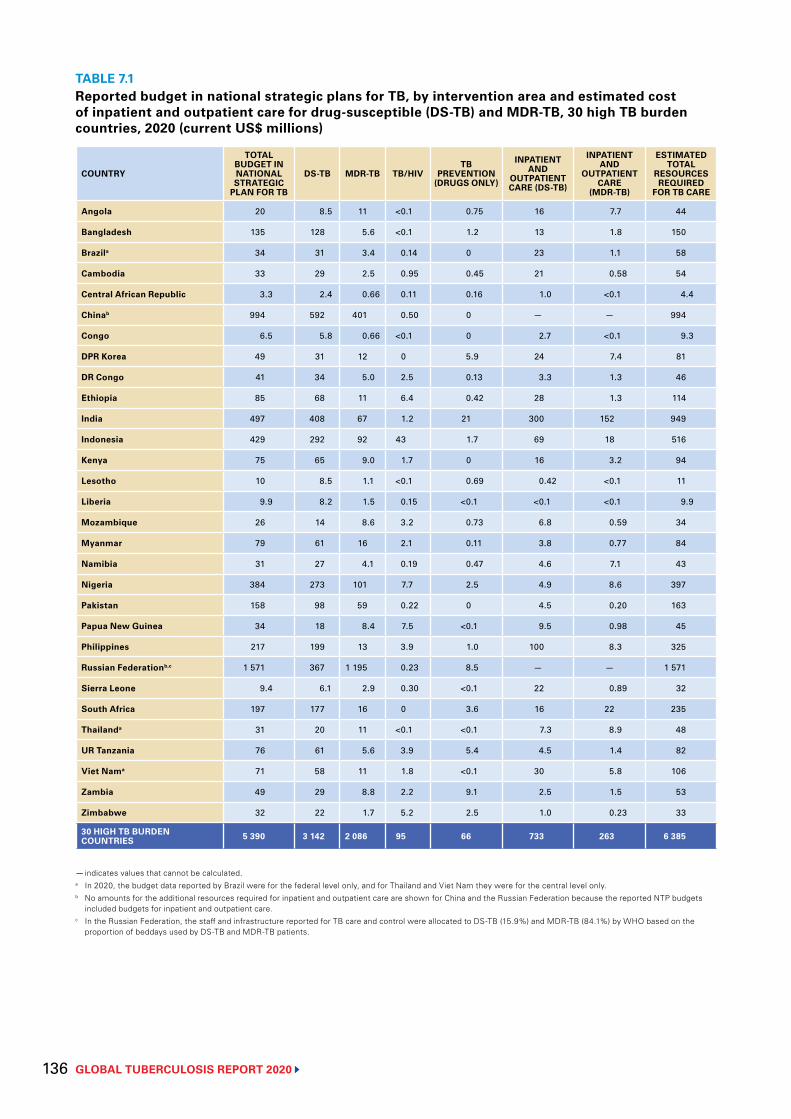
GLOBAL TUBERCULOSIS REPORT 2020 136
TABLE 7.1 Reported budget in national strategic plans for TB, by intervention area and estimated cost of inpatient and outpatient care for drug-susceptible (DS-TB) and MDR-TB, 30 high TB burden countries, 2020 (current US$ millions)
COUNTRY
TOTAL BUDGET IN NATIONAL STRATEGIC
PLAN FOR TB
DS-TB MDR-TB TB/HIVTB
PREVENTION(DRUGS ONLY)
INPATIENT AND
OUTPATIENT CARE (DS-TB)
INPATIENT AND
OUTPATIENT CARE
(MDR-TB)
ESTIMATED TOTAL
RESOURCES REQUIRED
FOR TB CARE
Angola 20 8.5 11 <0.1 0.75 16 7.7 44
Bangladesh 135 128 5.6 <0.1 1.2 13 1.8 150
Brazila 34 31 3.4 0.14 0 23 1.1 58
Cambodia 33 29 2.5 0.95 0.45 21 0.58 54
Central African Republic 3.3 2.4 0.66 0.11 0.16 1.0 <0.1 4.4
Chinab 994 592 401 0.50 0 — — 994
Congo 6.5 5.8 0.66 <0.1 0 2.7 <0.1 9.3
DPR Korea 49 31 12 0 5.9 24 7.4 81
DR Congo 41 34 5.0 2.5 0.13 3.3 1.3 46
Ethiopia 85 68 11 6.4 0.42 28 1.3 114
India 497 408 67 1.2 21 300 152 949
Indonesia 429 292 92 43 1.7 69 18 516
Kenya 75 65 9.0 1.7 0 16 3.2 94
Lesotho 10 8.5 1.1 <0.1 0.69 0.42 <0.1 11
Liberia 9.9 8.2 1.5 0.15 <0.1 <0.1 <0.1 9.9
Mozambique 26 14 8.6 3.2 0.73 6.8 0.59 34
Myanmar 79 61 16 2.1 0.11 3.8 0.77 84
Namibia 31 27 4.1 0.19 0.47 4.6 7.1 43
Nigeria 384 273 101 7.7 2.5 4.9 8.6 397
Pakistan 158 98 59 0.22 0 4.5 0.20 163
Papua New Guinea 34 18 8.4 7.5 <0.1 9.5 0.98 45
Philippines 217 199 13 3.9 1.0 100 8.3 325
Russian Federationb,c 1 571 367 1 195 0.23 8.5 — — 1 571
Sierra Leone 9.4 6.1 2.9 0.30 <0.1 22 0.89 32
South Africa 197 177 16 0 3.6 16 22 235
Thailanda 31 20 11 <0.1 <0.1 7.3 8.9 48
UR Tanzania 76 61 5.6 3.9 5.4 4.5 1.4 82
Viet Nama 71 58 11 1.8 <0.1 30 5.8 106
Zambia 49 29 8.8 2.2 9.1 2.5 1.5 53
Zimbabwe 32 22 1.7 5.2 2.5 1.0 0.23 33
30 HIGH TB BURDEN COUNTRIES 5 390 3 142 2 086 95 66 733 263 6 385
— indicates values that cannot be calculated.a In 2020, the budget data reported by Brazil were for the federal level only, and for Thailand and Viet Nam they were for the central level only.b No amounts for the additional resources required for inpatient and outpatient care are shown for China and the Russian Federation because the reported NTP budgets
included budgets for inpatient and outpatient care.c In the Russian Federation, the staff and infrastructure reported for TB care and control were allocated to DS-TB (15.9%) and MDR-TB (84.1%) by WHO based on the
proportion of beddays used by DS-TB and MDR-TB patients.
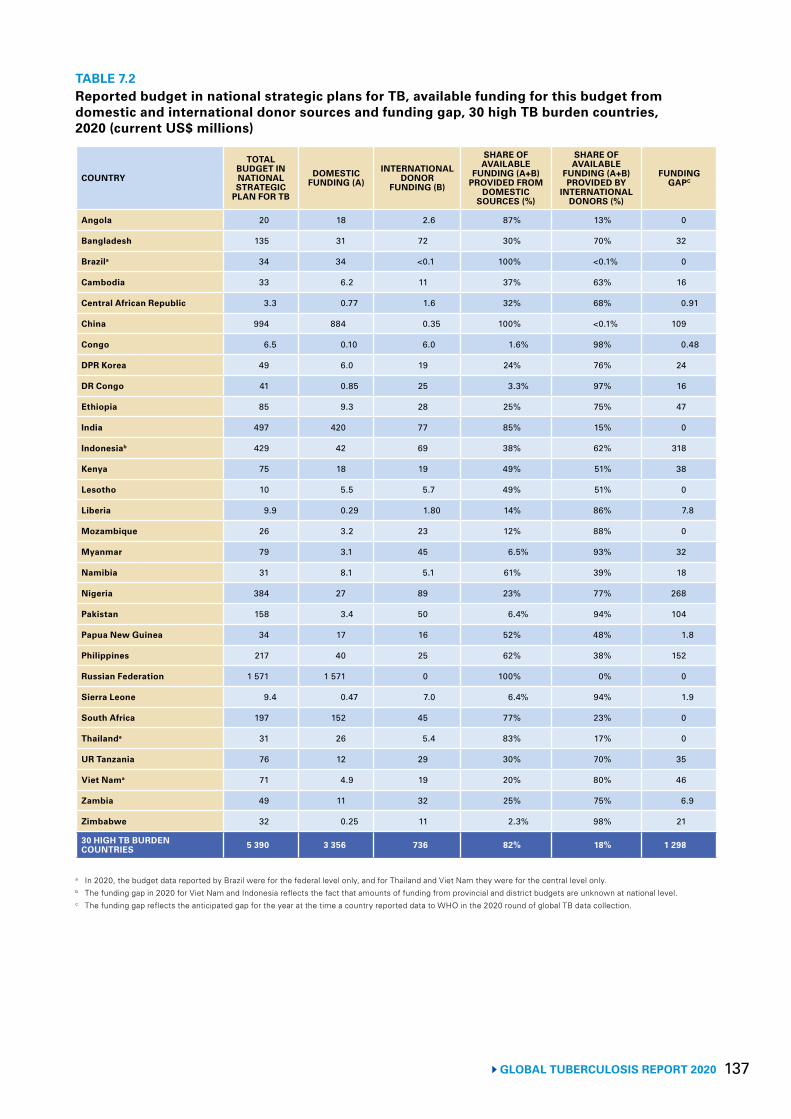
137 GLOBAL TUBERCULOSIS REPORT 2020
TABLE 7.2Reported budget in national strategic plans for TB, available funding for this budget from domestic and international donor sources and funding gap, 30 high TB burden countries, 2020 (current US$ millions)
COUNTRY
TOTAL BUDGET IN NATIONAL STRATEGIC
PLAN FOR TB
DOMESTIC FUNDING (A)
INTERNATIONAL DONOR
FUNDING (B)
SHARE OF AVAILABLE
FUNDING (A+B) PROVIDED FROM
DOMESTIC SOURCES (%)
SHARE OF AVAILABLE
FUNDING (A+B) PROVIDED BY
INTERNATIONAL DONORS (%)
FUNDING GAPC
Angola 20 18 2.6 87% 13% 0
Bangladesh 135 31 72 30% 70% 32
Brazila 34 34 <0.1 100% <0.1% 0
Cambodia 33 6.2 11 37% 63% 16
Central African Republic 3.3 0.77 1.6 32% 68% 0.91
China 994 884 0.35 100% <0.1% 109
Congo 6.5 0.10 6.0 1.6% 98% 0.48
DPR Korea 49 6.0 19 24% 76% 24
DR Congo 41 0.85 25 3.3% 97% 16
Ethiopia 85 9.3 28 25% 75% 47
India 497 420 77 85% 15% 0
Indonesiab 429 42 69 38% 62% 318
Kenya 75 18 19 49% 51% 38
Lesotho 10 5.5 5.7 49% 51% 0
Liberia 9.9 0.29 1.80 14% 86% 7.8
Mozambique 26 3.2 23 12% 88% 0
Myanmar 79 3.1 45 6.5% 93% 32
Namibia 31 8.1 5.1 61% 39% 18
Nigeria 384 27 89 23% 77% 268
Pakistan 158 3.4 50 6.4% 94% 104
Papua New Guinea 34 17 16 52% 48% 1.8
Philippines 217 40 25 62% 38% 152
Russian Federation 1 571 1 571 0 100% 0% 0
Sierra Leone 9.4 0.47 7.0 6.4% 94% 1.9
South Africa 197 152 45 77% 23% 0
Thailanda 31 26 5.4 83% 17% 0
UR Tanzania 76 12 29 30% 70% 35
Viet Nama 71 4.9 19 20% 80% 46
Zambia 49 11 32 25% 75% 6.9
Zimbabwe 32 0.25 11 2.3% 98% 21
30 HIGH TB BURDEN COUNTRIES 5 390 3 356 736 82% 18% 1 298
a In 2020, the budget data reported by Brazil were for the federal level only, and for Thailand and Viet Nam they were for the central level only.b The funding gap in 2020 for Viet Nam and Indonesia reflects the fact that amounts of funding from provincial and district budgets are unknown at national level.c The funding gap reflects the anticipated gap for the year at the time a country reported data to WHO in the 2020 round of global TB data collection.
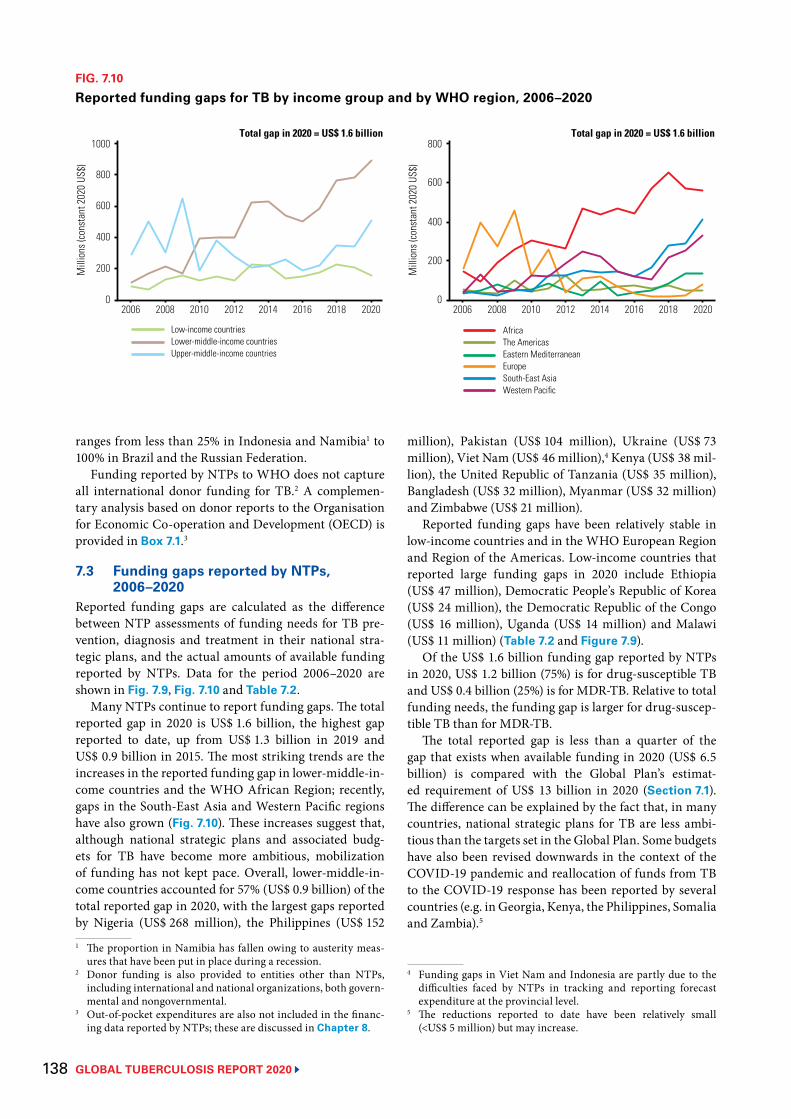
GLOBAL TUBERCULOSIS REPORT 2020 138
ranges from less than 25% in Indonesia and Namibia1 to 100% in Brazil and the Russian Federation.
Funding reported by NTPs to WHO does not capture all international donor funding for TB.2 A complemen-tary analysis based on donor reports to the Organisation for Economic Co-operation and Development (OECD) is provided in Box 7.1.3
7.3 Funding gaps reported by NTPs, 2006–2020
Reported funding gaps are calculated as the difference between NTP assessments of funding needs for TB pre-vention, diagnosis and treatment in their national stra-tegic plans, and the actual amounts of available funding reported by NTPs. Data for the period 2006–2020 are shown in Fig. 7.9, Fig. 7.10 and Table 7.2.
Many NTPs continue to report funding gaps. The total reported gap in 2020 is US$ 1.6 billion, the highest gap reported to date, up from US$ 1.3 billion in 2019 and US$ 0.9 billion in 2015. The most striking trends are the increases in the reported funding gap in lower-middle-in-come countries and the WHO African Region; recently, gaps in the South-East Asia and Western Pacific regions have also grown (Fig. 7.10). These increases suggest that, although national strategic plans and associated budg-ets for TB have become more ambitious, mobilization of funding has not kept pace. Overall, lower-middle-in-come countries accounted for 57% (US$ 0.9 billion) of the total reported gap in 2020, with the largest gaps reported by Nigeria (US$ 268 million), the Philippines (US$ 152 1 The proportion in Namibia has fallen owing to austerity meas-
ures that have been put in place during a recession.2 Donor funding is also provided to entities other than NTPs,
including international and national organizations, both govern-mental and nongovernmental.
3 Out-of-pocket expenditures are also not included in the financ-ing data reported by NTPs; these are discussed in Chapter 8.
million), Pakistan (US$ 104 million), Ukraine (US$ 73 million), Viet Nam (US$ 46 million),4 Kenya (US$ 38 mil-lion), the United Republic of Tanzania (US$ 35 million), Bangladesh (US$ 32 million), Myanmar (US$ 32 million) and Zimbabwe (US$ 21 million).
Reported funding gaps have been relatively stable in low-income countries and in the WHO European Region and Region of the Americas. Low-income countries that reported large funding gaps in 2020 include Ethiopia (US$ 47 million), Democratic People’s Republic of Korea (US$ 24 million), the Democratic Republic of the Congo (US$ 16 million), Uganda (US$ 14 million) and Malawi (US$ 11 million) (Table 7.2 and Figure 7.9).
Of the US$ 1.6 billion funding gap reported by NTPs in 2020, US$ 1.2 billion (75%) is for drug-susceptible TB and US$ 0.4 billion (25%) is for MDR-TB. Relative to total funding needs, the funding gap is larger for drug-suscep-tible TB than for MDR-TB.
The total reported gap is less than a quarter of the gap that exists when available funding in 2020 (US$ 6.5 billion) is compared with the Global Plan’s estimat-ed requirement of US$ 13 billion in 2020 (Section 7.1). The difference can be explained by the fact that, in many countries, national strategic plans for TB are less ambi-tious than the targets set in the Global Plan. Some budgets have also been revised downwards in the context of the COVID-19 pandemic and reallocation of funds from TB to the COVID-19 response has been reported by several countries (e.g. in Georgia, Kenya, the Philippines, Somalia and Zambia).5
4 Funding gaps in Viet Nam and Indonesia are partly due to the difficulties faced by NTPs in tracking and reporting forecast expenditure at the provincial level.
5 The reductions reported to date have been relatively small (<US$ 5 million) but may increase.
FIG. 7.10
Reported funding gaps for TB by income group and by WHO region, 2006–2020M
illio
ns (c
onst
ant 2
020
US$)
2006 2008 2010 2012 2014 2016 2018 2020
400
200
0
600
800
1000Total gap in 2020 = US$ 1.6 billion
Low-income countriesLower-middle-income countriesUpper-middle-income countries
Mill
ions
(con
stan
t 202
0 US
$)
2006 2008 2010 2012 2014 2016 2018 2020
400
200
0
600
800Total gap in 2020 = US$ 1.6 billion
AfricaThe AmericasEastern Mediterranean Europe South-East Asia Western Pacific
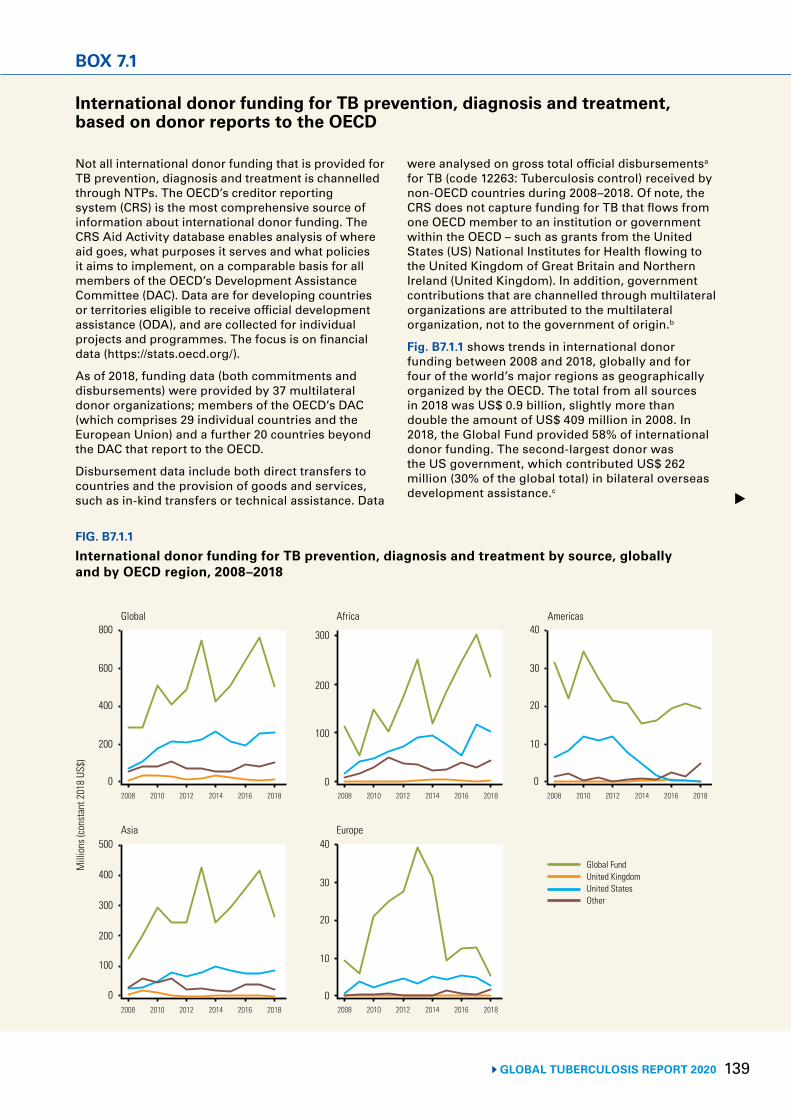
139 GLOBAL TUBERCULOSIS REPORT 2020
BOX 7.1
International donor funding for TB prevention, diagnosis and treatment, based on donor reports to the OECD
FIG. B7.1.1
International donor funding for TB prevention, diagnosis and treatment by source, globally and by OECD region, 2008–2018
Global FundUnited KingdomUnited StatesOther
Mill
ions
(con
stan
t 201
8 US
$)
Global Africa Americas
Asia Europe
0
200
400
600
800
0
10
20
30
40
100
200
300
400
500
0
10
20
30
40
0
100
200
300
2008 2010 2012 2014 2016 2018 2008 2010 2012 2014 2016 2018 2008 2010 2012 2014 2016 2018
2008 2010 2012 2014 2016 2018
0 2008 2010 2012 2014 2016 2018
Not all international donor funding that is provided for TB prevention, diagnosis and treatment is channelled through NTPs. The OECD’s creditor reporting system (CRS) is the most comprehensive source of information about international donor funding. The CRS Aid Activity database enables analysis of where aid goes, what purposes it serves and what policies it aims to implement, on a comparable basis for all members of the OECD’s Development Assistance Committee (DAC). Data are for developing countries or territories eligible to receive official development assistance (ODA), and are collected for individual projects and programmes. The focus is on financial data (https://stats.oecd.org/).
As of 2018, funding data (both commitments and disbursements) were provided by 37 multilateral donor organizations; members of the OECD’s DAC (which comprises 29 individual countries and the European Union) and a further 20 countries beyond the DAC that report to the OECD.
Disbursement data include both direct transfers to countries and the provision of goods and services, such as in-kind transfers or technical assistance. Data
were analysed on gross total official disbursementsa for TB (code 12263: Tuberculosis control) received by non-OECD countries during 2008–2018. Of note, the CRS does not capture funding for TB that flows from one OECD member to an institution or government within the OECD – such as grants from the United States (US) National Institutes for Health flowing to the United Kingdom of Great Britain and Northern Ireland (United Kingdom). In addition, government contributions that are channelled through multilateral organizations are attributed to the multilateral organization, not to the government of origin.b
Fig. B7.1.1 shows trends in international donor funding between 2008 and 2018, globally and for four of the world’s major regions as geographically organized by the OECD. The total from all sources in 2018 was US$ 0.9 billion, slightly more than double the amount of US$ 409 million in 2008. In 2018, the Global Fund provided 58% of international donor funding. The second-largest donor was the US government, which contributed US$ 262 million (30% of the global total) in bilateral overseas development assistance.c
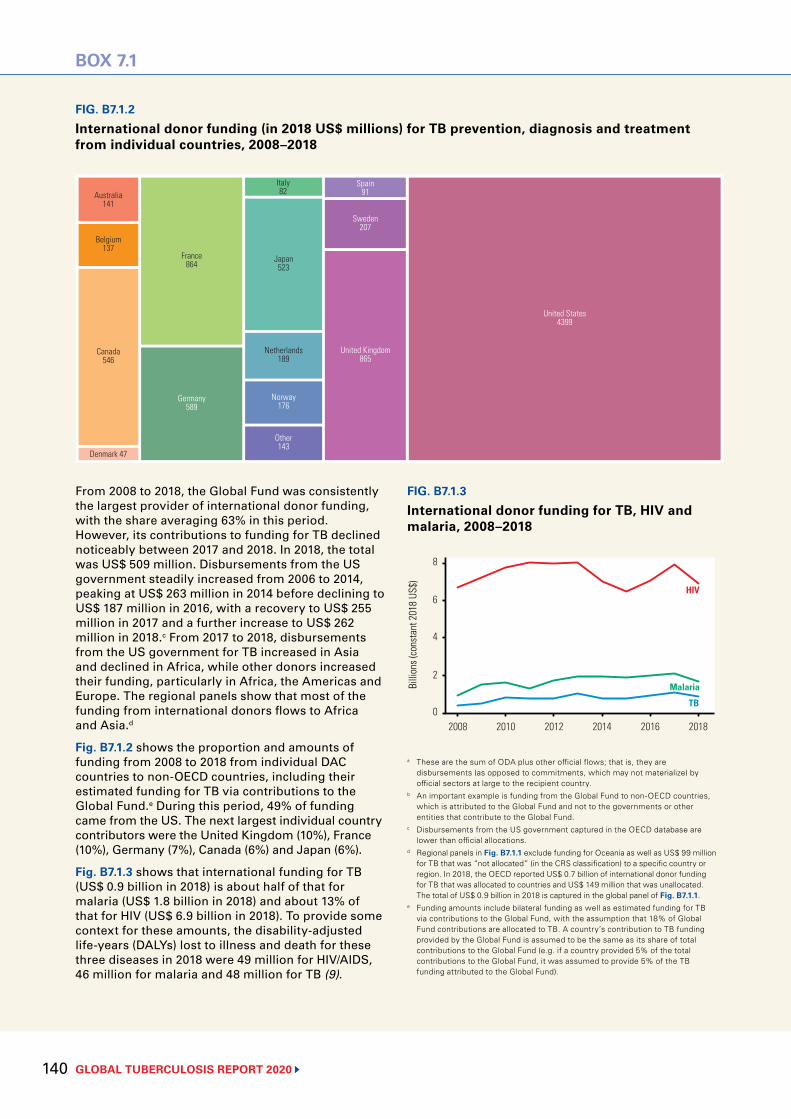
GLOBAL TUBERCULOSIS REPORT 2020 140
BOX 7.1
FIG. B7.1.2
International donor funding (in 2018 US$ millions) for TB prevention, diagnosis and treatment from individual countries, 2008–2018
FIG. B7.1.3
International donor funding for TB, HIV and malaria, 2008–2018
Australia141
Belgium137
Canada546
Denmark 47
Germany589
France864
Japan523
Netherlands189
Norway176
Other143
Italy82
Sweden207
Spain91
United Kingdom865
United States4399
HIV
Malaria
TB
Billi
ons (
cons
tant
201
8 US
$)
2008 2010 2012 2014 2016 2018
4
2
0
8
6
From 2008 to 2018, the Global Fund was consistently the largest provider of international donor funding, with the share averaging 63% in this period. However, its contributions to funding for TB declined noticeably between 2017 and 2018. In 2018, the total was US$ 509 million. Disbursements from the US government steadily increased from 2006 to 2014, peaking at US$ 263 million in 2014 before declining to US$ 187 million in 2016, with a recovery to US$ 255 million in 2017 and a further increase to US$ 262 million in 2018.c From 2017 to 2018, disbursements from the US government for TB increased in Asia and declined in Africa, while other donors increased their funding, particularly in Africa, the Americas and Europe. The regional panels show that most of the funding from international donors flows to Africa and Asia.d
Fig. B7.1.2 shows the proportion and amounts of funding from 2008 to 2018 from individual DAC countries to non-OECD countries, including their estimated funding for TB via contributions to the Global Fund.e During this period, 49% of funding came from the US. The next largest individual country contributors were the United Kingdom (10%), France (10%), Germany (7%), Canada (6%) and Japan (6%).
Fig. B7.1.3 shows that international funding for TB (US$ 0.9 billion in 2018) is about half of that for malaria (US$ 1.8 billion in 2018) and about 13% of that for HIV (US$ 6.9 billion in 2018). To provide some context for these amounts, the disability-adjusted life-years (DALYs) lost to illness and death for these three diseases in 2018 were 49 million for HIV/AIDS, 46 million for malaria and 48 million for TB (9).
a These are the sum of ODA plus other official flows; that is, they are disbursements (as opposed to commitments, which may not materialize) by official sectors at large to the recipient country.
b An important example is funding from the Global Fund to non-OECD countries, which is attributed to the Global Fund and not to the governments or other entities that contribute to the Global Fund.
c Disbursements from the US government captured in the OECD database are lower than official allocations.
d Regional panels in Fig. B7.1.1 exclude funding for Oceania as well as US$ 99 million for TB that was “not allocated” (in the CRS classification) to a specific country or region. In 2018, the OECD reported US$ 0.7 billion of international donor funding for TB that was allocated to countries and US$ 149 million that was unallocated. The total of US$ 0.9 billion in 2018 is captured in the global panel of Fig. B7.1.1.
e Funding amounts include bilateral funding as well as estimated funding for TB via contributions to the Global Fund, with the assumption that 18% of Global Fund contributions are allocated to TB. A country’s contribution to TB funding provided by the Global Fund is assumed to be the same as its share of total contributions to the Global Fund (e.g. if a country provided 5% of the total contributions to the Global Fund, it was assumed to provide 5% of the TB funding attributed to the Global Fund).
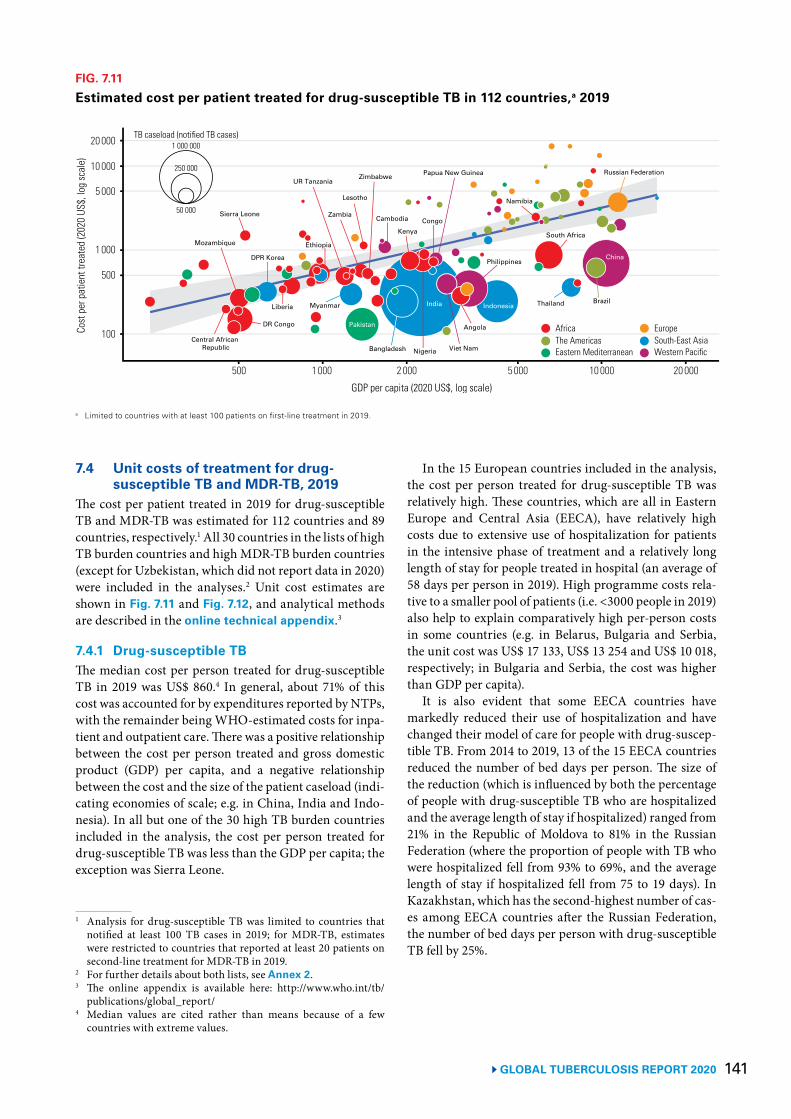
141 GLOBAL TUBERCULOSIS REPORT 2020
7.4 Unit costs of treatment for drug-susceptible TB and MDR-TB, 2019
The cost per patient treated in 2019 for drug-susceptible TB and MDR-TB was estimated for 112 countries and 89 countries, respectively.1 All 30 countries in the lists of high TB burden countries and high MDR-TB burden countries (except for Uzbekistan, which did not report data in 2020) were included in the analyses.2 Unit cost estimates are shown in Fig. 7.11 and Fig. 7.12, and analytical methods are described in the online technical appendix.3
7.4.1 Drug-susceptible TBThe median cost per person treated for drug-susceptible TB in 2019 was US$ 860.4 In general, about 71% of this cost was accounted for by expenditures reported by NTPs, with the remainder being WHO-estimated costs for inpa-tient and outpatient care. There was a positive relationship between the cost per person treated and gross domestic product (GDP) per capita, and a negative relationship between the cost and the size of the patient caseload (indi-cating economies of scale; e.g. in China, India and Indo-nesia). In all but one of the 30 high TB burden countries included in the analysis, the cost per person treated for drug-susceptible TB was less than the GDP per capita; the exception was Sierra Leone.
1 Analysis for drug-susceptible TB was limited to countries that notified at least 100 TB cases in 2019; for MDR-TB, estimates were restricted to countries that reported at least 20 patients on second-line treatment for MDR-TB in 2019.
2 For further details about both lists, see Annex 2. 3 The online appendix is available here: http://www.who.int/tb/
publications/global_report/4 Median values are cited rather than means because of a few
countries with extreme values.
FIG. 7.11
Estimated cost per patient treated for drug-susceptible TB in 112 countries,a 2019
a Limited to countries with at least 100 patients on first-line treatment in 2019.
Cost
per
pat
ient
trea
ted
(202
0 US
$, lo
g sc
ale)
500 1 000 2 000 5 000 10 000 20 000
500
100
1 000
5 000
GDP per capita (2020 US$, log scale)
10 000
20 000
EuropeSouth-East AsiaWestern Pacific
AfricaThe AmericasEastern Mediterranean
TB caseload (notified TB cases)
50 000
250 000
1 000 000
India
Pakistan
Nigeria Viet NamCentral African
Republic
Myanmar
DPR Korea
Kenya
Angola
Mozambique
Zimbabwe
Bangladesh
DR Congo
Zambia Cambodia
Namibia
Ethiopia
Papua New Guinea
Sierra Leone
Russian Federation
South Africa
Philippines
Indonesia
Peru
BrazilThailandIndonesia
UR Tanzania
China
Lesotho
Liberia
Russian Federation
Congo
In the 15 European countries included in the analysis, the cost per person treated for drug-susceptible TB was relatively high. These countries, which are all in Eastern Europe and Central Asia (EECA), have relatively high costs due to extensive use of hospitalization for patients in the intensive phase of treatment and a relatively long length of stay for people treated in hospital (an average of 58 days per person in 2019). High programme costs rela-tive to a smaller pool of patients (i.e. <3000 people in 2019) also help to explain comparatively high per-person costs in some countries (e.g. in Belarus, Bulgaria and Serbia, the unit cost was US$ 17 133, US$ 13 254 and US$ 10 018, respectively; in Bulgaria and Serbia, the cost was higher than GDP per capita).
It is also evident that some EECA countries have markedly reduced their use of hospitalization and have changed their model of care for people with drug-suscep-tible TB. From 2014 to 2019, 13 of the 15 EECA countries reduced the number of bed days per person. The size of the reduction (which is influenced by both the percentage of people with drug-susceptible TB who are hospitalized and the average length of stay if hospitalized) ranged from 21% in the Republic of Moldova to 81% in the Russian Federation (where the proportion of people with TB who were hospitalized fell from 93% to 69%, and the average length of stay if hospitalized fell from 75 to 19 days). In Kazakhstan, which has the second-highest number of cas-es among EECA countries after the Russian Federation, the number of bed days per person with drug-susceptible TB fell by 25%.
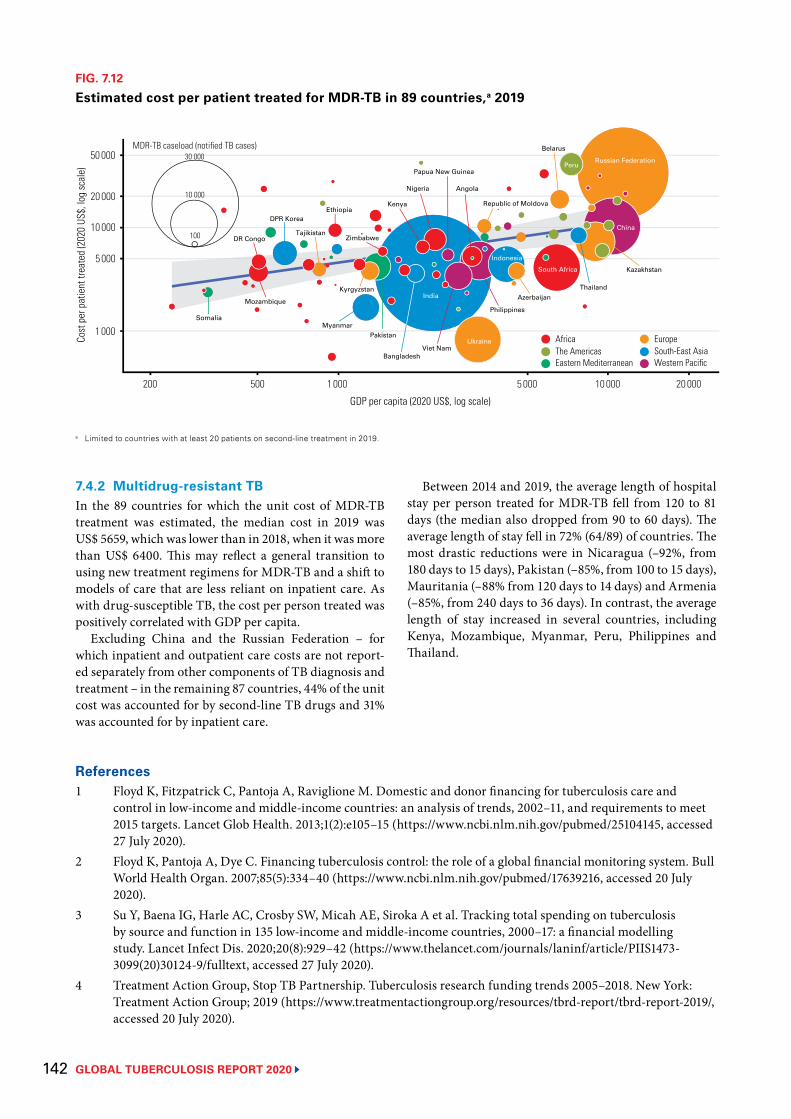
GLOBAL TUBERCULOSIS REPORT 2020 142
References1 Floyd K, Fitzpatrick C, Pantoja A, Raviglione M. Domestic and donor financing for tuberculosis care and
control in low-income and middle-income countries: an analysis of trends, 2002–11, and requirements to meet 2015 targets. Lancet Glob Health. 2013;1(2):e105–15 (https://www.ncbi.nlm.nih.gov/pubmed/25104145, accessed 27 July 2020).
2 Floyd K, Pantoja A, Dye C. Financing tuberculosis control: the role of a global financial monitoring system. Bull World Health Organ. 2007;85(5):334–40 (https://www.ncbi.nlm.nih.gov/pubmed/17639216, accessed 20 July 2020).
3 Su Y, Baena IG, Harle AC, Crosby SW, Micah AE, Siroka A et al. Tracking total spending on tuberculosis by source and function in 135 low-income and middle-income countries, 2000–17: a financial modelling study. Lancet Infect Dis. 2020;20(8):929–42 (https://www.thelancet.com/journals/laninf/article/PIIS1473-3099(20)30124-9/fulltext, accessed 27 July 2020).
4 Treatment Action Group, Stop TB Partnership. Tuberculosis research funding trends 2005–2018. New York: Treatment Action Group; 2019 (https://www.treatmentactiongroup.org/resources/tbrd-report/tbrd-report-2019/, accessed 20 July 2020).
7.4.2 Multidrug-resistant TBIn the 89 countries for which the unit cost of MDR-TB treatment was estimated, the median cost in 2019 was US$ 5659, which was lower than in 2018, when it was more than US$ 6400. This may reflect a general transition to using new treatment regimens for MDR-TB and a shift to models of care that are less reliant on inpatient care. As with drug-susceptible TB, the cost per person treated was positively correlated with GDP per capita.
Excluding China and the Russian Federation – for which inpatient and outpatient care costs are not report-ed separately from other components of TB diagnosis and treatment – in the remaining 87 countries, 44% of the unit cost was accounted for by second-line TB drugs and 31% was accounted for by inpatient care.
FIG. 7.12
Estimated cost per patient treated for MDR-TB in 89 countries,a 2019
a Limited to countries with at least 20 patients on second-line treatment in 2019.
EuropeSouth-East AsiaWestern Pacific
AfricaThe AmericasEastern Mediterranean
100
10 000
MDR-TB caseload (notified TB cases)30 000
India
Ukraine
Philippines
Viet Nam
PakistanMyanmar
DPR Korea
Nigeria Angola
Mozambique
Kyrgyzstan
Bangladesh
DR CongoTajikistan
Kenya Republic of MoldovaEthiopia
Papua New Guinea
Zimbabwe
Russian Federation
South Africa Kazakhstan
Indonesia
Peru
Belarus
ThailandAzerbaijan
Somalia
China
Cost
per
pat
ient
trea
ted
(202
0 US
$, lo
g sc
ale)
200 500 1 000 5 000 10 000 20 000
1 000
5 000
GDP per capita (2020 US$, log scale)
10 000
20 000
50 000
Between 2014 and 2019, the average length of hospital stay per person treated for MDR-TB fell from 120 to 81 days (the median also dropped from 90 to 60 days). The average length of stay fell in 72% (64/89) of countries. The most drastic reductions were in Nicaragua (–92%, from 180 days to 15 days), Pakistan (–85%, from 100 to 15 days), Mauritania (–88% from 120 days to 14 days) and Armenia (–85%, from 240 days to 36 days). In contrast, the average length of stay increased in several countries, including Kenya, Mozambique, Myanmar, Peru, Philippines and Thailand.
143 GLOBAL TUBERCULOSIS REPORT 2020
5 United Nations General Assembly. Resolution 73/3: Political declaration of the high-level meeting of the General Assembly on the fight against tuberculosis. United Nations; 2018 (https://www.un.org/en/ga/search/view_doc.asp?symbol=A/RES/73/3, accessed 20 July 2020).
6 Tuberculosis data [website]. Geneva: World Health Organization; 2020 (https://www.who.int/tb/data/en/, accessed 5 August 2020).
7 The Global Plan to End TB, 2018–2022. Geneva: Stop TB Partnership; 2019 (http://stoptb.org/global/plan/plan1822.asp, accessed 20 July 2020).
8 The Global Plan to End TB, 2016–2020. Geneva: Stop TB Partnership; 2015 (http://www.stoptb.org/global/plan/plan2/, accessed 20 July 2020).
9 GBD 2019 Diseases and Injuries Collaborators. Global burden of 369 diseases and injuries, 1990–2019: a systematic analysis for the Global Burden of Disease Study 2019. Lancet. In press.
GLOBAL TUBERCULOSIS REPORT 2020 144
A father and his young daughter being treated for severe malnutrition, Papua New Guinea.Yoshi Shimizu/WHO
145 GLOBAL TUBERCULOSIS REPORT 2020
Chapter 8
Universal health coverage, TB determinants and multisectoral action
Key facts and messagesAll countries have committed to global targets for reductions in tuberculosis (TB) disease burden, and improved access to TB prevention, diagnosis and treatment, through their adoption of the United Nations (UN) Sustainable Development Goals (SDGs), the End TB Strategy and the political declaration at the first UN high-level meeting on TB. Achieving these targets requires the provision of TB care and prevention services within the broader context of universal health coverage (UHC), and multisectoral action and accountability to address the broader social and economic determinants and consequences of TB.
UHC means that everyone can obtain the health services they need without suffering financial hardship. SDG Target 3.8 is to achieve UHC by 2030.
The two SDG indicators to monitor progress are a UHC service coverage index (SCI), and the percentage of the population experiencing household out-of-pocket expenditures on health care that are large in relation to total household expenditures or income.
The global SCI increased steadily between 2000 and 2017, from 45 (out of 100) in 2000 to 66 in 2017. Improvements were made in all World Health Organization (WHO) regions and all World Bank income groups. However, values of the SCI in 2017 in the 30 high TB burden countries were mostly in the range of 40–60.
In 2015, at least 930 million people, or 12.7% of the world’s population, faced out-of-pocket expenditures on health care that accounted for 10% or more of their household expenditure or income (a threshold used within
the SDG framework to define direct expenditures on health in the general population as catastrophic), up from 9.4% in 2010.
Among high TB burden countries, Thailand stands out as having a high SCI of 80 and a low level of catastrophic health expenditures (2% of households). Brazil and China both had a relatively high SCI of 79.
The End TB Strategy includes a target that no TB patients and their households face total costs (including direct medical expenditures, non-medical expenditures and income losses) that are catastrophic (in this case, defined as costs equivalent to >20% of a TB-affected household’s expenditure or income).a Since 2016, 19 countries have completed a national facility-based survey of costs faced by TB patients and their households.
In the 17 countries (including 10 high TB burden countries) that have reported survey results, the percentage of TB patients and their households facing total costs that exceeded 20% of household expenditure or income ranged from 19% to 83%. The pooled average for all 17 countries, weighted for each country’s number of notified cases, was 49% (95% confidence interval [CI]: 34–63%). Survey results have been used to inform approaches to health financing, service delivery and social protection that will reduce these costs.
Many new cases of TB are attributable to five risk factors: undernutrition, HIV infection, alcohol use disorders, smoking (especially among men) and diabetes. In 2019, the estimated
numbers of cases attributable to these risk factors were 2.2 million, 0.76 million, 0.72 million, 0.70 million and 0.35 million, respectively. In the context of the COVID-19 pandemic, multisectoral action to address these and other determinants of TB and its consequences, including poverty and social protection, is more important than ever.
A multisectoral accountability framework for TB (MAF-TB) was released by WHO in 2019. The framework has four major components: commitments; actions; monitoring and reporting; and review. These apply at the global/regional level, and at national (including subnational) level.
At global level, actions taken by WHO include: the development of a MAF-TB checklist; high-level missions; the WHO Director-General Initiative Find.Treat.All#EndTB; engagement of civil society and youth; updating of guidelines and tools; and development and release of a global strategy for TB research and innovation.
Since the UN high-level meeting on TB, 25/30 high TB burden countries have developed or updated a national strategic plan for TB, with countries reporting the involvement of civil society and affected communities in 29/30. Most high TB burden countries (27/30) reported that they produce an annual TB report. High-level review mechanisms were stated to be in place in 16/30 countries.a This TB-specific indicator is not comparable to
the SDG indicator of catastrophic expenditures on health care. See Box 8.1 for a full explanation of the differences.
GLOBAL TUBERCULOSIS REPORT 2020 146
The tuberculosis (TB) epidemic is strongly influenced by social and economic development, and by health-re-lated risk factors. For example, numbers of TB cases and deaths started to decline in western Europe, North Amer-ica and some other parts of the world around the turn of the 20th century, as incomes grew, and housing and nutrition improved (1, 2). The fastest declines in western Europe occurred in the 1950s and 1960s, in the context of progress towards universal health coverage (UHC), rapid social and economic development, and the availa-bility of effective drug treatments. The links between TB and poverty, social protection, income per capita, indoor air pollution, undernutrition, diabetes, HIV, alcohol use disorders and smoking are well recognized and have been summarized elsewhere (3-6).
All countries have committed to global targets for reductions in TB disease burden and improved access to TB prevention, diagnosis and treatment through their adoption of the United Nations (UN) Sustainable Devel-opment Goals (SDGs), the End TB Strategy and the polit-ical declaration at the first UN high-level meeting on TB (Chapter 2) (7-9). Achieving these targets requires provision of TB care and prevention services within the broader context of UHC, and multisectoral action and accountability to address the broader social and economic determinants and consequences of TB. For example, the global target to reduce TB deaths by 90% between 2015 and 2030 is only feasible if everyone who develops TB can access high-quality treatment. The global target to reduce TB incidence by 80% between 2015 and 2030 is only feasi-ble if the annual decline in TB incidence can be accelerat-ed to 10% per year by 2025, which requires both progress towards UHC and action on the broader social and eco-nomic factors that strongly influence TB epidemics.
In 2020, the COVID-19 pandemic has caused enor-mous health, social and economic impacts, which are like-ly to persist in 2021 and beyond. There have been negative impacts on broader social and economic determinants that influence the TB epidemic (e.g. poverty and undernu-trition), and access to and provision of health services. In combination, these impacts threaten to reverse recent pro-gress towards global TB targets (Chapter 2, Chapter 3).
This chapter discusses UHC and a range of health, social and economic factors that influence the TB epi-demic and the consequences of developing TB disease. Section 8.1 provides an overview of the status of pro-gress towards UHC at global, regional and country levels. Section 8.2 synthesizes results from national surveys of costs faced by TB patients and their households complet-ed in 2016–2020, and highlights the implications of these results for approaches to service delivery, financing and social protection that address TB-related considerations. Section 8.3 describes the status of 11 health, social and economic variables that are associated with TB incidence, based on a TB-SDG monitoring framework developed by the World Health Organization (WHO), and discusses how these variables are likely to be affected by the COV-ID-19 pandemic. Section 8.4 highlights progress made
in implementing key elements of the WHO multisectoral accountability framework for TB, following a request from Member States to develop such a framework and its finalization in May 2019 (10).
8.1 Global progress towards UHCUHC means that everyone can obtain the health services they need without suffering financial hardship (11).
The SDG targets are for 2030, and SDG Target 3.8 is defined as “By 2030, achieve universal health coverage, including financial risk protection, access to quality essential health care services and access to safe, effective, quality and affordable essential medicines and vaccines for all”. In September 2019, UN Member States reaffirmed their commitment to this target at a UN General Assem-bly high-level meeting on UHC. A new target – that an additional 1 billion people have access to quality essential health services by 2023 – was also set (12).
Two SDG indicators have been defined to monitor progress towards SDG Target 3.8. The first (Indicator 3.8.1) is the coverage of essential health services, which is measured using a composite index (with values from 0 to 100) based on 16 tracer indicators (one of which is TB treatment). The second (Indicator 3.8.2) is the “pro-portion of the population with large household expendi-tures on health as a share of total household expenditure or income”.1 The SDG framework includes two thresholds (10% and 25%) to define “large”. When these thresholds for household out-of-pocket expenditures on health2 are surpassed, they are classified as “catastrophic”, because they may adversely affect a household’s ability to pay for other basic needs.
The latest WHO report on tracking progress towards UHC and a thematic report on financial protection jointly produced with the World Bank were both released in Sep-tember 2019 (13, 14). These reports cover an assessment of the status of the two SDG indicators for UHC based on the latest available data, and key findings are summarized in this chapter. For catastrophic health expenditures, results based on the threshold of 10% of total household expend-iture or income are provided.
8.1.1 UHC service coverage indexThe service coverage index (SCI) increased steadily between 2000 and 2017, from a global value of 45 (out of 100) in 2000 to 66 in 2017 (Fig. 8.1). Improvements were made in all WHO regions (especially the Western Pacific Region) and all World Bank income groups. In both 2000 and 2017, low-income and lower-middle-income coun-
1 This measure is population based, and therefore the denominator includes many people who either did not use health services or had only minor contact with the health system.
2 Out-of-pocket health expenditures are defined as household spending on medicines, health products and health care services (outpatient, inpatient and other health services such as medical laboratory services) that are not reimbursed by a third party (e.g. the government, a health insurance fund or a private insurance company). They exclude household spending on health insurance premiums.
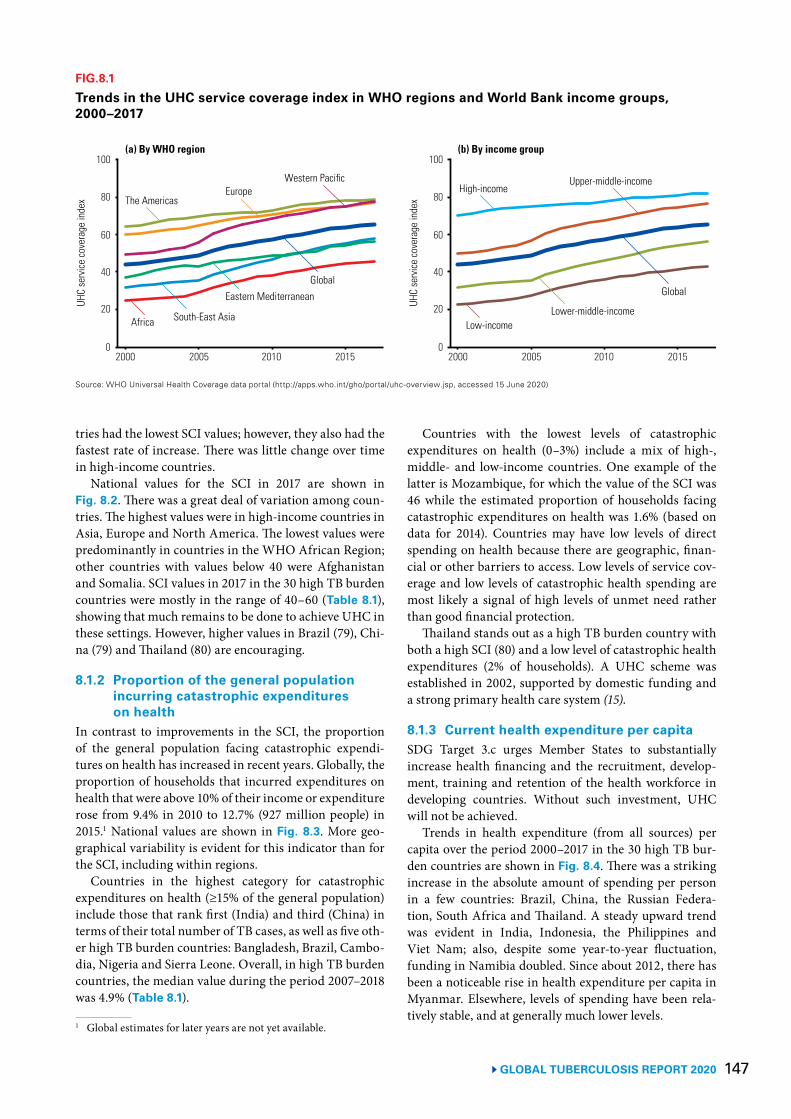
147 GLOBAL TUBERCULOSIS REPORT 2020
tries had the lowest SCI values; however, they also had the fastest rate of increase. There was little change over time in high-income countries.
National values for the SCI in 2017 are shown in Fig. 8.2. There was a great deal of variation among coun-tries. The highest values were in high-income countries in Asia, Europe and North America. The lowest values were predominantly in countries in the WHO African Region; other countries with values below 40 were Afghanistan and Somalia. SCI values in 2017 in the 30 high TB burden countries were mostly in the range of 40–60 (Table 8.1), showing that much remains to be done to achieve UHC in these settings. However, higher values in Brazil (79), Chi-na (79) and Thailand (80) are encouraging.
8.1.2 Proportion of the general population incurring catastrophic expenditures on health
In contrast to improvements in the SCI, the proportion of the general population facing catastrophic expendi-tures on health has increased in recent years. Globally, the proportion of households that incurred expenditures on health that were above 10% of their income or expenditure rose from 9.4% in 2010 to 12.7% (927 million people) in 2015.1 National values are shown in Fig. 8.3. More geo-graphical variability is evident for this indicator than for the SCI, including within regions.
Countries in the highest category for catastrophic expenditures on health (≥15% of the general population) include those that rank first (India) and third (China) in terms of their total number of TB cases, as well as five oth-er high TB burden countries: Bangladesh, Brazil, Cambo-dia, Nigeria and Sierra Leone. Overall, in high TB burden countries, the median value during the period 2007–2018 was 4.9% (Table 8.1).
1 Global estimates for later years are not yet available.
FIG.8.1
Trends in the UHC service coverage index in WHO regions and World Bank income groups, 2000–2017
Source: WHO Universal Health Coverage data portal (http://apps.who.int/gho/portal/uhc-overview.jsp, accessed 15 June 2020)
2000 2005 2010 2015
60
40
20
80
100
0
UHC
serv
ice co
vera
ge in
dex
(a) By WHO region
The AmericasEurope
Western Pacific
Africa South-East Asia
Eastern MediterraneanGlobal
Global
High-incomeUpper-middle-income
Low-incomeLower-middle-income
2000 2005 2010 2015
60
40
20
80
100
0
UHC
serv
ice co
vera
ge in
dex
(b) By income group
Countries with the lowest levels of catastrophic expenditures on health (0–3%) include a mix of high-, middle- and low-income countries. One example of the latter is Mozambique, for which the value of the SCI was 46 while the estimated proportion of households facing catastrophic expenditures on health was 1.6% (based on data for 2014). Countries may have low levels of direct spending on health because there are geographic, finan-cial or other barriers to access. Low levels of service cov-erage and low levels of catastrophic health spending are most likely a signal of high levels of unmet need rather than good financial protection.
Thailand stands out as a high TB burden country with both a high SCI (80) and a low level of catastrophic health expenditures (2% of households). A UHC scheme was established in 2002, supported by domestic funding and a strong primary health care system (15).
8.1.3 Current health expenditure per capitaSDG Target 3.c urges Member States to substantially increase health financing and the recruitment, develop-ment, training and retention of the health workforce in developing countries. Without such investment, UHC will not be achieved.
Trends in health expenditure (from all sources) per capita over the period 2000–2017 in the 30 high TB bur-den countries are shown in Fig. 8.4. There was a striking increase in the absolute amount of spending per person in a few countries: Brazil, China, the Russian Federa-tion, South Africa and Thailand. A steady upward trend was evident in India, Indonesia, the Philippines and Viet Nam; also, despite some year-to-year fluctuation, funding in Namibia doubled. Since about 2012, there has been a noticeable rise in health expenditure per capita in Myanmar. Elsewhere, levels of spending have been rela-tively stable, and at generally much lower levels.
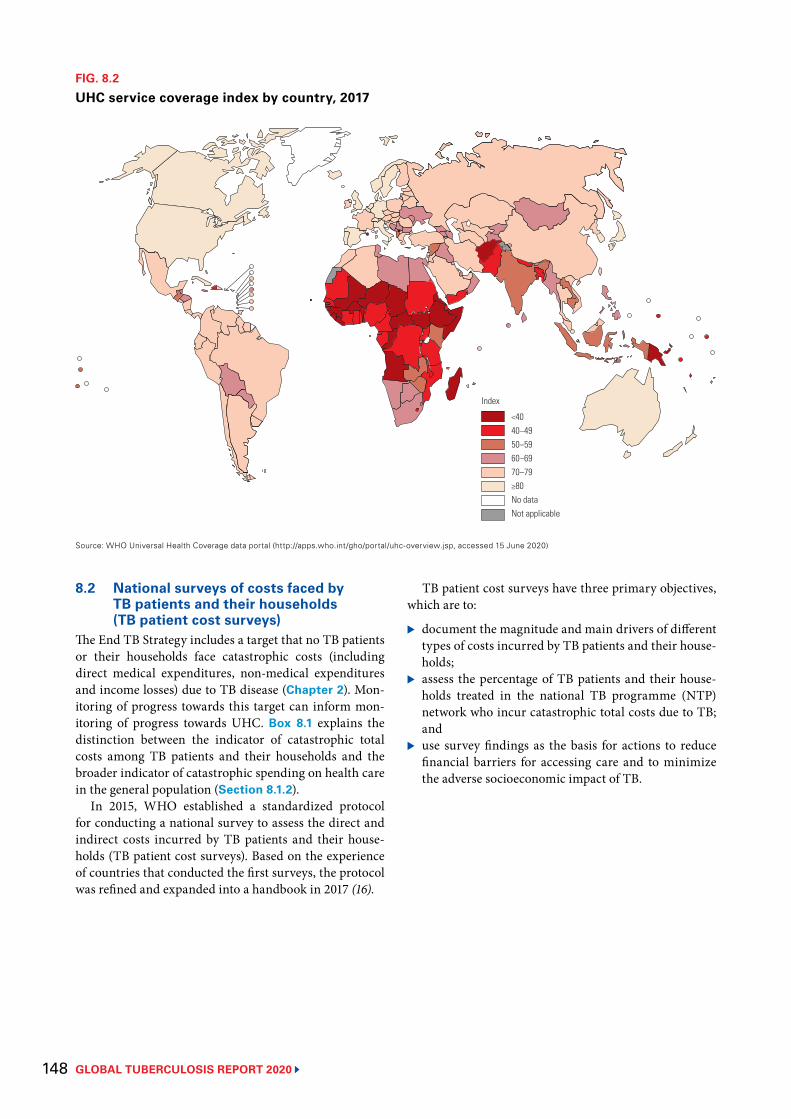
GLOBAL TUBERCULOSIS REPORT 2020 148
FIG. 8.2
UHC service coverage index by country, 2017
Source: WHO Universal Health Coverage data portal (http://apps.who.int/gho/portal/uhc-overview.jsp, accessed 15 June 2020)
<4040–4950–5960–6970–79≥80No dataNot applicable
Index
8.2 National surveys of costs faced by TB patients and their households (TB patient cost surveys)
The End TB Strategy includes a target that no TB patients or their households face catastrophic costs (including direct medical expenditures, non-medical expenditures and income losses) due to TB disease (Chapter 2). Mon-itoring of progress towards this target can inform mon-itoring of progress towards UHC. Box 8.1 explains the distinction between the indicator of catastrophic total costs among TB patients and their households and the broader indicator of catastrophic spending on health care in the general population (Section 8.1.2).
In 2015, WHO established a standardized protocol for conducting a national survey to assess the direct and indirect costs incurred by TB patients and their house-holds (TB patient cost surveys). Based on the experience of countries that conducted the first surveys, the protocol was refined and expanded into a handbook in 2017 (16).
TB patient cost surveys have three primary objectives, which are to:
▶ document the magnitude and main drivers of different types of costs incurred by TB patients and their house-holds;
▶ assess the percentage of TB patients and their house-holds treated in the national TB programme (NTP) network who incur catastrophic total costs due to TB; and
▶ use survey findings as the basis for actions to reduce financial barriers for accessing care and to minimize the adverse socioeconomic impact of TB.
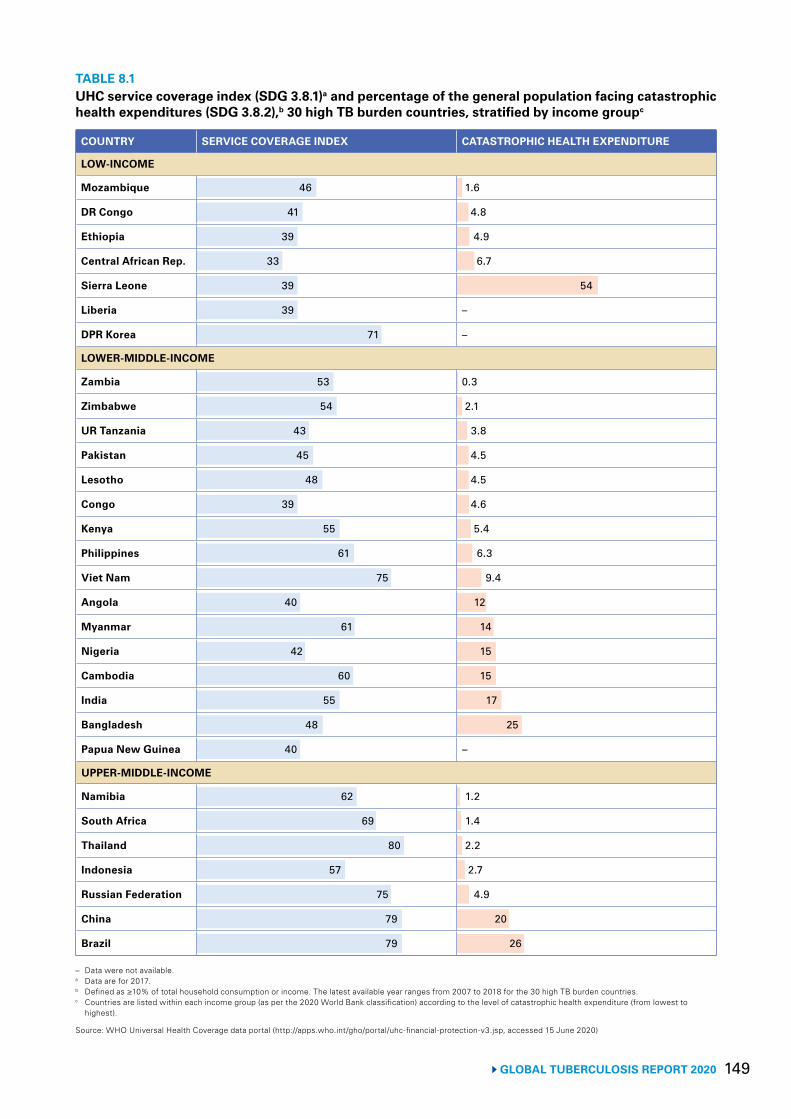
149 GLOBAL TUBERCULOSIS REPORT 2020
TABLE 8.1UHC service coverage index (SDG 3.8.1)a and percentage of the general population facing catastrophic health expenditures (SDG 3.8.2),b 30 high TB burden countries, stratified by income groupc
COUNTRY SERVICE COVERAGE INDEX CATASTROPHIC HEALTH EXPENDITURE
LOW-INCOME
Mozambique 46 1.6
DR Congo 41 4.8
Ethiopia 39 4.9
Central African Rep. 33 6.7
Sierra Leone 39 54
Liberia 39 –
DPR Korea 71 –
LOWER-MIDDLE-INCOME
Zambia 53 0.3
Zimbabwe 54 2.1
UR Tanzania 43 3.8
Pakistan 45 4.5
Lesotho 48 4.5
Congo 39 4.6
Kenya 55 5.4
Philippines 61 6.3
Viet Nam 75 9.4
Angola 40 12
Myanmar 61 14
Nigeria 42 15
Cambodia 60 15
India 55 17
Bangladesh 48 25
Papua New Guinea 40 –
UPPER-MIDDLE-INCOME
Namibia 62 1.2
South Africa 69 1.4
Thailand 80 2.2
Indonesia 57 2.7
Russian Federation 75 4.9
China 79 20
Brazil 79 26
– Data were not available.a Data are for 2017.b Defined as ≥10% of total household consumption or income. The latest available year ranges from 2007 to 2018 for the 30 high TB burden countries.c Countries are listed within each income group (as per the 2020 World Bank classification) according to the level of catastrophic health expenditure (from lowest to
highest).
Source: WHO Universal Health Coverage data portal (http://apps.who.int/gho/portal/uhc-financial-protection-v3.jsp, accessed 15 June 2020)
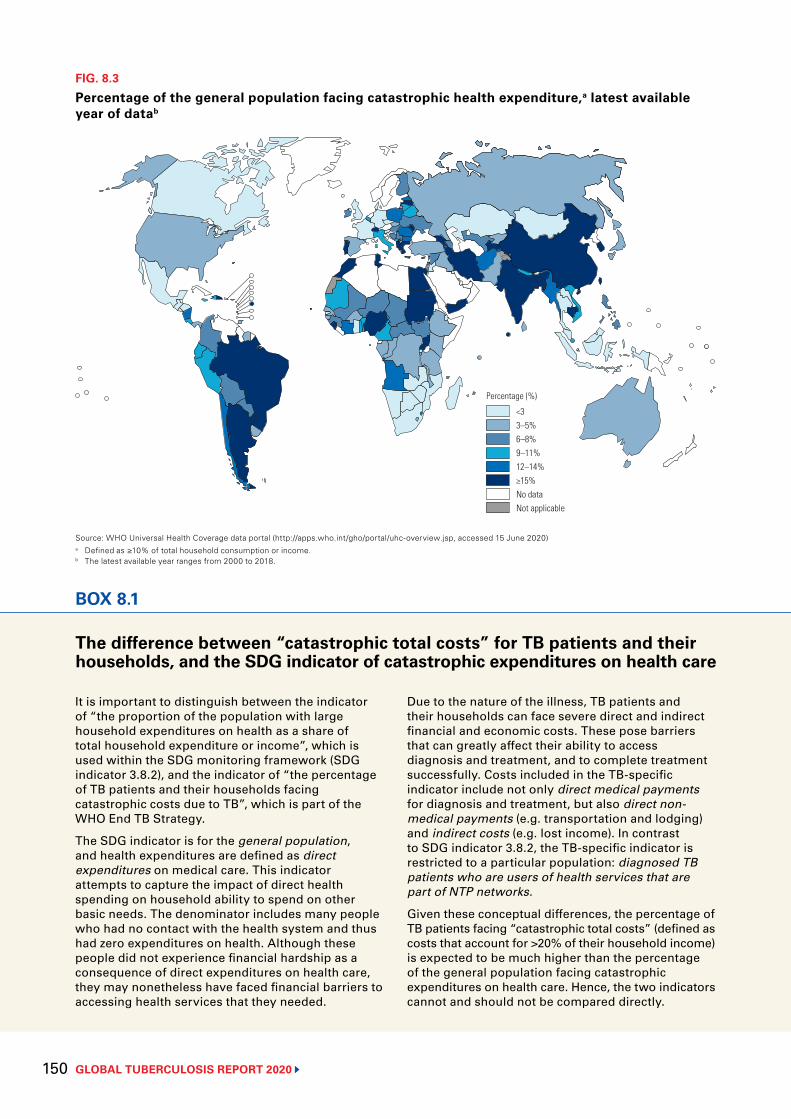
GLOBAL TUBERCULOSIS REPORT 2020 150
FIG. 8.3
Percentage of the general population facing catastrophic health expenditure,a latest available year of datab
Source: WHO Universal Health Coverage data portal (http://apps.who.int/gho/portal/uhc-overview.jsp, accessed 15 June 2020) a Defined as ≥10% of total household consumption or income.b The latest available year ranges from 2000 to 2018.
<33–5%6–8%9–11%12–14%≥15%No dataNot applicable
Percentage (%)
BOX 8.1
The difference between “catastrophic total costs” for TB patients and their households, and the SDG indicator of catastrophic expenditures on health care
It is important to distinguish between the indicator of “the proportion of the population with large household expenditures on health as a share of total household expenditure or income”, which is used within the SDG monitoring framework (SDG indicator 3.8.2), and the indicator of “the percentage of TB patients and their households facing catastrophic costs due to TB”, which is part of the WHO End TB Strategy.
The SDG indicator is for the general population, and health expenditures are defined as direct expenditures on medical care. This indicator attempts to capture the impact of direct health spending on household ability to spend on other basic needs. The denominator includes many people who had no contact with the health system and thus had zero expenditures on health. Although these people did not experience financial hardship as a consequence of direct expenditures on health care, they may nonetheless have faced financial barriers to accessing health services that they needed.
Due to the nature of the illness, TB patients and their households can face severe direct and indirect financial and economic costs. These pose barriers that can greatly affect their ability to access diagnosis and treatment, and to complete treatment successfully. Costs included in the TB-specific indicator include not only direct medical payments for diagnosis and treatment, but also direct non-medical payments (e.g. transportation and lodging) and indirect costs (e.g. lost income). In contrast to SDG indicator 3.8.2, the TB-specific indicator is restricted to a particular population: diagnosed TB patients who are users of health services that are part of NTP networks.
Given these conceptual differences, the percentage of TB patients facing “catastrophic total costs” (defined as costs that account for >20% of their household income) is expected to be much higher than the percentage of the general population facing catastrophic expenditures on health care. Hence, the two indicators cannot and should not be compared directly.
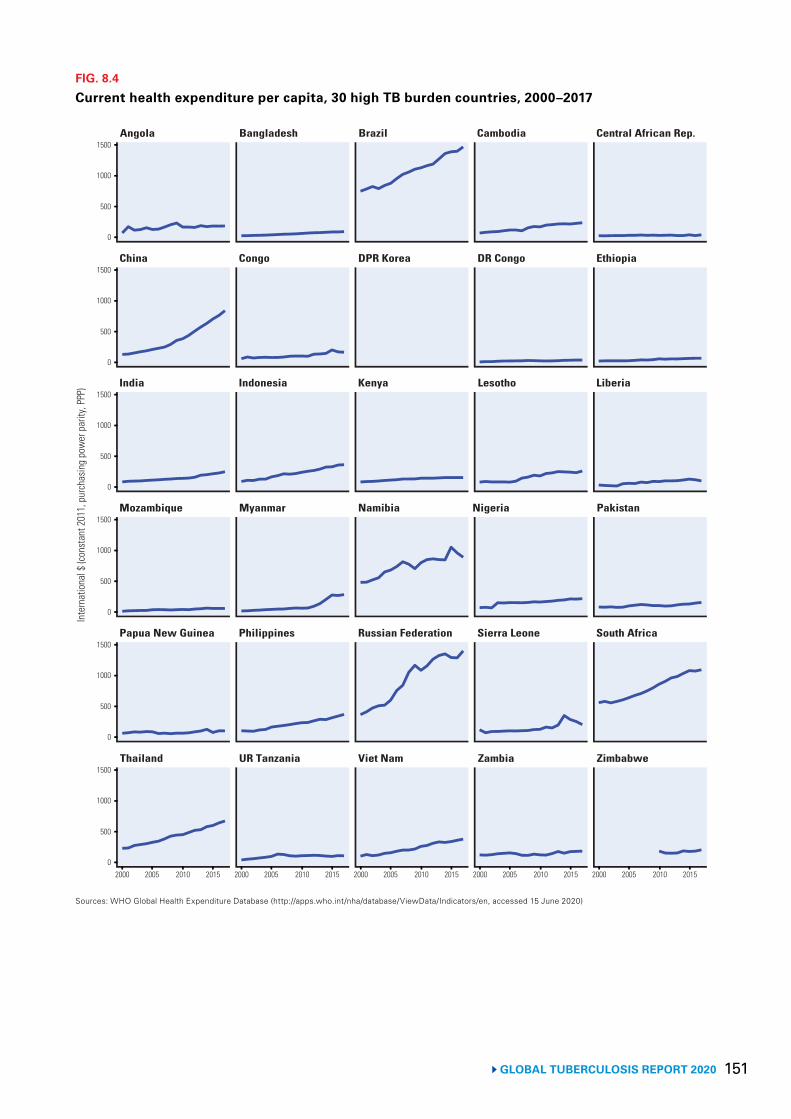
151 GLOBAL TUBERCULOSIS REPORT 2020
FIG. 8.4
Current health expenditure per capita, 30 high TB burden countries, 2000–2017
Sources: WHO Global Health Expenditure Database (http://apps.who.int/nha/database/ViewData/Indicators/en, accessed 15 June 2020)
Angola Bangladesh Brazil Cambodia Central African Rep.
China Congo DPR Korea DR Congo Ethiopia
India Indonesia Kenya Lesotho Liberia
Mozambique Myanmar Namibia Nigeria Pakistan
Papua New Guinea Philippines Russian Federation Sierra Leone South Africa
Thailand UR Tanzania Viet Nam Zambia Zimbabwe
2000 2005 2010 2015
Inte
rnat
iona
l $ (c
onst
ant 2
011,
pur
chas
ing
pow
er p
arity
, PPP
)
1000
500
0
1500
1000
500
0
1500
1000
500
0
1500
1000
500
0
1500
1000
500
0
1500
1000
500
0
1500
2000 2005 2010 2015 2000 2005 2010 2015 2000 2005 2010 2015 2000 2005 2010 2015
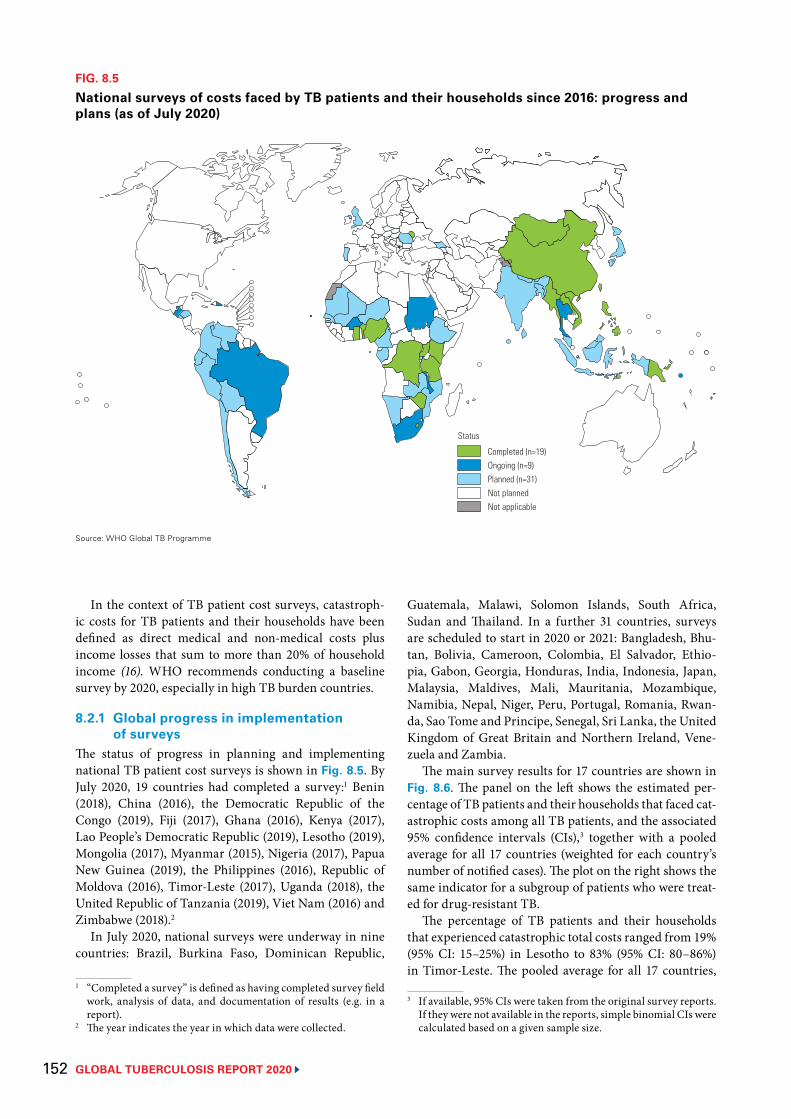
GLOBAL TUBERCULOSIS REPORT 2020 152
In the context of TB patient cost surveys, catastroph-ic costs for TB patients and their households have been defined as direct medical and non-medical costs plus income losses that sum to more than 20% of household income (16). WHO recommends conducting a baseline survey by 2020, especially in high TB burden countries.
8.2.1 Global progress in implementation of surveys
The status of progress in planning and implementing national TB patient cost surveys is shown in Fig. 8.5. By July 2020, 19 countries had completed a survey:1 Benin (2018), China (2016), the Democratic Republic of the Congo (2019), Fiji (2017), Ghana (2016), Kenya (2017), Lao People’s Democratic Republic (2019), Lesotho (2019), Mongolia (2017), Myanmar (2015), Nigeria (2017), Papua New Guinea (2019), the Philippines (2016), Republic of Moldova (2016), Timor-Leste (2017), Uganda (2018), the United Republic of Tanzania (2019), Viet Nam (2016) and Zimbabwe (2018).2
In July 2020, national surveys were underway in nine countries: Brazil, Burkina Faso, Dominican Republic,
1 “Completed a survey” is defined as having completed survey field work, analysis of data, and documentation of results (e.g. in a report).
2 The year indicates the year in which data were collected.
FIG. 8.5
National surveys of costs faced by TB patients and their households since 2016: progress and plans (as of July 2020)
Source: WHO Global TB Programme
Completed (n=19)Ongoing (n=9)Planned (n=31)Not plannedNot applicable
Status
Guatemala, Malawi, Solomon Islands, South Africa, Sudan and Thailand. In a further 31 countries, surveys are scheduled to start in 2020 or 2021: Bangladesh, Bhu-tan, Bolivia, Cameroon, Colombia, El Salvador, Ethio-pia, Gabon, Georgia, Honduras, India, Indonesia, Japan, Malaysia, Maldives, Mali, Mauritania, Mozambique, Namibia, Nepal, Niger, Peru, Portugal, Romania, Rwan-da, Sao Tome and Principe, Senegal, Sri Lanka, the United Kingdom of Great Britain and Northern Ireland, Vene-zuela and Zambia.
The main survey results for 17 countries are shown in Fig. 8.6. The panel on the left shows the estimated per-centage of TB patients and their households that faced cat-astrophic costs among all TB patients, and the associated 95% confidence intervals (CIs),3 together with a pooled average for all 17 countries (weighted for each country’s number of notified cases). The plot on the right shows the same indicator for a subgroup of patients who were treat-ed for drug-resistant TB.
The percentage of TB patients and their households that experienced catastrophic total costs ranged from 19% (95% CI: 15–25%) in Lesotho to 83% (95% CI: 80–86%) in Timor-Leste. The pooled average for all 17 countries,
3 If available, 95% CIs were taken from the original survey reports. If they were not available in the reports, simple binomial CIs were calculated based on a given sample size.
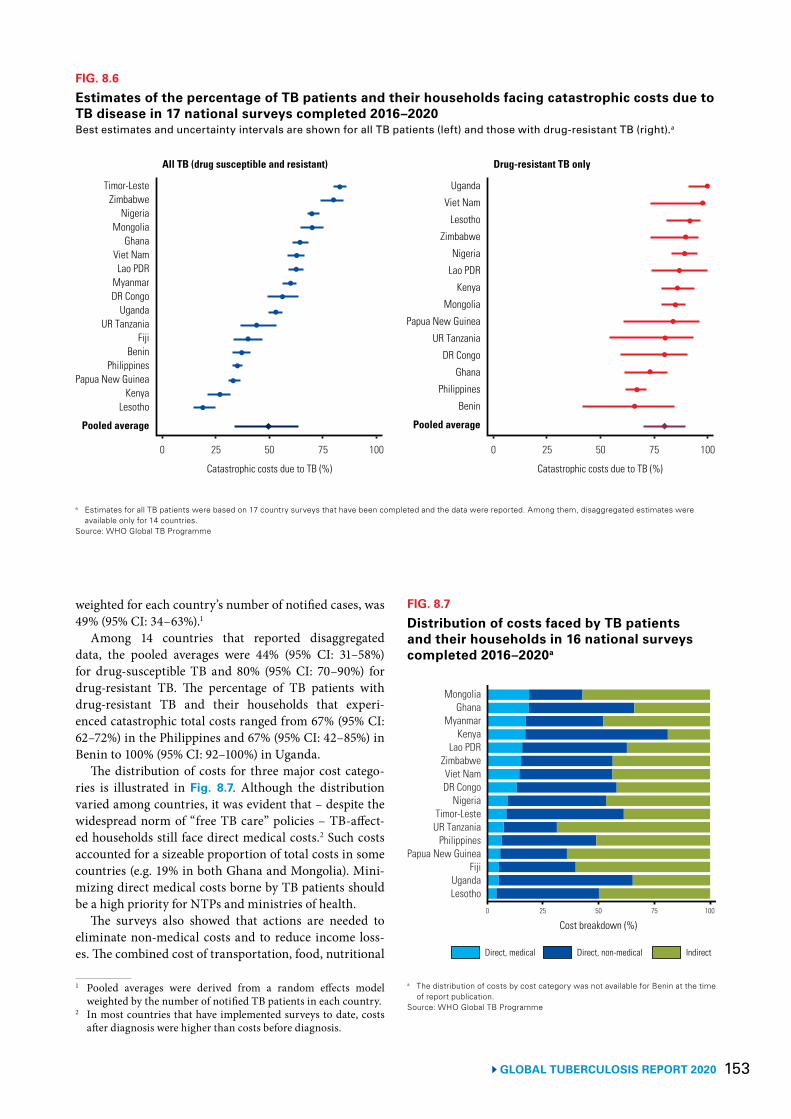
153 GLOBAL TUBERCULOSIS REPORT 2020
FIG. 8.6
Estimates of the percentage of TB patients and their households facing catastrophic costs due to TB disease in 17 national surveys completed 2016–2020Best estimates and uncertainty intervals are shown for all TB patients (left) and those with drug-resistant TB (right).a
a Estimates for all TB patients were based on 17 country surveys that have been completed and the data were reported. Among them, disaggregated estimates were available only for 14 countries.
Source: WHO Global TB Programme
Timor-LesteZimbabwe
NigeriaMongolia
GhanaViet NamLao PDR
MyanmarDR Congo
UgandaUR Tanzania
FijiBenin
PhilippinesPapua New Guinea
KenyaLesotho
Pooled average
Catastrophic costs due to TB (%) Catastrophic costs due to TB (%)
0 25 50 75 100
Uganda
Viet Nam
Lesotho
Zimbabwe
Nigeria
Lao PDR
Kenya
Mongolia
Papua New Guinea
UR Tanzania
DR Congo
Ghana
Philippines
Benin
Pooled average
0 25 50 75 100
All TB (drug susceptible and resistant) Drug-resistant TB only
weighted for each country’s number of notified cases, was 49% (95% CI: 34–63%).1
Among 14 countries that reported disaggregated data, the pooled averages were 44% (95% CI: 31–58%) for drug-susceptible TB and 80% (95% CI: 70–90%) for drug-resistant TB. The percentage of TB patients with drug-resistant TB and their households that experi-enced catastrophic total costs ranged from 67% (95% CI: 62–72%) in the Philippines and 67% (95% CI: 42–85%) in Benin to 100% (95% CI: 92–100%) in Uganda.
The distribution of costs for three major cost catego-ries is illustrated in Fig. 8.7. Although the distribution varied among countries, it was evident that – despite the widespread norm of “free TB care” policies – TB-affect-ed households still face direct medical costs.2 Such costs accounted for a sizeable proportion of total costs in some countries (e.g. 19% in both Ghana and Mongolia). Mini-mizing direct medical costs borne by TB patients should be a high priority for NTPs and ministries of health.
The surveys also showed that actions are needed to eliminate non-medical costs and to reduce income loss-es. The combined cost of transportation, food, nutritional
1 Pooled averages were derived from a random effects model weighted by the number of notified TB patients in each country.
2 In most countries that have implemented surveys to date, costs after diagnosis were higher than costs before diagnosis.
FIG. 8.7
Distribution of costs faced by TB patients and their households in 16 national surveys completed 2016–2020a
MongoliaGhana
MyanmarKenya
Lao PDRZimbabweViet NamDR Congo
NigeriaTimor-LesteUR Tanzania
PhilippinesPapua New Guinea
FijiUgandaLesotho
0 25 50 75 100
Cost breakdown (%)
Direct, medical Direct, non-medical Indirect
a The distribution of costs by cost category was not available for Benin at the time of report publication.
Source: WHO Global TB Programme
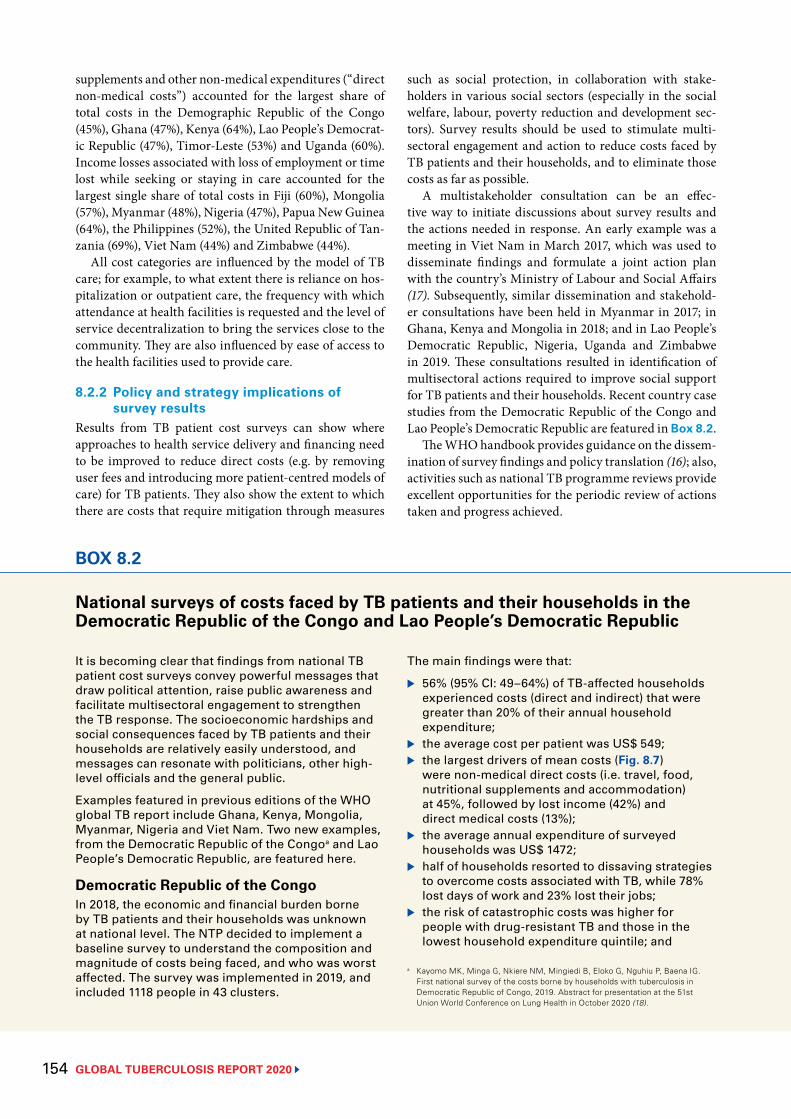
GLOBAL TUBERCULOSIS REPORT 2020 154
supplements and other non-medical expenditures (“direct non-medical costs”) accounted for the largest share of total costs in the Demographic Republic of the Congo (45%), Ghana (47%), Kenya (64%), Lao People’s Democrat-ic Republic (47%), Timor-Leste (53%) and Uganda (60%). Income losses associated with loss of employment or time lost while seeking or staying in care accounted for the largest single share of total costs in Fiji (60%), Mongolia (57%), Myanmar (48%), Nigeria (47%), Papua New Guinea (64%), the Philippines (52%), the United Republic of Tan-zania (69%), Viet Nam (44%) and Zimbabwe (44%).
All cost categories are influenced by the model of TB care; for example, to what extent there is reliance on hos-pitalization or outpatient care, the frequency with which attendance at health facilities is requested and the level of service decentralization to bring the services close to the community. They are also influenced by ease of access to the health facilities used to provide care.
8.2.2 Policy and strategy implications of survey results
Results from TB patient cost surveys can show where approaches to health service delivery and financing need to be improved to reduce direct costs (e.g. by removing user fees and introducing more patient-centred models of care) for TB patients. They also show the extent to which there are costs that require mitigation through measures
such as social protection, in collaboration with stake-holders in various social sectors (especially in the social welfare, labour, poverty reduction and development sec-tors). Survey results should be used to stimulate multi-sectoral engagement and action to reduce costs faced by TB patients and their households, and to eliminate those costs as far as possible.
A multistakeholder consultation can be an effec-tive way to initiate discussions about survey results and the actions needed in response. An early example was a meeting in Viet Nam in March 2017, which was used to disseminate findings and formulate a joint action plan with the country’s Ministry of Labour and Social Affairs (17). Subsequently, similar dissemination and stakehold-er consultations have been held in Myanmar in 2017; in Ghana, Kenya and Mongolia in 2018; and in Lao People’s Democratic Republic, Nigeria, Uganda and Zimbabwe in 2019. These consultations resulted in identification of multisectoral actions required to improve social support for TB patients and their households. Recent country case studies from the Democratic Republic of the Congo and Lao People’s Democratic Republic are featured in Box 8.2.
The WHO handbook provides guidance on the dissem-ination of survey findings and policy translation (16); also, activities such as national TB programme reviews provide excellent opportunities for the periodic review of actions taken and progress achieved.
BOX 8.2
National surveys of costs faced by TB patients and their households in the Democratic Republic of the Congo and Lao People’s Democratic Republic
It is becoming clear that findings from national TB patient cost surveys convey powerful messages that draw political attention, raise public awareness and facilitate multisectoral engagement to strengthen the TB response. The socioeconomic hardships and social consequences faced by TB patients and their households are relatively easily understood, and messages can resonate with politicians, other high-level officials and the general public.
Examples featured in previous editions of the WHO global TB report include Ghana, Kenya, Mongolia, Myanmar, Nigeria and Viet Nam. Two new examples, from the Democratic Republic of the Congoa and Lao People’s Democratic Republic, are featured here.
Democratic Republic of the CongoIn 2018, the economic and financial burden borne by TB patients and their households was unknown at national level. The NTP decided to implement a baseline survey to understand the composition and magnitude of costs being faced, and who was worst affected. The survey was implemented in 2019, and included 1118 people in 43 clusters.
The main findings were that:
▶ 56% (95% CI: 49–64%) of TB-affected households experienced costs (direct and indirect) that were greater than 20% of their annual household expenditure;
▶ the average cost per patient was US$ 549; ▶ the largest drivers of mean costs (Fig. 8.7)
were non-medical direct costs (i.e. travel, food, nutritional supplements and accommodation) at 45%, followed by lost income (42%) and direct medical costs (13%);
▶ the average annual expenditure of surveyed households was US$ 1472;
▶ half of households resorted to dissaving strategies to overcome costs associated with TB, while 78% lost days of work and 23% lost their jobs;
▶ the risk of catastrophic costs was higher for people with drug-resistant TB and those in the lowest household expenditure quintile; and
a Kayomo MK, Minga G, Nkiere NM, Mingiedi B, Eloko G, Nguhiu P, Baena IG. First national survey of the costs borne by households with tuberculosis in Democratic Republic of Congo, 2019. Abstract for presentation at the 51st Union World Conference on Lung Health in October 2020 (18).
BOX 8.2
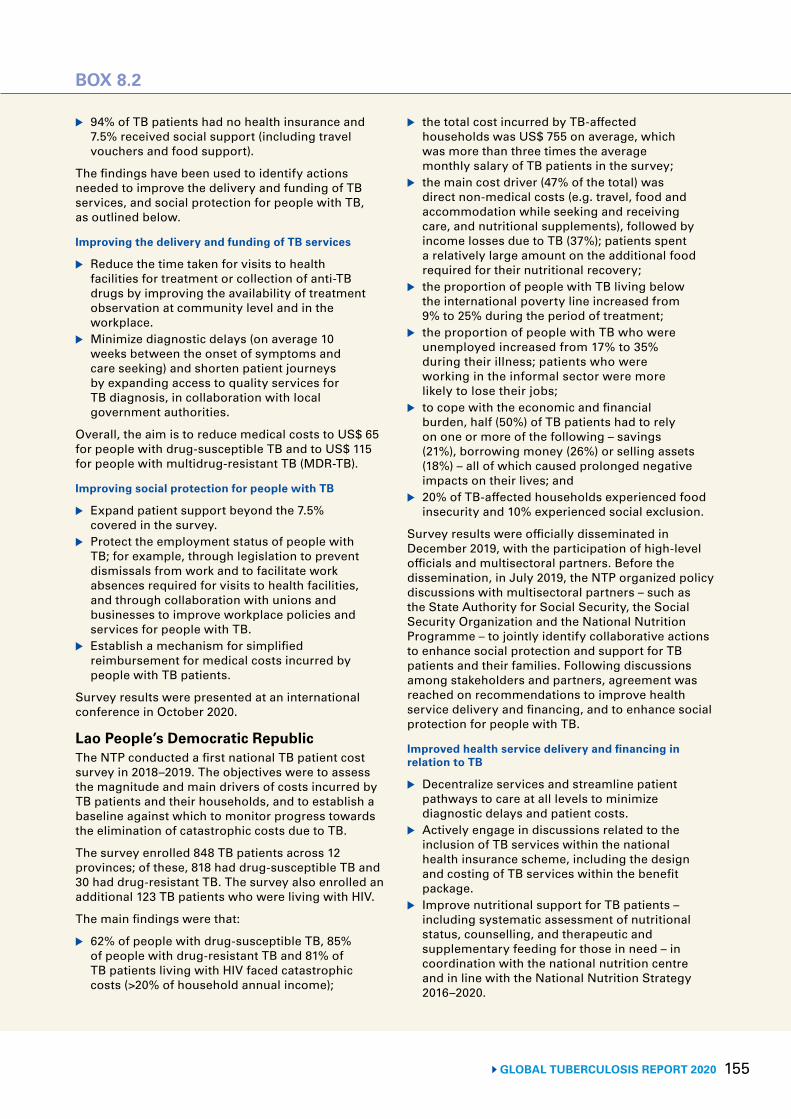
155 GLOBAL TUBERCULOSIS REPORT 2020
BOX 8.2
BOX 8.2
▶ 94% of TB patients had no health insurance and 7.5% received social support (including travel vouchers and food support).
The findings have been used to identify actions needed to improve the delivery and funding of TB services, and social protection for people with TB, as outlined below.
Improving the delivery and funding of TB services
▶ Reduce the time taken for visits to health facilities for treatment or collection of anti-TB drugs by improving the availability of treatment observation at community level and in the workplace.
▶ Minimize diagnostic delays (on average 10 weeks between the onset of symptoms and care seeking) and shorten patient journeys by expanding access to quality services for TB diagnosis, in collaboration with local government authorities.
Overall, the aim is to reduce medical costs to US$ 65 for people with drug-susceptible TB and to US$ 115 for people with multidrug-resistant TB (MDR-TB).
Improving social protection for people with TB
▶ Expand patient support beyond the 7.5% covered in the survey.
▶ Protect the employment status of people with TB; for example, through legislation to prevent dismissals from work and to facilitate work absences required for visits to health facilities, and through collaboration with unions and businesses to improve workplace policies and services for people with TB.
▶ Establish a mechanism for simplified reimbursement for medical costs incurred by people with TB patients.
Survey results were presented at an international conference in October 2020.
Lao People’s Democratic RepublicThe NTP conducted a first national TB patient cost survey in 2018–2019. The objectives were to assess the magnitude and main drivers of costs incurred by TB patients and their households, and to establish a baseline against which to monitor progress towards the elimination of catastrophic costs due to TB.
The survey enrolled 848 TB patients across 12 provinces; of these, 818 had drug-susceptible TB and 30 had drug-resistant TB. The survey also enrolled an additional 123 TB patients who were living with HIV.
The main findings were that:
▶ 62% of people with drug-susceptible TB, 85% of people with drug-resistant TB and 81% of TB patients living with HIV faced catastrophic costs (>20% of household annual income);
▶ the total cost incurred by TB-affected households was US$ 755 on average, which was more than three times the average monthly salary of TB patients in the survey;
▶ the main cost driver (47% of the total) was direct non-medical costs (e.g. travel, food and accommodation while seeking and receiving care, and nutritional supplements), followed by income losses due to TB (37%); patients spent a relatively large amount on the additional food required for their nutritional recovery;
▶ the proportion of people with TB living below the international poverty line increased from 9% to 25% during the period of treatment;
▶ the proportion of people with TB who were unemployed increased from 17% to 35% during their illness; patients who were working in the informal sector were more likely to lose their jobs;
▶ to cope with the economic and financial burden, half (50%) of TB patients had to rely on one or more of the following – savings (21%), borrowing money (26%) or selling assets (18%) – all of which caused prolonged negative impacts on their lives; and
▶ 20% of TB-affected households experienced food insecurity and 10% experienced social exclusion.
Survey results were officially disseminated in December 2019, with the participation of high-level officials and multisectoral partners. Before the dissemination, in July 2019, the NTP organized policy discussions with multisectoral partners – such as the State Authority for Social Security, the Social Security Organization and the National Nutrition Programme – to jointly identify collaborative actions to enhance social protection and support for TB patients and their families. Following discussions among stakeholders and partners, agreement was reached on recommendations to improve health service delivery and financing, and to enhance social protection for people with TB.
Improved health service delivery and financing in relation to TB
▶ Decentralize services and streamline patient pathways to care at all levels to minimize diagnostic delays and patient costs.
▶ Actively engage in discussions related to the inclusion of TB services within the national health insurance scheme, including the design and costing of TB services within the benefit package.
▶ Improve nutritional support for TB patients – including systematic assessment of nutritional status, counselling, and therapeutic and supplementary feeding for those in need – in coordination with the national nutrition centre and in line with the National Nutrition Strategy 2016–2020.
GLOBAL TUBERCULOSIS REPORT 2020 156
8.3 Broader determinants of the TB epidemic
In 2017, WHO developed a TB-SDG monitoring frame-work as part of the preparations for a global ministeri-al conference on TB (19). The framework was based on previously published work that identified clear linkages between TB incidence and various indicators that are part of the SDG framework (3-6), and new analysis of the rela-tionship between these indicators and TB incidence. The TB-SDG framework comprises 14 indicators under sev-en SDGs (Table 8.2). The relationship between two of the indicators (GDP per capita and the prevalence of under-nutrition) and TB incidence is illustrated in Fig. 8.8.
The framework includes only indicators for which a relationship with TB incidence could be established. It excludes:
▶ subindicators of indicators that have already been included (e.g. subindicators related to UHC, under SDG 3); and
▶ indicators that are only remotely associated with TB risks, and that operate mainly through other SDGs (e.g. education under SDG 4, gender equality under SDG 5 and resilient infrastructure under SDG 9).
In some cases, the official SDG indicator was not con-sidered the best metric, and a better (but closely related) alternative was identified and justified (five indicators under SDG 3, one under SDG 8 and one under SDG 10).
The most recent data on the prevalence of four health-re-lated risk factors (diabetes, HIV infection, smoking and alcohol use disorders) under SDG 3 that are associated with TB incidence (Table 8.2a) as well as undernutrition (Table 8.2b) are shown for the 30 high TB burden coun-tries in Table 8.3.1 For all of the indicators shown, a lower level is more desirable.
1 The three indicators relating to coverage of health services and health expenditure per capita are not included here because they are discussed in Section 8.1.
BOX 8.2
Enhanced social protection for people with TB
▶ Establish a streamlined claim mechanism for people with TB to access sickness and unemployment benefits, in collaboration with the National Social Security Fund.
▶ Explore collaboration with the labour and corporate sectors to improve workplace policies and services for people with TB, including mechanisms for protecting the employment status of TB patients.
▶ Strengthen advocacy and action by parliamentarians to end TB and poverty in Lao People’s Democratic Republic.
FIG. 8.8
The relationship between GDP per capita and the prevalence of undernutrition, and TB incidence per 100 000 population
1 10 100
10
1
100
Incid
ence
per
100
000
pop
ulat
ion
in 2
019
GDP per capita (US$ thousands in 2018)
3 10 30
10
1
100
Incid
ence
per
100
000
pop
ulat
ion
in 2
019
Prevalence of undernutrition (% of population in 2017)
The countries with generalized HIV epidemics (a prev-alence of >1% in the general population) include 15 of the 16 high TB burden countries in the WHO African Region (the exception is the Democratic Republic of the Congo), with especially high levels in southern Africa (24% in Lesotho, 13% in Mozambique, 12% in Namibia, 20% in South Africa, 11% in Zambia and 13% in Zimbabwe).
The prevalence of smoking in adult men (aged ≥15 years) is above 40% in six of the 30 high TB burden coun-tries and is exceptionally high (60%) in Indonesia and Lesotho; the only countries where it is below 20% are Brazil, Ethiopia, Liberia and Nigeria. Smoking is much less common among adult women, with levels below 5% in most high TB burden countries and exceeding 10% only in the Russian Federation. These striking differences between men and women contribute to the higher burden of TB disease among men (Chapter 4).
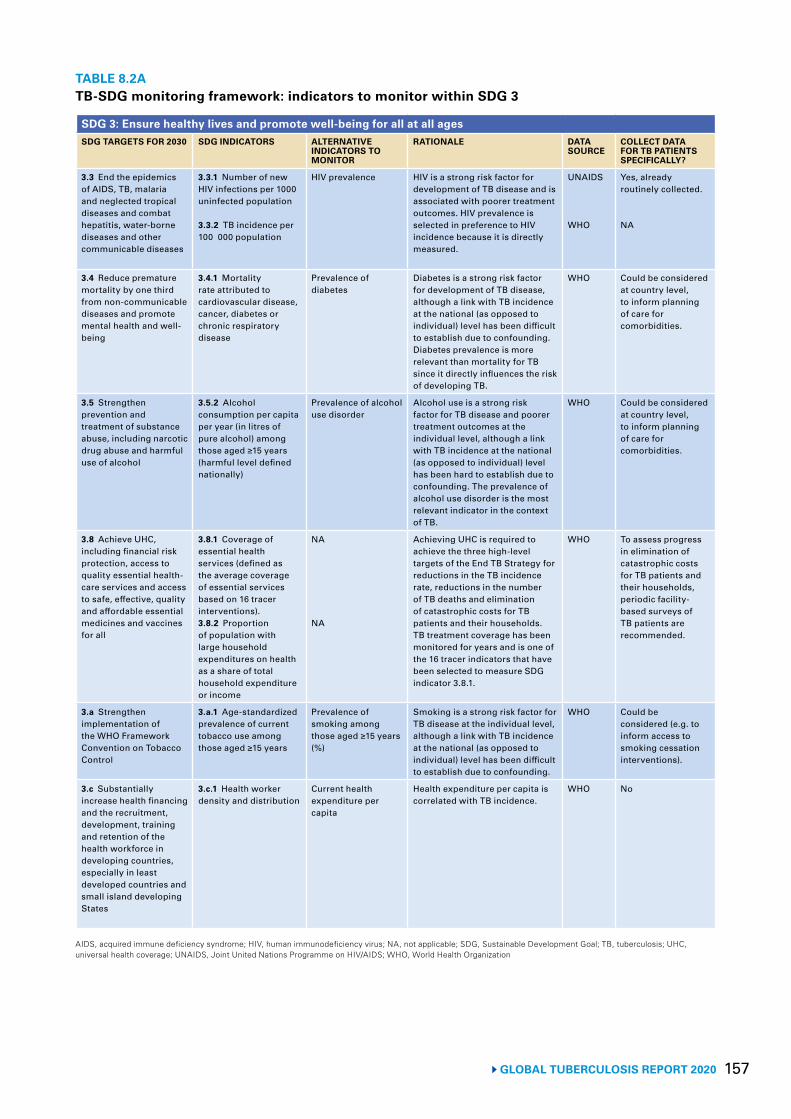
157 GLOBAL TUBERCULOSIS REPORT 2020
TABLE 8.2ATB-SDG monitoring framework: indicators to monitor within SDG 3
SDG 3: Ensure healthy lives and promote well-being for all at all agesSDG TARGETS FOR 2030 SDG INDICATORS ALTERNATIVE
INDICATORS TO MONITOR
RATIONALE DATA SOURCE
COLLECT DATA FOR TB PATIENTS SPECIFICALLY?
3.3 End the epidemics of AIDS, TB, malaria and neglected tropical diseases and combat hepatitis, water-borne diseases and other communicable diseases
3.3.1 Number of new HIV infections per 1000 uninfected population
3.3.2 TB incidence per 100 000 population
HIV prevalence HIV is a strong risk factor for development of TB disease and is associated with poorer treatment outcomes. HIV prevalence is selected in preference to HIV incidence because it is directly measured.
UNAIDS
WHO
Yes, already routinely collected.
NA
3.4 Reduce premature mortality by one third from non-communicable diseases and promote mental health and well-being
3.4.1 Mortality rate attributed to cardiovascular disease, cancer, diabetes or chronic respiratory disease
Prevalence of diabetes
Diabetes is a strong risk factor for development of TB disease, although a link with TB incidence at the national (as opposed to individual) level has been difficult to establish due to confounding. Diabetes prevalence is more relevant than mortality for TB since it directly influences the risk of developing TB.
WHO Could be considered at country level, to inform planning of care for comorbidities.
3.5 Strengthen prevention and treatment of substance abuse, including narcotic drug abuse and harmful use of alcohol
3.5.2 Alcohol consumption per capita per year (in litres of pure alcohol) among those aged ≥15 years (harmful level defined nationally)
Prevalence of alcohol use disorder
Alcohol use is a strong risk factor for TB disease and poorer treatment outcomes at the individual level, although a link with TB incidence at the national (as opposed to individual) level has been hard to establish due to confounding. The prevalence of alcohol use disorder is the most relevant indicator in the context of TB.
WHO Could be considered at country level, to inform planning of care for comorbidities.
3.8 Achieve UHC, including financial risk protection, access to quality essential health-care services and access to safe, effective, quality and affordable essential medicines and vaccines for all
3.8.1 Coverage of essential health services (defined as the average coverage of essential services based on 16 tracer interventions).3.8.2 Proportion of population with large household expenditures on health as a share of total household expenditure or income
NA
NA
Achieving UHC is required to achieve the three high-level targets of the End TB Strategy for reductions in the TB incidence rate, reductions in the number of TB deaths and elimination of catastrophic costs for TB patients and their households. TB treatment coverage has been monitored for years and is one of the 16 tracer indicators that have been selected to measure SDG indicator 3.8.1.
WHO To assess progress in elimination of catastrophic costs for TB patients and their households, periodic facility-based surveys of TB patients are recommended.
3.a Strengthen implementation of the WHO Framework Convention on Tobacco Control
3.a.1 Age-standardized prevalence of current tobacco use among those aged ≥15 years
Prevalence of smoking among those aged ≥15 years (%)
Smoking is a strong risk factor for TB disease at the individual level, although a link with TB incidence at the national (as opposed to individual) level has been difficult to establish due to confounding.
WHO Could be considered (e.g. to inform access to smoking cessation interventions).
3.c Substantially increase health financing and the recruitment, development, training and retention of the health workforce in developing countries, especially in least developed countries and small island developing States
3.c.1 Health worker density and distribution
Current health expenditure per capita
Health expenditure per capita is correlated with TB incidence.
WHO No
AIDS, acquired immune deficiency syndrome; HIV, human immunodeficiency virus; NA, not applicable; SDG, Sustainable Development Goal; TB, tuberculosis; UHC, universal health coverage; UNAIDS, Joint United Nations Programme on HIV/AIDS; WHO, World Health Organization
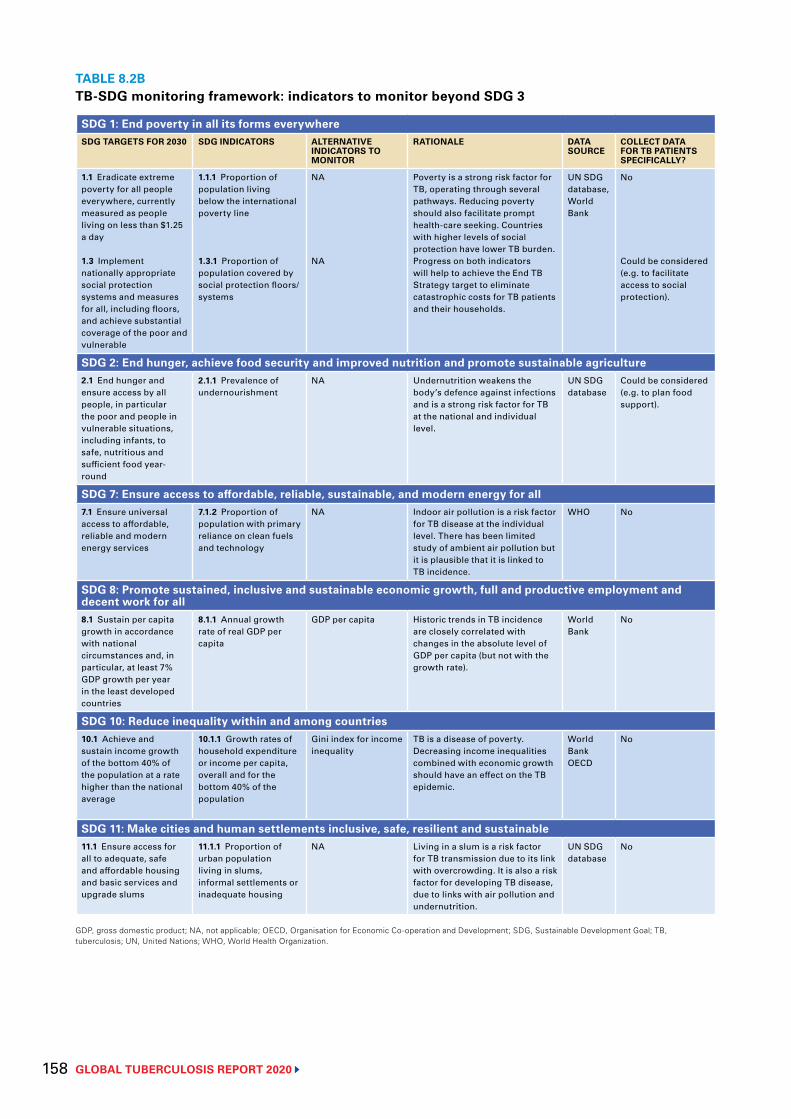
GLOBAL TUBERCULOSIS REPORT 2020 158
TABLE 8.2BTB-SDG monitoring framework: indicators to monitor beyond SDG 3
SDG 1: End poverty in all its forms everywhereSDG TARGETS FOR 2030 SDG INDICATORS ALTERNATIVE
INDICATORS TO MONITOR
RATIONALE DATA SOURCE
COLLECT DATA FOR TB PATIENTS SPECIFICALLY?
1.1 Eradicate extreme poverty for all people everywhere, currently measured as people living on less than $1.25 a day
1.3 Implement nationally appropriate social protection systems and measures for all, including floors, and achieve substantial coverage of the poor and vulnerable
1.1.1 Proportion of population living below the international poverty line
1.3.1 Proportion of population covered by social protection floors/systems
NA
NA
Poverty is a strong risk factor for TB, operating through several pathways. Reducing poverty should also facilitate prompt health-care seeking. Countries with higher levels of social protection have lower TB burden. Progress on both indicators will help to achieve the End TB Strategy target to eliminate catastrophic costs for TB patients and their households.
UN SDG database, World Bank
No
Could be considered (e.g. to facilitate access to social protection).
SDG 2: End hunger, achieve food security and improved nutrition and promote sustainable agriculture2.1 End hunger and ensure access by all people, in particular the poor and people in vulnerable situations, including infants, to safe, nutritious and sufficient food year-round
2.1.1 Prevalence of undernourishment
NA Undernutrition weakens the body’s defence against infections and is a strong risk factor for TB at the national and individual level.
UN SDG database
Could be considered (e.g. to plan food support).
SDG 7: Ensure access to affordable, reliable, sustainable, and modern energy for all7.1 Ensure universal access to affordable, reliable and modern energy services
7.1.2 Proportion of population with primary reliance on clean fuels and technology
NA Indoor air pollution is a risk factor for TB disease at the individual level. There has been limited study of ambient air pollution but it is plausible that it is linked to TB incidence.
WHO No
SDG 8: Promote sustained, inclusive and sustainable economic growth, full and productive employment and decent work for all8.1 Sustain per capita growth in accordance with national circumstances and, in particular, at least 7% GDP growth per year in the least developed countries
8.1.1 Annual growth rate of real GDP per capita
GDP per capita Historic trends in TB incidence are closely correlated with changes in the absolute level of GDP per capita (but not with the growth rate).
World Bank
No
SDG 10: Reduce inequality within and among countries10.1 Achieve and sustain income growth of the bottom 40% of the population at a rate higher than the national average
10.1.1 Growth rates of household expenditure or income per capita, overall and for the bottom 40% of the population
Gini index for income inequality
TB is a disease of poverty. Decreasing income inequalities combined with economic growth should have an effect on the TB epidemic.
World Bank OECD
No
SDG 11: Make cities and human settlements inclusive, safe, resilient and sustainable11.1 Ensure access for all to adequate, safe and affordable housing and basic services and upgrade slums
11.1.1 Proportion of urban population living in slums, informal settlements or inadequate housing
NA Living in a slum is a risk factor for TB transmission due to its link with overcrowding. It is also a risk factor for developing TB disease, due to links with air pollution and undernutrition.
UN SDG database
No
GDP, gross domestic product; NA, not applicable; OECD, Organisation for Economic Co-operation and Development; SDG, Sustainable Development Goal; TB, tuberculosis; UN, United Nations; WHO, World Health Organization.
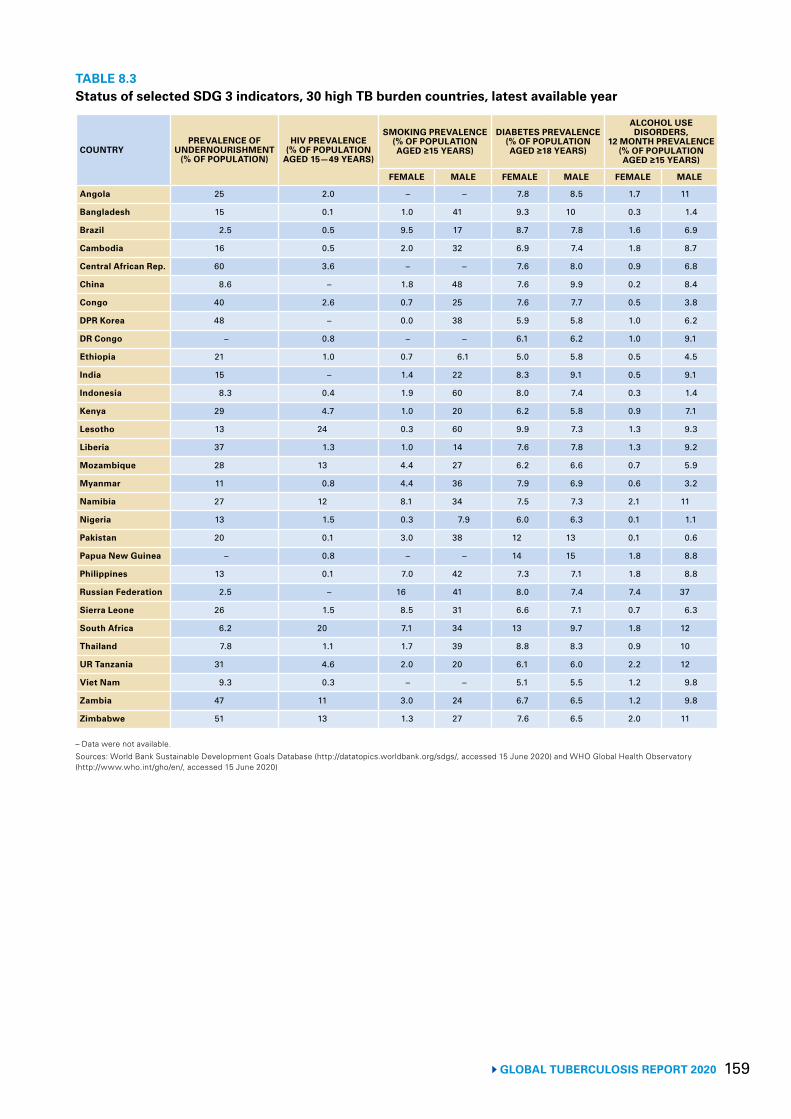
159 GLOBAL TUBERCULOSIS REPORT 2020
TABLE 8.3Status of selected SDG 3 indicators, 30 high TB burden countries, latest available year
COUNTRYPREVALENCE OF
UNDERNOURISHMENT (% OF POPULATION)
HIV PREVALENCE (% OF POPULATION
AGED 15—49 YEARS)
SMOKING PREVALENCE (% OF POPULATION AGED ≥15 YEARS)
DIABETES PREVALENCE (% OF POPULATION AGED ≥18 YEARS)
ALCOHOL USE DISORDERS,
12 MONTH PREVALENCE (% OF POPULATION AGED ≥15 YEARS)
FEMALE MALE FEMALE MALE FEMALE MALE
Angola 25 2.0 – – 7.8 8.5 1.7 11
Bangladesh 15 0.1 1.0 41 9.3 10 0.3 1.4
Brazil 2.5 0.5 9.5 17 8.7 7.8 1.6 6.9
Cambodia 16 0.5 2.0 32 6.9 7.4 1.8 8.7
Central African Rep. 60 3.6 – – 7.6 8.0 0.9 6.8
China 8.6 – 1.8 48 7.6 9.9 0.2 8.4
Congo 40 2.6 0.7 25 7.6 7.7 0.5 3.8
DPR Korea 48 – 0.0 38 5.9 5.8 1.0 6.2
DR Congo – 0.8 – – 6.1 6.2 1.0 9.1
Ethiopia 21 1.0 0.7 6.1 5.0 5.8 0.5 4.5
India 15 – 1.4 22 8.3 9.1 0.5 9.1
Indonesia 8.3 0.4 1.9 60 8.0 7.4 0.3 1.4
Kenya 29 4.7 1.0 20 6.2 5.8 0.9 7.1
Lesotho 13 24 0.3 60 9.9 7.3 1.3 9.3
Liberia 37 1.3 1.0 14 7.6 7.8 1.3 9.2
Mozambique 28 13 4.4 27 6.2 6.6 0.7 5.9
Myanmar 11 0.8 4.4 36 7.9 6.9 0.6 3.2
Namibia 27 12 8.1 34 7.5 7.3 2.1 11
Nigeria 13 1.5 0.3 7.9 6.0 6.3 0.1 1.1
Pakistan 20 0.1 3.0 38 12 13 0.1 0.6
Papua New Guinea – 0.8 – – 14 15 1.8 8.8
Philippines 13 0.1 7.0 42 7.3 7.1 1.8 8.8
Russian Federation 2.5 – 16 41 8.0 7.4 7.4 37
Sierra Leone 26 1.5 8.5 31 6.6 7.1 0.7 6.3
South Africa 6.2 20 7.1 34 13 9.7 1.8 12
Thailand 7.8 1.1 1.7 39 8.8 8.3 0.9 10
UR Tanzania 31 4.6 2.0 20 6.1 6.0 2.2 12
Viet Nam 9.3 0.3 – – 5.1 5.5 1.2 9.8
Zambia 47 11 3.0 24 6.7 6.5 1.2 9.8
Zimbabwe 51 13 1.3 27 7.6 6.5 2.0 11
– Data were not available.Sources: World Bank Sustainable Development Goals Database (http://datatopics.worldbank.org/sdgs/, accessed 15 June 2020) and WHO Global Health Observatory (http://www.who.int/gho/en/, accessed 15 June 2020)
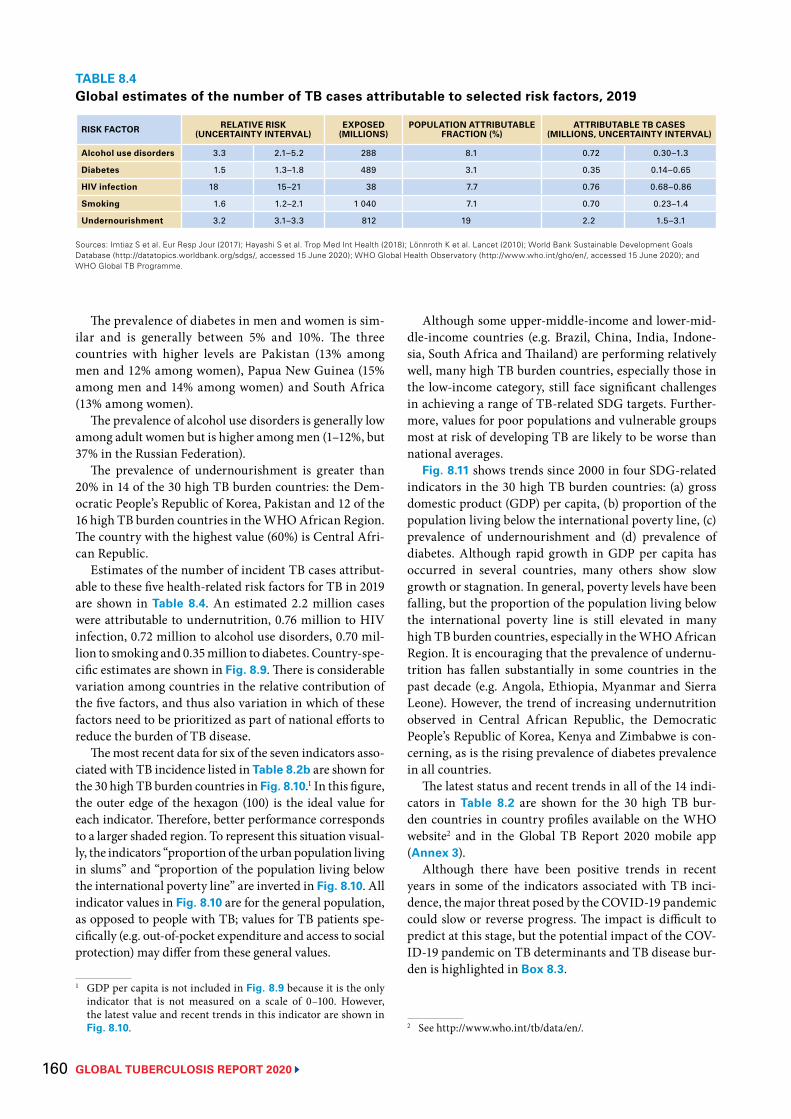
GLOBAL TUBERCULOSIS REPORT 2020 160
The prevalence of diabetes in men and women is sim-ilar and is generally between 5% and 10%. The three countries with higher levels are Pakistan (13% among men and 12% among women), Papua New Guinea (15% among men and 14% among women) and South Africa (13% among women).
The prevalence of alcohol use disorders is generally low among adult women but is higher among men (1–12%, but 37% in the Russian Federation).
The prevalence of undernourishment is greater than 20% in 14 of the 30 high TB burden countries: the Dem-ocratic People’s Republic of Korea, Pakistan and 12 of the 16 high TB burden countries in the WHO African Region. The country with the highest value (60%) is Central Afri-can Republic.
Estimates of the number of incident TB cases attribut-able to these five health-related risk factors for TB in 2019 are shown in Table 8.4. An estimated 2.2 million cases were attributable to undernutrition, 0.76 million to HIV infection, 0.72 million to alcohol use disorders, 0.70 mil-lion to smoking and 0.35 million to diabetes. Country-spe-cific estimates are shown in Fig. 8.9. There is considerable variation among countries in the relative contribution of the five factors, and thus also variation in which of these factors need to be prioritized as part of national efforts to reduce the burden of TB disease.
The most recent data for six of the seven indicators asso-ciated with TB incidence listed in Table 8.2b are shown for the 30 high TB burden countries in Fig. 8.10.1 In this figure, the outer edge of the hexagon (100) is the ideal value for each indicator. Therefore, better performance corresponds to a larger shaded region. To represent this situation visual-ly, the indicators “proportion of the urban population living in slums” and “proportion of the population living below the international poverty line” are inverted in Fig. 8.10. All indicator values in Fig. 8.10 are for the general population, as opposed to people with TB; values for TB patients spe-cifically (e.g. out-of-pocket expenditure and access to social protection) may differ from these general values.
1 GDP per capita is not included in Fig. 8.9 because it is the only indicator that is not measured on a scale of 0–100. However, the latest value and recent trends in this indicator are shown in Fig. 8.10.
Although some upper-middle-income and lower-mid-dle-income countries (e.g. Brazil, China, India, Indone-sia, South Africa and Thailand) are performing relatively well, many high TB burden countries, especially those in the low-income category, still face significant challenges in achieving a range of TB-related SDG targets. Further-more, values for poor populations and vulnerable groups most at risk of developing TB are likely to be worse than national averages.
Fig. 8.11 shows trends since 2000 in four SDG-related indicators in the 30 high TB burden countries: (a) gross domestic product (GDP) per capita, (b) proportion of the population living below the international poverty line, (c) prevalence of undernourishment and (d) prevalence of diabetes. Although rapid growth in GDP per capita has occurred in several countries, many others show slow growth or stagnation. In general, poverty levels have been falling, but the proportion of the population living below the international poverty line is still elevated in many high TB burden countries, especially in the WHO African Region. It is encouraging that the prevalence of undernu-trition has fallen substantially in some countries in the past decade (e.g. Angola, Ethiopia, Myanmar and Sierra Leone). However, the trend of increasing undernutrition observed in Central African Republic, the Democratic People’s Republic of Korea, Kenya and Zimbabwe is con-cerning, as is the rising prevalence of diabetes prevalence in all countries.
The latest status and recent trends in all of the 14 indi-cators in Table 8.2 are shown for the 30 high TB bur-den countries in country profiles available on the WHO website2 and in the Global TB Report 2020 mobile app (Annex 3).
Although there have been positive trends in recent years in some of the indicators associated with TB inci-dence, the major threat posed by the COVID-19 pandemic could slow or reverse progress. The impact is difficult to predict at this stage, but the potential impact of the COV-ID-19 pandemic on TB determinants and TB disease bur-den is highlighted in Box 8.3.
2 See http://www.who.int/tb/data/en/.
TABLE 8.4Global estimates of the number of TB cases attributable to selected risk factors, 2019
RISK FACTOR RELATIVE RISK (UNCERTAINTY INTERVAL)
EXPOSED (MILLIONS)
POPULATION ATTRIBUTABLE FRACTION (%)
ATTRIBUTABLE TB CASES (MILLIONS, UNCERTAINTY INTERVAL)
Alcohol use disorders 3.3 2.1–5.2 288 8.1 0.72 0.30–1.3
Diabetes 1.5 1.3–1.8 489 3.1 0.35 0.14–0.65
HIV infection 18 15–21 38 7.7 0.76 0.68–0.86
Smoking 1.6 1.2–2.1 1 040 7.1 0.70 0.23–1.4
Undernourishment 3.2 3.1–3.3 812 19 2.2 1.5–3.1
Sources: Imtiaz S et al. Eur Resp Jour (2017); Hayashi S et al. Trop Med Int Health (2018); Lönnroth K et al. Lancet (2010); World Bank Sustainable Development Goals Database (http://datatopics.worldbank.org/sdgs/, accessed 15 June 2020); WHO Global Health Observatory (http://www.who.int/gho/en/, accessed 15 June 2020); and WHO Global TB Programme.
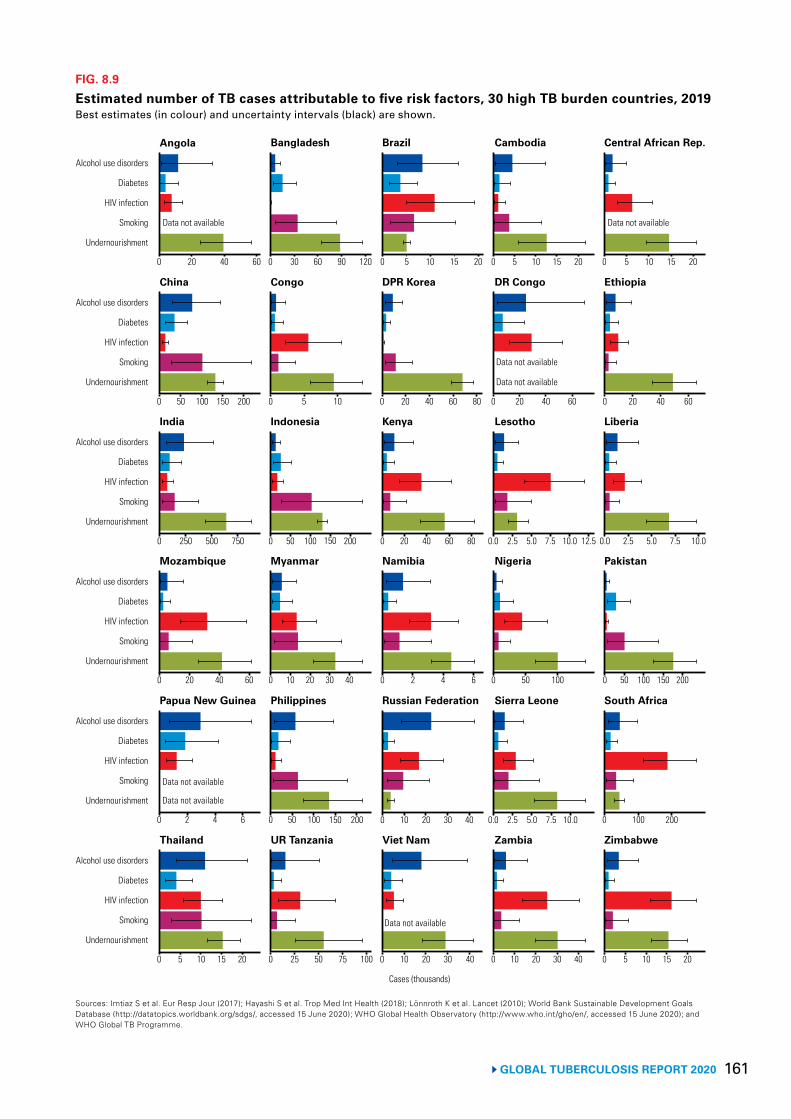
161 GLOBAL TUBERCULOSIS REPORT 2020
FIG. 8.9
Estimated number of TB cases attributable to five risk factors, 30 high TB burden countries, 2019Best estimates (in colour) and uncertainty intervals (black) are shown.
Sources: Imtiaz S et al. Eur Resp Jour (2017); Hayashi S et al. Trop Med Int Health (2018); Lönnroth K et al. Lancet (2010); World Bank Sustainable Development Goals Database (http://datatopics.worldbank.org/sdgs/, accessed 15 June 2020); WHO Global Health Observatory (http://www.who.int/gho/en/, accessed 15 June 2020); and WHO Global TB Programme.
Undernourishment
Smoking
HIV infection
Diabetes
Alcohol use disorders
Undernourishment
Smoking
HIV infection
Diabetes
Alcohol use disorders
Undernourishment
Smoking
HIV infection
Diabetes
Alcohol use disorders
Undernourishment
Smoking
HIV infection
Diabetes
Alcohol use disorders
Undernourishment
Smoking
HIV infection
Diabetes
Alcohol use disorders
Undernourishment
Smoking
HIV infection
Diabetes
Alcohol use disorders
0 20 40 60 0 30 60 120 0 10 20 0 5 10 15 20 0 5 10 15 20
0 50 100 150 200 0 5 10 0 20 40 60 0 20 40 0 20 40 60
0 250 500 750 0 50 100 150 200 0 20 40 60 80 0.0 2.5 5.0 10.0 0.0 2.5 5.0 7.5 10.0
0 20 40 60 0 10 30 40 0 2 4 6 0 50 100 0 50 100 150 200
0 2 4 6 0 50 100 150 0 10 20 30 40 0.0 5.0 10.0 0 100 200
0 5 10 15 20 0 25 50 75 100 0 10 20 40 0 10 20 30 40 0 5 10 15 20
Cases (thousands)
Data not available Data not available
Data not available
Data not available
90 155
80 60
30
2.5 7.5200
20
7.5 12.5
Data not available
Data not available
Data not available
Angola
India Indonesia Kenya Lesotho Liberia
China Congo DPR Korea DR Congo Ethiopia
Bangladesh Brazil Cambodia Central African Rep.
Papua New Guinea Philippines Russian Federation Sierra Leone South Africa
Mozambique Myanmar Namibia Nigeria Pakistan
Thailand UR Tanzania Viet Nam Zambia Zimbabwe
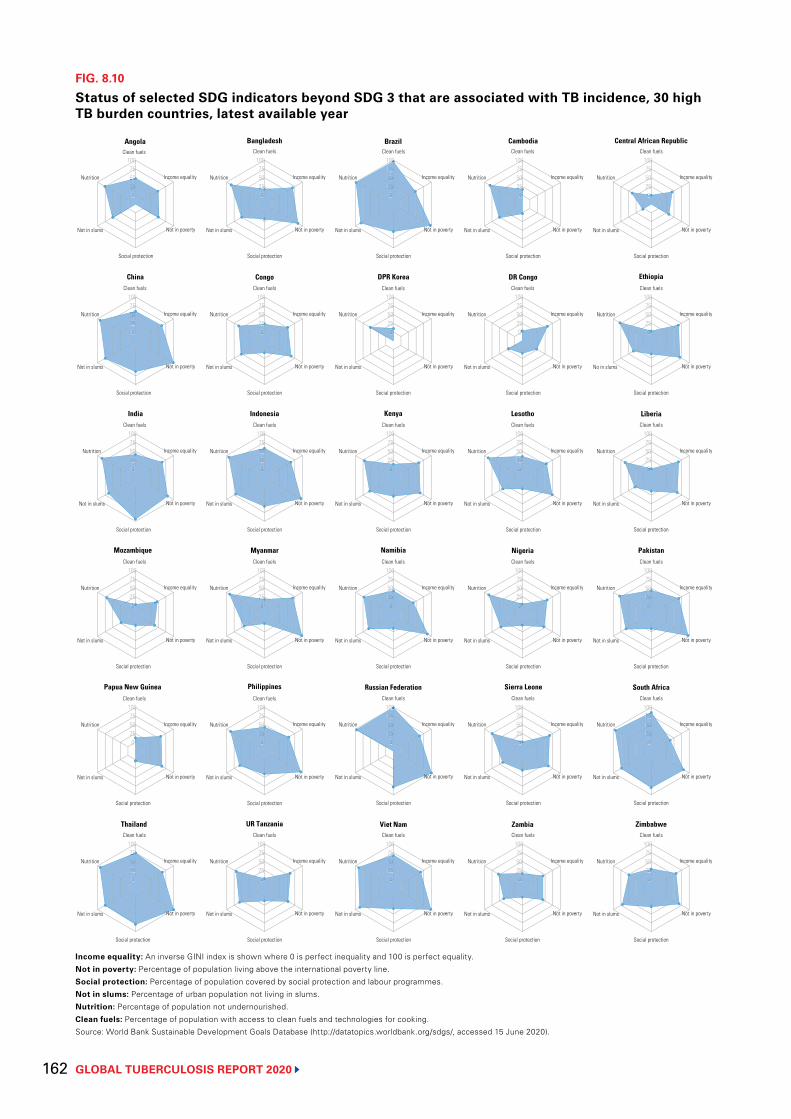
GLOBAL TUBERCULOSIS REPORT 2020 162
FIG. 8.10
Status of selected SDG indicators beyond SDG 3 that are associated with TB incidence, 30 high TB burden countries, latest available year
Income equality: An inverse GINI index is shown where 0 is perfect inequality and 100 is perfect equality.Not in poverty: Percentage of population living above the international poverty line.Social protection: Percentage of population covered by social protection and labour programmes.Not in slums: Percentage of urban population not living in slums.Nutrition: Percentage of population not undernourished.Clean fuels: Percentage of population with access to clean fuels and technologies for cooking.Source: World Bank Sustainable Development Goals Database (http://datatopics.worldbank.org/sdgs/, accessed 15 June 2020).
0255075
100
0255075
100
255075
100
0255075
100
0255075
100
0255075
100
0255075
100
0255075
100
0255075
100
0255075
100
0255075
100
0255075
100
0255075
100
0255075
100
0255075
100
0255075
100
0255075
100
0255075
100
0255075
100
0255075
100
0255075
100
0255075
100
0255075
100
0255075
100
0255075
100
0255075
100
0255075
100
0255075
100
0255075
100
0255075
100
0
Clean fuels
Nutrition
Not in slums
Social protection
Not in poverty
Income equality
Clean fuels
Nutrition
Not in slums
Social protection
Not in poverty
Income equality
Clean fuels
Nutrition
Not in slums
Social protection
Not in poverty
Income equality
Clean fuels
Nutrition
Not in slums
Social protection
Not in poverty
Income equality
Clean fuels
Nutrition
Not in slums
Social protection
Not in poverty
Income equality
Clean fuels
Nutrition
Not in slums
Social protection
Not in poverty
Income equality
Clean fuels
Nutrition
Not in slums
Social protection
Not in poverty
Income equality
Clean fuels
Nutrition
Not in slums
Social protection
Not in poverty
Income equality
Clean fuels
Nutrition
Not in slums
Social protection
Not in poverty
Income equality
Clean fuels
Nutrition
No in slums Not in poverty
Income equality
Clean fuels
Nutrition
Not in slums
Social protection
Not in poverty
Income equality
Clean fuels
Nutrition
Not in slums
Social protection
Not in poverty
Income equality
Clean fuels
Nutrition
Not in slums
Social protection
Not in poverty
Income equality
Clean fuels
Nutrition
Not in slums
Social protection
Not in poverty
Income equality Nutrition
Not in slums Not in poverty
Income equality
Clean fuels
Nutrition
Not in slums
Social protection
Not in poverty
Income equality
Clean fuels
Nutrition
Not in slums
Social protection
Not in poverty
Income equality
Clean fuels
Nutrition
Not in slums
Social protection
Not in poverty
Income equality
Clean fuels
Nutrition
Not in slums
Social protection
Not in poverty
Income equality
Clean fuels
Nutrition
Not in slums
Social protection
Not in poverty
Income equality
Clean fuels
Nutrition
Not in slums
Social protection
Not in poverty
Income equality
Clean fuels
Nutrition
Not in slums
Social protection
Not in poverty
Income equality
Clean fuels
Nutrition
Not in slums
Social protection
Not in poverty
Income equality
Clean fuels
Nutrition
Not in slums
Social protection
Not in poverty
Income equality
Clean fuels
Nutrition
Not in slums
Social protection
Not in poverty
Income equality
Clean fuels
Nutrition
Not in slums
Social protection
Not in poverty
Income equality
Clean fuels
Nutrition
Not in slums
Social protection
Not in poverty
Income equality
Clean fuels
Nutrition
Not in slums
Social protection
Not in poverty
Income equality
Clean fuels
Nutrition
Not in slums
Social protection
Not in poverty
Income equality
Clean fuels
Nutrition
Not in slums
Social protection
Not in poverty
Income equality
Clean fuels
Social protection
Social protection
002525505
00252550507575
00 00 00
0025255050
002525
00 00
002525
0025255050
00 002525
00
00 00 002525
00 002525
002525
00252550507575000
N
00 00252550507575
0025255050757
N
00 0025255050
00 002525
0005
00000
50
0555
0 0
0 05
0
05
0
0
0
0
000005
555
0
5
5 555
505050500002522
000000
25220000
NN
5502552525555
000
50500
000
000252225
000
0
No
00
N
00000000
00
7575
No
7575
N
7575555
000
5
252555
Angola Bangladesh Brazil Cambodia Central African Republic
China Congo DPR Korea DR Congo Ethiopia
India Indonesia Kenya Lesotho Liberia
Mozambique Myanmar Namibia Nigeria Pakistan
Papua New Guinea Philippines Russian Federation Sierra Leone South Africa
Thailand UR Tanzania Viet Nam Zambia Zimbabwe
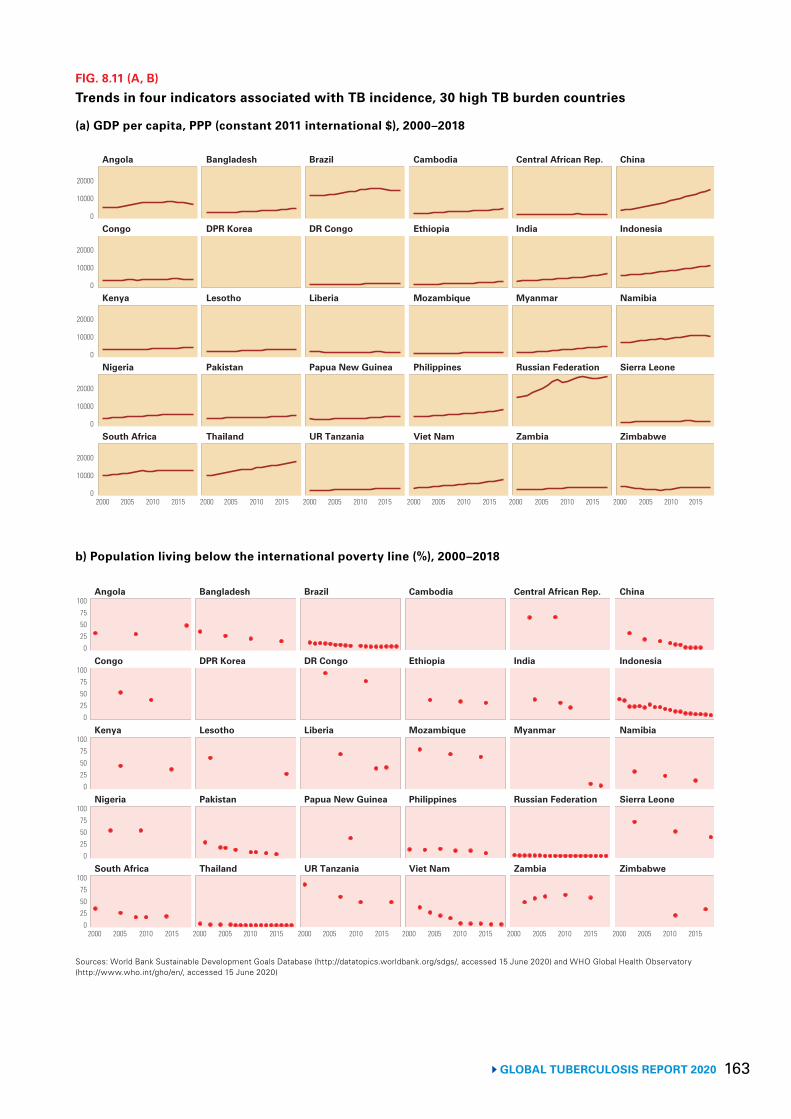
163 GLOBAL TUBERCULOSIS REPORT 2020
FIG. 8.11 (A, B)
Trends in four indicators associated with TB incidence, 30 high TB burden countries
Sources: World Bank Sustainable Development Goals Database (http://datatopics.worldbank.org/sdgs/, accessed 15 June 2020) and WHO Global Health Observatory (http://www.who.int/gho/en/, accessed 15 June 2020)
(a) GDP per capita, PPP (constant 2011 international $), 2000–2018
South Africa Thailand UR Tanzania Viet Nam Zambia Zimbabwe
Nigeria Pakistan Papua New Guinea Philippines Russian Federation Sierra Leone
Kenya Lesotho Liberia Mozambique Myanmar Namibia
Congo DPR Korea DR Congo Ethiopia India Indonesia
Angola Bangladesh Brazil Cambodia Central African Rep. China
0
10000
20000
0
10000
20000
0
10000
20000
0
10000
20000
0
10000
20000
2000 2005 2010 2015 2000 2005 2010 2015 2000 2005 2010 2015 2000 2005 2010 2015 2000 2005 2010 2015 2000 2005 2010 2015
b) Population living below the international poverty line (%), 2000–2018
0255075
100
0255075
100
0255075
100
0255075
100
0255075
100
2000 2005 2010 2015 2000 2005 2010 2015 2000 2005 2010 2015 2000 2005 2010 2015 2000 2005 2010 2015 2000 2005 2010 2015
South Africa Thailand UR Tanzania Viet Nam Zambia Zimbabwe
Nigeria Pakistan Papua New Guinea Philippines Russian Federation Sierra Leone
Kenya Lesotho Liberia Mozambique Myanmar Namibia
Congo DPR Korea DR Congo Ethiopia India Indonesia
Angola Bangladesh Brazil Cambodia Central African Rep. China
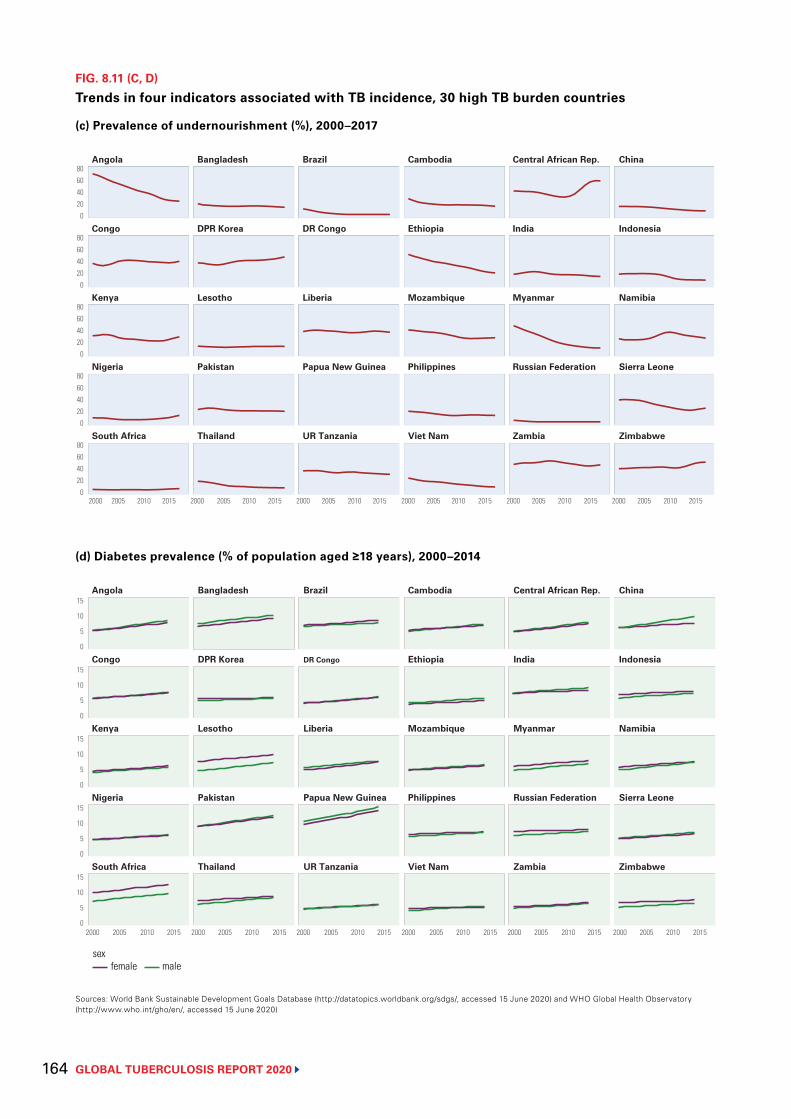
GLOBAL TUBERCULOSIS REPORT 2020 164
FIG. 8.11 (C, D)
Trends in four indicators associated with TB incidence, 30 high TB burden countries
Sources: World Bank Sustainable Development Goals Database (http://datatopics.worldbank.org/sdgs/, accessed 15 June 2020) and WHO Global Health Observatory (http://www.who.int/gho/en/, accessed 15 June 2020)
(c) Prevalence of undernourishment (%), 2000–2017
2000 2005 2010 2015 2000 2005 2010 2015 2000 2005 2010 2015 2000 2005 2010 2015 2000 2005 2010 2015 2000 2005 2010 2015
South Africa Thailand UR Tanzania Viet Nam Zambia Zimbabwe
Nigeria Pakistan Papua New Guinea Philippines Russian Federation Sierra Leone
Kenya Lesotho Liberia Mozambique Myanmar Namibia
Congo DPR Korea DR Congo Ethiopia India Indonesia
Angola Bangladesh Brazil Cambodia Central African Rep. China
020406080
020406080
020406080
020406080
020406080
(d) Diabetes prevalence (% of population aged ≥18 years), 2000–2014
sexfemale male
0
5
10
15
0
5
10
15
0
5
10
15
0
5
10
15
0
5
10
15South Africa Thailand UR Tanzania Viet Nam Zambia Zimbabwe
Nigeria Pakistan Papua New Guinea Philippines Russian Federation Sierra Leone
Kenya Lesotho Liberia Mozambique Myanmar Namibia
Congo DPR Korea DR Congo Ethiopia India Indonesia
Angola Bangladesh Brazil Cambodia Central African Rep. China
2000 2005 2010 2015 2000 2005 2010 2015 2000 2005 2010 2015 2000 2005 2010 2015 2000 2005 2010 2015 2000 2005 2010 2015
165 GLOBAL TUBERCULOSIS REPORT 2020
BOX 8.3
TB determinants and TB disease burden: potential impact of the COVID-19 pandemic
The COVID-19 pandemic has already caused enormous health, social and economic impacts, which are likely to persist for some time. The World Bank has estimated that global GDP could contract by 5.2% in 2020, with much more severe economic recessions already occurring in many countries.a Among other consequences, income per capita will fall and levels of unemployment will rise, in turn damaging livelihoods, worsening poverty and risking increased levels of undernutrition.
Globally, the proportion of the population living below the international poverty line of $1.90 per day is forecast to increase from 8.2% in 2019 to 8.8–9.2% in 2020, the first increase since 1998.b This is equivalent to an extra 71–100 million people being pushed into extreme poverty due to the COVID-19 pandemic. Many of the countries most affected will be those already struggling with high poverty rates, including those with a high burden of TB. Almost half of the projected COVID-induced poor will be in the World Bank region of South Asia (especially in India), and more than one third in Sub-Saharan Africa. Three high TB burden countries – the Democratic Republic of the Congo, India and Nigeria – are home to more than one third of the world’s poor.
The UN World Food Programme has estimated that the COVID-19 pandemic will double the number of people suffering from acute hunger: 270 million people by the end of 2020, compared with 135 million in 2019.c The proportion of the population experiencing acute food insecurity is forecast to be very serious in some high TB burden countries, notably the Democratic Republic of the Congo (7.1%) and Nigeria (14%).d Sharp increases in the number of people experiencing food insecurity are also predicted in West and Central Africa (+135%) and Southern Africa (+90%). In Zimbabwe, the number of people facing food insecurity in urban areas alone is projected to increase by more than 1 million (from 2.2 million to 3.3 million) during 2020.
While economic recessions, poverty, food insecurity and undernutrition are all determinants that fuel the TB epidemic, the effects of the COVID-19 pandemic on health-related risk factors such as HIV, diabetes, smoking, and alcohol use disorders are uncertain. However, considering the ongoing disruptions of essential health services due to the pandemic, negative impacts are likely.
The worsening levels of these TB determinants are likely to have short- and medium-term negative impacts on the TB epidemic at global and national levels. This is in addition to the impact on TB deaths in 2020 that is estimated to be due to reductions in TB case detection associated with the COVID-19 pandemic (Chapter 3). Early and rapid restoration of essential TB services is critical, but will not be enough to remedy the impact on broader TB determinants. In the context of the COVID-19 pandemic, addressing the socioeconomic determinants of TB and its consequences, as well as health-related risk factors for TB infection and disease, is more important than ever.
a Global economic prospects, June 2020. Washington, DC: World Bank; 2020 (https://www.worldbank.org/en/publication/global-economic-prospects, accessed 20 July 2020) (20).
b Projected poverty impacts of COVID-19 (coronavirus). Washington, DC: World Bank; 2020 (http://pubdocs.worldbank.org/en/461601591649316722/Projected-poverty-impacts-of-COVID-19.pdf, accessed 20 July 2020) (21).
c Coronavirus and hunger: WFP ready to assist largest number of people ever. Rome: World Food Programme; 2020 (https://insight.wfp.org/coronavirus-and-hunger-wfp-ready-to-assist-largest-number-of-people-ever-23aea919e87d, accessed 20 July 2020) (22).
d 2020 – Global report on food crises. Rome: World Food Programme; 2020 (https://www.wfp.org/publications/2020-global-report-food-crises, accessed 20 July 2020) (23).
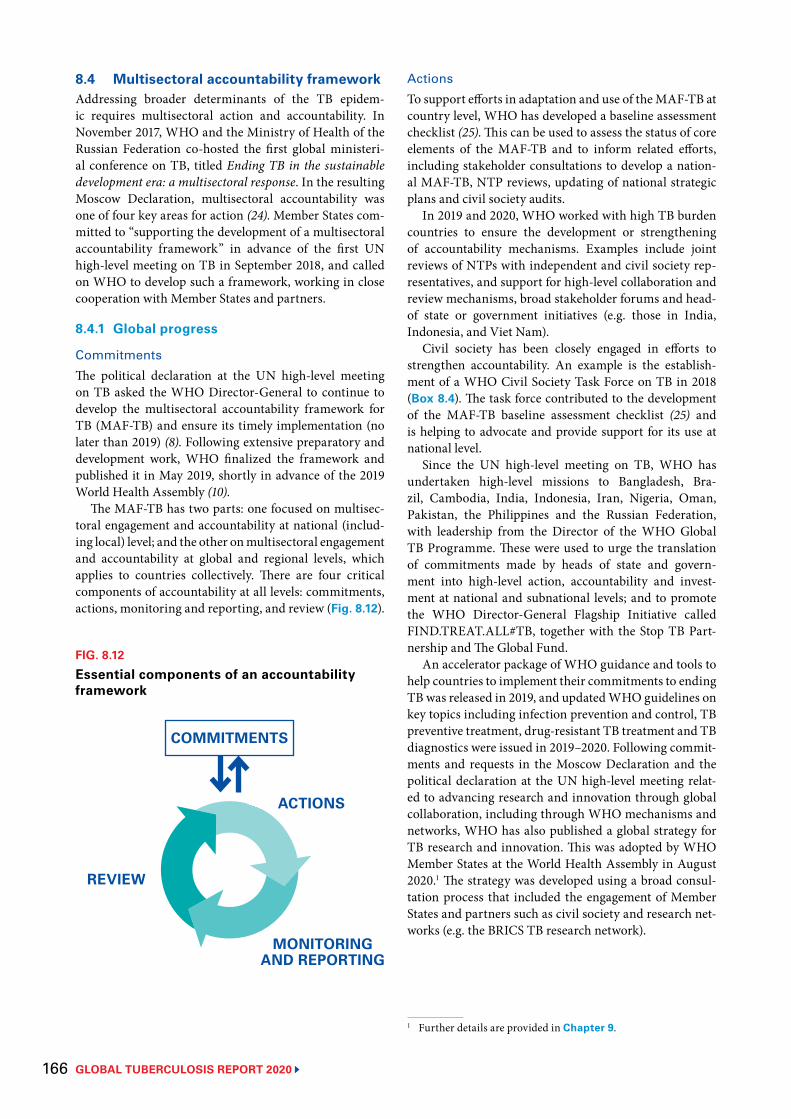
GLOBAL TUBERCULOSIS REPORT 2020 166
8.4 Multisectoral accountability frameworkAddressing broader determinants of the TB epidem-ic requires multisectoral action and accountability. In November 2017, WHO and the Ministry of Health of the Russian Federation co-hosted the first global ministeri-al conference on TB, titled Ending TB in the sustainable development era: a multisectoral response. In the resulting Moscow Declaration, multisectoral accountability was one of four key areas for action (24). Member States com-mitted to “supporting the development of a multisectoral accountability framework” in advance of the first UN high-level meeting on TB in September 2018, and called on WHO to develop such a framework, working in close cooperation with Member States and partners.
8.4.1 Global progress
CommitmentsThe political declaration at the UN high-level meeting on TB asked the WHO Director-General to continue to develop the multisectoral accountability framework for TB (MAF-TB) and ensure its timely implementation (no later than 2019) (8). Following extensive preparatory and development work, WHO finalized the framework and published it in May 2019, shortly in advance of the 2019 World Health Assembly (10).
The MAF-TB has two parts: one focused on multisec-toral engagement and accountability at national (includ-ing local) level; and the other on multisectoral engagement and accountability at global and regional levels, which applies to countries collectively. There are four critical components of accountability at all levels: commitments, actions, monitoring and reporting, and review (Fig. 8.12).
ActionsTo support efforts in adaptation and use of the MAF-TB at country level, WHO has developed a baseline assessment checklist (25). This can be used to assess the status of core elements of the MAF-TB and to inform related efforts, including stakeholder consultations to develop a nation-al MAF-TB, NTP reviews, updating of national strategic plans and civil society audits.
In 2019 and 2020, WHO worked with high TB burden countries to ensure the development or strengthening of accountability mechanisms. Examples include joint reviews of NTPs with independent and civil society rep-resentatives, and support for high-level collaboration and review mechanisms, broad stakeholder forums and head-of state or government initiatives (e.g. those in India, Indonesia, and Viet Nam).
Civil society has been closely engaged in efforts to strengthen accountability. An example is the establish-ment of a WHO Civil Society Task Force on TB in 2018 (Box 8.4). The task force contributed to the development of the MAF-TB baseline assessment checklist (25) and is helping to advocate and provide support for its use at national level.
Since the UN high-level meeting on TB, WHO has undertaken high-level missions to Bangladesh, Bra-zil, Cambodia, India, Indonesia, Iran, Nigeria, Oman, Pakistan, the Philippines and the Russian Federation, with leadership from the Director of the WHO Global TB Programme. These were used to urge the translation of commitments made by heads of state and govern-ment into high-level action, accountability and invest-ment at national and subnational levels; and to promote the WHO Director-General Flagship Initiative called FIND.TREAT.ALL#TB, together with the Stop TB Part-nership and The Global Fund.
An accelerator package of WHO guidance and tools to help countries to implement their commitments to ending TB was released in 2019, and updated WHO guidelines on key topics including infection prevention and control, TB preventive treatment, drug-resistant TB treatment and TB diagnostics were issued in 2019–2020. Following commit-ments and requests in the Moscow Declaration and the political declaration at the UN high-level meeting relat-ed to advancing research and innovation through global collaboration, including through WHO mechanisms and networks, WHO has also published a global strategy for TB research and innovation. This was adopted by WHO Member States at the World Health Assembly in August 2020.1 The strategy was developed using a broad consul-tation process that included the engagement of Member States and partners such as civil society and research net-works (e.g. the BRICS TB research network).
1 Further details are provided in Chapter 9.
FIG. 8.12
Essential components of an accountability framework
COMMITMENTS
ACTIONS
MONITORING AND REPORTING
REVIEW
BOX 8.4
167 GLOBAL TUBERCULOSIS REPORT 2020
Monitoring, reporting and reviewRegular reports and reviews of progress towards end-ing TB by the UN General Assembly and World Health Assembly are essential to global and national accounta-bility. The World Health Assembly reviewed progress on TB in follow-up to the UN high-level meeting in 2019 and 2020, based on WHO’s global monitoring and report-ing on the status of the TB epidemic and progress in the response.1
1 The two key components are the annual rounds of global TB data collection and series of annual WHO global TB reports described in Chapter 1.
Recognizing young people as a powerful but underused ally in the fight to end TB, especially to scale up multi-sectoral action and accountability, WHO launched the 1+1 Youth Initiative in 2019. This was followed by the adoption of a Youth Declaration to End TB at the first-ev-er Global Youth Townhall on Ending TB. The 1+1 Initi-ative has expanded to include over ten thousand young people across the world in countries including Bangla-desh, India, Indonesia, Kenya, Nepal, the Philippines and Viet Nam. Social media platforms set up as part of the 1+1 Youth Initiative and social media posts are followed by over 20 000 people, with the number growing each day. More than 100 youth-led activities and events on ending TB have been conducted worldwide. This includes peer education in schools and universities, sensitizing young people, encouraging them to become TB advocates, and supporting TB patients in the community with resources and advice.
BOX 8.4
The WHO Civil Society Task Force on TB
Building on the End TB Strategy, in 2018 the political declaration at the UN high-level meeting on TB called for prioritizing the strong and meaningful engagement of civil society and affected communities in all aspects of the TB response.
The WHO Civil Society Task Force on TB provides a platform for discussion and exchange with WHO, building on the commitments made by the WHO Director-General during the first WHO global ministerial conference on TB (in November 2017) and several consultations.a It aims to harness the untapped potential for engagement with civil society and affected communities at all levels.
The current mandate of the Task Force is for the period January 2019 to December 2020. Priorities include:
▶ helping to translate the End TB Strategy and associated WHO guidance into practice by mainstreaming the voices of communities affected by TB and their networks at global, regional and country levels;
▶ catalysing greater collaboration between civil society organizations, NTPs and WHO at all levels, including through meaningful engagement of civil society and affected communities in policy development;
▶ contributing to the implementation of WHO guidance on TB, with a particular focus on multisectoral action for social protection and universal health coverage, and advocating for their inclusion in national TB strategies and plans, national social programmes, national political platforms (e.g. parliaments) and regional and global platforms for policy dialogue;
▶ promoting and nurturing strong and effective links between community-based actors and NTPs or their equivalent, as well as promoting demand for TB prevention, diagnosis, care and treatment services;
▶ developing a framework for monitoring and evaluation of collaboration among civil society organizations, NTPs and WHO at all levels;
▶ promoting capacity-building for civil society members and representatives of communities affected by TB to intensify information-sharing, dialogue and consultation on the implementation of WHO guidance;
▶ advocating for increased domestic funding and donor commitments for the TB response at all levels.
Fifteen civil society members were selected, with input from an independent selection panel. Selection was based on assessments of individual competencies and experience, and the process aimed to balance geography, gender and the diversity of communities and civil society representatives.
a WHO Civil Society Task Force on TB: Engagement with civil society as the driver for change (https://www.who.int/publications/i/item/who-civil-society-task-force-on-tb, accessed 20 September 2020)
GLOBAL TUBERCULOSIS REPORT 2020 168
In 2020, a report of the UN Secretary-General on pro-gress towards achieving global TB targets and implemen-tation of other commitments in the political declaration of the UN high-level meeting on TB was prepared with WHO support.
The next review of progress by the World Health Assembly is expected in 2022, in advance of a comprehen-sive review at a high-level meeting of the General Assem-bly in 2023.
As part of the monitoring and reporting component of the MAF-TB, WHO has launched a collaborative multi- stakeholder and multisectoral platform to coordinate the TB response and review progress at the global level.
8.4.2 Regional progressThere is accelerated action in all WHO regions to strength-en accountability to end TB.
Recent examples include:
▶ establishment of high-level reviews by the African Union in collaboration with the WHO Regional Office for Africa and the Stop TB Partnership, based on an annual Continental Scorecard to End TB;
▶ creation of a UN common position on ending HIV, TB and viral hepatitis through intersectoral collaboration, under the leadership of the WHO Regional Office for Europe;
▶ organization of a ministerial meeting on ending TB by the WHO Regional Office for South-East Asia in 2018, with a follow-up meeting in 2019;
▶ subregional mechanisms to support progress towards global TB targets in the Americas, including the Coun-cil of Ministers of Health of Central America and Dominican Republic (COMSICA);
▶ discussion of TB elimination strategies by the Gulf Coordination Council, in the Eastern Mediterranean Region; and
▶ high-level missions to high TB burden countries in the Western Pacific Region, including the launch of initi-atives called “Race to End TB” in the Philippines and Viet Nam.
8.4.3 National progress Examples of national high-level leadership on multisec-toral accountability include Presidential or Head of State End TB initiatives and formalized mechanisms for the engagement and accountability of stakeholders in India, Indonesia, Pakistan, Philippines and Viet Nam, as well as national campaigns to drive progress such as the “Race to End TB”.
In the 2020 round of TB data collection, WHO request-ed information from all countries and territories (n=215) on three key elements of multisectoral accountability in the national TB response: national strategic plans (NSPs) for TB, annual TB reports, and multisectoral and multi-stakeholder review mechanisms under high-level leader-ship (Table 8.5). This request was in line with the political declaration at the UN high-level meeting on TB and the content of the MAF-TB. In the political declaration, UN Member States committed to:
develop or strengthen, as appropriate, nation-al tuberculosis strategic plans … including through national multisectoral mechanisms to monitor and review progress … with high-lev-el leadership, preferably under the direction of the Head of State or Government, and with the active involvement of civil society and affected communities.
All of the 30 high TB burden countries have an NSP and, in 25 of those 30 countries, the current plan was developed or updated since the high-level meeting in Sep-tember 2018. In developing the plan, almost all countries (29/30) involved civil society and affected communities.
Globally, 148 of 215 countries and territories reported having an NSP for TB; of these, 116 were developed with the engagement of civil society and affected communities, and 97 were developed or updated since the UN high-level meeting.
Most high TB burden countries (27/30) and 134 (62%) countries in total stated that they produce an annual TB report. WHO is working with countries to review report content and learn lessons, such as about how epidemiolog-ical and programmatic issues are addressed, stakeholders are engaged, and reports are promoted and used.
Of the three elements of accountability for which data were collected, the one that is least well-established to date is high-level review. Only 16 of the 30 high TB bur-den countries reported having a mechanism for high-level review, and globally, less than half of countries reported having one (86/215, 40%). Examples of progress in terms of high-level engagement, coordination or review bodies, and legislation in high TB burden countries, are provided in Box 8.5.
In some eastern European countries, civil society organizations are among those advocating for conversion of the existing Global Fund to Fight AIDS, Tuberculosis and Malaria (Global Fund) country coordination mecha-nisms (CCMs) into national commissions to address TB, or TB, HIV and hepatitis. This reflects the transition from Global Fund financing to domestic financing, and the critical need for high-level engagement.
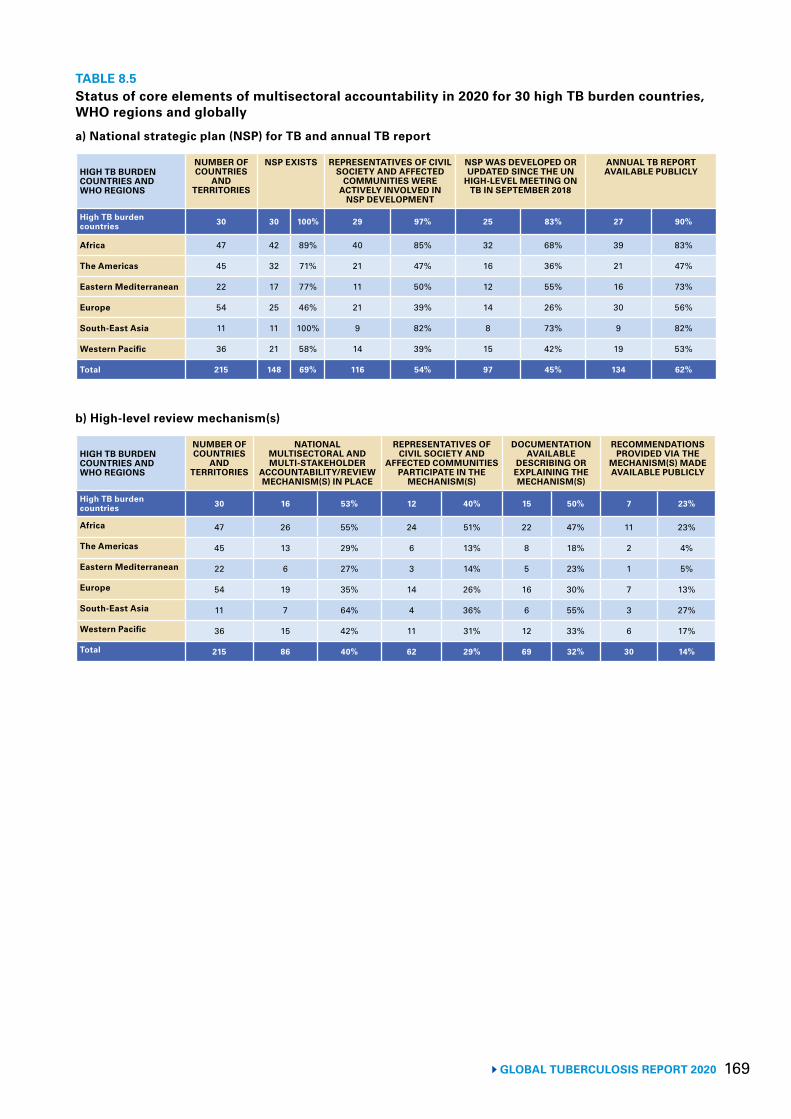
169 GLOBAL TUBERCULOSIS REPORT 2020
TABLE 8.5Status of core elements of multisectoral accountability in 2020 for 30 high TB burden countries, WHO regions and globally
a) National strategic plan (NSP) for TB and annual TB report
HIGH TB BURDEN COUNTRIES AND WHO REGIONS
NUMBER OF COUNTRIES
AND TERRITORIES
NSP EXISTS REPRESENTATIVES OF CIVIL SOCIETY AND AFFECTED
COMMUNITIES WERE ACTIVELY INVOLVED IN
NSP DEVELOPMENT
NSP WAS DEVELOPED OR UPDATED SINCE THE UN
HIGH-LEVEL MEETING ON TB IN SEPTEMBER 2018
ANNUAL TB REPORT AVAILABLE PUBLICLY
High TB burden countries 30 30 100% 29 97% 25 83% 27 90%
Africa 47 42 89% 40 85% 32 68% 39 83%
The Americas 45 32 71% 21 47% 16 36% 21 47%
Eastern Mediterranean 22 17 77% 11 50% 12 55% 16 73%
Europe 54 25 46% 21 39% 14 26% 30 56%
South-East Asia 11 11 100% 9 82% 8 73% 9 82%
Western Pacific 36 21 58% 14 39% 15 42% 19 53%
Total 215 148 69% 116 54% 97 45% 134 62%
b) High-level review mechanism(s)
HIGH TB BURDEN COUNTRIES AND WHO REGIONS
NUMBER OF COUNTRIES
AND TERRITORIES
NATIONAL MULTISECTORAL AND MULTI-STAKEHOLDER
ACCOUNTABILITY/REVIEW MECHANISM(S) IN PLACE
REPRESENTATIVES OF CIVIL SOCIETY AND
AFFECTED COMMUNITIES PARTICIPATE IN THE
MECHANISM(S)
DOCUMENTATION AVAILABLE
DESCRIBING OR EXPLAINING THE MECHANISM(S)
RECOMMENDATIONS PROVIDED VIA THE
MECHANISM(S) MADE AVAILABLE PUBLICLY
High TB burden countries 30 16 53% 12 40% 15 50% 7 23%
Africa 47 26 55% 24 51% 22 47% 11 23%
The Americas 45 13 29% 6 13% 8 18% 2 4%
Eastern Mediterranean 22 6 27% 3 14% 5 23% 1 5%
Europe 54 19 35% 14 26% 16 30% 7 13%
South-East Asia 11 7 64% 4 36% 6 55% 3 27%
Western Pacific 36 15 42% 11 31% 12 33% 6 17%
Total 215 86 40% 62 29% 69 32% 30 14%
GLOBAL TUBERCULOSIS REPORT 2020 170
BOX 8.5
High-level mechanisms and initiatives to end TB: country examples
The WHO MAF-TB identifies three key elements of a national-level review mechanism:
▶ high-level leadership, preferably under the direction of the head of government or head of state, especially in countries with a high burden of TB;
▶ a multisectoral perspective; and ▶ engagement of key stakeholders, as
appropriate; stakeholders include government ministries and institutes, local governments, civil society, TB-affected communities, patient groups, parliamentarians, the private sector, public–private partnerships (including product development partnerships), research institutes and universities (and associated research networks), professional associations and other constituencies.
In the political declaration of the UN high-level meeting on TB in 2018, countries committed to use national multisectoral mechanisms to monitor and review progress to end TB.
A high-level coordination and review mechanism for TB can be constituted in different ways. Examples include a stand-alone TB-specific committee, similar to a national AIDS commission, or an existing high-level government health committee that addresses TB substantively on a periodic basis and involves outside stakeholders. A body or mechanism could result from a head-of-state decree or legislation, or could form part of a presidential or head-of-state initiative.
Recent examples in high TB burden countries are profiled here.
China China has issued a new National Action Plan for TB Control for 2019–2022 in which the responsibilities of key ministries in the TB response are clearly identified. These responsibilities were also defined in the Healthy China Action Plan (2019–2030) issued by the State Council. The China State Council has established an Inter-ministerial Coordinating Mechanism for the Prevention and Control of Major Diseases, which will address TB regularly. In this mechanism, the National Health Commission (equivalent of a Ministry of Health) will play the coordination role among the other ministries and entities identified and involved in the TB response (e.g. Ministry of Education, Ministry of Civil Affairs, Ministry of Science and Technology, Ministry of Finance, National Healthcare Security Administration, the State Council Leading Group Office of Poverty Alleviation and Development, among others).
IndiaIn 2017, the Prime Minister set the target of ending TB in India by 2025. The following year, he presided over a ministerial meeting on ending TB that was organized by the WHO Regional Office for South-East Asia. He has included TB in his quarterly discussions with the chief ministers of the country’s 28 states. In 2019, national, state and district TB forums, and a large inter-ministerial committee, were established. Several chief ministers have developed their own state TB elimination plans and special initiatives, and TB-free panchayats (villages) are being promoted across the country. In 2020, the Revised National TB Control Programme was renamed the National TB Elimination Programme and a strategic plan for the period 2020–2025, which emphasizes the centrality of multisectoral action to end the epidemic, is being implemented.
IndonesiaHigh-level engagement was boosted by the UN high-level meeting on TB in 2018 and by high-profile global and national TB meetings held in 2019, which were organized with WHO and the Stop TB Partnership Indonesia.
In January 2020, the President held an event with officials from across the country to launch a “TB Elimination Movement”. As part of the national response to the COVID-19 pandemic, a protocol was issued to help ensure ongoing TB care and prevention, and the President has repeatedly issued public warnings about the ongoing urgency of TB detection and care.
In April 2020, the Secretary of State formally announced work on a Presidential Decree on TB Elimination. In July 2020, the President held a meeting with the Vice-President and several ministers (e.g. of Health, Planning, Social Affairs, Justice and Human Rights, Public Works and Human Settlements) and announced the decree’s key aims. These include strengthening active case finding, ensuring effective treatment services and an intensified focus on prevention. The decree is intended to include high-level monitoring and review. Completion of the official processing of the decree, including via formal consultations, is expected in 2020.
Myanmar The Global Fund country coordinating mechanism has been transformed into the Myanmar Health Sector Coordination Committee, under the leadership of the Ministry of Health and Sport. Its roles include guiding the implementation of the Essential Package of Health Services (including TB), and contributing to tracking sectoral progress related
BOX 8.5
171 GLOBAL TUBERCULOSIS REPORT 2020
BOX 8.5 BOX 8.5
to the Myanmar Sustainable Development Plan via the Development Assistance Coordination Unit. As part of the national TB strategic plan for 2021–2025, there will be a national multisectoral accountability framework for TB and additional multisectoral coordination committees, including one dedicated to the Yangon Region. The framework will build on recent successes, such as standards of practice for screening with the Prison Department in the Ministry of Home Affairs, and mandatory TB case notification from services provided by multiple sectors.
Philippines A cross-governmental mechanism to address TB prevention and care was first established through a Presidential Executive Order in 2003, engaging 17 government agencies and five private sector organizations to work together to implement harmonized policies for TB prevention and care. The mechanism covers a range of social sectors such as health, labour, welfare, development, poverty reduction, justice, social insurance, education, agriculture and the private and corporate sectors. In 2016, building on these foundations, the Congress of the Philippines passed a Comprehensive Tuberculosis Elimination Plan Act (Republic Act 10767). This strengthens the mandate and capacity of the National Coordination Committee and the regional coordination committees to coordinate stakeholder efforts in the public and private sectors. These national and subnational mechanisms serve as venues for coordination, monitoring and review of multisectoral actions to end TB.
Russian FederationA 2001 federal law and 2019 order of the Ministry of Health provide the main legal foundation for the roles and responsibilities of federal and subnational authorities and institutions in the fight against TB.
A high-level working group on TB was established 20 years ago and is co-chaired by WHO and the Ministry of Health. The working group is multisectoral and multistakeholder in nature. It includes representatives from the penitentiary services; a body responsible for surveillance related to protection of consumer rights and human well-being; people affected by TB; research institutes; and international agencies, including the World Bank, International Labour Organization and International Organization of Migration. The group has served as a model for a more recently established high-level working group for HIV/AIDS.
In 2016, the President directed national action to dramatically reduce the top 10 causes of adult deaths, one of which was TB, with regular high-level monitoring and review of progress. Between 2015 (the baseline year of the WHO End TB Strategy) and
2019, the number of TB deaths fell at a rate of 10% per year; the country is one of only seven high TB burden countries to have achieved the 2020 milestone of the End TB Strategy (a 35% reduction 2015–2020) ahead of schedule (Chapter 2, Chapter 4). Measures to combat TB in the Russian Federation include a combination of medical and non-medical multisectoral measures, such as social support for TB patients (job retention and paid sick leave, preferential disability pensions, provision of housing), as well as free drug provision from the federal and regional budgets, treatment and rehabilitation.
The President hosted WHO’s first global ministerial conference on ending TB in November 2017, which resulted in the Moscow Declaration.
The Russian Federation is also supporting the implementation of the MAF-TB at global and national levels.
South AfricaThe mandate of the high-level South Africa National AIDS Council (SANAC) was expanded to include TB in 2009, more than a decade ago. SANAC is chaired by the country’s Deputy President, with membership including representatives from civil society, affected communities and the private sector. It also serves as the country coordinating mechanism for proposals to and grant agreements with the Global Fund. There is one strategic plan for both the HIV and TB epidemics, and the respective national programmes are coordinated by one deputy director-general in the Department of Health.
Viet NamA National Commission to End TB was established in 2019, as part of a Prime Ministerial decree to consolidate the system for TB prevention and control. The Commission is chaired by the Deputy Prime Minister and aims to guide and coordinate implementation of the National Action Plan through engagement of multiple sectors, in line with the WHO MAF-TB. The first meeting of the Commission was held in March 2020 with representatives from several government ministries (finance, health, information and communication, planning and investment, public security, and science and technology) as well as associations and related commissions. In the next national TB strategic plan for 2021–2025, under an overall Action Programme to 2030, sector roles and responsibilities are being defined, 15 provinces are being targeted for a strengthened managerial structure to provide oversight of TB-related services, and domestic financing for TB drugs is being strengthened. A revised national law on infectious diseases, including TB, is being formulated.
GLOBAL TUBERCULOSIS REPORT 2020 172
References1 Grange JM, Gandy M, Farmer P, Zumla A. Historical declines in tuberculosis: nature, nurture and the biosocial
model. Int J Tuberc Lung Dis. 2001;5(3):208–12 (https://www.ncbi.nlm.nih.gov/pubmed/11326817, accessed 20 July 2020).
2 Styblo K, Meijer J, Sutherland I. [The transmission of tubercle bacilli: its trend in a human population]. Bull World Health Organ. 1969;41(1):137–78 (https://www.ncbi.nlm.nih.gov/pubmed/5309081, accessed 20 July 2020).
3 Lienhardt C, Glaziou P, Uplekar M, Lönnroth K, Getahun H, Raviglione M. Global tuberculosis control: lessons learnt and future prospects. Nat Rev Microbiol. 2012;10(6):407 (https://www.ncbi.nlm.nih.gov/pubmed/22580364, accessed 20 July 2020).
4 Lönnroth K, Castro KG, Chakaya JM, Chauhan LS, Floyd K, Glaziou P et al. Tuberculosis control and elimination 2010–50: cure, care, and social development. Lancet. 2010;375(9728):1814–29 (https://www.ncbi.nlm.nih.gov/pubmed/20488524, accessed 20 July 2020).
5 Lönnroth K, Jaramillo E, Williams B, Dye C, Raviglione M. Tuberculosis: the role of risk factors and social determinants. In: Blas E & Kurup A (eds.), Equity, social determinants and public health programmes. 2010 (https://apps.who.int/iris/bitstream/handle/10665/44289/9789241563970_eng.pdf;jsessionid=067BC8BA3F7A5366C05BE34404F9D8F6?sequence=1, accessed 20 July 2020).
6 Lönnroth K, Jaramillo E, Williams BG, Dye C, Raviglione M. Drivers of tuberculosis epidemics: the role of risk factors and social determinants. Soc Sci Med. 2009;68(12):2240–6 (https://www.ncbi.nlm.nih.gov/pubmed/19394122, accessed 20 July 2020).
7 Sustainable development goals [website]. New York: United Nations; (https://sustainabledevelopment.un.org/topics/sustainabledevelopmentgoals, accessed 20 July 2020).
8 United Nations General Assembly. Resolution 73/3: Political declaration of the high-level meeting of the General Assembly on the fight against tuberculosis. United Nations; 2018 (https://www.un.org/en/ga/search/view_doc.asp?symbol=A/RES/73/3, accessed 20 July 2020).
9 Uplekar M, Weil D, Lönnroth K, Jaramillo E, Lienhardt C, Dias HM et al. WHO’s new End TB strategy. Lancet. 2015;385(9979):1799–801 (https://www.ncbi.nlm.nih.gov/pubmed/25814376, accessed 20 July 2020).
10 Multisectoral accountability framework to accelerate progress to end tuberculosis by 2030. Geneva: World Health Organization; 2019 (https://www.who.int/tb/WHO_Multisectoral_Framework_web.pdf?ua=1, accessed 20 July 2020).
11 World Health Organization/World Bank. Tracking universal health coverage: 2017 global monitoring report. Geneva: World Health Organization; 2017 (https://apps.who.int/iris/bitstream/handle/10665/259817/9789241513555-eng.pdf, accessed 20 July 2020).
12 United Nations General Assembly. Resolution 74/2: Political declaration of the high-level meeting of the General Assembly on universal health coverage. United Nations; 2019 (https://undocs.org/en/A/RES/74/2, accessed 20 July 2020).
13 Primary health care on the road to universal health coverage: 2019 monitoring report. Geneva: World Health Organization; 2019 (https://www.who.int/healthinfo/universal_health_coverage/report/uhc_report_2019.pdf, accessed 20 July 2020).
14 World Health Organization/World Bank. Global monitoring report on financial protection in health 2019. Geneva: World Health Organization; 2020 (https://apps.who.int/iris/bitstream/handle/10665/331748/9789240003958-eng.pdf, accessed 20 July 2020).
15 Tangcharoensathien V, Witthayapipopsakul W, Panichkriangkrai W, Patcharanarumol W, Mills A. Health systems development in Thailand: a solid platform for successful implementation of universal health coverage. Lancet. 2018;391(10126):1205–23.
16 Tuberculosis patient cost surveys: a handbook. Geneva: World Health Organization; 2017 (https://www.who.int/tb/publications/patient_cost_surveys/en/, accessed 20 July 2020).
17 Hoa N, Nhung N. National tuberculosis patients cost survey: research findings lead to change in policy and practice, Viet Nam. Public Health Action. 2019;9(2):50–2.
18 Kayomo M, Minga G, Nkiere N, Mingiedi B, Eloko G, Nguhiu P et al. First national survey of the costs borne by households with tuberculosis in Democratic Republic of Congo, 2019: Abstract for presentation at the 51st Union World Conference on Lung Health. 2020.
173 GLOBAL TUBERCULOSIS REPORT 2020
19 Monitoring and evaluation of TB in the context of the Sustainable Development Goals in Policy Briefs: WHO Global Ministerial Conference Ending TB in the Sustainable Development Era: Multisectoral Response. Geneva: World Health Organization; 2017 (https://www.who.int/tb/Policy_Briefs/en/,, accessed 20 July 20220).
20 Global economic prospects, June 2020. Washington, DC: World Bank; 2020 (https://www.worldbank.org/en/publication/global-economic-prospects, accessed 20 July 2020).
21 Projected poverty impacts of COVID-19 (coronavirus). Washington, DC: World Bank; 2020 (http://pubdocs.worldbank.org/en/461601591649316722/Projected-poverty-impacts-of-COVID-19.pdf, accessed 20 July 2020).
22 Coronavirus and hunger: WFP ready to assist largest number of people ever. Rome: World Food Programme; 2020 (https://insight.wfp.org/coronavirus-and-hunger-wfp-ready-to-assist-largest-number-of-people-ever-23aea919e87d, accessed 20 July 2020).
23 2020 – Global report on food crises Rome: World Food Programme; 2020 (https://www.wfp.org/publications/2020-global-report-food-crises, accessed 20 July 2020).
24 Moscow Declaration to End TB; First WHO global ministerial conference on ending TB in the sustainable development era: a multisectoral response. Geneva: World Health Organization and the Ministry of Health of the Russian Federation; 2017 (https://www.who.int/tb/features_archive/Moscow_Declaration_to_End_TB_final_ENGLISH.pdf?ua=1, accessed 20 July 2020).
25 WHO Multisectoral accountability framework for TB (MAF-TB): baseline assessment checklist for country use in pursuing a national MAF-TB Geneva: World Health Organization; 2020 (https://www.who.int/tb/publications/WHO_MAFTB_Checklist_Form-Final.pdf, accessed 20 July 2020).
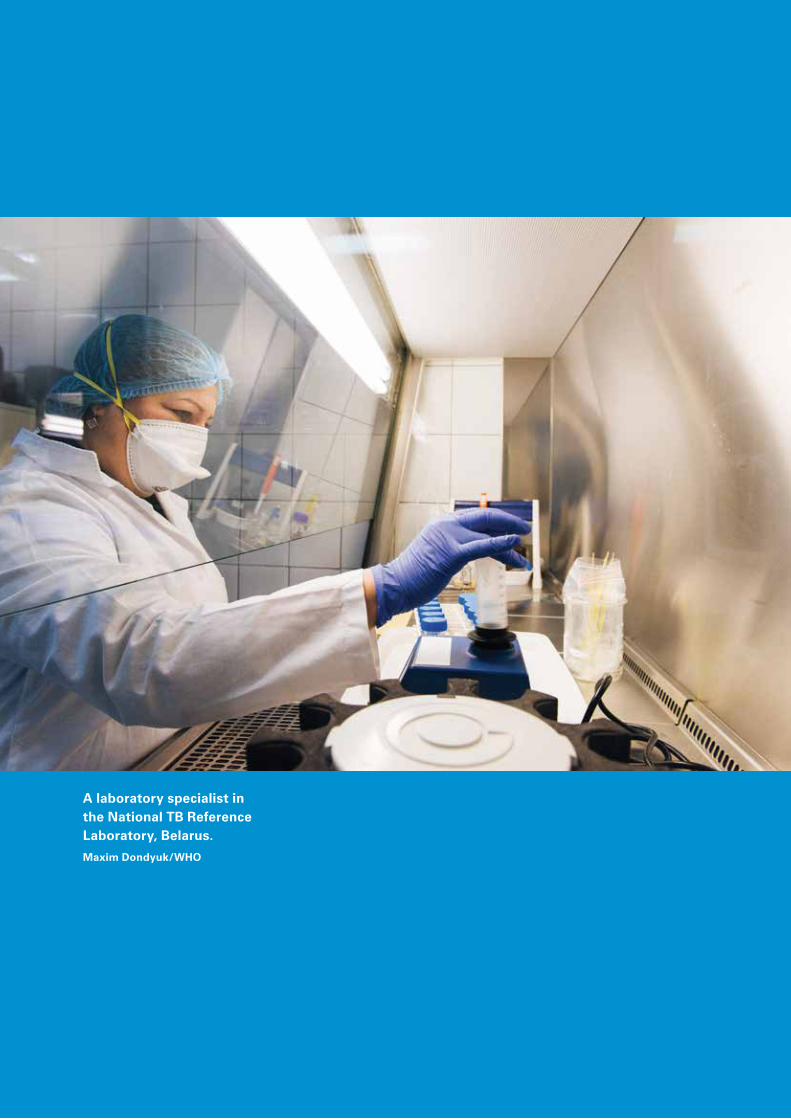
GLOBAL TUBERCULOSIS REPORT 2020 174
A laboratory specialist in the National TB Reference Laboratory, Belarus.Maxim Dondyuk/WHO
175 GLOBAL TUBERCULOSIS REPORT 2020
Chapter 9
TB research and innovation
Key facts and messagesTuberculosis (TB) research and innovation is essential to achieve the global TB targets set in the United Nations (UN) Sustainable Development Goals (SDGs) and the World Health Organization (WHO) End TB Strategy. A major technological breakthrough is required by 2025, so that the rate at which TB incidence falls can be dramatically accelerated compared with historic levels, to an average of 17% per year between 2025 and 2035.
“Intensified research and innovation” is the third pillar of the End TB Strategy; also, Target 3b of the SDGs includes supporting research and development related to vaccines and medicines for “communicable and non-communicable diseases that primarily affect developing countries”.
To end the TB epidemic, the world needs affordable and accessible rapid point-of-care tests for diagnosing TB infection and TB disease, and for detecting drug resistance; shorter, safer and more effective regimens for treating TB infection, drug-susceptible TB and drug-resistant TB; a TB vaccine that is effective before and after exposure, as well as across a range of age groups and geographical settings; and innovative strategies to address broader determinants of TB, such as poverty, undernutrition, HIV infection, smoking and diabetes.
Following a request from Member States at the World Health Assembly in 2018, WHO has developed a global strategy for TB research and innovation. The strategy aims to support countries and relevant stakeholders to translate the commitments to research and
innovation made in the Moscow Declaration of the first global ministerial conference on TB (held in November 2017), and the political declaration of the first UN high-level meeting on TB (held in September 2018) into concrete actions.
One of the objectives of the global strategy is to double the funding for TB research to reach the UN high-level meeting target of US$ 2 billion per year. In 2018, only US$ 906 million was available.
The role of digital technologies in the delivery of TB services (e.g. for remote advice and support) has gained prominence in the context of the COVID-19 pandemic. In 2020, WHO launched an implementation research toolkit to support greater use of digital technologies across the TB continuum of care. To facilitate information sharing and evidence-based decision-making, WHO has also established a compendium for research projects and publications related to TB and COVID-19.
Despite challenges (e.g. mobilization of funding), progress in the research and development pipeline for TB has been made in recent years.
The diagnostic pipeline appears robust in terms of the number of tests, products or methods in development. These include several cartridge-based technologies for the detection of isoniazid and second-line drug resistance; broth micro-dilution methods for drug-susceptibility testing (DST); amplification-based targeted next-generation sequencing (NGS) assays for detecting drug-resistant TB directly from sputum specimens;
a next-generation lateral-flow lipoarabinomannan assay that has significant performance improvements over currently marketed assays (particularly in terms of sensitivity); newer skin tests for TB infection based on recombinant ESAT-6 and CFP-10 antigens derived from Mycobacterium tuberculosis (which have significant performance improvements compared with tuberculin skin tests, particularly in terms of specificity); an expanding pipeline of new interferon gamma release assays (IGRA) to test for TB infection; and computer-aided detection (CAD) software that employs artificial intelligence to help screen for TB and other pathologies on digital chest radiographs.
Currently, 22 drugs for the treatment of drug-susceptible TB, multidrug-resistant TB (MDR-TB) or TB infection are in Phase I, II or III trials. These comprise 13 new compounds, two drugs that have received accelerated regulatory approval, one drug that was recently approved by the United States (US) Food and Drug Administration under the limited population pathway for antibacterial and antifungal drugs, and six repurposed drugs. Various combination regimens with new or repurposed drugs are in Phase II or III trials.
There are 14 vaccine candidates in clinical trials: three in Phase I, nine in Phase II and two in Phase III. They include candidates to prevent TB infection and TB disease, and candidates to help improve the outcomes of treatment for TB disease.
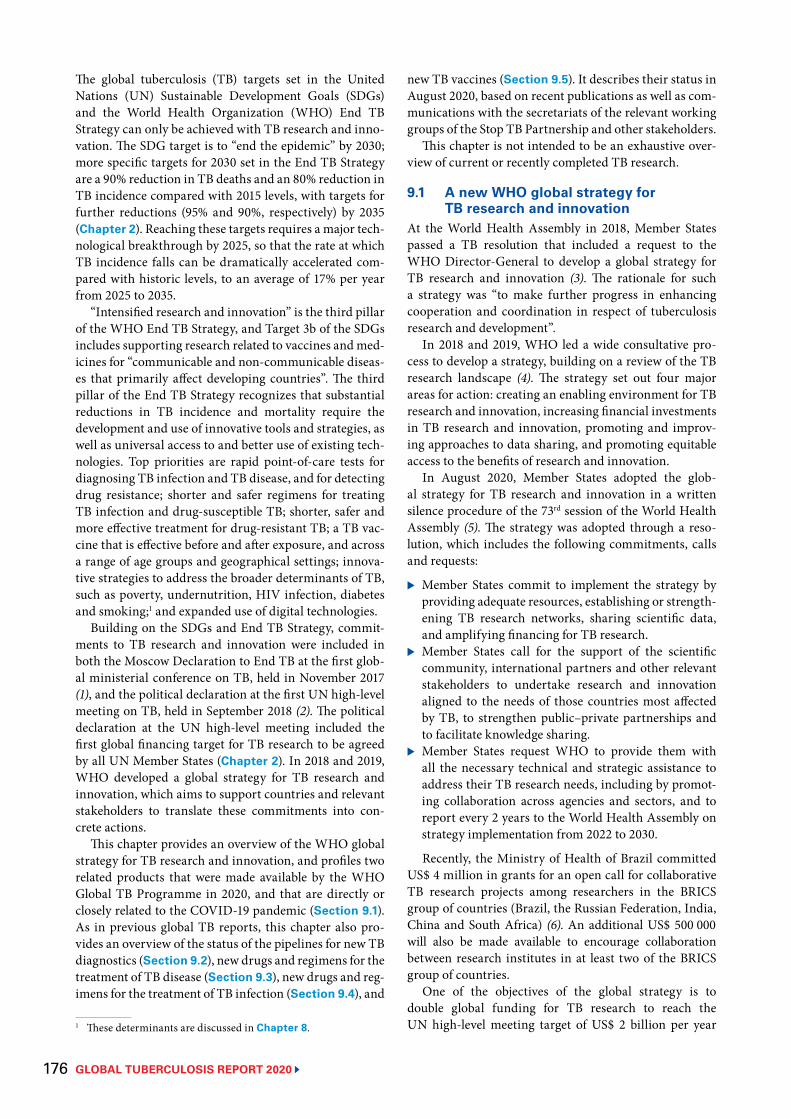
GLOBAL TUBERCULOSIS REPORT 2020 176
The global tuberculosis (TB) targets set in the United Nations (UN) Sustainable Development Goals (SDGs) and the World Health Organization (WHO) End TB Strategy can only be achieved with TB research and inno-vation. The SDG target is to “end the epidemic” by 2030; more specific targets for 2030 set in the End TB Strategy are a 90% reduction in TB deaths and an 80% reduction in TB incidence compared with 2015 levels, with targets for further reductions (95% and 90%, respectively) by 2035 (Chapter 2). Reaching these targets requires a major tech-nological breakthrough by 2025, so that the rate at which TB incidence falls can be dramatically accelerated com-pared with historic levels, to an average of 17% per year from 2025 to 2035.
“Intensified research and innovation” is the third pillar of the WHO End TB Strategy, and Target 3b of the SDGs includes supporting research related to vaccines and med-icines for “communicable and non-communicable diseas-es that primarily affect developing countries”. The third pillar of the End TB Strategy recognizes that substantial reductions in TB incidence and mortality require the development and use of innovative tools and strategies, as well as universal access to and better use of existing tech-nologies. Top priorities are rapid point-of-care tests for diagnosing TB infection and TB disease, and for detecting drug resistance; shorter and safer regimens for treating TB infection and drug-susceptible TB; shorter, safer and more effective treatment for drug-resistant TB; a TB vac-cine that is effective before and after exposure, and across a range of age groups and geographical settings; innova-tive strategies to address the broader determinants of TB, such as poverty, undernutrition, HIV infection, diabetes and smoking;1 and expanded use of digital technologies.
Building on the SDGs and End TB Strategy, commit-ments to TB research and innovation were included in both the Moscow Declaration to End TB at the first glob-al ministerial conference on TB, held in November 2017 (1), and the political declaration at the first UN high-level meeting on TB, held in September 2018 (2). The political declaration at the UN high-level meeting included the first global financing target for TB research to be agreed by all UN Member States (Chapter 2). In 2018 and 2019, WHO developed a global strategy for TB research and innovation, which aims to support countries and relevant stakeholders to translate these commitments into con-crete actions.
This chapter provides an overview of the WHO global strategy for TB research and innovation, and profiles two related products that were made available by the WHO Global TB Programme in 2020, and that are directly or closely related to the COVID-19 pandemic (Section 9.1). As in previous global TB reports, this chapter also pro-vides an overview of the status of the pipelines for new TB diagnostics (Section 9.2), new drugs and regimens for the treatment of TB disease (Section 9.3), new drugs and reg-imens for the treatment of TB infection (Section 9.4), and
1 These determinants are discussed in Chapter 8.
new TB vaccines (Section 9.5). It describes their status in August 2020, based on recent publications as well as com-munications with the secretariats of the relevant working groups of the Stop TB Partnership and other stakeholders.
This chapter is not intended to be an exhaustive over-view of current or recently completed TB research.
9.1 A new WHO global strategy for TB research and innovation
At the World Health Assembly in 2018, Member States passed a TB resolution that included a request to the WHO Director-General to develop a global strategy for TB research and innovation (3). The rationale for such a strategy was “to make further progress in enhancing cooperation and coordination in respect of tuberculosis research and development”.
In 2018 and 2019, WHO led a wide consultative pro-cess to develop a strategy, building on a review of the TB research landscape (4). The strategy set out four major areas for action: creating an enabling environment for TB research and innovation, increasing financial investments in TB research and innovation, promoting and improv-ing approaches to data sharing, and promoting equitable access to the benefits of research and innovation.
In August 2020, Member States adopted the glob-al strategy for TB research and innovation in a written silence procedure of the 73rd session of the World Health Assembly (5). The strategy was adopted through a reso-lution, which includes the following commitments, calls and requests:
▶ Member States commit to implement the strategy byproviding adequate resources, establishing or strength-ening TB research networks, sharing scientific data,and amplifying financing for TB research.
▶ Member States call for the support of the scientificcommunity, international partners and other relevantstakeholders to undertake research and innovationaligned to the needs of those countries most affectedby TB, to strengthen public–private partnerships andto facilitate knowledge sharing.
▶ Member States request WHO to provide them withall the necessary technical and strategic assistance toaddress their TB research needs, including by promot-ing collaboration across agencies and sectors, and toreport every 2 years to the World Health Assembly onstrategy implementation from 2022 to 2030.
Recently, the Ministry of Health of Brazil committedUS$ 4 million in grants for an open call for collaborative TB research projects among researchers in the BRICS group of countries (Brazil, the Russian Federation, India, China and South Africa) (6). An additional US$ 500 000 will also be made available to encourage collaboration between research institutes in at least two of the BRICS group of countries.
One of the objectives of the global strategy is to double global funding for TB research to reach the UN high-level meeting target of US$ 2 billion per year
BOX 9.1
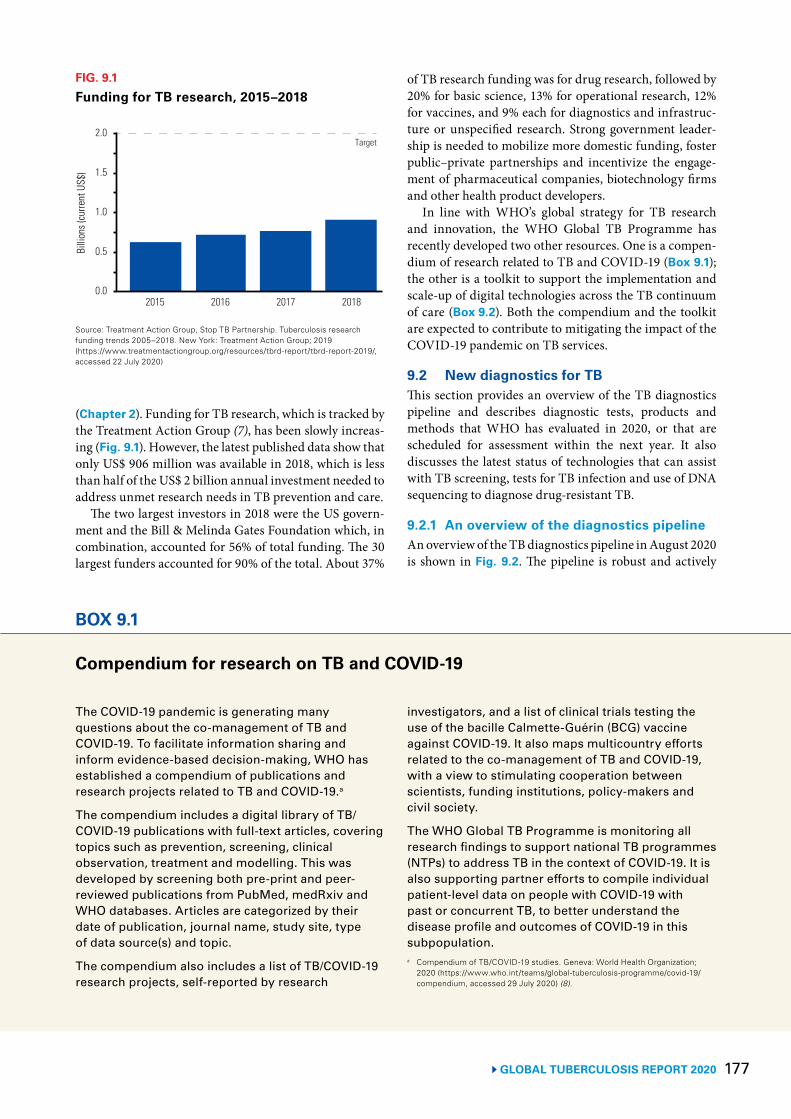
177 GLOBAL TUBERCULOSIS REPORT 2020
(Chapter 2). Funding for TB research, which is tracked by the Treatment Action Group (7), has been slowly increas-ing (Fig. 9.1). However, the latest published data show that only US$ 906 million was available in 2018, which is less than half of the US$ 2 billion annual investment needed to address unmet research needs in TB prevention and care.
The two largest investors in 2018 were the US govern-ment and the Bill & Melinda Gates Foundation which, in combination, accounted for 56% of total funding. The 30 largest funders accounted for 90% of the total. About 37%
of TB research funding was for drug research, followed by 20% for basic science, 13% for operational research, 12% for vaccines, and 9% each for diagnostics and infrastruc-ture or unspecified research. Strong government leader-ship is needed to mobilize more domestic funding, foster public–private partnerships and incentivize the engage-ment of pharmaceutical companies, biotechnology firms and other health product developers.
In line with WHO’s global strategy for TB research and innovation, the WHO Global TB Programme has recently developed two other resources. One is a compen-dium of research related to TB and COVID-19 (Box 9.1); the other is a toolkit to support the implementation and scale-up of digital technologies across the TB continuum of care (Box 9.2). Both the compendium and the toolkit are expected to contribute to mitigating the impact of the COVID-19 pandemic on TB services.
9.2 New diagnostics for TBThis section provides an overview of the TB diagnostics pipeline and describes diagnostic tests, products and methods that WHO has evaluated in 2020, or that are scheduled for assessment within the next year. It also discusses the latest status of technologies that can assist with TB screening, tests for TB infection and use of DNA sequencing to diagnose drug-resistant TB.
9.2.1 An overview of the diagnostics pipelineAn overview of the TB diagnostics pipeline in August 2020 is shown in Fig. 9.2. The pipeline is robust and actively
FIG. 9.1
Funding for TB research, 2015–2018Bi
llion
s (cu
rrent
US$
)
2015 2016 2017 2018
1.0
0.5
0.0
2.0
1.5
Target
Source: Treatment Action Group, Stop TB Partnership. Tuberculosis research funding trends 2005–2018. New York: Treatment Action Group; 2019 (https://www.treatmentactiongroup.org/resources/tbrd-report/tbrd-report-2019/, accessed 22 July 2020)
BOX 9.1
Compendium for research on TB and COVID-19
The COVID-19 pandemic is generating many questions about the co-management of TB and COVID-19. To facilitate information sharing and inform evidence-based decision-making, WHO has established a compendium of publications and research projects related to TB and COVID-19.a
The compendium includes a digital library of TB/COVID-19 publications with full-text articles, covering topics such as prevention, screening, clinical observation, treatment and modelling. This was developed by screening both pre-print and peer-reviewed publications from PubMed, medRxiv and WHO databases. Articles are categorized by their date of publication, journal name, study site, type of data source(s) and topic.
The compendium also includes a list of TB/COVID-19 research projects, self-reported by research
investigators, and a list of clinical trials testing the use of the bacille Calmette-Guérin (BCG) vaccine against COVID-19. It also maps multicountry efforts related to the co-management of TB and COVID-19, with a view to stimulating cooperation between scientists, funding institutions, policy-makers and civil society.
The WHO Global TB Programme is monitoring all research findings to support national TB programmes (NTPs) to address TB in the context of COVID-19. It is also supporting partner efforts to compile individual patient-level data on people with COVID-19 with past or concurrent TB, to better understand the disease profile and outcomes of COVID-19 in this subpopulation. a Compendium of TB/COVID-19 studies. Geneva: World Health Organization;
2020 (https://www.who.int/teams/global-tuberculosis-programme/covid-19/compendium, accessed 29 July 2020) (8).
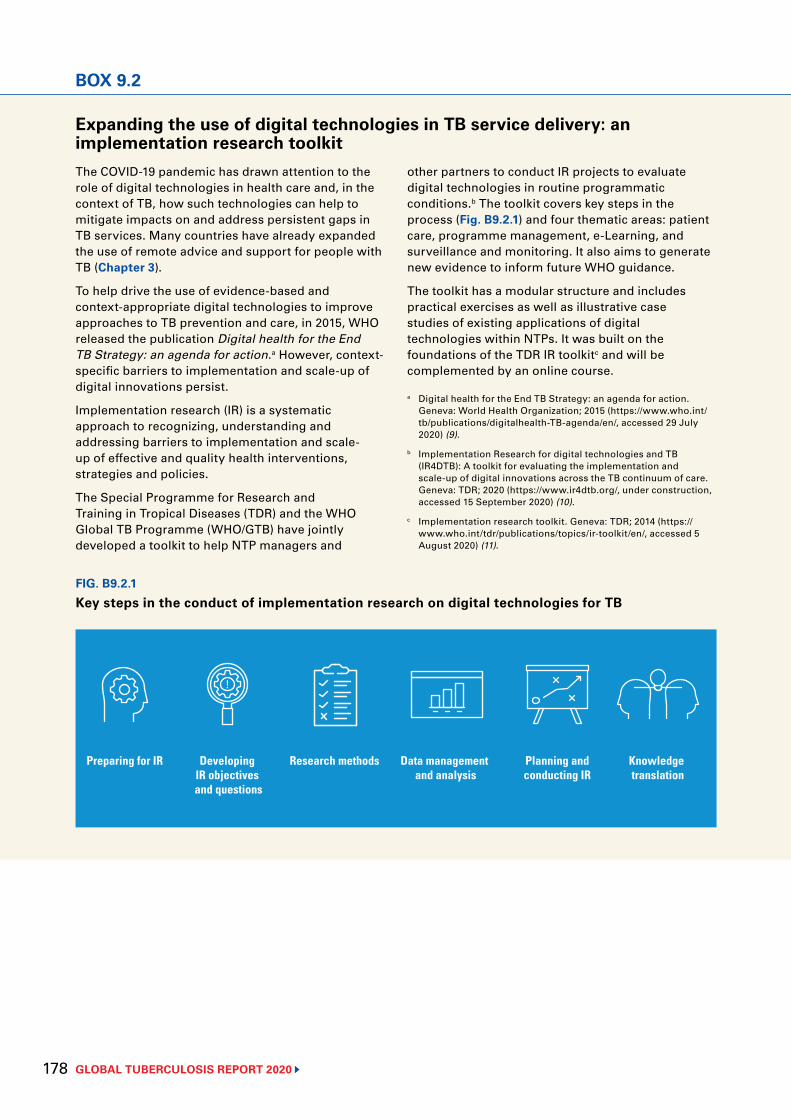
GLOBAL TUBERCULOSIS REPORT 2020 178
BOX 9.2
Expanding the use of digital technologies in TB service delivery: an implementation research toolkit The COVID-19 pandemic has drawn attention to the role of digital technologies in health care and, in the context of TB, how such technologies can help to mitigate impacts on and address persistent gaps in TB services. Many countries have already expanded the use of remote advice and support for people with TB (Chapter 3).
To help drive the use of evidence-based and context-appropriate digital technologies to improve approaches to TB prevention and care, in 2015, WHO released the publication Digital health for the End TB Strategy: an agenda for action.a However, context-specific barriers to implementation and scale-up of digital innovations persist.
Implementation research (IR) is a systematic approach to recognizing, understanding and addressing barriers to implementation and scale-up of effective and quality health interventions, strategies and policies.
The Special Programme for Research and Training in Tropical Diseases (TDR) and the WHO Global TB Programme (WHO/GTB) have jointly developed a toolkit to help NTP managers and
other partners to conduct IR projects to evaluate digital technologies in routine programmatic conditions.b The toolkit covers key steps in the process (Fig. B9.2.1) and four thematic areas: patient care, programme management, e-Learning, and surveillance and monitoring. It also aims to generate new evidence to inform future WHO guidance.
The toolkit has a modular structure and includes practical exercises as well as illustrative case studies of existing applications of digital technologies within NTPs. It was built on the foundations of the TDR IR toolkitc and will be complemented by an online course.
a Digital health for the End TB Strategy: an agenda for action. Geneva: World Health Organization; 2015 (https://www.who.int/tb/publications/digitalhealth-TB-agenda/en/, accessed 29 July 2020) (9).
b Implementation Research for digital technologies and TB (IR4DTB): A toolkit for evaluating the implementation and scale-up of digital innovations across the TB continuum of care. Geneva: TDR; 2020 (https://www.ir4dtb.org/, under construction, accessed 15 September 2020) (10).
c Implementation research toolkit. Geneva: TDR; 2014 (https://www.who.int/tdr/publications/topics/ir-toolkit/en/, accessed 5 August 2020) (11).
FIG. B9.2.1
Key steps in the conduct of implementation research on digital technologies for TB
Preparing for IR Developing IR objectives and questions
Research methods Data management and analysis
Planning and conducting IR
Knowledge translation
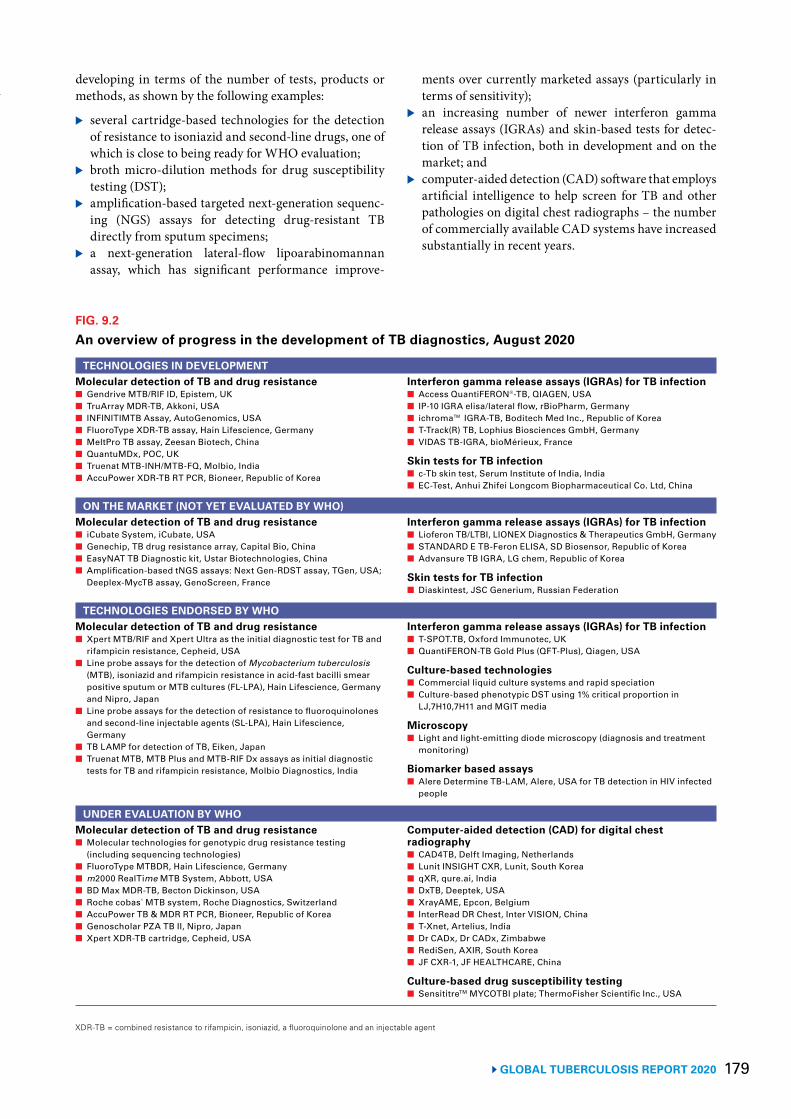
179 GLOBAL TUBERCULOSIS REPORT 2020
developing in terms of the number of tests, products or methods, as shown by the following examples:
▶ several cartridge-based technologies for the detection of resistance to isoniazid and second-line drugs, one of which is close to being ready for WHO evaluation;
▶ broth micro-dilution methods for drug susceptibility testing (DST);
▶ amplification-based targeted next-generation sequenc-ing (NGS) assays for detecting drug-resistant TB directly from sputum specimens;
▶ a next-generation lateral-flow lipoarabinomannan assay, which has significant performance improve-
ments over currently marketed assays (particularly in terms of sensitivity);
▶ an increasing number of newer interferon gamma release assays (IGRAs) and skin-based tests for detec-tion of TB infection, both in development and on the market; and
▶ computer-aided detection (CAD) software that employs artificial intelligence to help screen for TB and other pathologies on digital chest radiographs – the number of commercially available CAD systems have increased substantially in recent years.
BOX 9.2
FIG. 9.2
An overview of progress in the development of TB diagnostics, August 2020
TECHNOLOGIES IN DEVELOPMENTMolecular detection of TB and drug resistance■ Gendrive MTB/RIF ID, Epistem, UK■ TruArray MDR-TB, Akkoni, USA■ INFINITIMTB Assay, AutoGenomics, USA■ FluoroType XDR-TB assay, Hain Lifescience, Germany■ MeltPro TB assay, Zeesan Biotech, China■ QuantuMDx, POC, UK■ Truenat MTB-INH/MTB-FQ, Molbio, India ■ AccuPower XDR-TB RT PCR, Bioneer, Republic of Korea
Interferon gamma release assays (IGRAs) for TB infection■ Access QuantiFERON®-TB, QIAGEN, USA■ IP-10 IGRA elisa/lateral flow, rBioPharm, Germany■ ichroma™ IGRA-TB, Boditech Med Inc., Republic of Korea■ T-Track(R) TB, Lophius Biosciences GmbH, Germany■ VIDAS TB-IGRA, bioMérieux, France
Skin tests for TB infection■ c-Tb skin test, Serum Institute of India, India■ EC-Test, Anhui Zhifei Longcom Biopharmaceutical Co. Ltd, China
ON THE MARKET (NOT YET EVALUATED BY WHO)Molecular detection of TB and drug resistance■ iCubate System, iCubate, USA ■ Genechip, TB drug resistance array, Capital Bio, China■ EasyNAT TB Diagnostic kit, Ustar Biotechnologies, China■ Amplification-based tNGS assays: Next Gen-RDST assay, TGen, USA;
Deeplex-MycTB assay, GenoScreen, France
Interferon gamma release assays (IGRAs) for TB infection■ Lioferon TB/LTBI, LIONEX Diagnostics & Therapeutics GmbH, Germany■ STANDARD E TB-Feron ELISA, SD Biosensor, Republic of Korea■ Advansure TB IGRA, LG chem, Republic of Korea
Skin tests for TB infection■ Diaskintest, JSC Generium, Russian Federation
TECHNOLOGIES ENDORSED BY WHO Molecular detection of TB and drug resistance ■ Xpert MTB/RIF and Xpert Ultra as the initial diagnostic test for TB and
rifampicin resistance, Cepheid, USA■ Line probe assays for the detection of Mycobacterium tuberculosis
(MTB), isoniazid and rifampicin resistance in acid-fast bacilli smear positive sputum or MTB cultures (FL-LPA), Hain Lifescience, Germany and Nipro, Japan
■ Line probe assays for the detection of resistance to fluoroquinolones and second-line injectable agents (SL-LPA), Hain Lifescience, Germany
■ TB LAMP for detection of TB, Eiken, Japan■ Truenat MTB, MTB Plus and MTB-RIF Dx assays as initial diagnostic
tests for TB and rifampicin resistance, Molbio Diagnostics, India
Interferon gamma release assays (IGRAs) for TB infection■ T-SPOT.TB, Oxford Immunotec, UK■ QuantiFERON-TB Gold Plus (QFT-Plus), Qiagen, USA
Culture-based technologies■ Commercial liquid culture systems and rapid speciation■ Culture-based phenotypic DST using 1% critical proportion in
LJ,7H10,7H11 and MGIT media
Microscopy■ Light and light-emitting diode microscopy (diagnosis and treatment
monitoring)
Biomarker based assays■ Alere Determine TB-LAM, Alere, USA for TB detection in HIV infected
people
UNDER EVALUATION BY WHOMolecular detection of TB and drug resistance■ Molecular technologies for genotypic drug resistance testing
(including sequencing technologies)■ FluoroType MTBDR, Hain Lifescience, Germany■ m2000 RealTime MTB System, Abbott, USA■ BD Max MDR-TB, Becton Dickinson, USA■ Roche cobas® MTB system, Roche Diagnostics, Switzerland■ AccuPower TB & MDR RT PCR, Bioneer, Republic of Korea ■ Genoscholar PZA TB II, Nipro, Japan■ Xpert XDR-TB cartridge, Cepheid, USA
Computer-aided detection (CAD) for digital chest radiography■ CAD4TB, Delft Imaging, Netherlands ■ Lunit INSIGHT CXR, Lunit, South Korea■ qXR, qure.ai, India■ DxTB, Deeptek, USA ■ XrayAME, Epcon, Belgium ■ InterRead DR Chest, Inter VISION, China■ T-Xnet, Artelius, India■ Dr CADx, Dr CADx, Zimbabwe ■ RediSen, AXIR, South Korea ■ JF CXR-1, JF HEALTHCARE, China
Culture-based drug susceptibility testing■ SensititreTM MYCOTBI plate; ThermoFisher Scientific Inc., USA
XDR-TB = combined resistance to rifampicin, isoniazid, a fluoroquinolone and an injectable agent
GLOBAL TUBERCULOSIS REPORT 2020 180
Some of the marketed nucleic-acid amplification tests (NAATs) have battery options (e.g. GeneXpert Edge® and Truenat®) to enable their use in decentralized settings. Nonetheless, there is still a significant gap in the devel-opment of diagnostics suitable for use at the point of care. There is an urgent need for new technologies to minimize barriers to a timely diagnosis for people with TB, ensure quality testing for difficult-to-diagnose groups, expand the spectrum of DST, and reduce the costs of diagnostic platforms and their maintenance.
9.2.2 TB diagnostic tests, products and methods evaluated by WHO in 2020 or scheduled for evaluation within the next year
Molecular assays intended as initial tests for the diagnosis of pulmonary and extrapulmonary TB and rifampicin resistance in adults and childrenThe development of the Xpert® MTB/RIF assay (Cepheid, Sunnyvale, USA), which was endorsed by WHO in 2010, was a major step forward in improving the diagnosis of TB and rifampicin-resistant TB (RR-TB) globally. Compared with the reference standard of culture, however, it still had suboptimal sensitivity (particularly among people with smear-negative TB and people living with HIV) and specificity. In 2017, WHO evaluated and recommended a next-generation assay with improved sensitivity, Xpert® MTB/RIF Ultra (hereafter referred to as “Xpert Ultra”). This assay uses the same GeneXpert® platform as Xpert MTB/RIF.
New molecular assays called Truenat® MTB, MTB Plus and MTB-RIF Dx (Molbio Diagnostics, Goa, India, here-after referred to as “Truenat”) were developed in India, and may potentially be used at the same level of the health system as Xpert MTB/RIF and Xpert Ultra. The MTB and MTB Plus assays are initial diagnostic tests for TB, where-as the MTB-RIF Dx assay is a test for rifampicin resist-ance among those with positive results on the initial tests.
In December 2019, WHO convened a guideline devel-opment group (GDG) to review evidence about the use of Xpert MTB/RIF, Xpert Ultra and Truenat. The key recom-mendations agreed upon are as follows:
▶ Xpert MTB/RIF, Xpert Ultra and two Truenat assays (MTB and MTB Plus) are recommended as initial tests to diagnose pulmonary TB and to detect rifampicin resistance;
▶ Xpert MTB/RIF and Xpert Ultra are recommended to improve the diagnosis of TB and rifampicin resistance in children, using sputum, stool, nasopharyngeal and gastric specimens; and
▶ Xpert MTB/RIF and Xpert Ultra are recommended to improve the diagnosis of TB and rifampicin resistance in patients with various forms of extrapulmonary TB.
These recommendations have been published as part of WHO’s consolidated guidelines for TB that were released in June 2020 (12).
Other rapid tests and platforms for the detection of TB disease and drug resistance Progress is being made with the Cepheid close-to-care platform, GeneXpert® Omni® (Omni). This platform is undergoing field evaluation to assess bioequivalence with the GeneXpert instrument. If equivalence is demon-strated, it will initially be available for testing for TB and RR-TB using the next-generation Xpert Ultra cartridge.1
The Omni is expected to complement existing multi-module GeneXpert instruments, including the GeneXpert Edge® (Edge) – a single-module GeneXpert instrument con-nected to a tablet device for transfer of data, whose specific features include an auxiliary battery that allows for opera-tion in decentralized settings, at the same level as microsco-py. Both tests, the Omni and the Edge, have been developed to facilitate wider access to rapid molecular testing for TB and rifampicin resistance, and virology parameters for HIV and hepatitis C virus. WHO will evaluate the Omni once sufficient data are available for policy formulation.
Centralized high-throughput testing platformsIn July 2019, WHO convened a technical group to assess the performance of four centralized testing platforms based on polymerase chain reaction, suitable for high-through-put laboratories. The platforms reviewed were the RealTime MTB assay (Abbott), the Roche Cobas MTB assay (Roche), the FluoroType MTBDR assay (Hain Lifes-cience) and the BD Max MDR-TB assay (Becton Dickin-son). The evidence available for this first evaluation phase was limited.
WHO plans to convene a GDG to undertake a second evaluation of centralized testing platforms in December 2020. WHO issued a public call for data in June 2020 and has commissioned systematic reviews of the evidence about the diagnostic accuracy of several centralized high-throughput testing platforms.
Cartridge-based technology for isoniazid and second-line drug resistance detection Cepheid has developed the Xpert MTB/XDR assay to detect resistance to isoniazid as well as second-line drugs (fluoroquinolones and amikacin). The Foundation for Innovative New Diagnostics (FIND) is conducting a large-scale, multicentre clinical trial to evaluate its diag-nostic accuracy when used as a follow-on test to a positive Xpert MTB/RIF or Xpert MTB/RIF Ultra result. Similar products from Molbio and Bioneer are at earlier stages of development. The evidence will be reviewed by a GDG convened by WHO in December 2020.
1 The Omni platform requires cartridges with near-field commu-nication chips; hence, it will not be compatible with the current Xpert MTB/RIF and Ultra cartridges.
181 GLOBAL TUBERCULOSIS REPORT 2020
Hybridization-based technology for pyrazinamide resistance detectionNipro (Osaka, Japan) has developed and marketed a hybridization-based technology (Genoscholar PZA TB II) for the detection of resistance to pyrazinamide. WHO, FIND and the Supranational Reference Laboratory net-work are conducting multicentre validation studies to measure the test’s diagnostic accuracy and reproducibil-ity. The evidence will be reviewed by a GDG convened by WHO in December 2020.
Microbroth dilution method for DST The development of a microbroth dilution plate is a promising option for reducing the cost of phe-notypic DST (pDST) for drug-resistant strains of Mycobacterium tuberculosis complex (MTBC), through which a large number of drugs can be tested simultane-ously to individualize patient treatment. The Sensititre MYCOTBI M. tuberculosis MIC [minimum inhibitory concentration] Plate by Thermo Fisher (Waltham, USA) does not meet current clinical needs, owing to an outdat-ed selection of drugs; also, the concentrations tested for some drugs do not span the full range required for quality control, and the test’s performance has never been evalu-ated systematically.
WHO convened a technical expert group in February 2020, which reached agreement on the optimal choice of drugs to meet short- and medium-term clinical priori-ties, and on the choice of drug concentrations and their arrangement on the plate to meet clinical needs. The tech-nical report from the meeting is expected towards the end of 2020.
Critical concentrations of anti-TB medicines used for DST Culture-based pDST methods are currently the reference standard for detection of drug resistance. They use criti-cal concentrations (CCs) of anti-TB agents to distinguish between susceptibility and resistance.
The CC is defined as the lowest concentration of an anti-TB agent in vitro that will inhibit the growth of 99% of phenotypically wild-type strains of MTBC. The clinical breakpoint (CB) is the concentration or concentrations that distinguish a likely response to treatment from an unlikely one.
WHO commissioned FIND to perform a systemat-ic review of available MIC data for both phenotypically wild-type and non-wild-type strains, including associ-ated sequencing data for relevant resistance genes. The medicines included in the review were isoniazid and rifa-mycins (rifampicin, rifabutin and rifapentine), and the media considered were Löwenstein Jensen, Middlebrook 7H10/7H11 and BACTEC™ Mycobacterial Growth Indi-cator Tube™ 960.
WHO convened a technical expert group in February 2020 to review the results from the FIND evaluation. The outcome was that the CC for rifampicin pDST was updat-ed, whereas the CC for isoniazid was retained. The tech-nical report from the meeting is expected towards the end of 2020.
9.2.3 TB screening testsSystematic screening for TB is one of the interventions that can enable progress towards the global target of treat-ing 40 million people for TB disease between 2018 and 2022, which was set at the UN high-level meeting on TB in 2018 (Chapter 2). In 2020, WHO convened a GDG to update its 2013 guidance on systematic screening for TB. Updated recommendations will provide guidance on the implementation of screening activities, including the use of screening tools and algorithms; this is scheduled for finalization and publication in early 2021.
CAD softwareChest radiography or chest X-ray (CXR) is an important tool for TB triaging and screening; it is also a useful aid in TB diagnosis. A major limitation of CXR is that it requires experienced interpreters (usually radiologists or trained technicians) to interpret the images. The accura-cy of TB screening when reading CXRs varies markedly, even among specialists. In many countries, few experi-enced CXR readers are available. The last WHO guid-ance on CXR was issued in 2016 (13).
In recent years, several CAD software products have been developed to interpret digital chest radiographs for abnormalities suggestive of TB or other diseases. These CAD systems incorporate machine-learning algorithms that analyse a CXR image and produce a standardized interpretation of the image. A score or report is generated that estimates the likelihood that the CXR image is con-sistent with TB. CAD systems are trained on thousands of images, using machine-learning techniques.
The GDG on TB screening convened in 2020 reviewed data on the use of CAD software products for TB screen-ing and triage. Recommendations are scheduled for pub-lication in early 2021.
FIND and the Stop TB Partnership have collated infor-mation on CAD products for TB detection, to summarize what is available on the market and allow for comparisons of the products.1
9.2.4 Tests for TB infection There are currently two methods to test for TB infection: skin tests – including tuberculin skin tests (TSTs) – and IGRAs. Both methods depend on cell-mediated immunity (memory T-cell response), but neither test can accurately distinguish between TB infection and active TB disease.
1 See https://www.ai4hlth.org/.
GLOBAL TUBERCULOSIS REPORT 2020 182
Skin testsThe TST is commonly performed using the Mantoux tech-nique, which consists of intradermal placement of two tuberculin units (TU) of RT-23 or five TU of purified pro-tein derivative S (PPD-S); the result is reported as milli-metres of induration in the transverse diameter. However, the PPD-S TST has relatively low specificity, lacks sensi-tivity in immunosuppressed individuals (e.g. people living with HIV) and requires two clinic visits (one to administer the test and one to read the result). A further challenge is that failure to attend the clinic for evaluation of test results within 48–72 hours renders the results invalid.
Newer skin tests for infection are emerging. These aim to maximize the advantages of current implementation platforms, and they have the potential to improve uptake of diagnosis and treatment for TB infection.
A new commercial skin test that is on the market is Diaskintest (Generium). Another test, C-Tb (Serum Insti-tute of India), is planned for market entry in 2020 or 2021, and a third, EC-Test (Anhui Zhifei Longcom Biopharma-ceutical Co., Ltd), is in the late stages of development. All three tests contain recombinant ESAT-6 (dimer) and CFP-10 (monomer) antigens derived from M. tuberculosis, and may perform better than TST (particularly with respect to specificity). They may also provide accurate, acceptable and cheaper alternatives to existing IGRA tests. Compared with IGRAs, emerging evidence suggests that these new skin tests may have similar specificity and provide compa-rable results in children and people living with HIV.
IGRAs There are two approaches to IGRAs: the enzyme-linked immunosorbent assay (ELISA)-based method and the enzyme-linked immunosorbent spot (ELISPOT) assay. The ELISA is a whole-blood test that uses peptides from the RD1 antigens ESAT-6 and CFP-10, and peptides from one additional antigen that is not an RD1 antigen, in an in-tube format. The result is reported as a quantification of interferon gamma (IFN-gamma) in international units (IU) per millilitre.
The ELISPOT assay is performed on separated and counted peripheral blood mononuclear cells that are incubated with ESAT-6 and CFP-10 peptides. The result is reported as the number of IFN-gamma-producing T cells (spot-forming cells). In contrast to the TST, IGRAs are not affected by bacille Calmette-Guérin (BCG) vaccination status; thus, they are useful for the evaluation of TB infec-tion in BCG-vaccinated individuals, particularly in coun-tries where BCG vaccination is administered after infancy or repeated vaccinations are given (Chapter 6). Howev-er, the IGRA platforms are more expensive to run, have specific time and temperature requirements for transport, and require specialized kits, a qualified technician and an accredited laboratory.
The pipeline for IGRAs is rich, with five products in development: T-Track(R) TB (Lophius Bioscienc-es GmbH), VIDAS TB-IGRA (bioMérieux), Access
QuantiFERON®-TB (Boditech Med Inc.), ichroma™ IGRA-TB (Boditech Med Inc.) and IP-10 IGRA elisa/lateral flow (rBioPharm). In addition, five products are already on the market: STANDARD E TB-Feron ELISA/STANDARD and F TB-Feron FIA (IFN-gamma) (both SD Biosensor), LIOFERON TB/LTBI (LIONEX Diagnostics & Thera-peutics GmbH), and Advansure TB IGRA and Avansure i3 TB-IGRA (both LG Chem).
9.2.5 DNA-sequencing technologies for diagnosis of drug-resistant TB
Conventionally, the diagnosis of drug resistance in M. tuberculosis strains has relied heavily upon culture and DST in liquid or solid media in TB containment lab-oratories. However, phenotypic results are only obtained after weeks to months of incubation, and it is a challenge to establish the stringent laboratory biosafety conditions required for these culture-based methods. Because drug resistance in the MTBC is mainly conferred through point mutations in specific gene targets in the bacterial genome, molecular tests are increasingly being used to allow more rapid testing and thus earlier initiation of appropriate treatment for drug-resistant TB.
Compared with the rapid molecular tests currently available, DNA sequencing can provide detailed infor-mation on resistance across multiple gene regions. Amplification-based targeted NGS assays for detecting drug-resistant TB directly from sputum specimens are in the pipeline. The Next Gen-RDST assay (Translation-al Genomics Research Institute, Phoenix, Arizona, USA) can detect mutations associated with resistance to at least seven drugs, and the Deeplex®-MycTB assay (GenoScreen, Lille, France) can detect mutations in gene regions associ-ated with resistance to at least 13 drugs. WHO has not yet reviewed or approved these assays.
Recognizing the added value offered by NGS, WHO supports the work of FIND for the development and vali-dation of novel molecular diagnostic tools.
9.3 New drugs and drug regimens to treat TB disease
Current treatment regimens for TB disease require com-binations of multiple drugs, ranging from a duration of 6 months for drug-susceptible TB to typically 6–20 months for multidrug-resistant TB (MDR-TB) or RR-TB (i.e. MDR/RR-TB),1 but possibly longer if there is additional drug resistance, or if clinical and laboratory outcomes at the end of treatment are unsatisfactory. Globally, the latest available data (published in this report) show a treatment success rate of 85% for drug-susceptible TB and 57% for MDR/RR-TB.
The main challenges in treatment of TB disease are the duration and complexity of drug regimens, both of which affect adherence; toxicity, especially of second-line drugs used to treat drug-resistant TB; and the limited availabil-
1 MDR-TB is defined as resistance to at least isoniazid and rifampicin.
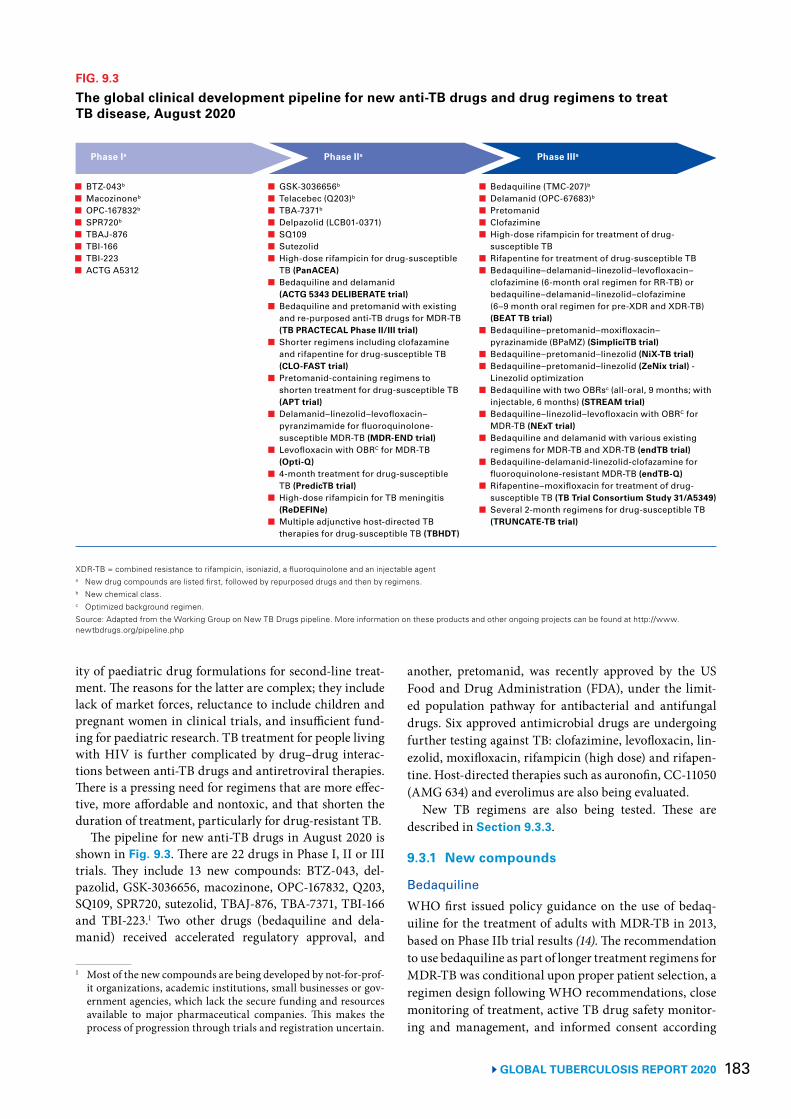
183 GLOBAL TUBERCULOSIS REPORT 2020
ity of paediatric drug formulations for second-line treat-ment. The reasons for the latter are complex; they include lack of market forces, reluctance to include children and pregnant women in clinical trials, and insufficient fund-ing for paediatric research. TB treatment for people living with HIV is further complicated by drug–drug interac-tions between anti-TB drugs and antiretroviral therapies. There is a pressing need for regimens that are more effec-tive, more affordable and nontoxic, and that shorten the duration of treatment, particularly for drug-resistant TB.
The pipeline for new anti-TB drugs in August 2020 is shown in Fig. 9.3. There are 22 drugs in Phase I, II or III trials. They include 13 new compounds: BTZ-043, del-pazolid, GSK-3036656, macozinone, OPC-167832, Q203, SQ109, SPR720, sutezolid, TBAJ-876, TBA-7371, TBI-166 and TBI-223.1 Two other drugs (bedaquiline and dela-manid) received accelerated regulatory approval, and
1 Most of the new compounds are being developed by not-for-prof-it organizations, academic institutions, small businesses or gov-ernment agencies, which lack the secure funding and resources available to major pharmaceutical companies. This makes the process of progression through trials and registration uncertain.
another, pretomanid, was recently approved by the US Food and Drug Administration (FDA), under the limit-ed population pathway for antibacterial and antifungal drugs. Six approved antimicrobial drugs are undergoing further testing against TB: clofazimine, levofloxacin, lin-ezolid, moxifloxacin, rifampicin (high dose) and rifapen-tine. Host-directed therapies such as auronofin, CC-11050 (AMG 634) and everolimus are also being evaluated.
New TB regimens are also being tested. These are described in Section 9.3.3.
9.3.1 New compounds
Bedaquiline
WHO first issued policy guidance on the use of bedaq-uiline for the treatment of adults with MDR-TB in 2013, based on Phase IIb trial results (14). The recommendation to use bedaquiline as part of longer treatment regimens for MDR-TB was conditional upon proper patient selection, a regimen design following WHO recommendations, close monitoring of treatment, active TB drug safety monitor-ing and management, and informed consent according
FIG. 9.3
The global clinical development pipeline for new anti-TB drugs and drug regimens to treat TB disease, August 2020
Phase Ia Phase IIa Phase IIIa
■ BTZ-043b
■ Macozinoneb
■ OPC-167832b
■ SPR720b
■ TBAJ-876■ TBI-166 ■ TBI-223■ ACTG A5312
■ GSK-3036656b
■ Telacebec (Q203)b
■ TBA-7371b
■ Delpazolid (LCB01-0371)■ SQ109 ■ Sutezolid■ High-dose rifampicin for drug-susceptible
TB (PanACEA)■ Bedaquiline and delamanid
(ACTG 5343 DELIBERATE trial)■ Bedaquiline and pretomanid with existing
and re-purposed anti-TB drugs for MDR-TB (TB PRACTECAL Phase II/III trial)
■ Shorter regimens including clofazamine and rifapentine for drug-susceptible TB (CLO-FAST trial)
■ Pretomanid-containing regimens to shorten treatment for drug-susceptible TB (APT trial)
■ Delamanid–linezolid–levofloxacin–pyranzimamide for fluoroquinolone-susceptible MDR-TB (MDR-END trial)
■ Levofloxacin with OBRC for MDR-TB (Opti-Q)
■ 4-month treatment for drug-susceptible TB (PredicTB trial)
■ High-dose rifampicin for TB meningitis (ReDEFINe)
■ Multiple adjunctive host-directed TB therapies for drug-susceptible TB (TBHDT)
■ Bedaquiline (TMC-207)b
■ Delamanid (OPC-67683)b
■ Pretomanid ■ Clofazimine■ High-dose rifampicin for treatment of drug-
susceptible TB■ Rifapentine for treatment of drug-susceptible TB■ Bedaquiline –delamanid–linezolid–levofloxacin–
clofazimine (6-month oral regimen for RR-TB) or bedaquiline–delamanid–linezolid–clofazimine (6–9 month oral regimen for pre-XDR and XDR-TB) (BEAT TB trial)
■ Bedaquiline–pretomanid–moxifloxacin–pyrazinamide (BPaMZ) (SimpliciTB trial)
■ Bedaquiline–pretomanid–linezolid (NiX-TB trial)■ Bedaquiline–pretomanid–linezolid (ZeNix trial) -
Linezolid optimization■ Bedaquiline with two OBRsc (all-oral, 9 months; with
injectable, 6 months) (STREAM trial)■ Bedaquiline–linezolid–levofloxacin with OBRC for
MDR-TB (NExT trial)■ Bedaquiline and delamanid with various existing
regimens for MDR-TB and XDR-TB (endTB trial)■ Bedaquiline-delamanid-linezolid-clofazamine for
fluoroquinolone-resistant MDR-TB (endTB-Q)■ Rifapentine–moxifloxacin for treatment of drug-
susceptible TB (TB Trial Consortium Study 31/A5349)■ Several 2-month regimens for drug-susceptible TB
(TRUNCATE-TB trial)
XDR-TB = combined resistance to rifampicin, isoniazid, a fluoroquinolone and an injectable agent a New drug compounds are listed first, followed by repurposed drugs and then by regimens. b New chemical class. c Optimized background regimen. Source: Adapted from the Working Group on New TB Drugs pipeline. More information on these products and other ongoing projects can be found at http://www.newtbdrugs.org/pipeline.php
GLOBAL TUBERCULOSIS REPORT 2020 184
to local requirements. The recommendation was main-tained, following a review of data from observational studies in 2016 (15). In 2018 and 2019, additional data for patients treated with bedaquiline-containing regimens were analysed as part of an update to WHO consolidated guidance on TB (drug-resistant TB treatment); bedaqui-line was recommended as one of the priority medicines (group A) to design all-oral longer regimens of 9–12 months to treat MDR/RR-TB (16). A 6-month all-oral regimen – combining bedaquiline, pretomanid and line-zolid – was recommended for treating people with fluoro-quinolone-resistant MDR-TB under operational research conditions.
The safety and efficacy of bedaquiline when used as part of short MDR-TB treatment regimens (i.e. 6 and 9 months duration) compared with the updated current standard of care recommended by WHO (i.e. a 9–12-month regimen) is being investigated in the second stage of the Phase III tri-al Standardised Treatment Regimen of Anti-TB Drugs for Patients with MDR-TB (STREAM) (17). Recruitment start-ed in March 2016 and the first results are expected in 2020.
A study of the use of bedaquiline to treat children with MDR-TB is being implemented in the Philippines, the Russian Federation and South Africa.
Bedaquiline is also being used in trials of all-oral treatment regimens, and investigation of its use in the treatment of drug-susceptible TB in the bedaquiline, pretomanid, moxifloxacin and pyrazinamide (BPaMZ) trial is ongoing (Section 9.3.3).
BTZ-043 BTZ-043 is a benzothiazinone compound that acts by inhibiting the DprE1 enzyme, which is necessary for the synthesis of D-arabinofuranose, a constituent of the M. tuberculosis cell wall. A Phase Ib/IIa study to evaluate the safety, tolerability, extended early bactericidal activi-ty and pharmacokinetics of multiple oral doses of BTZ-043 in people with smear-positive, drug-susceptible TB is underway in South Africa.
DelamanidWHO issued interim policy guidance on the use of dela-manid for the treatment of adults with MDR-TB in 2014, based on Phase IIb trial results (18). A conditional recom-mendation was made to use delamanid as part of longer MDR-TB treatment regimens for adults. This recom-mendation was conditional on proper patient selection, a regimen design following WHO recommendations, close monitoring of treatment, active TB drug safety monitoring and management, and informed consent according to local requirements. Following the release of results for children and adolescents treated for MDR-TB using delamanid in 2016, WHO’s guidance on the use of delamanid in adults was expanded to include patients aged 6–17 years (19).
In 2017, final results from a Phase III trial assessing the safety and efficacy of delamanid as an addition to an opti-mized background regimen for adults with MDR-TB were
reported to WHO by the manufacturer, Otsuka Pharma-ceutical, Japan. WHO conducted an expedited external expert review of the new data, and in January 2018 issued a position statement (20),which stated that the conditional guidance on delamanid remained valid, but that delama-nid should only be added to a longer MDR-TB treatment regimen when the regimen cannot otherwise be composed according to WHO recommendations. In 2018 and 2019, WHO analysed additional data from the Phase III trials alongside data from other studies of patients treated with delamanid-containing regimens, as part of an update to WHO consolidated guidance on TB (drug-resistant TB treatment). Based on these findings, delamanid may now be included in longer treatment regimens for treating peo-ple aged 3 years or older with MDR/RR-TB (16).
As with bedaquiline, delamanid is being used in trials of all-oral treatment regimens (Section 9.3.3). The use of delamanid in addition to an optimized background reg-imen to treat children aged under 6 years is also being investigated in other trials. Studies of its use in the pre-vention of drug-resistant TB among contacts of people with MDR-TB are planned.
Delpazolid (LCB01–0371)
Delpazolid is a new oxazolidinone developed by LegoChem BioSciences. A Phase II trial to assess early bactericidal activity, safety and tolerability is underway in the Republic of Korea.
GSK-3036656
GSK-3036656 belongs to a new chemical class of oxaborole compounds developed by GlaxoSmithKline. A Phase IIa trial assessing its early bactericidal activity, safety and tol-erability is underway in South Africa.
Macozinone
Macozinone (formerly PBTZ169) is a benzothiazinone developed by Innovative Medicines for Tuberculosis and Nearmedic Plus. One Phase I trial has been completed and another Phase I study with a new formulation began in 2018 in Switzerland.
OPC-167832
OPC-167832 is a carbostyril derivative developed by Otsuka that is bactericidal against both growing and intracellular bacilli. A single ascending dose study has been completed. A Phase I/II multiple ascending dose and early bactericidal activity study of OPC-167832, alone and in combination with delamanid, is being implemented in South Africa.
Pretomanid
Pretomanid is a nitroimidazole, developed by the Glob-al Alliance for TB Drug Development (TB Alliance). It was recently recommended by WHO for treating fluo-roquinolone-resistant MDR-TB (in combination with
185 GLOBAL TUBERCULOSIS REPORT 2020
bedaquiline and linezolid) in people with no or less than 2 weeks exposure to bedaquiline and linezolid, under operational research conditions (16). It is currently being further tested as part of combination regimens for the treatment of both drug-susceptible and drug-resistant TB (Section 9.3.3).
Telacebec (Q203)
Telacebec (Q203) is an imidazopyridine that has been developed by Qurient (Republic of Korea). Single dos-es of various sizes have been tested in Phase I trials, and recruitment has been completed in South Africa as part of a Phase IIa trial assessing its early bactericidal activity in sputum smear-positive patients with drug-susceptible pulmonary TB.
SPR720
SPR720 is an orally administered antibiotic being devel-oped by Spero Therapeutics for the treatment of pulmo-nary nontuberculous mycobacterial infections. A Phase I trial is ongoing in the United Kingdom of Great Britain and Northern Ireland (United Kingdom). The Bill & Melinda Gates Medical Research Institute (Gates MRI) has recently obtained a license to further develop the drug.
SQ109
SQ109 is a novel drug that was discovered by scientists at Sequella Inc (USA) and the US National Institutes of Health (NIH). A Phase IIb/III trial, in which the drug was added to a standard regimen for MDR-TB, has been com-pleted in seven clinical centres in the Russian Federation. A press release in March 2017 reported positive results in terms of safety, efficacy and tolerability. A Phase II trial in the USA is in the planning stages.
Sutezolid
Sutezolid (PNU-100480) is an oxazolidinone and ana-logue of linezolid. Results from a study of early bacte-ricidal activity presented in 2012 showed a significant reduction in colony-forming unit counts compared with the baseline level after 14 days of treatment. In January 2017, the Medicines Patent Pool announced that it had signed a license with Johns Hopkins University to facili-tate the clinical development of sutezolid in combination with other drugs. On World TB Day 2017, the TB Alliance and Medicines Patent Pool announced a licensing agree-ment for the clinical development of sutezolid. In partner-ship with the Gates MRI, a Phase IIb dose-finding study is being planned in South Africa and the United Republic of Tanzania.
TBA-7371
TBA-7371 is an inhibitor of the enzyme DprE1, which is essential in the synthesis of components of mycobacteri-al cell walls. This inhibitor has been shown to be active against strains of M. tuberculosis resistant to known TB
drugs. The TB Alliance has completed a Phase I study in the USA, and a Phase II study, sponsored by the Gates MRI, is underway in South Africa.
TBI-166
TBI-166, which belongs to the same clinical class as clo-fazamine, was identified through a lead optimization effort by the TB Alliance, in partnership with the Insti-tute of Materia Medica, the Chinese Academy of Medical Sciences and the Peking Union Medical College in Beijing. This riminophenazine compound has improved physico-chemical and pharmacokinetic properties (to avoid skin discolouration), and its efficacy is similar to that of clo-fazimine. A Phase I trial is being implemented in China, led by the Institute of Materia Medica.
TBI-223
TBI-223 was identified through a lead optimization effort by the TB Alliance, in partnership with the Institute of Materia Medica. This oxazolidinone compound works as a protein synthesis inhibitor, targeting an early step that involves the binding of N-formylmethionyl-tRNA to the ribosome. A Phase I trial in the USA is ongoing.
TBAJ-876
TBAJ-876 is a next-generation diarylquinoline. In animal models, this compound exhibits efficacious and potent activity against TB (compared with bedaquiline), with a lower predicted clinical dose and improved safety proper-ties. TBAJ-876 is currently in a Phase I trial.
9.3.2 Approved drugs being tested for new purposes
Clofazimine
Clofazimine is a riminophenazine that is used to treat leprosy and is also recommended as one of the medicines (group B) that can be used to design all-oral longer regi-mens to treat people with MDR/RR-TB. Its use in treat-ment for MDR-TB is being further explored in preclinical models of TB infection, to better understand its anti-TB effects. Novartis, the company that manufactures the drug, has withdrawn support for Phase II trials; howev-er, clofazimine continues to be tested as part of treatment regimens for MDR-TB in Phase III trials (Section 9.3.3).
Levofloxacin
Levofloxacin is recommended as part of the regimen for treating isoniazid-resistant TB, and is one of the priori-ty medicines (group A) used in the design of longer regi-mens to treat people with MDR/RR-TB. It is being further tested in a Phase II study called Opti-Q, which is investi-gating the best dose of levofloxacin to use for treatment of MDR-TB in adults with smear- and culture-positive pulmonary TB. Four different dosages are being tested as part of an optimized background regimen. Trial enrol-ment and follow-up (in Peru and South Africa) have been
GLOBAL TUBERCULOSIS REPORT 2020 186
completed and data analysis is underway. Levofloxacin continues to be tested as part of treatment regimens for drug-resistant-TB (Section 9.3.3).
LinezolidLinezolid is a marketed oxazolidinone with potent activity against TB. It is currently recommended as one of the pri-ority medicines (group A) that can be used in the design of longer regimens to treat people with MDR/RR-TB. Fur-ther use of linezolid is being explored in other Phase II and III trials (Section 9.3.3).
MoxifloxacinMoxifloxacin is recommended as one of the priority medi-cines (group A) that can be used in the design of longer reg-imens for treatment of people with MDR/RR-TB. Its use is being further explored in several trials of new regimens for treatment of both drug-susceptible and drug-resist-ant TB, including in the BPaMZ, endTB, TB-PRACTE-CAL and TB Trial Consortium (TBTC) Study 31 trials (Section 9.3.3).
Rifampicin (high dose)Findings from the Multi-Arm, Multi-Stage TB (MAMS-TB) trial of the Pan-African Consortium for the Evalu-ation of Antituberculosis Antibiotics (PanACEA) were published in 2017 (21). The trial found that 35 mg/kg of rifampicin given over 12 weeks is safe and shortens the time to stable culture conversion from 62 to 48 days. The other trial arms – which included various combinations of 10 mg/kg or 20 mg/kg of rifampicin, moxifloxacin and SQ109 – did not achieve significant improvements com-pared with the control arm. When all the data were tak-en into consideration, the trial suggested that a 35 mg/kg dose of rifampicin given for 12 weeks is likely to improve treatment outcomes. This trial was the first multi-arm adaptive trial design to be successfully implemented in multiple sites in countries with a high burden of TB. It may help to pave the way for accelerated testing of new TB treatment regimens at reduced cost. Another study (RIFASHORT) is assessing the added benefit and safety of giving an increased dose of rifampicin to patients receiv-ing standard treatment for drug-susceptible TB. For TB meningitis, a Phase II dose-finding study (ReDEFINe) has indicated an added value of using high-dose rifampicin to improve survival (22).
RifapentineThe effectiveness of rifapentine in the treatment of drug-susceptible TB is being studied in several trials. The TBTC Study 31/ACTG A5349 is a Phase III trial that is investigating the use of rifapentine, with or without moxi-floxacin, to shorten the treatment of drug-susceptible pul-monary TB to 4 months. TBTC Study 35, a Phase II study of the pharmacokinetics of new water-dispersible paedi-atric formulations of rifapentine, is being implemented in South Africa (Section 9.4).
9.3.3 New regimens for the treatment of drug-susceptible or drug-resistant TB disease
New combinations of drugs are being tested in Phase II or Phase III trials.
ACTG A5343 DELIBERATEThe ACTG A5343 DELIBERATE was a Phase II trial that evaluated the cardiotoxicity of regimens containing delamanid and bedaquiline, alone and in combination, in pharmacokinetic and drug–drug interaction studies. Preliminary results from this trial were presented at a WHO-convened GDG meeting in November 2019; also, the results informed statements on the concurrent use of bedaquiline and delamanid that have been included in the updated WHO consolidated guidelines on TB (in the module for treatment of drug-resistant TB) (16).
ACTG A5312 ACTG A5312 is a Phase I trial in South Africa that is assess-ing the safety and efficacy of high-dose isoniazid for treat-ing different genetic variants of isoniazid-resistant TB.
APT trialAPT is a Phase II trial testing the bactericidal activity of pretomanid when substituted for ethambutol in first-line therapy for drug-susceptible TB.
BEAT TBBEAT TB is a research programme being implemented in India and South Africa with funding from USAID. It has the overall aim of reducing side-effects and treatment duration for patients with drug-resistant TB. In India, the safety and efficacy of a 6–9-month oral regimen (consist-ing of bedaquiline, delamanid, linezolid and clofazimine) is being tested to treat adults with MDR-TB as well as resistance to fluoroquinolones or injectable agents. In South Africa, a Phase III trial is assessing the safety and efficacy of a 6-month oral regimen for MDR-TB (consist-ing of bedaquiline, delamanid, linezolid, levofloxacin and clofazimine) compared with the national standard of care (i.e. a 9-month regimen).
CLO-FAST trialCLO-FAST is a Phase II trial assessing whether a regi-men containing clofazimine and rifapentine can shorten the treatment duration of drug-susceptible TB, compared with the standard of care.
endTBThe endTB trial started in 2017. It is a Phase III study comparing several shorter treatment regimens for MDR-TB with the current standard-of-care treatment for MDR-TB recommended by WHO. The regimens being tested include bedaquiline or delamanid (or both), moxifloxacin or levofloxacin, and pyrazinamide plus linezolid or clo-fazimine (or both), in various combinations.
187 GLOBAL TUBERCULOSIS REPORT 2020
endTB-Q endTB-Q is a Phase III trial evaluating the safety and efficacy of new combination regimens (including bedaq-uiline, delamanid, linezolid and clofazimine) to short-en treatment for people with fluoroquinolone-resistant MDR-TB.
MDR-ENDThe MDR-END trial is investigating a 9–12-month regi-men of delamanid, linezolid, levofloxacin and pyrazina-mide for the treatment of MDR-TB among people without resistance to fluoroquinolones. It is being implemented in the Republic of Korea.
NeXTNeXT is a Phase III trial evaluating a 6‒9-month regimen of bedaquiline, ethionamide or high-dose isoniazid, lin-ezolid, levofloxacin and pyrazinamide for patients with MDR-TB. It is being undertaken in South Africa.
NiX-TB, ZeNix The Phase III NiX-TB trial informed WHO’s guidance on the use of a 6-month all-oral regimen combining bedaquiline, pretomanid and linezolid for treating fluoro-quinolone-resistant MDR-TB, under operational research conditions in people with no or less than 2 weeks expo-sure to bedaquiline and linezolid. A follow-on trial (called ZeNix) is exploring lower doses and shorter durations of linezolid to minimize toxicity.
SimpliciTB SimpliciTB is a Phase III trial evaluating the efficacy, safe-ty and tolerability of BPaMZ in people with drug-suscep-tible TB or MDR/RR-TB. It is being implemented in 27 sites in eight countries globally. The primary end-point is relapse-free cure 12 months after initiation of therapy. A previous Phase IIb study of BPaMZ regimen showed almost 100% culture conversion at 2 months in patients with MDR-TB.
PredictTB trialThe Phase II PredictTB trial is investigating the possibility of shortening the treatment duration for “less-severe” cas-es of drug-susceptible TB (as determined by the baseline radiographic extent of disease) to 4 months instead of the standard 6 months of treatment. The primary end-point will be a comparison of the treatment success rate at 18 months between the experimental and standard-of-care cohorts. This trial is being implemented in China.
STREAMSTREAM Stage 1 was a Phase III, randomized, non-in-feriority trial that compared a standardized 9–11-month regimen for the treatment of MDR-TB with longer regi-mens of 18–24 months in Ethiopia, Mongolia, South Afri-ca and Viet Nam. The final trial results showed that the shorter regimen was non-inferior to the control (longer)
regimen (23). Current WHO guidelines on the treatment of drug-resistant TB treatment recommend that NTPs and other stakeholders continue to use the shorter MDR-TB regimen under programmatic conditions, as described in the guidance (16).
STREAM Stage 2 is assessing whether an all-oral 40-week regimen including bedaquiline, and a 28-week regimen including both bedaquiline and an injectable agent, are as effective as the 9-month regimen studied in STREAM Stage 1. It is funded by USAID and implement-ed by the Union.1
TB-PRACTECALThe TB-PRACTECAL trial is a Phase II/III trial to evaluate the safety and efficacy of 6-month regimens that contain bedaquiline, pretomanid and linezolid, with or without moxifloxacin or clofazimine, for the treatment of adult patients with MDR-TB (including those with resistance to additional drugs). Primary outcomes include 8-week culture conversion, and the development of unfavourable outcomes (treatment failure or recurrence, death, discon-tinuation or loss to follow-up during a 72-week follow-up period). The trial is being implemented in Belarus, South Africa and Uzbekistan.
TBHDT trial The TBHDT trial is a Phase II trial examining the safe-ty and preliminary efficacy of host-directed therapies – CC-11050 (AMG 634), auronofin and everolimus – in shortening TB treatment or preventing permanent lung damage (or both), when co-administered with rifabu-tin-modified standard therapy in people with drug-sus-ceptible smear-positive TB.
TRUNCATE-TBThe TRUNCATE-TB trial is a Phase II/III randomized, open-label, multi-arm, multi-stage trial to evaluate the safety and efficacy of 2-month regimens (compared with standard care) for the treatment of adults with drug-sus-ceptible TB; the regimens contain isoniazid, pyrazina-mide ethambutol, linezolid and rifampicin; isoniazid, pyrazinamide, linezolid, rifapentine and levofloxacin; or isoniazid, pyrazinamide, ethambutol, linezolid and bedaquiline. The primary outcome is an unsatisfactory clinical outcome at 96 weeks after randomization, which is defined as an ongoing requirement for TB treatment, or ongoing TB disease activity at week 96. The trial is being implemented in Indonesia, the Philippines, Singapore and Thailand.
9.4 New drugs and drug regimens to treat TB infection
At the UN high-level meeting on TB in 2018, Member States committed to provide TB preventive treatment to at least 30 million people globally between 2018 and 2022 (Chapter 2). Achieving this target will require program-
1 See https://www.theunion.org/
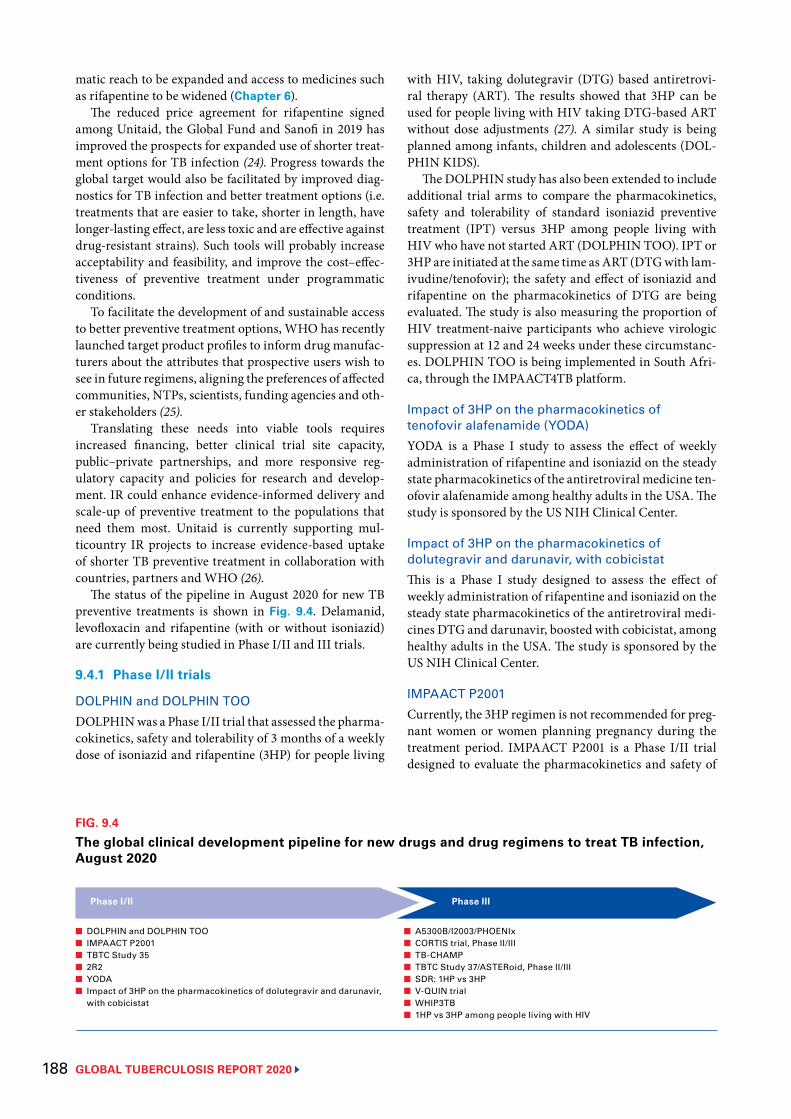
GLOBAL TUBERCULOSIS REPORT 2020 188
matic reach to be expanded and access to medicines such as rifapentine to be widened (Chapter 6).
The reduced price agreement for rifapentine signed among Unitaid, the Global Fund and Sanofi in 2019 has improved the prospects for expanded use of shorter treat-ment options for TB infection (24). Progress towards the global target would also be facilitated by improved diag-nostics for TB infection and better treatment options (i.e. treatments that are easier to take, shorter in length, have longer-lasting effect, are less toxic and are effective against drug-resistant strains). Such tools will probably increase acceptability and feasibility, and improve the cost–effec-tiveness of preventive treatment under programmatic conditions.
To facilitate the development of and sustainable access to better preventive treatment options, WHO has recently launched target product profiles to inform drug manufac-turers about the attributes that prospective users wish to see in future regimens, aligning the preferences of affected communities, NTPs, scientists, funding agencies and oth-er stakeholders (25).
Translating these needs into viable tools requires increased financing, better clinical trial site capacity, public–private partnerships, and more responsive reg-ulatory capacity and policies for research and develop-ment. IR could enhance evidence-informed delivery and scale-up of preventive treatment to the populations that need them most. Unitaid is currently supporting mul-ticountry IR projects to increase evidence-based uptake of shorter TB preventive treatment in collaboration with countries, partners and WHO (26).
The status of the pipeline in August 2020 for new TB preventive treatments is shown in Fig. 9.4. Delamanid, levofloxacin and rifapentine (with or without isoniazid) are currently being studied in Phase I/II and III trials.
9.4.1 Phase I/II trials
DOLPHIN and DOLPHIN TOO DOLPHIN was a Phase I/II trial that assessed the pharma-cokinetics, safety and tolerability of 3 months of a weekly dose of isoniazid and rifapentine (3HP) for people living
with HIV, taking dolutegravir (DTG) based antiretrovi-ral therapy (ART). The results showed that 3HP can be used for people living with HIV taking DTG-based ART without dose adjustments (27). A similar study is being planned among infants, children and adolescents (DOL-PHIN KIDS).
The DOLPHIN study has also been extended to include additional trial arms to compare the pharmacokinetics, safety and tolerability of standard isoniazid preventive treatment (IPT) versus 3HP among people living with HIV who have not started ART (DOLPHIN TOO). IPT or 3HP are initiated at the same time as ART (DTG with lam-ivudine/tenofovir); the safety and effect of isoniazid and rifapentine on the pharmacokinetics of DTG are being evaluated. The study is also measuring the proportion of HIV treatment-naive participants who achieve virologic suppression at 12 and 24 weeks under these circumstanc-es. DOLPHIN TOO is being implemented in South Afri-ca, through the IMPAACT4TB platform.
Impact of 3HP on the pharmacokinetics of tenofovir alafenamide (YODA)YODA is a Phase I study to assess the effect of weekly administration of rifapentine and isoniazid on the steady state pharmacokinetics of the antiretroviral medicine ten-ofovir alafenamide among healthy adults in the USA. The study is sponsored by the US NIH Clinical Center.
Impact of 3HP on the pharmacokinetics of dolutegravir and darunavir, with cobicistat This is a Phase I study designed to assess the effect of weekly administration of rifapentine and isoniazid on the steady state pharmacokinetics of the antiretroviral medi-cines DTG and darunavir, boosted with cobicistat, among healthy adults in the USA. The study is sponsored by the US NIH Clinical Center.
IMPAACT P2001 Currently, the 3HP regimen is not recommended for preg-nant women or women planning pregnancy during the treatment period. IMPAACT P2001 is a Phase I/II trial designed to evaluate the pharmacokinetics and safety of
FIG. 9.4
The global clinical development pipeline for new drugs and drug regimens to treat TB infection, August 2020
Phase I/II Phase III
■ A5300B/I2003/PHOENIx ■ CORTIS trial, Phase II/III■ TB-CHAMP ■ TBTC Study 37/ASTERoid, Phase II/III■ SDR: 1HP vs 3HP■ V-QUIN trial ■ WHIP3TB ■ 1HP vs 3HP among people living with HIV
■ DOLPHIN and DOLPHIN TOO ■ IMPAACT P2001 ■ TBTC Study 35■ 2R2■ YODA ■ Impact of 3HP on the pharmacokinetics of dolutegravir and darunavir,
with cobicistat
189 GLOBAL TUBERCULOSIS REPORT 2020
3HP among HIV-positive and HIV-negative pregnant and postpartum women with M. tuberculosis infection. The study is sponsored by US NIH/National Institute of Aller-gy and Infectious Diseases (NIAID), and is being imple-mented in Haiti, Kenya, Malawi, Thailand and Zimbabwe.
TBTC Study 35 TBTC Study 35 is a single-arm, open-label Phase I/II dose-finding and safety study of 3HP (with rifapentine given as a water-dispersible monolayer or as a fixed-dose combination with isoniazid) for children aged 12 years or under, for whom treatment for TB infection is recom-mended. The study is sponsored by the US Centers for Dis-ease Control and Prevention (CDC) and IMPAACT4TB (Unitaid).
2R2: Higher-dose rifampin for 2 months versus standard-dose rifampin 2R2 is a Phase IIb study evaluating the safety and effica-cy of 2 months of daily rifampin (at double or triple the standard dose) compared with the standard 4 months of daily rifampin to treat TB infection. The study is being implemented in Canada by McGill University Health Centre.
9.4.2 Phase III trials
A5300B/I2003/PHOENIx PHOENIx is a Phase III trial, randomized by household, to assess the efficacy of 26 weeks of daily delamanid com-pared with 26 weeks of isoniazid among high-risk house-hold contacts of adults diagnosed with MDR-TB. The study is sponsored by USNIH/NIAID and is being imple-mented in Botswana, Brazil, Haiti, India, Kenya, Peru, the Philippines, Thailand, South Africa, Uganda, the United Republic of Tanzania and Zimbabwe.
Correlate of Risk Targeted Intervention Study Correlate of Risk Targeted Intervention Study (CORTIS) is a Phase II/III trial to assess the diagnostic and prog-nostic performance of an 11-gene signature of risk (also known as prognostic correlate of risk, COR), to identify individuals who are most likely to progress to active TB disease and individuals with TB disease who have not yet presented for medical care. The study randomizes eligible HIV-negative COR test-positive and COR test-negative adults into 3HP treatment or standard of care; participants are monitored for progression to active TB. The prima-ry objectives are to assess whether preventive treatment reduces TB incidence compared with the standard of care in people who are COR test-positive, and to measure the performance of the biomarker. The study is sponsored by the University of Cape Town and is being implemented in South Africa.
TB-CHAMP TB-CHAMP is a Phase III trial to assess the safety and effi-cacy of 6 months of daily levofloxacin for the prevention
of TB in child contacts of adults with MDR-TB in South Africa. The study’s sponsors include the Global Health Trials Scheme of the United Kingdom and Unitaid.
TBTC Study 37/ASTERoid TBTC Study 37/ASTERoid is a Phase II/III non-inferiority trial to compare the safety and efficacy of a 6-week regi-men of daily rifapentine with a comparator arm of 12–16 weeks of rifamycin-based treatment (standard care). The study is sponsored by the US CDC and the United King-dom Medical Research Council. It is being implemented in the United Kingdom, USA and other countries with a low to moderate incidence of TB.
The risk of systemic drug reaction (SDR): 1HP versus 3HPThe SDR is a Phase III head-to-head study to compare the safety (the risk of systemic drug reaction) of the 1HP and 3HP regimens, when used to treat TB infection among people living with HIV. The study is sponsored by the National Taiwan University Hospital.
V-QUIN trial V-QUIN is a Phase III trial assessing 6 months of daily levofloxacin among household contacts of adults with MDR-TB. The trial is sponsored by the Australian Wool-cock Institute of Medical Research and is being imple-mented in Viet Nam.
WHIP3TB WHIP3TB is a Phase III trial designed to assess the dura-bility of protection, as well as the safety and adherence of periodic 3HP (given once a year for 2 years), compared with a single round of 3HP (given once) or 6 months of daily isoniazid (6H) among people living with HIV. The trial is funded by USAID and is being implemented by the Aurum Institute in Ethiopia, Mozambique and South Africa.
1HP versus 3HP among people living with HIVThis is a Phase III non-inferiority trial comparing the safety and effectiveness of 1HP and 3HP for treating TB infection among people living with HIV. The study will also monitor adherence to treatment and patterns of anti-biotic resistance in those for whom treatment fails. It is sponsored by the HIV Netherlands Australia Thailand Research Collaboration, and is being implemented in Thailand.
9.5 New TB vaccines The BCG vaccine, first used in the 1920s, remains the only licensed vaccine for preventing TB. Despite high coverage of BCG vaccination as part of childhood immunization programmes (Chapter 6), the slow decline in TB inci-dence globally highlights the need for a much more effec-tive vaccine that provides protection against all forms of TB in all age groups.
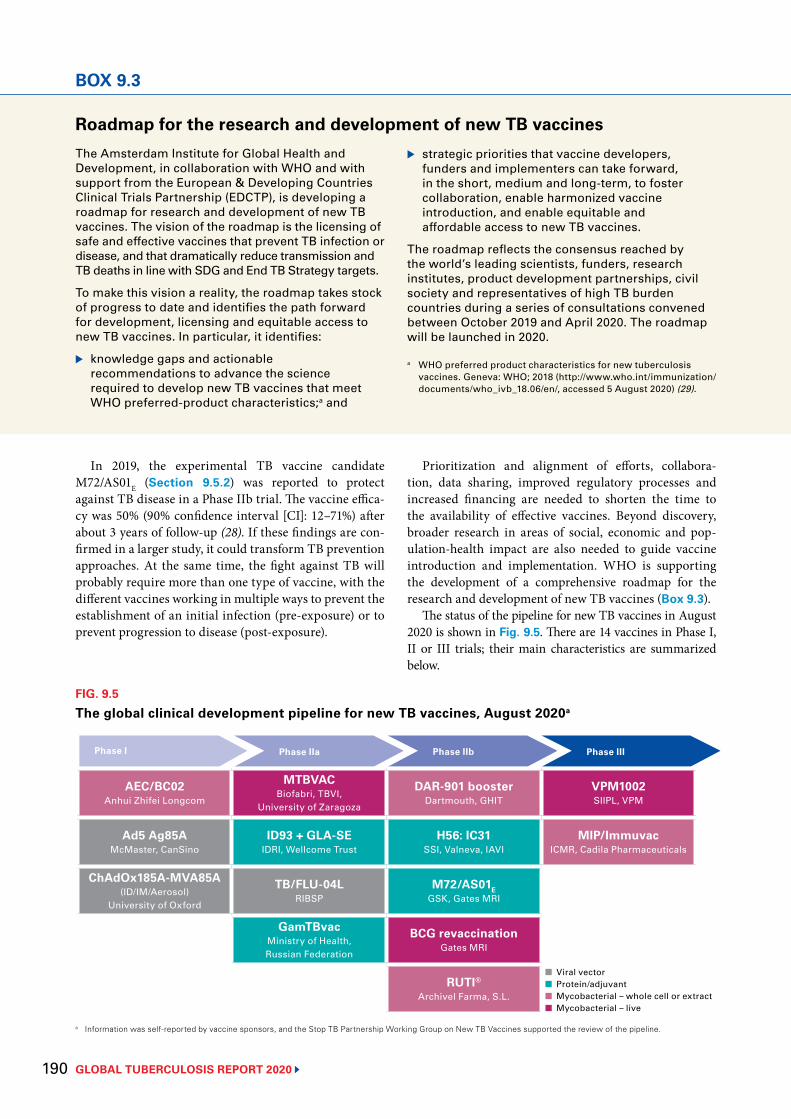
GLOBAL TUBERCULOSIS REPORT 2020 190
In 2019, the experimental TB vaccine candidate M72/AS01E (Section 9.5.2) was reported to protect against TB disease in a Phase IIb trial. The vaccine effica-cy was 50% (90% confidence interval [CI]: 12–71%) after about 3 years of follow-up (28). If these findings are con-firmed in a larger study, it could transform TB prevention approaches. At the same time, the fight against TB will probably require more than one type of vaccine, with the different vaccines working in multiple ways to prevent the establishment of an initial infection (pre-exposure) or to prevent progression to disease (post-exposure).
Phase III
FIG. 9.5
The global clinical development pipeline for new TB vaccines, August 2020a
Phase I Phase IIa Phase IIb
AEC/BC02Anhui Zhifei Longcom
MTBVAC Biofabri, TBVI,
University of Zaragoza
DAR-901 boosterDartmouth, GHIT
VPM1002 SIIPL, VPM
Ad5 Ag85AMcMaster, CanSino
ID93 + GLA-SEIDRI, Wellcome Trust
H56: IC31SSI, Valneva, IAVI
MIP/ImmuvacICMR, Cadila Pharmaceuticals
ChAdOx185A-MVA85A (ID/IM/Aerosol)
University of Oxford
TB/FLU-04L RIBSP
M72/AS01EGSK, Gates MRI
GamTBvacMinistry of Health, Russian Federation
BCG revaccinationGates MRI
RUTI® Archivel Farma, S.L.
a Information was self-reported by vaccine sponsors, and the Stop TB Partnership Working Group on New TB Vaccines supported the review of the pipeline.
■ Viral vector■ Protein/adjuvant■ Mycobacterial – whole cell or extract■ Mycobacterial – live
BOX 9.3
Roadmap for the research and development of new TB vaccinesThe Amsterdam Institute for Global Health and Development, in collaboration with WHO and with support from the European & Developing Countries Clinical Trials Partnership (EDCTP), is developing a roadmap for research and development of new TB vaccines. The vision of the roadmap is the licensing of safe and effective vaccines that prevent TB infection or disease, and that dramatically reduce transmission and TB deaths in line with SDG and End TB Strategy targets.
To make this vision a reality, the roadmap takes stock of progress to date and identifies the path forward for development, licensing and equitable access to new TB vaccines. In particular, it identifies:
▶ knowledge gaps and actionable recommendations to advance the science required to develop new TB vaccines that meet WHO preferred-product characteristics;a and
▶ strategic priorities that vaccine developers, funders and implementers can take forward, in the short, medium and long-term, to foster collaboration, enable harmonized vaccine introduction, and enable equitable and affordable access to new TB vaccines.
The roadmap reflects the consensus reached by the world’s leading scientists, funders, research institutes, product development partnerships, civil society and representatives of high TB burden countries during a series of consultations convened between October 2019 and April 2020. The roadmap will be launched in 2020.
a WHO preferred product characteristics for new tuberculosis vaccines. Geneva: WHO; 2018 (http://www.who.int/immunization/documents/who_ivb_18.06/en/, accessed 5 August 2020) (29).
Prioritization and alignment of efforts, collabora-tion, data sharing, improved regulatory processes and increased financing are needed to shorten the time to the availability of effective vaccines. Beyond discovery, broader research in areas of social, economic and pop-ulation-health impact are also needed to guide vaccine introduction and implementation. WHO is supporting the development of a comprehensive roadmap for the research and development of new TB vaccines (Box 9.3).
The status of the pipeline for new TB vaccines in August 2020 is shown in Fig. 9.5. There are 14 vaccines in Phase I, II or III trials; their main characteristics are summarized below.
191 GLOBAL TUBERCULOSIS REPORT 2020
9.5.1 Phase I trialsThere are currently three vaccine candidates in Phase I trials.
Ad5 Ag85A Ad5 Ag85A is an adenovirus serotype 5 vector expressing Ag85A. It has been evaluated for safety and immunogenic-ity in both BCG-naive and previously BCG-immunized healthy volunteers in Canada. Overall, intramuscular administration was found to be safe, well tolerated and immunogenic in both trial groups, with more potent immunogenicity observed in volunteers who had been previously vaccinated with BCG. A safety and immuno-genicity study of aerosol administration in BCG-vaccinat-ed healthy volunteers has started.
AEC/BC02 AEC/BC02 is a freeze-dried recombinant vaccine express-ing Ag85B and fusion protein ESAT-6 and CFP-10, togeth-er with CpG (from BCG) and an alum salt-based adjuvant. A Phase I study assessing safety and immunogenicity is underway in China, with sponsorship from Anhui Zhifei Longcom Biologic Pharmacy Co., Ltd.
ChAdOx185A – MVA85A (ID/IM/Aerosol)ChAdOx185A is a simian adenovirus and MVA85A is a recombinant pox virus – both express antigen 85A. These candidates are being developed with the aim of generat-ing a joint heterologous prime-boost regimen delivered through both systemic and mucosal routes.
A Phase I trial of intramuscular administration of ChAdOx185A in BCG-vaccinated adults in the United Kingdom, both alone and as part of a prime-boost strat-egy with MVA85A, has been completed. A Phase I trial of aerosol administration of ChAdOx185A in BCG-vac-cinated adults is underway in Switzerland. Two studies of aerosol administration of MVA85A in BCG-vaccinated individuals have been completed, as has a further study in people with TB infection. A Phase IIa study of intra-muscular administration of ChAdOx185A and MVA85A among adults and adolescents is ongoing in Uganda.
9.5.2 Phase II and Phase III trialsThere are currently 11 vaccines in Phase II or Phase III trials.
BCG revaccination (Gates MRI-TBV01-201)Gates MRI-TBV01-201 is a Phase IIb trial to evaluate the efficacy, safety and immunogenicity of BCG revaccina-tion in healthy adolescents for “prevention of sustained QFT conversion”, as a surrogate for sustained infection with M. tuberculosis. The study, sponsored by the Gates MRI, intends to confirm that BCG revaccination protects against sustained M. tuberculosis infection; assess the duration of protection 48 months post-revaccination; and identify or validate biomarkers that correlate with risk for or protection against transient or sustained M. tuberculosis
infection, as assessed by the QuantiFERON-TB Gold Plus (QFT-Plus) assay.
DAR-901 boosterDAR-901 is a whole-cell, heat-inactivated, nontuberculous mycobacterial vaccine booster. It represents a new scala-ble manufacturing method for SRL172, a candidate vac-cine that showed efficacy among adults living with HIV in a Phase III trial in the United Republic of Tanzania. It is now being tested in a Phase IIb prevention of infection trial among BCG-primed adolescents, also in the United Republic of Tanzania. The trial is scheduled for comple-tion in 2020.
GamTBvac GamTBvac is a recombinant subunit vaccine containing dextran-binding domain-modified Ag85a and ESAT6-CFP10 MTB antigens and CpG ODN adjuvant, formulat-ed with dextrans. It is intended for use as a BCG booster vaccine to prevent TB. A Phase I study among healthy vol-unteers in the Russian Federation has found the candidate vaccine to be safe and immunogenic. A Phase II study is currently ongoing to further assess safety and immuno-genicity. The trial is sponsored by the Russian Ministry of Health.
H56:IC31H56:IC31 is an adjuvanted subunit vaccine that com-bines three M. tuberculosis antigens (Ag85B, ESAT-6 and Rv2660c) with the IC31© adjuvant from Valneva Austria GmBH (Vienna Austria). Five Phase I or I/IIa trials of safety and immunogenicity have been completed. Two of these were in HIV-negative, BCG-vaccinated adults with and without TB infection, and without a history or any evidence of TB disease. Two trials enrolled HIV-negative participants with pulmonary TB, who were vaccinated at different time points during TB treatment. Finally, analy-ses of a Phase Ib trial evaluating the safety and immuno-genicity of H4:IC31, H56:IC31 and BCG revaccination in adolescents have recently been published (30). The results showed that the vaccine had an acceptable safety profile and was immunogenic at all studied doses.
A Phase IIb trial assessing H56:IC31 for prevention of recurrence of TB is ongoing in the United Republic of Tanzania and South Africa, co-sponsored by the Statens Serum Institut and Aeras, with support from the EDCTP.
ID93 + GLA-SE The ID93 + GLA-SE vaccine comprises four M. tuberculosis antigens associated with either virulence (Rv2608, Rv3619 and Rv3620) or latency (Rv1813), and the adjuvant GLA-SE. A Phase IIa trial in HIV-negative TB patients, who have recently completed treatment for pulmonary TB disease, has been completed in South Africa, in prepara-tion for two Phase II studies that will establish the safety and immunogenicity of ID93 in TB patients undergoing active therapy. Currently underway are a Phase IIa trial
BOX 9.3
GLOBAL TUBERCULOSIS REPORT 2020 192
in BCG-vaccinated healthy adult health care workers, to assess prevention of infection, and a Phase I age-de-es-calation trial in BCG-vaccinated healthy adolescents to assess safety and immunogenicity.
M72/AS01E
M72/AS01E is a subunit vaccine that pairs two M. tuberculosis antigens (32A and 39A) with an adjuvant (AS01E). It was tested in a Phase IIb efficacy trial in HIV-negative adults already infected with M. tuberculosis in Kenya, South Africa and Zambia, with the primary end-point being the number of incident cases of active laboratory-confirmed pulmonary TB disease not associated with HIV infection.
The final analysis of this trial showed a 50% (90% CI: 12–71%) point estimate for vaccine efficacy after 3 years of follow-up (28). In terms of the clinical significance and strength of evidence, this result is unprecedented in dec-ades of TB vaccine research. If the findings are confirmed in a Phase III trial, this vaccine has the potential to trans-form global TB prevention efforts.
In 2020, the Gates MRI obtained a license to develop M72/AS01E for use in low-income countries, paving the way for continued development and potential use of the vaccine candidate in countries with a high TB burden. The first M72/AS01E trial that the Gates MRI intends to conduct is a safety and immunogenicity study in 400 peo-ple living with HIV in South Africa.
WHO has highlighted the importance of accelerated progress towards a well-designed, Phase III programme, with priorities such as a more precise estimation of vac-cine efficacy in different geographical settings and further evaluation of safety. The effect of vaccination also needs to be characterized in people who are not infected with M. tuberculosis, in children and in specific risk groups such as people living with HIV. This will require adequate vaccine manufacturing and financing. WHO calls on all relevant stakeholders – including the pharmaceutical industry, funders, governments, civil society, health care practitioners, policy-makers and international agencies – to work with a sense of urgency, in a spirit of collaboration and with a sense of responsibility towards public health, to advance the development of this investigational vaccine in the fight against TB.
MTBVACMTBVAC is a live strain of M. tuberculosis, attenuated via deletions of the phoP and fadD26 genes. The prima-ry target population is neonates (as a BCG replacement vaccine); the secondary target populations are adolescents and adults (as a booster vaccine). A Phase Ib trial in neo-nates was completed in 2018. Phase IIa trials in both target populations are ongoing.
RUTI®RUTI is a non-live, polyantigenic vaccine based on cell wall fragments of M. tuberculosis bacteria. It is intended as a therapeutic vaccine, to be used in conjunction with a short, intensive antibiotic treatment. A Phase I study in healthy volunteers and a Phase II study in people with TB infec-tion have demonstrated a good safety profile and found the vaccine to be immunogenic at all studied doses. A Phase IIa study in patients with MDR-TB is ongoing in Eastern Europe, and a Phase IIb study in patients with drug-sus-ceptible TB and MDR-TB has been authorized in India.
TB/FLU-04L TB/FLU-04L is a mucosal-vectored vaccine based on an attenuated replication-deficient influenza virus vector expressing antigens Ag85A and ESAT-6. It was designed as a prophylactic boost vaccine for infants, adolescents and adults. A Phase IIa trial in people with TB infection is being implemented.
VPM1002VPM1002 is a live recombinant vaccine. A Phase II trial to assess the safety and immunogenicity of the vaccine in HIV-exposed and unexposed neonates in South Africa has been completed successfully, and a subsequent Phase III trial is currently underway. A Phase II/III trial for pre-vention of TB recurrence in adults is being implemented in India. A Phase III trial in India to evaluate the effica-cy and safety of VPM1002 in preventing pulmonary TB among healthy household contacts of sputum smear-pos-itive TB patients is also underway.
MIP/ImmuvacMIP, also known as Immuvac, is a heat-killed M. indi-cus pranii vaccine. It has been approved by the drug controller general of India and the FDA as an immuno-therapeutic and immunoprophylactic agent for treating multibacillary leprosy patients (as an adjunct to standard multidrug therapy), and for preventing the development of leprosy among close contacts of leprosy patients. A Phase III trial to assess the efficacy and safety of Immuvac in preventing pulmonary TB among healthy household contacts of sputum smear-positive TB patients is being implemented in India by the Indian Council of Medical Research.
193 GLOBAL TUBERCULOSIS REPORT 2020
References 1 Moscow Declaration to End TB; First WHO global ministerial conference on ending TB in the sustainable
development era: a multisectoral response. Geneva: World Health Organization and the Ministry of Health of the Russian Federation; 2017 (https://www.who.int/tb/features_archive/Moscow_Declaration_to_End_TB_final_ENGLISH.pdf?ua=1, accessed 28 June 2019).
2 United Nations General Assembly. Resolution 73/3: Political declaration of the high-level meeting of the General Assembly on the fight against tuberculosis. United Nations; 2018 (https://www.un.org/en/ga/search/view_doc.asp?symbol=A/RES/73/3, accessed 28 June 2019).
3 Preparation for a high-level meeting of the General Assembly on ending tuberculosis (WHA7.13), Seventy-first World Health Assembly. Geneva: World Health Organization; 2018 (https://apps.who.int/gb/ebwha/pdf_files/WHA71/A71_R3-en.pdf, accessed 29 July 2020).
4 Global tuberculosis report 2019. Geneva: World Health Organization; 2019 (https://www.who.int/tb/publications/global_report/en/, accessed 29 July 2020).
5 Global strategy for tuberculosis research and innovation (WHA73.3), Seventy-third World Health Assembly Geneva: World Health Organization; 2020 (https://apps.who.int/gb/ebwha/pdf_files/WHA73/A73_R3-en.pdf, accessed 1 September 2020).
6 Chamada MS-SCTIE-Decit / CNPq Nº 33/2019 - Pesquisas em Tuberculose no âmbito do BRICS Brasília Ministério da Ciência, Tecnologia e Inovações; 2019 ( http://www.cnpq.br/web/guest/chamadas-publicas?p_p_id=resultadosportlet_WAR_resultadoscnpqportlet_INSTANCE_0ZaM&filtro=encerradas&detalha=chamadaDivulgada&idDivulgacao=9322, accessed 1 September 2020).
7 Treatment Action Group, Stop TB Partnership. Tuberculosis research funding trends 2005–2018. New York: Treatment Action Group; 2019 (https://www.treatmentactiongroup.org/resources/tbrd-report/tbrd-report-2019/, accessed 22 July 2020).
8 Compendium of TB/COVID-19 studies. Geneva: World Health Organization; 2020 (https://www.who.int/teams/global-tuberculosis-programme/covid-19/compendium, accessed 29 July 2020).
9 Digital health for the End TB Strategy: an agenda for action (WHO/HTM/TB/2015.21). Geneva: WHO; 2015 (https://www.who.int/tb/publications/digitalhealth-TB-agenda/en/, accessed 29 July 2020).
10 Implementation Research for digital technologies and TB (IR4DTB): A toolkit for evaluating the implementation and scale-up of digital innovations across the TB continuum of care Geneva: TDR; 2020 (https://www.ir4dtb.org/, accessed 15 September 2020).
11 Implementation research toolkit. Geneva: TDR; 2014 (https://www.who.int/tdr/publications/topics/ir-toolkit/en/, accessed 5 August 2020).
12 WHO consolidated guidelines on tuberculosis, Module 3: Diagnosis – rapid diagnostics for tuberculosis detection. Geneva: World Health Organization; 2020 (https://www.who.int/publications/i/item/who-consolidated-guidelines-on-tuberculosis-module-3-diagnosis---rapid-diagnostics-for-tuberculosis-detection, accessed 29 July 2020).
13 Chest radiography in tuberculosis detection: summary of current WHO recommendations and guidance on programmatic approaches. Geneva: World Health Organization; 2016 (https://www.who.int/tb/publications/chest-radiography/en/, accessed 29 July 2020).
14 The use of bedaquiline in the treatment of multidrug-resistant tuberculosis: interim policy guidance (WHO/HTM/TB/2013.6). Geneva: World Health Organization; 2013 (https://apps.who.int/iris/bitstream/10665/84879/1/9789241505482_eng.pdf, accessed 29 July 2020).
15 Report of the Guideline Development Group Meeting on the use of bedaquiline in the treatment of multidrug-resistant tuberculosis: a review of available evidence (2016)(WHO/HTM/TB/2017.01). Geneva: World Health Organization; 2016 (https://apps.who.int/iris/bitstream/10665/254712/1/WHO-HTM-TB-2017.01-eng.pdf, accessed 29 July 2020).
16 WHO consolidated guidelines on tuberculosis, module 4: treatment – drug-resistant tuberculosis treatment. Geneva: World Health Organization; 2020 (https://www.who.int/publications/i/item/9789240007048, accessed 22 June 2020).
17 Moodley R, Godec TR, Team ST. Short-course treatment for multidrug-resistant tuberculosis: the STREAM trials. Eur Respir Rev. 2016;25(139):29–35 (https://www.ncbi.nlm.nih.gov/pubmed/26929418, accessed 29 July 2020).
GLOBAL TUBERCULOSIS REPORT 2020 194
18 The use of delamanid in the treatment of multidrug-resistant tuberculosis: interim policy guidance (WHO/HTM/TB/2014.23). Geneva: World Health Organization; 2014 (https://apps.who.int/iris/bitstream/handle/10665/137334/WHO_HTM_TB_2014.23_eng.pdf?sequence=1, accessed 29 July 2020).
19 The use of delamanid in the treatment of multidrug-resistant tuberculosis in children and adolescents: interim policy guidance (WHO/HTM/TB/2016.14). Geneva: World Health Organization; 2016 (https://apps.who.int/iris/bitstream/10665/250614/1/9789241549899-eng.pdf, accessed 29 July 2020).
20 WHO position statement on the use of delamanid for multidrug-resistant tuberculosis (WHO/CDS/TB/2018.1). Geneva: World Health Organization; 2018 (https://www.who.int/tb/publications/2018/WHOPositionStatementDelamanidUse.pdf, accessed 29 July 2020).
21 Boeree MJ, Heinrich N, Aarnoutse R, Diacon AH, Dawson R, Rehal S et al. High-dose rifampicin, moxifloxacin, and SQ109 for treating tuberculosis: a multi-arm, multi-stage randomised controlled trial. Lancet Infect Dis. 2017;17(1):39–49 (https://www.ncbi.nlm.nih.gov/pubmed/28100438, accessed 29 July 2020).
22 Dian S, Yunivita V, Ganiem AR, Pramaesya T, Chaidir L, Wahyudi K et al. Double-blind, randomized, placebo-controlled phase II dose-finding study to evaluate high-dose rifampin for tuberculous meningitis. Antimirob Agents Chemother. 2018;62(12)(https://pubmed.ncbi.nlm.nih.gov/30224533/, accessed 5 August 2020).
23 Nunn AJ, Rusen I, Van Deun A, Torrea G, Phillips PP, Chiang C-Y et al. Evaluation of a standardized treatment regimen of anti-tuberculosis drugs for patients with multi-drug-resistant tuberculosis (STREAM): study protocol for a randomized controlled trial. Trials. 2014;15(1):353 (https://pubmed.ncbi.nlm.nih.gov/25199531/, accessed 5 August 2020).
24 Landmark deal secures significant discount on price of medicine to prevent TB. Geneva: Unitaid; 2019 (https://unitaid.org/news-blog/landmark-deal-secures-significant-discount-on-price-of-medicine-to-prevent-tb/, accessed 5 August 2020).
25 Target product profiles for tuberculosis preventive treatment. Geneva: World Health Organization; 2020 (https://www.who.int/publications/i/item/target-product-profiles-for-tuberculosis-preventive-treatment, accessed 5 August 2020).
26 Tuberculosis prevention for high-risk groups. Geneva: Unitaid; 2017 (https://unitaid.org/project/tuberculosis-prevention-high-risk-groups-impaact4tb/#en, accessed 5 August 2020).
27 Dooley KE, Savic R, Gupte A, Marzinke MA, Zhang N, Edward VA et al. Once-weekly rifapentine and isoniazid for tuberculosis prevention in patients with HIV taking dolutegravir-based antiretroviral therapy: a phase 1/2 trial. Lancet HIV. 2020;7(6):e401–e9 (https://pubmed.ncbi.nlm.nih.gov/32240629/, accessed 5 August 2020).
28 Tait DR, Hatherill M, Van Der Meeren O, Ginsberg AM, Van Brakel E, Salaun B et al. Final analysis of a trial of M72/AS01E vaccine to prevent tuberculosis. N Eng J Med. 2019;381(25):2429–39 (https://pubmed.ncbi.nlm.nih.gov/31661198/, accessed 5 August 2020).
29 WHO Preferred Product Characteristics for New Tuberculosis Vaccine. Geneva: World Health Organization; 2018 (https://www.who.int/immunization/documents/who_ivb_18.06/en/, accessed.
30 Bekker L-G, Dintwe O, Fiore-Gartland A, Middelkoop K, Hutter J, Williams A et al. A phase 1b randomized study of the safety and immunological responses to vaccination with H4: IC31, H56: IC31, and BCG revaccination in Mycobacterium tuberculosis-uninfected adolescents in Cape Town, South Africa. EClinicalMedicine. 2020;21:100313 (https://pubmed.ncbi.nlm.nih.gov/32382714/, accessed 5 August 2020).

195 GLOBAL TUBERCULOSIS REPORT 2020
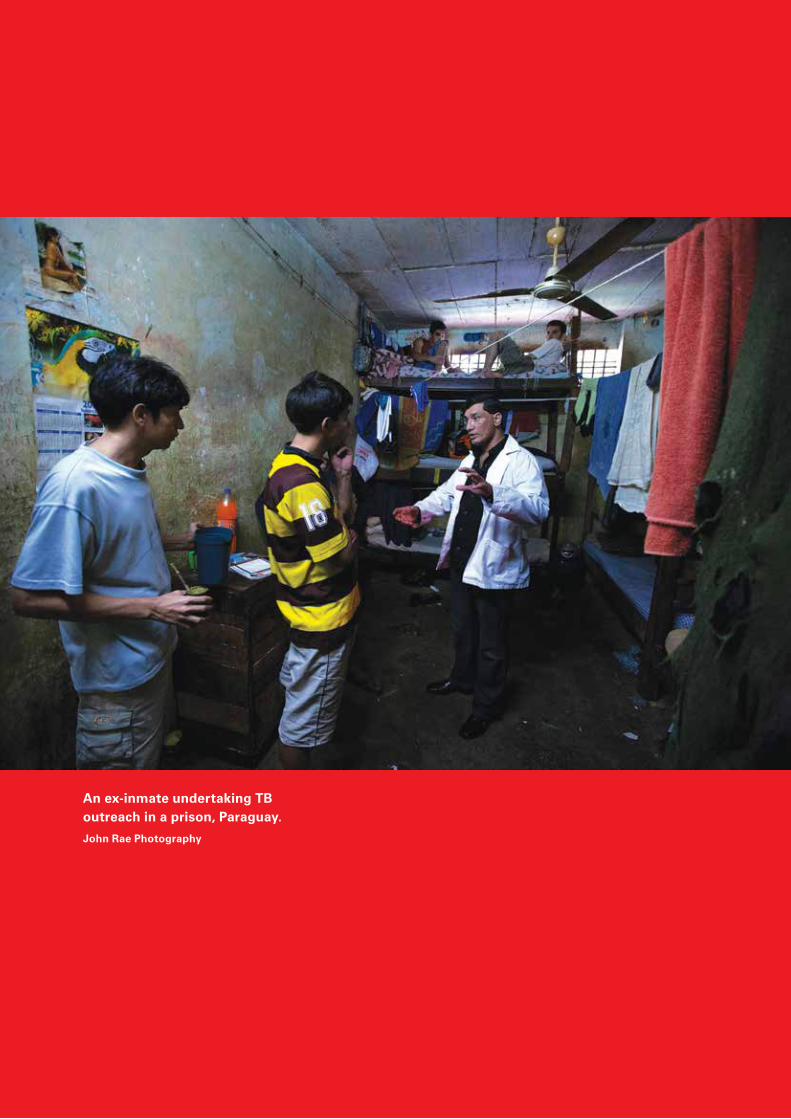
GLOBAL TUBERCULOSIS REPORT 2020 196
An ex-inmate undertaking TB outreach in a prison, Paraguay.John Rae Photography
197 GLOBAL TUBERCULOSIS REPORT 2020
Annex 1
The WHO global TB database
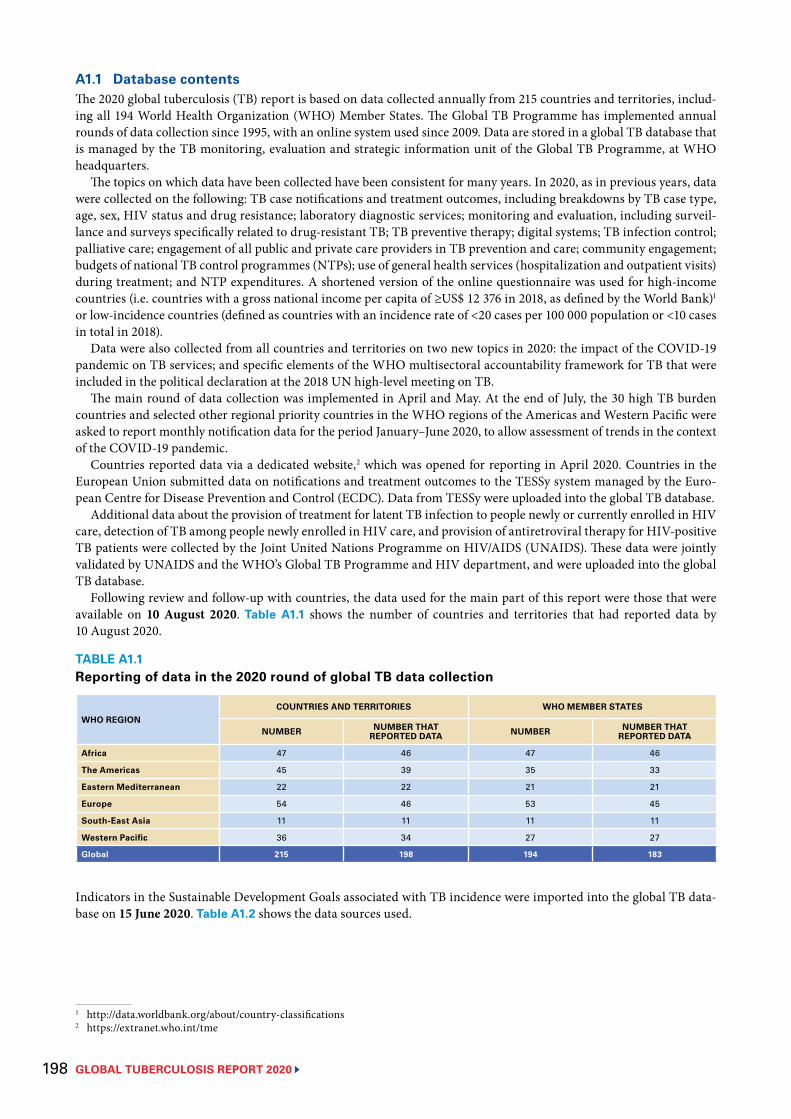
GLOBAL TUBERCULOSIS REPORT 2020 198
A1.1 Database contentsThe 2020 global tuberculosis (TB) report is based on data collected annually from 215 countries and territories, includ-ing all 194 World Health Organization (WHO) Member States. The Global TB Programme has implemented annual rounds of data collection since 1995, with an online system used since 2009. Data are stored in a global TB database that is managed by the TB monitoring, evaluation and strategic information unit of the Global TB Programme, at WHO headquarters.
The topics on which data have been collected have been consistent for many years. In 2020, as in previous years, data were collected on the following: TB case notifications and treatment outcomes, including breakdowns by TB case type, age, sex, HIV status and drug resistance; laboratory diagnostic services; monitoring and evaluation, including surveil-lance and surveys specifically related to drug-resistant TB; TB preventive therapy; digital systems; TB infection control; palliative care; engagement of all public and private care providers in TB prevention and care; community engagement; budgets of national TB control programmes (NTPs); use of general health services (hospitalization and outpatient visits) during treatment; and NTP expenditures. A shortened version of the online questionnaire was used for high-income countries (i.e. countries with a gross national income per capita of ≥US$ 12 376 in 2018, as defined by the World Bank)1 or low-incidence countries (defined as countries with an incidence rate of <20 cases per 100 000 population or <10 cases in total in 2018).
Data were also collected from all countries and territories on two new topics in 2020: the impact of the COVID-19 pandemic on TB services; and specific elements of the WHO multisectoral accountability framework for TB that were included in the political declaration at the 2018 UN high-level meeting on TB.
The main round of data collection was implemented in April and May. At the end of July, the 30 high TB burden countries and selected other regional priority countries in the WHO regions of the Americas and Western Pacific were asked to report monthly notification data for the period January–June 2020, to allow assessment of trends in the context of the COVID-19 pandemic.
Countries reported data via a dedicated website,2 which was opened for reporting in April 2020. Countries in the European Union submitted data on notifications and treatment outcomes to the TESSy system managed by the Euro-pean Centre for Disease Prevention and Control (ECDC). Data from TESSy were uploaded into the global TB database.
Additional data about the provision of treatment for latent TB infection to people newly or currently enrolled in HIV care, detection of TB among people newly enrolled in HIV care, and provision of antiretroviral therapy for HIV-positive TB patients were collected by the Joint United Nations Programme on HIV/AIDS (UNAIDS). These data were jointly validated by UNAIDS and the WHO’s Global TB Programme and HIV department, and were uploaded into the global TB database.
Following review and follow-up with countries, the data used for the main part of this report were those that were available on 10 August 2020. Table A1.1 shows the number of countries and territories that had reported data by 10 August 2020.
Indicators in the Sustainable Development Goals associated with TB incidence were imported into the global TB data-base on 15 June 2020. Table A1.2 shows the data sources used.
1 http://data.worldbank.org/about/country-classifications2 https://extranet.who.int/tme
TABLE A1.1Reporting of data in the 2020 round of global TB data collection
WHO REGIONCOUNTRIES AND TERRITORIES WHO MEMBER STATES
NUMBER NUMBER THAT REPORTED DATA NUMBER NUMBER THAT
REPORTED DATA
Africa 47 46 47 46
The Americas 45 39 35 33
Eastern Mediterranean 22 22 21 21
Europe 54 46 53 45
South-East Asia 11 11 11 11
Western Pacific 36 34 27 27
Global 215 198 194 183
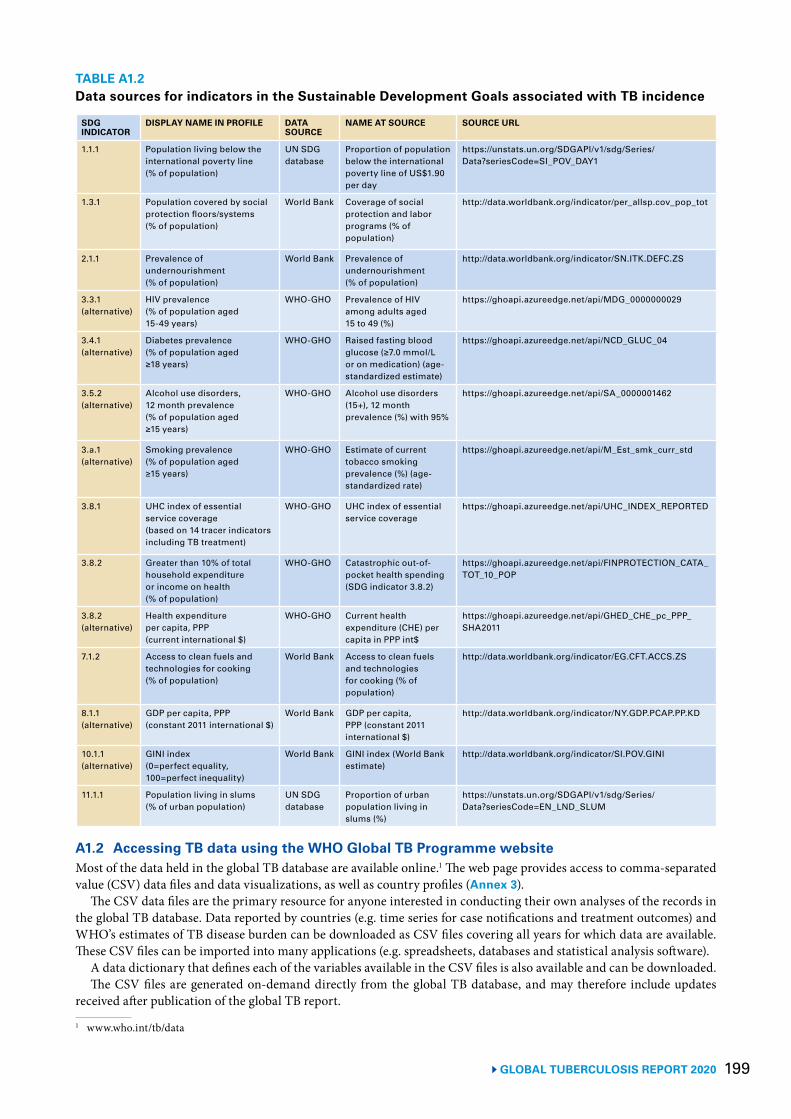
199 GLOBAL TUBERCULOSIS REPORT 2020
TABLE A1.2Data sources for indicators in the Sustainable Development Goals associated with TB incidence
SDG INDICATOR
DISPLAY NAME IN PROFILE DATA SOURCE
NAME AT SOURCE SOURCE URL
1.1.1 Population living below the international poverty line (% of population)
UN SDG database
Proportion of population below the international poverty line of US$1.90 per day
https://unstats.un.org/SDGAPI/v1/sdg/Series/Data?seriesCode=SI_POV_DAY1
1.3.1 Population covered by social protection floors/systems (% of population)
World Bank Coverage of social protection and labor programs (% of population)
http://data.worldbank.org/indicator/per_allsp.cov_pop_tot
2.1.1 Prevalence of undernourishment (% of population)
World Bank Prevalence of undernourishment (% of population)
http://data.worldbank.org/indicator/SN.ITK.DEFC.ZS
3.3.1 (alternative)
HIV prevalence (% of population aged 15-49 years)
WHO-GHO Prevalence of HIV among adults aged 15 to 49 (%)
https://ghoapi.azureedge.net/api/MDG_0000000029
3.4.1 (alternative)
Diabetes prevalence (% of population aged ≥18 years)
WHO-GHO Raised fasting blood glucose (≥7.0 mmol/L or on medication) (age-standardized estimate)
https://ghoapi.azureedge.net/api/NCD_GLUC_04
3.5.2 (alternative)
Alcohol use disorders, 12 month prevalence (% of population aged ≥15 years)
WHO-GHO Alcohol use disorders (15+), 12 month prevalence (%) with 95%
https://ghoapi.azureedge.net/api/SA_0000001462
3.a.1 (alternative)
Smoking prevalence (% of population aged ≥15 years)
WHO-GHO Estimate of current tobacco smoking prevalence (%) (age-standardized rate)
https://ghoapi.azureedge.net/api/M_Est_smk_curr_std
3.8.1 UHC index of essential service coverage (based on 14 tracer indicators including TB treatment)
WHO-GHO UHC index of essential service coverage
https://ghoapi.azureedge.net/api/UHC_INDEX_REPORTED
3.8.2 Greater than 10% of total household expenditure or income on health (% of population)
WHO-GHO Catastrophic out-of-pocket health spending (SDG indicator 3.8.2)
https://ghoapi.azureedge.net/api/FINPROTECTION_CATA_TOT_10_POP
3.8.2(alternative)
Health expenditure per capita, PPP (current international $)
WHO-GHO Current health expenditure (CHE) per capita in PPP int$
https://ghoapi.azureedge.net/api/GHED_CHE_pc_PPP_SHA2011
7.1.2 Access to clean fuels and technologies for cooking (% of population)
World Bank Access to clean fuels and technologies for cooking (% of population)
http://data.worldbank.org/indicator/EG.CFT.ACCS.ZS
8.1.1 (alternative)
GDP per capita, PPP (constant 2011 international $)
World Bank GDP per capita, PPP (constant 2011 international $)
http://data.worldbank.org/indicator/NY.GDP.PCAP.PP.KD
10.1.1 (alternative)
GINI index (0=perfect equality, 100=perfect inequality)
World Bank GINI index (World Bank estimate)
http://data.worldbank.org/indicator/SI.POV.GINI
11.1.1 Population living in slums (% of urban population)
UN SDG database
Proportion of urban population living in slums (%)
https://unstats.un.org/SDGAPI/v1/sdg/Series/Data?seriesCode=EN_LND_SLUM
A1.2 Accessing TB data using the WHO Global TB Programme website Most of the data held in the global TB database are available online.1 The web page provides access to comma-separated value (CSV) data files and data visualizations, as well as country profiles (Annex 3).
The CSV data files are the primary resource for anyone interested in conducting their own analyses of the records in the global TB database. Data reported by countries (e.g. time series for case notifications and treatment outcomes) and WHO’s estimates of TB disease burden can be downloaded as CSV files covering all years for which data are available. These CSV files can be imported into many applications (e.g. spreadsheets, databases and statistical analysis software).
A data dictionary that defines each of the variables available in the CSV files is also available and can be downloaded.The CSV files are generated on-demand directly from the global TB database, and may therefore include updates
received after publication of the global TB report.
1 www.who.int/tb/data
GLOBAL TUBERCULOSIS REPORT 2020 200
A1.3 Accessing TB data using the WHO Global Health ObservatoryThe WHO Global Health Observatory (GHO)1 is a portal that provides access to data and analyses for monitoring the global health situation; it includes a data repository.
Data from WHO’s global TB database can be viewed, filtered, aggregated and downloaded from within the GHO data repository.2
There is also an application programme interface (API)3 using the open data protocol. The API allows analysts and programmers to use GHO data directly in their software applications.
1 www.who.int/data/gho2 www.who.int/data/gho/data/themes/tuberculosis3 www.who.int/data/gho/info/gho-odata-api

201 GLOBAL TUBERCULOSIS REPORT 2020
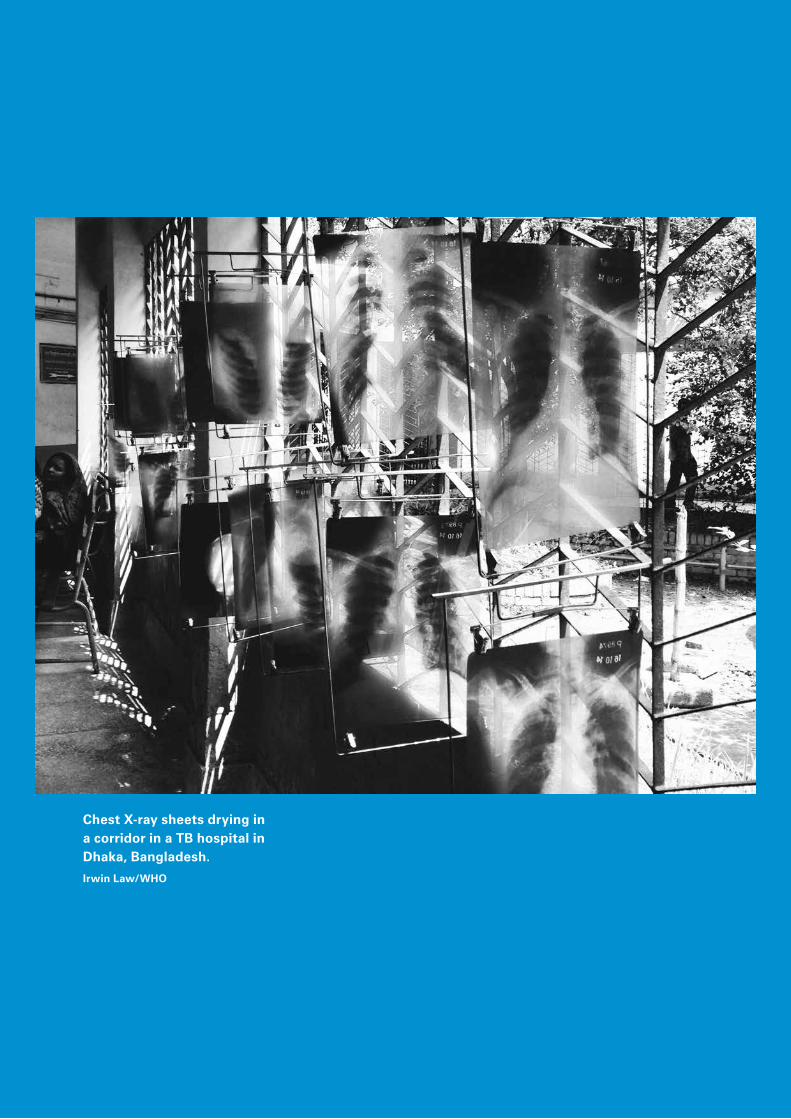
GLOBAL TUBERCULOSIS REPORT 2020 202
Chest X-ray sheets drying in a corridor in a TB hospital in Dhaka, Bangladesh. Irwin Law/WHO
203 GLOBAL TUBERCULOSIS REPORT 2020
Annex 2
Lists of high-burden countries defined by WHO for the period 2016–2020
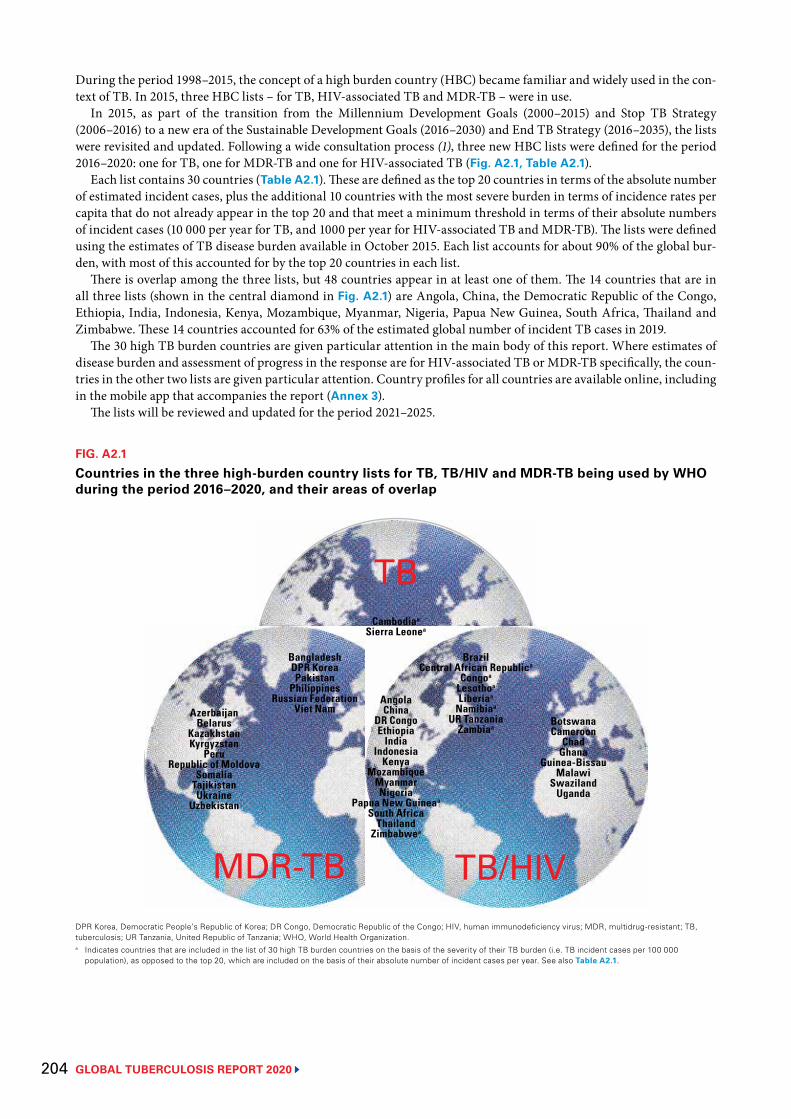
GLOBAL TUBERCULOSIS REPORT 2020 204
During the period 1998–2015, the concept of a high burden country (HBC) became familiar and widely used in the con-text of TB. In 2015, three HBC lists – for TB, HIV-associated TB and MDR-TB – were in use.
In 2015, as part of the transition from the Millennium Development Goals (2000–2015) and Stop TB Strategy (2006–2016) to a new era of the Sustainable Development Goals (2016–2030) and End TB Strategy (2016–2035), the lists were revisited and updated. Following a wide consultation process (1), three new HBC lists were defined for the period 2016–2020: one for TB, one for MDR-TB and one for HIV-associated TB (Fig. A2.1, Table A2.1).
Each list contains 30 countries (Table A2.1). These are defined as the top 20 countries in terms of the absolute number of estimated incident cases, plus the additional 10 countries with the most severe burden in terms of incidence rates per capita that do not already appear in the top 20 and that meet a minimum threshold in terms of their absolute numbers of incident cases (10 000 per year for TB, and 1000 per year for HIV-associated TB and MDR-TB). The lists were defined using the estimates of TB disease burden available in October 2015. Each list accounts for about 90% of the global bur-den, with most of this accounted for by the top 20 countries in each list.
There is overlap among the three lists, but 48 countries appear in at least one of them. The 14 countries that are in all three lists (shown in the central diamond in Fig. A2.1) are Angola, China, the Democratic Republic of the Congo, Ethiopia, India, Indonesia, Kenya, Mozambique, Myanmar, Nigeria, Papua New Guinea, South Africa, Thailand and Zimbabwe. These 14 countries accounted for 63% of the estimated global number of incident TB cases in 2019.
The 30 high TB burden countries are given particular attention in the main body of this report. Where estimates of disease burden and assessment of progress in the response are for HIV-associated TB or MDR-TB specifically, the coun-tries in the other two lists are given particular attention. Country profiles for all countries are available online, including in the mobile app that accompanies the report (Annex 3).
The lists will be reviewed and updated for the period 2021–2025.
FIG. A2.1
Countries in the three high-burden country lists for TB, TB/HIV and MDR-TB being used by WHO during the period 2016–2020, and their areas of overlap
DPR Korea, Democratic People’s Republic of Korea; DR Congo, Democratic Republic of the Congo; HIV, human immunodeficiency virus; MDR, multidrug-resistant; TB, tuberculosis; UR Tanzania, United Republic of Tanzania; WHO, World Health Organization.a Indicates countries that are included in the list of 30 high TB burden countries on the basis of the severity of their TB burden (i.e. TB incident cases per 100 000
population), as opposed to the top 20, which are included on the basis of their absolute number of incident cases per year. See also Table A2.1.
TB
MDR-TB TB/HIV
BotswanaCameroon
ChadGhana
Guinea-BissauMalawi
SwazilandUganda
BrazilCentral African Republica
Congoa
Lesothoa
Liberiaa
Namibiaa
UR TanzaniaZambiaa
Cambodiaa
Sierra Leonea
AngolaChina
DR CongoEthiopia
IndiaIndonesia
KenyaMozambique
MyanmarNigeria
Papua New Guineaa
South AfricaThailand
Zimbabwea
BangladeshDPR KoreaPakistan
PhilippinesRussian Federation
Viet NamAzerbaijanBelarus
KazakhstanKyrgyzstan
PeruRepublic of Moldova
SomaliaTajikistanUkraine
Uzbekistan
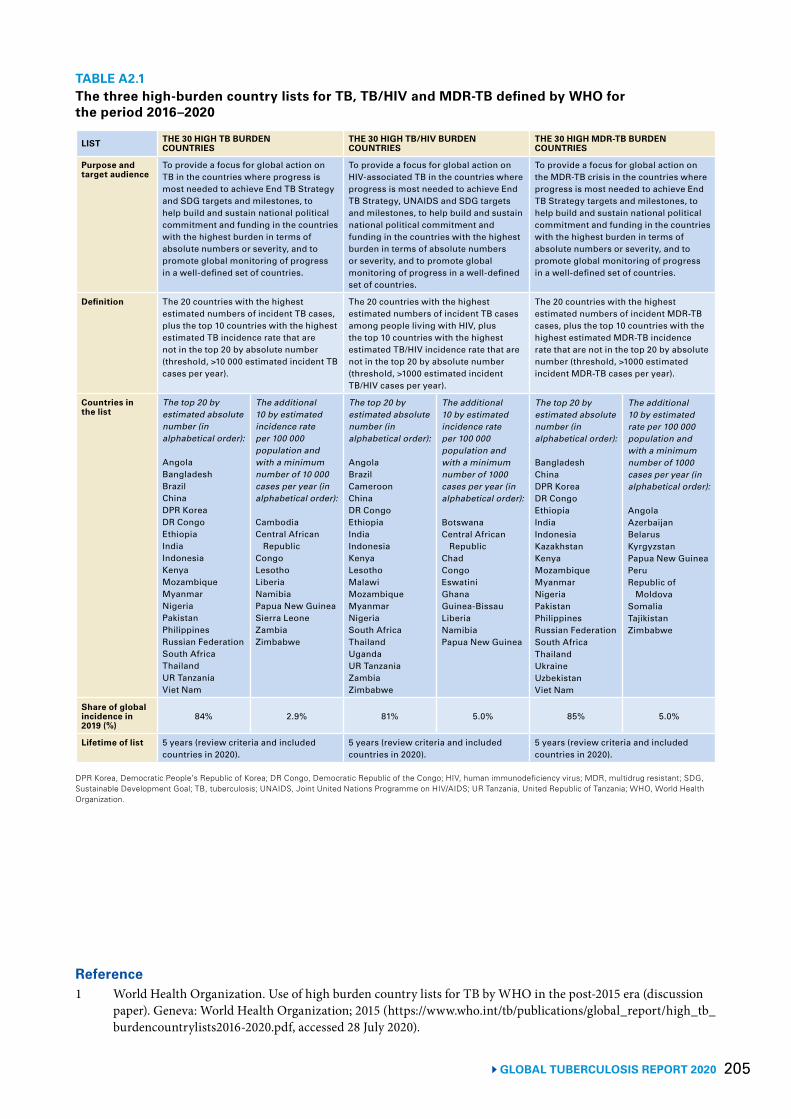
205 GLOBAL TUBERCULOSIS REPORT 2020
TABLE A2.1 The three high-burden country lists for TB, TB/HIV and MDR-TB defined by WHO for the period 2016–2020
LIST THE 30 HIGH TB BURDEN COUNTRIES
THE 30 HIGH TB/HIV BURDEN COUNTRIES
THE 30 HIGH MDR-TB BURDEN COUNTRIES
Purpose and target audience
To provide a focus for global action on TB in the countries where progress is most needed to achieve End TB Strategy and SDG targets and milestones, to help build and sustain national political commitment and funding in the countries with the highest burden in terms of absolute numbers or severity, and to promote global monitoring of progress in a well-defined set of countries.
To provide a focus for global action on HIV-associated TB in the countries where progress is most needed to achieve End TB Strategy, UNAIDS and SDG targets and milestones, to help build and sustain national political commitment and funding in the countries with the highest burden in terms of absolute numbers or severity, and to promote global monitoring of progress in a well-defined set of countries.
To provide a focus for global action on the MDR-TB crisis in the countries where progress is most needed to achieve End TB Strategy targets and milestones, to help build and sustain national political commitment and funding in the countries with the highest burden in terms of absolute numbers or severity, and to promote global monitoring of progress in a well-defined set of countries.
Definition The 20 countries with the highest estimated numbers of incident TB cases, plus the top 10 countries with the highest estimated TB incidence rate that are not in the top 20 by absolute number (threshold, >10 000 estimated incident TB cases per year).
The 20 countries with the highest estimated numbers of incident TB cases among people living with HIV, plus the top 10 countries with the highest estimated TB/HIV incidence rate that are not in the top 20 by absolute number (threshold, >1000 estimated incident TB/HIV cases per year).
The 20 countries with the highest estimated numbers of incident MDR-TB cases, plus the top 10 countries with the highest estimated MDR-TB incidence rate that are not in the top 20 by absolute number (threshold, >1000 estimated incident MDR-TB cases per year).
Countries in the list
The top 20 by estimated absolute number (in alphabetical order):
AngolaBangladeshBrazilChinaDPR KoreaDR CongoEthiopiaIndiaIndonesiaKenyaMozambiqueMyanmarNigeriaPakistanPhilippinesRussian FederationSouth AfricaThailandUR Tanzania Viet Nam
The additional 10 by estimated incidence rate per 100 000 population and with a minimum number of 10 000 cases per year (in alphabetical order):
CambodiaCentral African
RepublicCongoLesothoLiberiaNamibiaPapua New GuineaSierra LeoneZambiaZimbabwe
The top 20 by estimated absolute number (in alphabetical order):
AngolaBrazilCameroonChinaDR CongoEthiopiaIndiaIndonesiaKenyaLesothoMalawiMozambiqueMyanmarNigeriaSouth AfricaThailandUgandaUR TanzaniaZambiaZimbabwe
The additional 10 by estimated incidence rate per 100 000 population and with a minimum number of 1000 cases per year (in alphabetical order):
BotswanaCentral African
RepublicChadCongoEswatiniGhanaGuinea-BissauLiberiaNamibiaPapua New Guinea
The top 20 by estimated absolute number (in alphabetical order):
BangladeshChinaDPR KoreaDR CongoEthiopiaIndiaIndonesiaKazakhstanKenyaMozambiqueMyanmarNigeriaPakistanPhilippinesRussian FederationSouth AfricaThailandUkraineUzbekistanViet Nam
The additional 10 by estimated rate per 100 000 population and with a minimum number of 1000 cases per year (in alphabetical order):
AngolaAzerbaijanBelarusKyrgyzstanPapua New GuineaPeruRepublic of
MoldovaSomaliaTajikistanZimbabwe
Share of global incidence in 2019 (%)
84% 2.9% 81% 5.0% 85% 5.0%
Lifetime of list 5 years (review criteria and included countries in 2020).
5 years (review criteria and included countries in 2020).
5 years (review criteria and included countries in 2020).
DPR Korea, Democratic People’s Republic of Korea; DR Congo, Democratic Republic of the Congo; HIV, human immunodeficiency virus; MDR, multidrug resistant; SDG, Sustainable Development Goal; TB, tuberculosis; UNAIDS, Joint United Nations Programme on HIV/AIDS; UR Tanzania, United Republic of Tanzania; WHO, World Health Organization.
Reference1 World Health Organization. Use of high burden country lists for TB by WHO in the post-2015 era (discussion
paper). Geneva: World Health Organization; 2015 (https://www.who.int/tb/publications/global_report/high_tb_burdencountrylists2016-2020.pdf, accessed 28 July 2020).
GLOBAL TUBERCULOSIS REPORT 2020 206
Global, regional and country data (including profiles) are available at your fingertips with the Global TB Report app. It can be downloaded free of charge and content is available in multiple languages.
207 GLOBAL TUBERCULOSIS REPORT 2020
Annex 3
Country, regional and global profiles
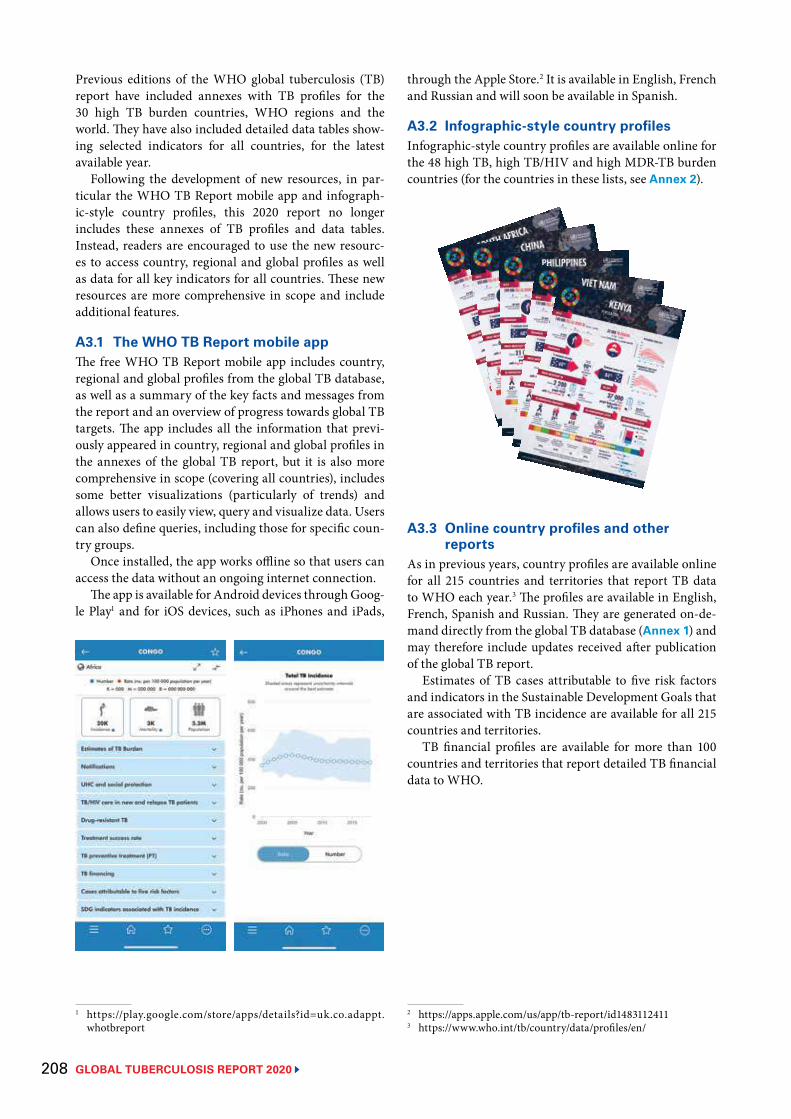
GLOBAL TUBERCULOSIS REPORT 2020 208
Previous editions of the WHO global tuberculosis (TB) report have included annexes with TB profiles for the 30 high TB burden countries, WHO regions and the world. They have also included detailed data tables show-ing selected indicators for all countries, for the latest available year.
Following the development of new resources, in par-ticular the WHO TB Report mobile app and infograph-ic-style country profiles, this 2020 report no longer includes these annexes of TB profiles and data tables. Instead, readers are encouraged to use the new resourc-es to access country, regional and global profiles as well as data for all key indicators for all countries. These new resources are more comprehensive in scope and include additional features.
A3.1 The WHO TB Report mobile appThe free WHO TB Report mobile app includes country, regional and global profiles from the global TB database, as well as a summary of the key facts and messages from the report and an overview of progress towards global TB targets. The app includes all the information that previ-ously appeared in country, regional and global profiles in the annexes of the global TB report, but it is also more comprehensive in scope (covering all countries), includes some better visualizations (particularly of trends) and allows users to easily view, query and visualize data. Users can also define queries, including those for specific coun-try groups.
Once installed, the app works offline so that users can access the data without an ongoing internet connection.
The app is available for Android devices through Goog-le Play1 and for iOS devices, such as iPhones and iPads,
1 https://play.google.com/store/apps/details?id=uk.co.adappt.whotbreport
through the Apple Store.2 It is available in English, French and Russian and will soon be available in Spanish.
A3.2 Infographic-style country profilesInfographic-style country profiles are available online for the 48 high TB, high TB/HIV and high MDR-TB burden countries (for the countries in these lists, see Annex 2).
A3.3 Online country profiles and other reports
As in previous years, country profiles are available online for all 215 countries and territories that report TB data to WHO each year.3 The profiles are available in English, French, Spanish and Russian. They are generated on-de-mand directly from the global TB database (Annex 1) and may therefore include updates received after publication of the global TB report.
Estimates of TB cases attributable to five risk factors and indicators in the Sustainable Development Goals that are associated with TB incidence are available for all 215 countries and territories.
TB financial profiles are available for more than 100 countries and territories that report detailed TB financial data to WHO.
2 https://apps.apple.com/us/app/tb-report/id14831124113 https://www.who.int/tb/country/data/profiles/en/

Related Documents