Journal of African Development (2016) 18:1–30 Global Trends in Gender Equality Stephanie Seguino 1 Abstract This paper assesses country and regional trends in gender inequality since 1990 in three domains: capabilities, livelihoods, and agency. The data offer evidence of substantial improvements in education, a component of the capabilities domain. There has been some modest but uneven progress in the livelihoods domain, particularly with regard to employment. In contrast, there is a reversal in progress towards job integration, as evidenced by a decline in the ratio of the share of women employed in the industrial sector relative to men. Also, global stress in labor markets has reduced men’s access to employment in some countries, making the progress to date potentially gender conflictive. Agency, measured as the female share of parliamentary seats, has also made only modest progress. These results suggest the need for an expanded focus beyond just educational equality to livelihoods, where gender gaps are wider than in education and stubbornly persistent. Keywords: Gender Inequality, domestic health, education, employment JEL Classification: I14, I24, J16 1. Introduction Gender is a primary marker of social and economic stratification, and, as a result, exclusion. Regardless of one’s socioeconomic class, there are systematic gender differences in material well-being although the degree of inequality varies across countries and over time. As a result, gender inequality is a characteristic of most societies, with males on average better positioned in social, economic, and political hierarchies. For more than two decades, the goal of reducing gender inequality has held a prominent place in international organizations and in national 1 The author gratefully acknowledges financial support from the UNDP. Anuradha Seth, Rolph van der Hoeven, Andrew Sumner, and Emanuele Sapienza provided very insightful comments on an earlier version of this paper. Stephanie Seguino Department of Economics, University of Vermont, USA. [email protected]

Welcome message from author
This document is posted to help you gain knowledge. Please leave a comment to let me know what you think about it! Share it to your friends and learn new things together.
Transcript
Journal of African Development (2016) 18:1–30
Global Trends in Gender Equality
Stephanie Seguino1
Abstract
This paper assesses country and regional trends in gender inequality since 1990 in three domains: capabilities, livelihoods, and agency. The data offer evidence of substantial improvements in education, a component of the capabilities domain. There has been some modest but uneven progress in the livelihoods domain, particularly with regard to employment. In contrast, there is a reversal in progress towards job integration, as evidenced by a decline in the ratio of the share of women employed in the industrial sector relative to men. Also, global stress in labor markets has reduced men’s access to employment in some countries, making the progress to date potentially gender conflictive. Agency, measured as the female share of parliamentary seats, has also made only modest progress. These results suggest the need for an expanded focus beyond just educational equality to livelihoods, where gender gaps are wider than in education and stubbornly persistent.
Keywords: Gender Inequality, domestic health, education, employment
JEL Classification: I14, I24, J16
1. Introduction
Gender is a primary marker of social and economic stratification, and, as a result, exclusion. Regardless of one’s socioeconomic class, there are systematic gender differences in material well-being although the degree of inequality varies across countries and over time. As a result, gender inequality is a characteristic of most societies, with males on average better positioned in social, economic, and political hierarchies. For more than two decades, the goal of reducing gender inequality has held a prominent place in international organizations and in national
1 The author gratefully acknowledges financial support from the UNDP. Anuradha Seth, Rolph van der Hoeven, Andrew Sumner, and Emanuele Sapienza provided very insightful comments on an earlier version of this paper.
Stephanie Seguino Department of Economics, University of Vermont, USA. [email protected]

10 Journal of African Development (2016) 18:1–30
strategy statements. Millennium Development Goal (MDG) 3, reflecting the global attention to the issue of gender inequality, provided the impetus for governments to work towards elimination of gender inequality in primary and secondary education by 2005, and all levels by 2015.2
Where do we stand today with regard to gender parity in well-being? This paper explores that question by examining trends in gender gaps in three key domains: capabilities, livelihoods, and agency.3 The first of these categories—capabilities—is of intrinsic value, and it also generates the pre-conditions for securing one’s economic well-being via engagement in production and economic decision-making. The second domain—livelihoods—is comprised of conditions that enable individuals to adequately provide for themselves and their families, and includes access to work, wages, access to credit, and asset ownership.4 The third domain—agency (or empowerment)—can be understood as the ability of individuals and the groups to which they belong to shape their environment. Thus gender equality in this domain would imply that women are equally agentic as men.5 Women’s share of managerial positions and trade union membership, and of leadership positions in cooperatives, businesses, and governing bodies are useful indicators in this domain.
This framework for analyzing global trends in inequality is based on the following premises. Equality of capabilities—that is, that women and men be on equal footing in terms of core functionings (education, health, and nutrition) is a key condition for gender equality in other domains. Further, in order to achieve economic equality, women should be on par with men in their ability to convert capabilities into secure livelihoods. While we lack gender-disaggregated data on income, we should be able to assess equality in this domain via data on gender gaps in access to jobs, credit, and property ownership rights. The third domain, agency, is related to empowerment and voice in decision-making in the major sites of resource allocation in society—the household, the workplace, and in governing bodies. With voice in these arenas, women might be able to influence the factors that lead to inequality in the capabilities or livelihoods domain. Unequal investments in girls’ education at the household level, for example, can be rectified with increased voice that ensures government resources are allocated to improve girls’ access to schooling. These three domains, therefore, are interrelated. Progress in one domain can leverage change in another. Further, progress in any one of these domains without progress in the others is inadequate to achieving the overall goal of gender equality.
The methodology adopted in this paper is to estimate gender inequality at the national and regional level. The motivation for focusing on country-level estimates is due to the role of
2 Sustainable Development Goal (SDG) 5 is broader than MDG 3. The goal “achieve gender equality and empower all women and girls” has several targets, including in the areas of violence against women, agency, discrimination, reproduc-tive heath, as well as women’s access to economic resources. 3 This framework is similar to Grown (2008). See, also, Grown et al. (2003). An important difference is that while Grown proposes measures of security in the third domain, here we emphasize agency. 4 Public sector expenditures are also important for capabilities and livelihoods. For example, social insurance and pro-tection supplement household income; publicly funded education and health care, and infrastructure investments improve capacities that can increase access to high quality work. Regulatory policies can improve livelihoods, also, including gender balance in parental leave policies, and other supports for care work. We lack, however, global data on gender budgeting at the national level. As a result, a focus only on livelihoods may fail to fully capture well-being in the live-lihood domain. That said, some of the effects of public spending and regulatory policies will be observed in the three domains explored here. For example, employment patterns will reflect care policies, affirmative action, and infrastructure investments that make it easier for women to engage in paid work. Other factors such as women’s “distress” sales of labor, in response to a fall in male income also influence employment, however, and so this proxy for well-being has its own weaknesses. As a result, the absence of data on public sector spending and regulation limits our ability to fully assess global trends in gender equality.5 The term agentic comes from social cognition theory and implies that individuals and groups are both producers and well as products of their social systems—that agents both react to social norms but can in turn shape norms and the gender system.

Journal of African Development (2016) 18:1–30 11
national policies in affecting gender inequality. Regional differences may tell us something about trends related to differences in culture and economic structures.6 This study departs from the methodology adopted by Dorius and Firebaugh (2010), who also evaluate global trends in gender inequality in education, mortality, political representation, and female share of non-agricultural wage earners. In their study, the authors use national data to calculate global inequality, a measure that is comparable to Branko Milanovic’s (2005) Concept 3 inequality, or what the authors call “true world inequality.”
Any approach to analyzing global trends in gender equality must be cognizant of the fact that not all gender disparities favor men. For example, trends in educational attainment in recent years indicate gender reversals in some countries, with women’s educational attainment exceeding men’s. Evidence of male disadvantage is important to identify for intrinsic reasons, and also because declines in men’s absolute well-being could lead to resistance to policies that promote gender equality. In promoting greater equality, whether by class, race, or gender, the most politically feasible strategy is to achieve this goal without lowering the standard of living of the dominant (male) group. This suggests that in evaluating gender trends in inequality, we also want to know whether greater gender equality has occurred in an environment of stagnating, declining, or rising male well-being. As noted in the consultation on the Post-2015 Development Agenda, “gender equality is not about transferring opportunities from men to women, but about realizing the rights of everyone, and creating conditions where all have the right and ability to realise their full human potential” (UNICEF and UN Women 2013: 35).
2. Trends in Gender Equality of Capabilities
The capabilities domain captures gender differences in the pre-conditions necessary for living a good life. Intergroup gender differences in capabilities condition the probabilities that females and males at the individual level will achieve particular levels of economic well-being. Here we focus on two indicators of capabilities—education and health—both considered essential prerequisites to well-being, laying the foundation for the ability to provision for self and family, and thus achieve economic security. Intergroup inequality in capabilities is important beyond the individual impacts that it embodies. That is because intergroup inequality contributes to the formation and perpetuation of norms and stereotypes that influence access to resources, livelihoods, and agency. Underinvestment in female education, for example, contributes to stereotypes about women’s relative intelligence and skills, regardless of those possessed by the individual woman.
A large time-series of global data is available to examine trends in three variables in the capabilities domain: 1) Total years of education of those 15 and older, 2) gross secondary school enrollment rates, and 3) life expectancy (relative to the maximum achievable by gender).7 Average total years of education is a stock variable that captures the cumulative societal effect of gender inequality in education. In contrast, (gross) secondary school enrollment rates are a flow variable, indicative of gender differences in the particular year in which the data are measured. Previous studies emphasize gender differences in literacy and primary school enrollment rates. This paper focuses on secondary school enrollment rates for two reasons. First, substantial progress has been made in closing gender gaps in literacy and
6 Regional trends should be viewed with some caution since very large differences often exist within regions. 7 See Table A.1. for a description of these and all other variables on which data are reported in this paper, as well as sources.
12 Journal of African Development (2016) 18:1–30
primary education, making it useful to shift focus to higher levels of education. Second, as economies change and move up the industrial ladder, secondary education is more likely than primary education to determine ability to participate in the paid economy
With regard to the health domain, gender differences in life expectancy reveal information about physical well-being and duration of life. Although some studies also examine data on maternal mortality rates, this analysis maintains a focus on variables that explicitly measure gender gaps (Permanyer 2013).
2.1. Education
This section examines total years of education of those 15 and older as a broad measure of educational achievement, using data from Barro and Lee (2010) for 1990 to 2010. It also examines gender differences in gross secondary enrollment rates for the same time period.
The data in Figure 1 exhibit trends in the ratio of average total years of female to male education for those 15 and older from 1990 to 2010 for 146 countries. This variable reflects the cumulative effect of educational inequality in a society. Panel A plots the distribution of the ratio of female-to-male (F/M) total years of education using a kernel density estimation procedure.8 The x-axis represents the F/M ratio of total average years of education in a country while the y-axis indicates the number of countries with a particular F/M ratio. As Panel A demonstrates, gender disparities in average total years of education have diminished over the past 20 years. The entire distribution has moved to the right, indicating the average (at the country level) F/M ratio has risen. The average F/M ratio of total years of education increased from 82 percent in 1990 to 91 percent in 2010. The share of countries with F/M ratios at or above 95 percent has risen from 33 percent in 1990 to 52 percent in 2010. Further, a large number of countries have achieved or are close to parity. This is evidenced by countries in the sample that are clustered around a value of 1, indicating equality in total years of education. At the other extreme, the percentage of countries in which the F/M ratio exceeds 1 has fallen. Overall, it is visually apparent that global gender inequality in total years of education is not only falling; we are also moving toward global convergence with a large number of countries at or close to parity.
Panel B plots the change in the F/M ratio of total years of education from 1990 to 2010 against the 1990 ratio. The negative correlation of these two variables shows that the countries that have made the greatest gains in narrowing educational gaps are those that started out with the widest gaps in 1990.
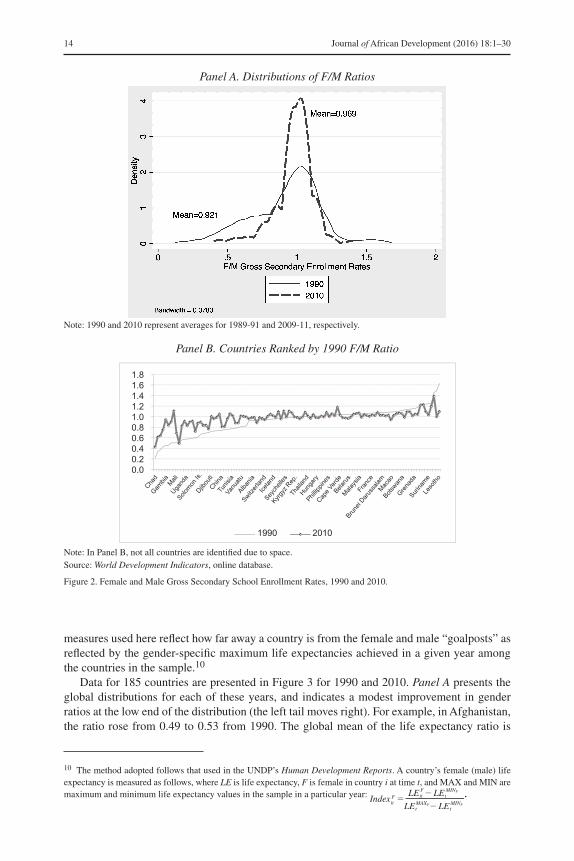
Figure 2 displays gross secondary enrollment rates with a comparison of gender trends from 1990 to 2010 for the 107 countries for which data are available. Panel A in Figure 2 illustrates the shift in the distribution of the F/M ratio of gross secondary enrollment rates from 1990 to 2010. The left tail has shifted to the right, indicating progress in the more unequal countries. Also, countries where the ratio had been greater than one in 1990 (in favor of females) have reverted to more gender equal outcomes (the right tail has shifted left). In fact, a large number of countries (almost 75 percent, compared to 60 percent in 1990) are now centered on a ratio of 1, indicating much greater global equality in secondary educational attainment.
Panel B describes in more detail the unevenness with which countries at the lower end of the distribution have improved gender outcomes. It is noteworthy that cases of retrogression (declines in the F/M ratio) are concentrated among countries that started out with ratios
8 Kernel density functions, such as the one shown here, are closely related to histograms, but differ in that the data are modified to achieve a smooth density function (curve).

Journal of African Development (2016) 18:1–30 13
close to or greater than1 in 1990.9 In sum, just as with total years of education, there is both greater gender equality in secondary school enrollment rates within countries and a global convergence of gender equality in secondary school enrollment rates of 0.99 in 2010, up from 0.93 in 1990. This is good news, and reflects solid progress as we move beyond parity in literacy and primary education.
2.2. Health Outcomes
Measurements of gender gaps in health should control for biological differences so as to isolate the effect of societal influences on gender inequality. To that end, life expectancy
9 Some countries started with female enrollment much larger than males’, including a number of Caribbean countries. For example, St. Lucia’s F/M enrollment ratio was 1.49 in 1990. This may be due to structures of production with men leaving school to work in agriculture or mines (in Lesotho, for example).
Panel A. Distributions of F/M ratios
Panel B. Change in F/M Ratio and Initial F/M Ratio Total Average Years Education
-1.0 -0.8 -0.6 -0.4 -0.2 0.0 0.2 0.4 0.6 0.8 1.0
0.0 0.2 0.4 0.6 0.8 1.0 1.2 1.4 1.6
Cha
nge
in F
/M R
atio
, 199
0 to
201
0
F/M Total Years of Education 1990
Source: Author’s calculations based on Barro and Lee (2010) dataset.
Figure 1. Trends in Female and Male Average Total Years of Education, 1990 and 2010.
14 Journal of African Development (2016) 18:1–30
Panel A. Distributions of F/M Ratios
Panel B. Countries Ranked by 1990 F/M Ratio
0.0 0.2 0.4 0.6 0.8 1.0 1.2 1.4 1.6 1.8
1990 2010
Gambia Mali
Ugand
aSolo
mon Is
.Djib
outi
Chad
Tunis
iaVa
nuatu
Albania
Switzer
land
Icelan
d
China
Kyrgyz
Rep
.Th
ailan
dHun
gary
Phillip
pines
Cape V
erde
Seych
elles
Malays
iaFr
ance
Brune
i Dar
ussa
lamMac
aoBots
wana
Grena
daSur
iname
Leso
tho
Belaru
s
Note: In Panel B, not all countries are identified due to space.Source: World Development Indicators, online database.
Figure 2. Female and Male Gross Secondary School Enrollment Rates, 1990 and 2010.
Note: 1990 and 2010 represent averages for 1989-91 and 2009-11, respectively.
measures used here reflect how far away a country is from the female and male “goalposts” as reflected by the gender-specific maximum life expectancies achieved in a given year among the countries in the sample.10
Data for 185 countries are presented in Figure 3 for 1990 and 2010. Panel A presents the global distributions for each of these years, and indicates a modest improvement in gender ratios at the low end of the distribution (the left tail moves right). For example, in Afghanistan, the ratio rose from 0.49 to 0.53 from 1990. The global mean of the life expectancy ratio is
10 The method adopted follows that used in the UNDP’s Human Development Reports. A country’s female (male) life expectancy is measured as follows, where LE is life expectancy, F is female in country i at time t, and MAX and MIN are maximum and minimum life expectancy values in the sample in a particular year: Index
LE ��F
it
Fit LE MINF
t
LE �t LE MINFMAXFt
.

Journal of African Development (2016) 18:1–30 15
Panel A. Distributions of F/M Life Expectancy Ratios
Panel B. Regional Trends in F/M Life Expectancy Ratios, 1990 to 2010
0.98 0.96
0.94
1.07
1.02 1.05
1990 2010 Change 1990 to 2010
Africa
Afrab
Asia &
Pac
ific CIS
Latin
Amer
ica &
Car
ibbea
n
Develo
ped
1.11
1.06
1.01
0.96
0.91
0.86
0.0040.0030.0030.0020.0020.0010.0010.000
-0.001-0.001-0.002
Note: CIS refers to Commonwealth of Independent States. Source: World Development Indicators, online database.
Figure 3. Trends in Female and Male Life Expectancy, 1990 to 2010.
1.002 in 2010, virtually unchanged from 1990. Further, the global mean obscures significant country-level regional differences. For instance, in 33 countries, the F/M life expectancy ratio was below 95 percent in 1990, and there was no decrease in that number by 2010.
Panel B plots regional F/M life expectancy ratios for 1990 and 2010 to the change in the F/M ratio over the time period 1990 to 2010 (see the right axis). The greatest improvements are observable in the Arab and Asia/Pacific regions, although these changes are very modest with the ratio below gender parity even by 2010.
In sum, the analysis shows mixed results with regard to global trends in gender equality in capabilities. Educational gaps are closing and there appears to be global convergence in gender educational equality. Results are less positive in the area of health, with life expectancy ratios making uneven progress and demonstrating greater global divergence.
16 Journal of African Development (2016) 18:1–30
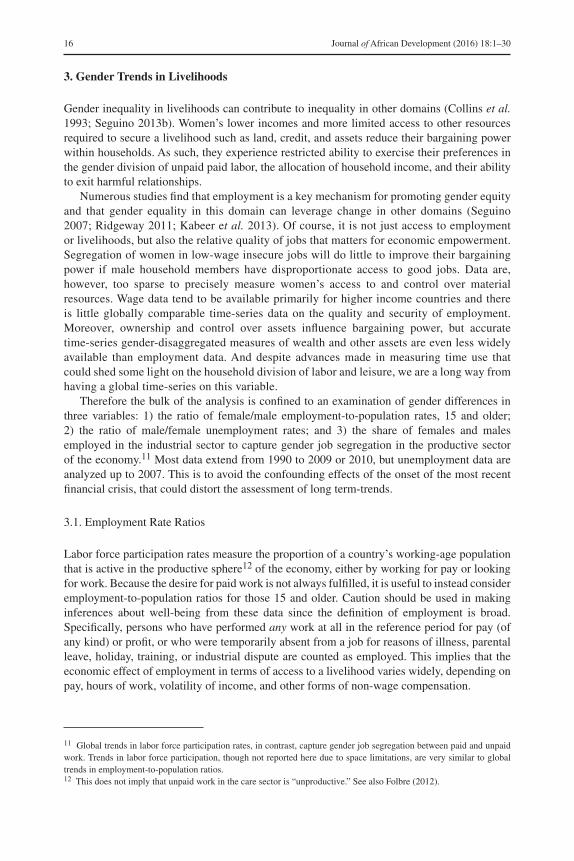
3. Gender Trends in Livelihoods
Gender inequality in livelihoods can contribute to inequality in other domains (Collins et al. 1993; Seguino 2013b). Women’s lower incomes and more limited access to other resources required to secure a livelihood such as land, credit, and assets reduce their bargaining power within households. As such, they experience restricted ability to exercise their preferences in the gender division of unpaid paid labor, the allocation of household income, and their ability to exit harmful relationships.
Numerous studies find that employment is a key mechanism for promoting gender equity and that gender equality in this domain can leverage change in other domains (Seguino 2007; Ridgeway 2011; Kabeer et al. 2013). Of course, it is not just access to employment or livelihoods, but also the relative quality of jobs that matters for economic empowerment. Segregation of women in low-wage insecure jobs will do little to improve their bargaining power if male household members have disproportionate access to good jobs. Data are, however, too sparse to precisely measure women’s access to and control over material resources. Wage data tend to be available primarily for higher income countries and there is little globally comparable time-series data on the quality and security of employment. Moreover, ownership and control over assets influence bargaining power, but accurate time-series gender-disaggregated measures of wealth and other assets are even less widely available than employment data. And despite advances made in measuring time use that could shed some light on the household division of labor and leisure, we are a long way from having a global time-series on this variable.
Therefore the bulk of the analysis is confined to an examination of gender differences in three variables: 1) the ratio of female/male employment-to-population rates, 15 and older; 2) the ratio of male/female unemployment rates; and 3) the share of females and males employed in the industrial sector to capture gender job segregation in the productive sector of the economy.11 Most data extend from 1990 to 2009 or 2010, but unemployment data are analyzed up to 2007. This is to avoid the confounding effects of the onset of the most recent financial crisis, that could distort the assessment of long term-trends.
3.1. Employment Rate Ratios
Labor force participation rates measure the proportion of a country’s working-age population that is active in the productive sphere12 of the economy, either by working for pay or looking for work. Because the desire for paid work is not always fulfilled, it is useful to instead consider employment-to-population ratios for those 15 and older. Caution should be used in making inferences about well-being from these data since the definition of employment is broad. Specifically, persons who have performed any work at all in the reference period for pay (of any kind) or profit, or who were temporarily absent from a job for reasons of illness, parental leave, holiday, training, or industrial dispute are counted as employed. This implies that the economic effect of employment in terms of access to a livelihood varies widely, depending on pay, hours of work, volatility of income, and other forms of non-wage compensation.
11 Global trends in labor force participation rates, in contrast, capture gender job segregation between paid and unpaid work. Trends in labor force participation, though not reported here due to space limitations, are very similar to global trends in employment-to-population ratios. 12 This does not imply that unpaid work in the care sector is “unproductive.” See also Folbre (2012).
Journal of African Development (2016) 18:1–30 17
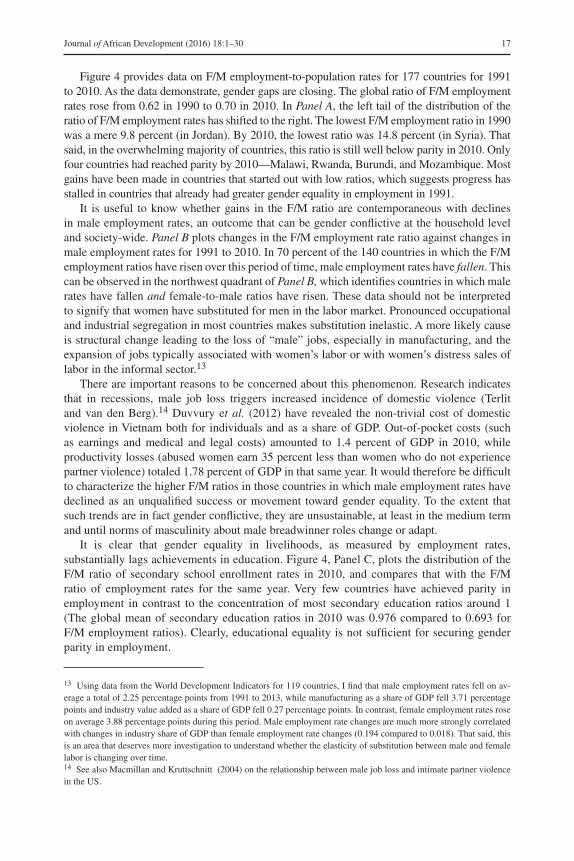
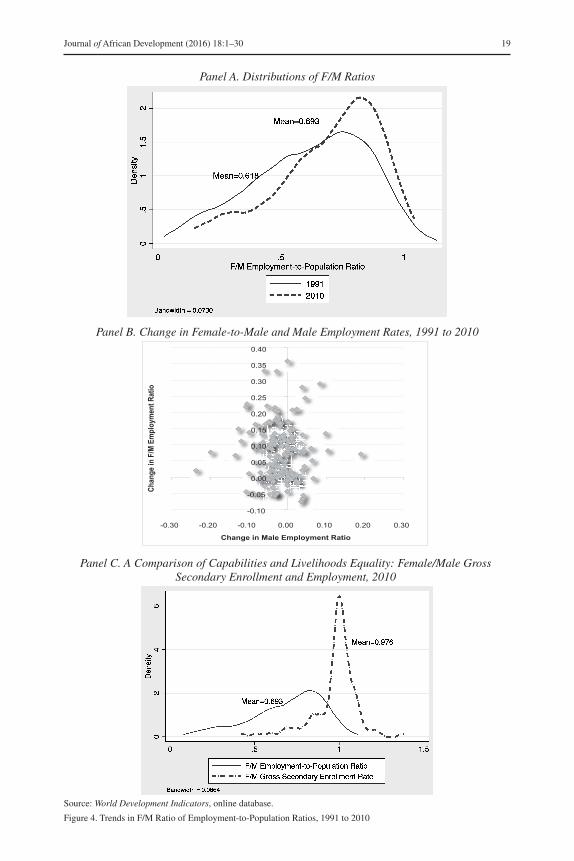
Figure 4 provides data on F/M employment-to-population rates for 177 countries for 1991 to 2010. As the data demonstrate, gender gaps are closing. The global ratio of F/M employment rates rose from 0.62 in 1990 to 0.70 in 2010. In Panel A, the left tail of the distribution of the ratio of F/M employment rates has shifted to the right. The lowest F/M employment ratio in 1990 was a mere 9.8 percent (in Jordan). By 2010, the lowest ratio was 14.8 percent (in Syria). That said, in the overwhelming majority of countries, this ratio is still well below parity in 2010. Only four countries had reached parity by 2010—Malawi, Rwanda, Burundi, and Mozambique. Most gains have been made in countries that started out with low ratios, which suggests progress has stalled in countries that already had greater gender equality in employment in 1991.
It is useful to know whether gains in the F/M ratio are contemporaneous with declines in male employment rates, an outcome that can be gender conflictive at the household level and society-wide. Panel B plots changes in the F/M employment rate ratio against changes in male employment rates for 1991 to 2010. In 70 percent of the 140 countries in which the F/M employment ratios have risen over this period of time, male employment rates have fallen. This can be observed in the northwest quadrant of Panel B, which identifies countries in which male rates have fallen and female-to-male ratios have risen. These data should not be interpreted to signify that women have substituted for men in the labor market. Pronounced occupational and industrial segregation in most countries makes substitution inelastic. A more likely cause is structural change leading to the loss of “male” jobs, especially in manufacturing, and the expansion of jobs typically associated with women’s labor or with women’s distress sales of labor in the informal sector.13
There are important reasons to be concerned about this phenomenon. Research indicates that in recessions, male job loss triggers increased incidence of domestic violence (Terlit and van den Berg).14 Duvvury et al. (2012) have revealed the non-trivial cost of domestic violence in Vietnam both for individuals and as a share of GDP. Out-of-pocket costs (such as earnings and medical and legal costs) amounted to 1.4 percent of GDP in 2010, while productivity losses (abused women earn 35 percent less than women who do not experience partner violence) totaled 1.78 percent of GDP in that same year. It would therefore be difficult to characterize the higher F/M ratios in those countries in which male employment rates have declined as an unqualified success or movement toward gender equality. To the extent that such trends are in fact gender conflictive, they are unsustainable, at least in the medium term and until norms of masculinity about male breadwinner roles change or adapt.
It is clear that gender equality in livelihoods, as measured by employment rates, substantially lags achievements in education. Figure 4, Panel C, plots the distribution of the F/M ratio of secondary school enrollment rates in 2010, and compares that with the F/M ratio of employment rates for the same year. Very few countries have achieved parity in employment in contrast to the concentration of most secondary education ratios around 1 (The global mean of secondary education ratios in 2010 was 0.976 compared to 0.693 for F/M employment ratios). Clearly, educational equality is not sufficient for securing gender parity in employment.
13 Using data from the World Development Indicators for 119 countries, I find that male employment rates fell on av-erage a total of 2.25 percentage points from 1991 to 2013, while manufacturing as a share of GDP fell 3.71 percentage points and industry value added as a share of GDP fell 0.27 percentage points. In contrast, female employment rates rose on average 3.88 percentage points during this period. Male employment rate changes are much more strongly correlated with changes in industry share of GDP than female employment rate changes (0.194 compared to 0.018). That said, this is an area that deserves more investigation to understand whether the elasticity of substitution between male and female labor is changing over time.14 See also Macmillan and Kruttschnitt (2004) on the relationship between male job loss and intimate partner violence in the US.

18 Journal of African Development (2016) 18:1–30
3.2. Unemployment Rates
Unemployment rates are measured relative to the size of the labor force (while employment rates are measured relative to the population above a certain age). A person is defined as unemployed if out of work, available for work, and actively seeking work in the past period. Gendered trends in unemployment rates are measured as the male to female (M/F) ratio of unemployment, such that a higher ratio indicates greater gender equality (in favor of women). This is done for consistency with other indicators in this study where increases in variables can also be interpreted as greater gender equality.
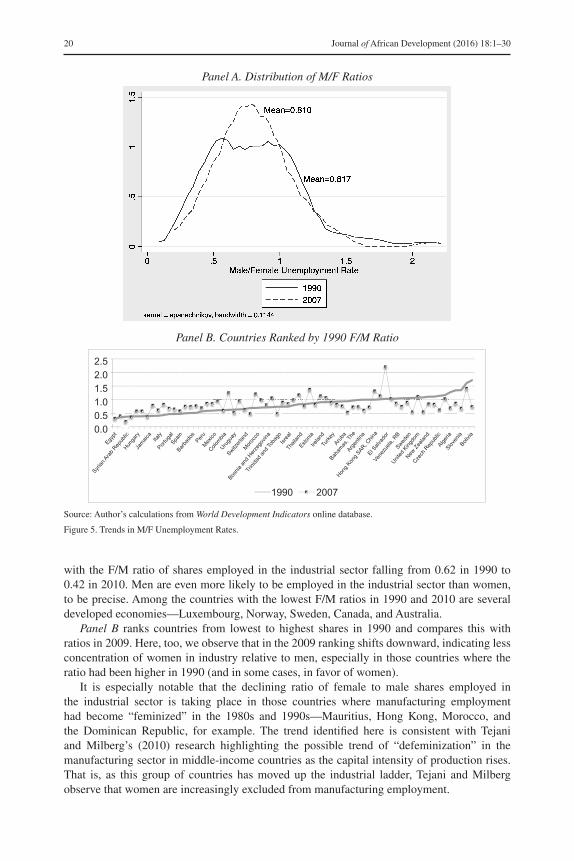
Gender disaggregated data are available for only 67 countries for the period 1990 to 2007.15 The mean global ratio of M/F unemployment rates was 0.817 in 1990, compared to 0.810 in 2007. Panel A of Figure 5 presents the 1990 and 2007 country distributions of M/F ratios of unemployment rates. Panel B compares each country’s M/F unemployment ratio in 1990 to the ratio in 2007. Countries are ranked from lowest to highest shares in 1990, and this ranking is compared to ratios in 2007.16 Despite some progress in countries with already high M/F unemployment ratios, the majority of countries have ratios below 1, indicating persistent gender inequality in access to work. Moreover, in those countries with greater gender equality in M/F unemployment rates in 1990, there is evidence of reduced gender equality in most of these countries by 2007.
3.3. Job Segregation: Shares of Females and Males Employed in the Industrial Sector
Gender inequality in wages and earnings is in part attributable to gender job segregation. That segregation may be the result of explicit job discrimination by employers, or it may be a function of gendered norms that shape the educational and job decisions of women and men. Whatever the source, women and men workers tend to be concentrated in different sectors of the economy (such as in paid vs. unpaid work or industry vs. services). This segregation has palpable material effects. Ideally, over time there will be changes in gender norms and stereotypes, as well as in the overt discriminatory practices on the part of employers, leading to greater gender job integration with men and women more equally concentrated across sectors of the economy.
One way to evaluate trends in job segregation is to consider the shares of females and males employed in the industrial sector. This sector tends to be better paid than the services sector. The latter sector in many developing countries is largely informal work with low wages or profits, and can often be considered residual unemployment. Industrial employment may also be more remunerative than work in the agricultural sector where incomes can be unstable and social insurance unavailable. This contrasts with industrial employment where, in addition to greater likelihood of forms of non-wage compensation, more opportunity exists for training over the worker’s lifetime that could raise earnings.
Data are available for 62 countries for 1990 and 2009 (or nearest year within one year). Not surprisingly, most countries for which there are data are middle- or high-income. Many of the poorest countries are not represented in this analysis. Panel A in Figure 6 shows that the distribution of the F/M shares employed in the industrial sector has shifted to the left,
15 For 1990 or 2007, if data are not available, the analysis uses unemployment rates within one year of each of those years (that is, 1989 or 1991 and 2006 or 2008).16 For reasons on space, not all country names are shown in Figure 5. The purpose of this figure is primarily to reflect not only rankings in 1990 and 2007, but also to evaluate whether ratios have shifted in countries with the widest or narrowest gender gaps in 1990.
Journal of African Development (2016) 18:1–30 19
Panel A. Distributions of F/M Ratios
Panel B. Change in Female-to-Male and Male Employment Rates, 1991 to 2010
-0.10
-0.05
0.00
0.05
0.10
0.15
0.20
0.25
0.30
0.35
0.40
Chan
ge in
F/M
Em
ploy
men
t Rat
io
-0.30 -0.20 -0.10 0.00 0.10 0.20 0.30
Change in Male Employment Ratio
Source: World Development Indicators, online database.
Figure 4. Trends in F/M Ratio of Employment-to-Population Ratios, 1991 to 2010
Panel C. A Comparison of Capabilities and Livelihoods Equality: Female/Male Gross Secondary Enrollment and Employment, 2010
20 Journal of African Development (2016) 18:1–30
with the F/M ratio of shares employed in the industrial sector falling from 0.62 in 1990 to 0.42 in 2010. Men are even more likely to be employed in the industrial sector than women, to be precise. Among the countries with the lowest F/M ratios in 1990 and 2010 are several developed economies—Luxembourg, Norway, Sweden, Canada, and Australia.
Panel B ranks countries from lowest to highest shares in 1990 and compares this with ratios in 2009. Here, too, we observe that in the 2009 ranking shifts downward, indicating less concentration of women in industry relative to men, especially in those countries where the ratio had been higher in 1990 (and in some cases, in favor of women).
It is especially notable that the declining ratio of female to male shares employed in the industrial sector is taking place in those countries where manufacturing employment had become “feminized” in the 1980s and 1990s—Mauritius, Hong Kong, Morocco, and the Dominican Republic, for example. The trend identified here is consistent with Tejani and Milberg’s (2010) research highlighting the possible trend of “defeminization” in the manufacturing sector in middle-income countries as the capital intensity of production rises. That is, as this group of countries has moved up the industrial ladder, Tejani and Milberg observe that women are increasingly excluded from manufacturing employment.
Panel A. Distribution of M/F Ratios
Panel B. Countries Ranked by 1990 F/M Ratio
0.0 0.5 1.0 1.5 2.0 2.5
1990 2007
Syrian
Ara
b Rep
ublic
Hunga
ryJa
maica
Italy
Portug
al
Egypt
Barba
dos
Peru
Mexico
Colombia
Urugu
ay
Spain
Moroc
co
Bosnia
and H
erze
govin
a
Trini
dad a
nd To
bago
Isrea
lTh
ailan
d
Switzer
land
Irelan
dTu
rkey
Aruba
Baham
as, T
heArg
entin
a
Hong K
ong S
AR, Chin
aEl S
alvad
or
Vene
zuela
, RB
Sweden
United
King
dom
New Z
ealan
d
Czech
Rep
ublic
Algeria
Sloven
iaBoli
via
Estonia
Source: Author’s calculations from World Development Indicators online database.
Figure 5. Trends in M/F Unemployment Rates.

Journal of African Development (2016) 18:1–30 21
This occurs, despite narrowing of gender educational gaps in these countries, and may reflect a phenomenon that has been noted in industrialized countries such as the U.S., dubbed “family responsibility discrimination.” Those with greater family responsibility, particularly women, find themselves less likely to obtain jobs than those who do not signal such care responsibilities—men and childless women. It may also relate to employers’ greater investment in the firm-specific skills of their workers. Employers may inaccurately (or accurately) predict that men are the major breadwinners, and therefore be unwilling to hire women workers who are predicted to leave the labor market at higher rates due to care responsibilities. This is more likely to occur in capital-intensive firms, since the firm’s sunk costs in worker training will yield a lower return than investments in men. The binding constraint is an absence of gender-equitable care policies, although there are other barriers as well, including gender norms and stereotypes.
Panel C provides a regional summary of trends in the ratio of female to male shares employed in the industrial sector from 1990 to 2009. In all regions, female shares employed in the industrial sector have declined except in Africa. Moreover, male shares have risen only in the Arab and Asia regions. Across all regions, women’s losses are greater than men’s as evidenced by the negative direction of the F/M ratio (Panel C, shown on right axis).
Taken as a group, trends in outcome indicators explored in this section are much less positive than gender progress in education in the capabilities domain. Very few countries have reached parity in employment, and unemployment gaps have widened in a number of countries. Of particular concern is that relative female employment gains coincide with a decline in male employment rates in a number of countries, although men appear to be able to disproportionately hold onto jobs in the industrial sector.
Employment gains, in other words, could be gender conflictive. Employment is a particularly salient domain for the fulfillment of norms of masculinity. If indeed improvements in women’s employment are contemporaneous with men’s decline in employment rates, this should be cause for concern. (Gender improvements in favor of women in education, for example, while troubling, are less gender conflictive). Moreover, the reduction in women’s concentration in the industrial sector as compared to men’s is suggestive of a process of defeminization in that sector. Because industrial sector jobs tend to be of higher quality than those in other sectors (they are less likely to be informal, and more likely to offer benefits and a job ladder than jobs in services and agriculture), this outcome indicates a decline in gender equality. Trends in this sector are also indicative of persistent job segregation by gender.
Given the importance of access to and control over material resources for well-being, persistent and in some cases widening gender gaps in this domain are indicative of real challenges to gender equality in well-being. It should be noted that the data presented here emphasize labor market outcomes. Other data on livelihoods that would be useful include are assets,17 access to credit, the level of social insurance (such as pensions, unemployment insurance), and other entitlements to commodities. Thus, it should be acknowledged that this analysis presents only a partial picture. The data gap might not be problematic if the labor market data presented here are a close proxy for these other indicators. Although we lack global data to assess this possibility, it is likely that the labor market data provide a lower bound estimate of gender inequality. We know from some country-level studies that the gender distribution of wealth, land, and credit is more unequal than income, for example.18
17 The Global Gender Asset Gap Project, which was launched in 2009 to collect data on gender gaps in assets and to demonstrate the feasibility of collecting such data, is an important step in the right direction. See Oduro, Baah-Boateng, and Boakye-Yiadom (2011) for an analysis of gender-disaggregated asset data for Ghana coming out of this project.18 See, for example, Blackden et al. (2006) on land and credit in sub-Saharan Africa and Oduro et al. (2011) on the distribution of assets in Ghana.

22 Journal of African Development (2016) 18:1–30
Panel A. Distributions of F/M Shares
Panel B. Countries Ranked by 1990 F/M Ratio
1990 2009
2.502.001.501.000.500.00
Source: Author’s calculations from World Development Indicators online database.
Figure 6. Shares of Females and Males Employed in the Industrial Sector, 1990 and 2009
10.0
5.0
0.0
-5.0
-10.0
-15.0
-20.0
0.0-0.1-0.2-0.3-0.4-0.5-0.6-0.7-0.8
Afri
ca
Ara
b
Asi
a
Latin
Am
eric
a &
C
arib
bean
Dev
elop
ed
Cha
nge
in F
/M R
atio
Cha
nges
in S
hare
sof
Fem
ales
an
d M
ales
Em
ploy
ed in
In
dust
rial S
ecto
r
Females Males F/M Ratios
CIS
Panel C. Changes in Regional Female and Male Shares Employed in Industrial Sector, 1990 to 2009
Journal of African Development (2016) 18:1–30 23
4. Agency, Empowerment, and Relative Political Representation
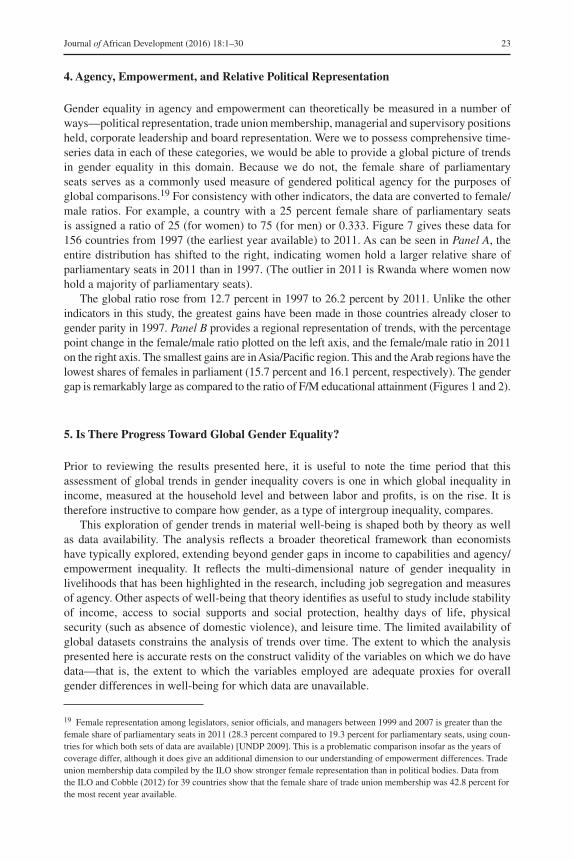
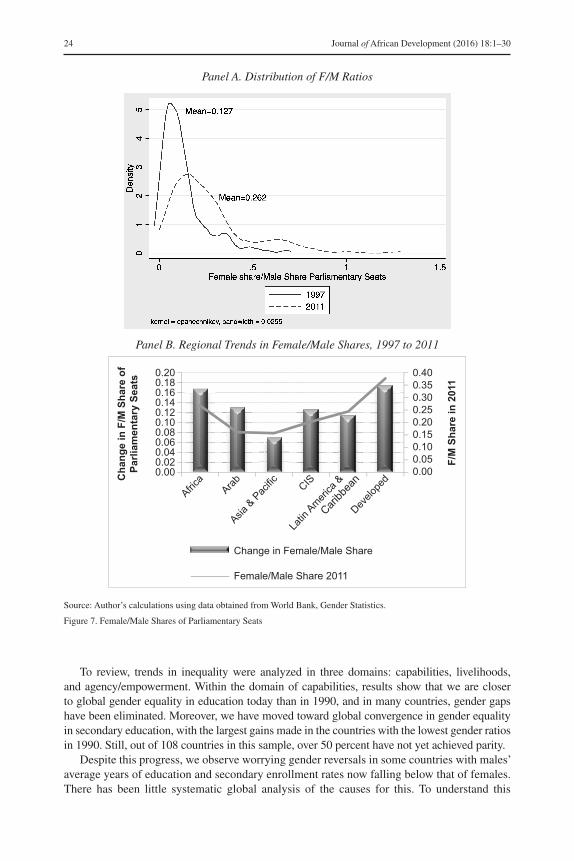
Gender equality in agency and empowerment can theoretically be measured in a number of ways—political representation, trade union membership, managerial and supervisory positions held, corporate leadership and board representation. Were we to possess comprehensive time-series data in each of these categories, we would be able to provide a global picture of trends in gender equality in this domain. Because we do not, the female share of parliamentary seats serves as a commonly used measure of gendered political agency for the purposes of global comparisons.19 For consistency with other indicators, the data are converted to female/male ratios. For example, a country with a 25 percent female share of parliamentary seats is assigned a ratio of 25 (for women) to 75 (for men) or 0.333. Figure 7 gives these data for 156 countries from 1997 (the earliest year available) to 2011. As can be seen in Panel A, the entire distribution has shifted to the right, indicating women hold a larger relative share of parliamentary seats in 2011 than in 1997. (The outlier in 2011 is Rwanda where women now hold a majority of parliamentary seats).
The global ratio rose from 12.7 percent in 1997 to 26.2 percent by 2011. Unlike the other indicators in this study, the greatest gains have been made in those countries already closer to gender parity in 1997. Panel B provides a regional representation of trends, with the percentage point change in the female/male ratio plotted on the left axis, and the female/male ratio in 2011 on the right axis. The smallest gains are in Asia/Pacific region. This and the Arab regions have the lowest shares of females in parliament (15.7 percent and 16.1 percent, respectively). The gender gap is remarkably large as compared to the ratio of F/M educational attainment (Figures 1 and 2).
5. Is There Progress Toward Global Gender Equality?
Prior to reviewing the results presented here, it is useful to note the time period that this assessment of global trends in gender inequality covers is one in which global inequality in income, measured at the household level and between labor and profits, is on the rise. It is therefore instructive to compare how gender, as a type of intergroup inequality, compares.
This exploration of gender trends in material well-being is shaped both by theory as well as data availability. The analysis reflects a broader theoretical framework than economists have typically explored, extending beyond gender gaps in income to capabilities and agency/empowerment inequality. It reflects the multi-dimensional nature of gender inequality in livelihoods that has been highlighted in the research, including job segregation and measures of agency. Other aspects of well-being that theory identifies as useful to study include stability of income, access to social supports and social protection, healthy days of life, physical security (such as absence of domestic violence), and leisure time. The limited availability of global datasets constrains the analysis of trends over time. The extent to which the analysis presented here is accurate rests on the construct validity of the variables on which we do have data—that is, the extent to which the variables employed are adequate proxies for overall gender differences in well-being for which data are unavailable.
19 Female representation among legislators, senior officials, and managers between 1999 and 2007 is greater than the female share of parliamentary seats in 2011 (28.3 percent compared to 19.3 percent for parliamentary seats, using coun-tries for which both sets of data are available) [UNDP 2009]. This is a problematic comparison insofar as the years of coverage differ, although it does give an additional dimension to our understanding of empowerment differences. Trade union membership data compiled by the ILO show stronger female representation than in political bodies. Data from the ILO and Cobble (2012) for 39 countries show that the female share of trade union membership was 42.8 percent for the most recent year available.
24 Journal of African Development (2016) 18:1–30
Panel A. Distribution of F/M Ratios
Panel B. Regional Trends in Female/Male Shares, 1997 to 2011
Africa
Arab
Asia &
Pac
ific
CIS
Latin
America
&
Caribb
ean
Develo
ped
F/M
Sha
re in
201
1
Cha
nge
in F
/M S
hare
of
Parli
amen
tary
Sea
ts
Change in Female/Male Share
Female/Male Share 2011
0.200.180.160.140.120.100.080.060.040.020.00
0.400.350.300.250.200.150.100.050.00
Source: Author’s calculations using data obtained from World Bank, Gender Statistics.
Figure 7. Female/Male Shares of Parliamentary Seats
To review, trends in inequality were analyzed in three domains: capabilities, livelihoods, and agency/empowerment. Within the domain of capabilities, results show that we are closer to global gender equality in education today than in 1990, and in many countries, gender gaps have been eliminated. Moreover, we have moved toward global convergence in gender equality in secondary education, with the largest gains made in the countries with the lowest gender ratios in 1990. Still, out of 108 countries in this sample, over 50 percent have not yet achieved parity.
Despite this progress, we observe worrying gender reversals in some countries with males’ average years of education and secondary enrollment rates now falling below that of females. There has been little systematic global analysis of the causes for this. To understand this
Journal of African Development (2016) 18:1–30 25
phenomenon, a shift in analysis from women’s to men’s behavior is more necessary than ever. In particular, it requires an investigation of norms of masculinity and their response to changes in women’s outcomes. For example, the male decline in relative educational achievement in some countries and at some levels may be due to males’ unwillingness to compete with females in a space males had previously dominated. In other words, men may perform more poorly or withdraw altogether as schools become perceived as a “feminized” space.20
While gender educational gaps have narrowed, there has been little change in the F/M ratio of life expectancy. Here, too, the causes of this trend are not well understood. Further, it contradicts the prediction that women’s life chances improve as they become more economically valuable, as evidenced by their higher employment rates. Thus, in terms of capabilities, progress is mixed.
In the livelihoods domain, although progress is evident, gender gaps are persistent and parity is far from achieved in any of the indicators examined here. In some countries, female relative employment gains have occurred in the context of declines in male employment rates, and thus, the narrowing of gaps is gender conflictive with potentially negative feedback effects in terms of relations at the household level, such as family dissolution and domestic violence.
Of particular significance is that employment equality lags educational improvements. Figure 4 (Panel C) exemplifies the wide gap in progress between educational and employment equality. As that figure shows, by 2010, while most countries are concentrated around a secondary enrollment ratio of 1, the F/M employment ratio is much more unequal across countries and much lower on average than F/M secondary enrollment rates. It is apparent that educational equality is not sufficient for achieving equality of well-being in livelihoods. Theories of gender stratification indicate that a key factor in gender inequality is unequal bargaining power at the household level. In that context, income under women’s control relative to men’s (or gender equality in livelihoods) improves their fallback position and thus their ability to negotiate for resources at the household level. Gender equality in this domain then is key to leveraging change in other domains due to its effect on gender unequal norms and stereotypes and inequality in other domains (Collins et al. 1993). Slow progress in closing employment gaps, then, is cause for concern.
Moreover, women’s access to employment in the industrial sector has declined relative to men’s. This trend holds in all regions of the world with the exception of Africa.21 It would appear that a global defeminization of industrial employment is underway. The share of men employed in this sector has declined, too, but women’s more limited access to jobs in this sector, despite narrowing educational gaps, suggests other factors are influencing intergroup inequality in who gets or keeps jobs in this sector. This is significant since jobs in this sector tend to be of higher quality than those in services and agriculture on average. One factor influencing the widening gender gap may be insufficient public support for care work and policies that enable men to shoulder a larger portion of care activities. Employers, observing that women have primary responsibility for care of the family, may be unwilling to hire and retain women in the industrial sector where skills are obtained on the job and firms tend to invest more in worker skills acquisition than other sectors.
Finally, in the domain of agency, women’s share of parliamentary seats has risen but only modestly so. A number of countries continue to have no female political representation and among the remainder, few have achieved parity. Some research suggests that women in political office tend to support public investment that reduces women’s care burden and to support policies that promote economic security (Chattopadhay and Duflo 2004; Besley and
20 See, also, Diprete and Buchanan (2013).21 This point should be qualified with the observation that in Africa, industrial employment is a small share of all employment.

26 Journal of African Development (2016) 18:1–30
Tabl
e 1.
Sum
mar
y of
Tre
nds
in G
ende
r E
qual
ity I
ndic
ator
s by
Reg
ion
Tota
l Yea
rs o
f E
duca
tiona
l A
ttain
men
t (20
10)
Seco
ndar
y E
nrol
lmen
t Rat
es
(201
0)L
ife
expe
ctan
cy
(201
0)
Em
ploy
men
t-to
-Po
pula
tion
Rat
es
(201
0)U
nem
ploy
men
t R
ates
(20
07)
Shar
es E
mpl
oyed
in
Ind
ustr
ial S
ecto
r (2
009)
Parl
iam
enta
ry
Seat
s (2
011)
Wor
ld 2
010
or c
lose
st y
ear
0.91
0.98
1.00
0.70
0.81
0.42
0.26
Afr
ica
0.79
0.89
0.98
0.82
0.76
0.54
0.27
Ara
b0.
890.
980.
960.
320.
600.
350.
16
Asi
a &
Pac
ific
0.86
0.96
0.94
0.65
1.11
0.62
0.16
CIS
0.98
0.97
1.07
0.74
0.96
0.46
0.20
Lat
in A
mer
ica
&
Car
ibbe
an0.
961.
071.
020.
640.
830.
460.
24
D
evel
oped
0.98
1.00
1.05
0.78
0.87
0.33
0.38
Tota
l Yea
rs o
f E
duca
tiona
l A
ttain
men
t (19
90)
Seco
ndar
y E
nrol
lmen
t Rat
es
(199
0)L
ife
expe
ctan
cy
(199
0)
Em
ploy
men
t-to
-Po
pula
tion
Rat
es
(199
1)U
nem
ploy
men
t R
ates
(19
90)
Shar
es E
mpl
oyed
in
Ind
ustr
ial S
ecto
r (1
990)
Parl
iam
enta
ry
Seat
s (1
990)
Wor
ld 1
990
or c
lose
st y
ear
0.82
0.91
1.00
0.62
0.86
0.62
0.12
Afr
ica
0.69
0.72
0.98
0.76
1.05
0.82
0.11
Ara
b0.
710.
860.
960.
250.
611.
050.
03
Asi
a &
Pac
ific
0.75
0.82
0.93
0.61
0.73
0.92
0.09
CIS
0.90
0.97
1.07
0.72
0.87
0.66
0.08
Lat
in A
mer
ica
&
Car
ibbe
an0.
921.
151.
020.
520.
790.
590.
13
D
evel
oped
0.94
1.01
1.05
0.67
0.85
0.50
0.21
Journal of African Development (2016) 18:1–30 27
Tabl
e 1
(con
tinue
d)
Tota
l Yea
rs o
f E
duca
tiona
l A
ttain
men
t (19
90)
Seco
ndar
y E
nrol
lmen
t Rat
es
(199
0)L
ife
expe
ctan
cy
(199
0)
Em
ploy
men
t-to
-Po
pula
tion
Rat
es
(199
1)U
nem
ploy
men
t R
ates
(19
90)
Shar
es E
mpl
oyed
in
Ind
ustr
ial S
ecto
r (1
990)
Parl
iam
enta
ry
Seat
s (1
990)
Cha
nge
1990
(19
91)
to 2
010
0.09
0.07
0.00
0.08
-0.0
5-0
.20
0.14
Afr
ica
0.10
0.17
0.00
0.06
-0.2
9-0
.28
0.16
Ara
b0.
180.
120.
000.
07-0
.01
-0.7
00.
13
Asi
a &
Pac
ific
0.11
0.14
0.01
0.04
0.38
-0.3
00.
07
CIS
0.08
0.00
0.00
0.02
0.09
-0.2
00.
12
Lat
in A
mer
ica
&
Car
ibbe
an0.
04-0
.08
0.00
0.12
0.04
-0.1
30.
11
D
evel
oped
0.04
-0.0
10.
000.
110.
02-0
.17
0.17
Not
e: A
ll va
riab
les
are
mea
sure
d as
the
fem
ale/
mal
e ra
tio.

28 Journal of African Development (2016) 18:1–30
Case 2003). If so, progress in political representation could be a mechanism to promote gender equality in other domains. The slow progress in this area then should elicit the attention of policymakers as a target to leverage change in other measures of gender inequality.
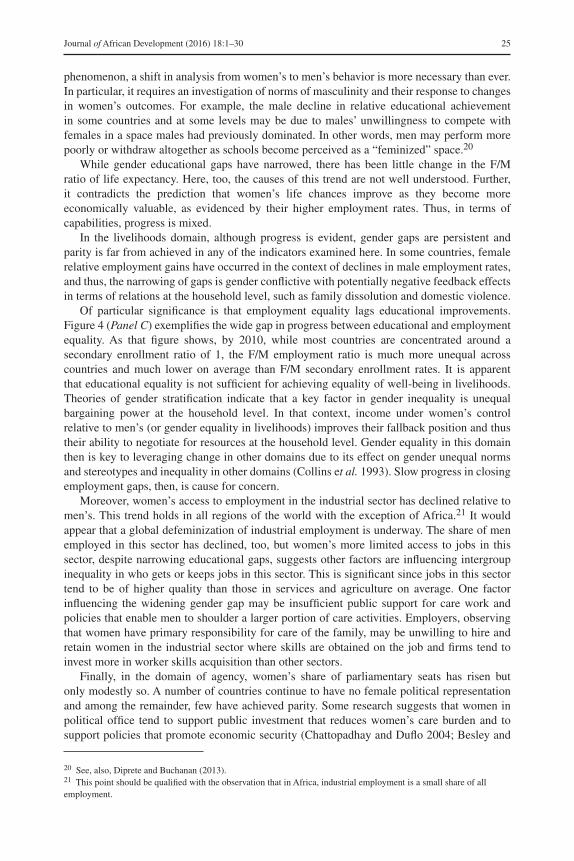
Table 1 summarizes where gender gaps now stand by region and across indicators, as compared to 1990 (or nearest year). Progress towards gender equality is uneven, depending on the indicator, across all regions. The widest gender gaps are in the livelihoods domain, with the greatest degree of gender equality in the capabilities domain. (The one exception is unemployment rates in the Asia region where men’s unemployment rates are higher than women’s, although women’s employment disadvantage is substantial with women’s employment rates averaging only 60 percent of men’s). We reiterate here that addressing only gender inequality in capabilities is insufficient for closing gender gaps in other domains.
6. Conclusions
Economists and policymakers have begun to pay more attention to intergroup inequality as a result of the coincidence of several phenomena. There has been a remarkable growth of income inequality within and between countries since 1975, whether this is measured at the household level, between countries, or between wages and profits. The research emerging from the renewed interest in this topic has revealed that inequality may not be costless in terms of its effects on society-wide well-being and economic growth.22 Moreover, we know that inequality contributes to social exclusion, and disproportionate economic power of those at the top of the distribution that can spill over to political institutions. The poor life chances of those at the bottom of the distribution can be worsened by inequality if those at the top with disproportionate political power skew public resources toward their own group and away from middle- and low-income groups.
Gender inequality is not a new phenomenon. It has instead been a ubiquitous characteristic of societies in evidence for millennia, though to varying degrees across countries and over time. Nevertheless, the emergence of a human rights agenda in the mid-20th century and women’s movements across the world since the 1960s has contributed to increased global attention to this form of inequality. Here, too, research shows that some forms of gender inequality can slow economic growth and development. That is, in addition to the negative effects of gender stratification on women’s relative capabilities and well-being more generally, there are societal costs to continued gender inequality.23
The data analyzed in this paper show, in contrast to trends in global income inequality, that gender gaps in education, employment and political representation have narrowed. That is, there is evidence of a reduction in gender stratification in most countries of the world for some (though not all) indicators, a shift that has been accompanied by more equitable gender attitudes. That said, there are two reasons to be concerned about trends since 1990. We continue to observe wide gaps in labor market outcomes, and in a number of countries, where women’s employment increased, men’s has declined. We also see persistent and indeed worsening job segregation in industrial sector employment. Finally, although gains in political representation of women have been positive, gaps in representation remain wide. This is an important impediment to gender progress. That is because the public sector plays an important role in promoting gender equality—
22 For references to this broad body of work, see the special issue of Journal of Human Development and Capabilities, Volume 13, Issue 1 (2012), on macroeconomics, human development, and inequality.23 The effect of gender inequality depends on its particular form. In general, capabilities inequality may have negative growth effects, but wage inequality may be a stimulus to growth, especially in labor-intensive export-oriented econo-mies. For a summary of this research, see Seguino (2010, 2013b).
Journal of African Development (2016) 18:1–30 29
via labor market regulations, family law, social protection programs, and public investments in infrastructure that can reduce women’s care burden. The failure to make substantial advances in women’s representation means that their life conditions and needs are not fully reflected at the national level in the distribution and allocation of public goods and expenditures.
References
Barro, R. and J.-W. Lee (2010) A New Data Set of Educational Attainment in the World, 1950–2010, NBER Working Paper No. 15902. (Available at: http://www.barrolee.com/data/dataexp.htm)
Besley, T. and A. Case (2003) ‘Political Institutions and Policy Choices: Empirical Evidence from the United States’ Journal of Economic Literature, 41: 7-73.
Blackden, M., S. Canagarajah, S. Klasen, and D. Lawson (2006) Gender and Growth in Sub-Saharan Africa: Issues and Evidence, UNU-WIDER Research Paper No. 2006/37.
Chattopadhyay, R. and E. Duflo (2004) ‘Women as Policy Makers: Evidence from a Randomized Policy Experiment in India’ Econometrica 87: 115-143.
Cobble, D. (2012) ‘Gender Equality and Labor Movements: Toward A Global Perspective’, Department of Labor Studies and Employment Relations, Rutgers University.
Collins, R., J. Chafetz, R. L. Blumberg, S. Coltrane, and J. Turner (1993) ‘Toward an Integrated Theory of Gender Stratification’, Sociological Perspectives, 36(3): 185-216.
Diprete, T. and C. Buchanan (2013) ‘The Rise of Women: The Growing Gender Gap in Education and What It Means for American Schools’. New York: Russell Sage Foundation.
Dorius, S. and G. Firebaugh (2010) ‘Trends in Global Gender Inequality’, Social Forces 88(5): 1941-1968. Duvvury, N., P. Carney, and N. Huu Minh (2012) ‘Estimating The Costs of Domestic Violence Against Women in Viet
Nam’. New York: UN Women. Folbre, N (2012) ‘The Political Economy of Human Capital’, Review of Radical Political Economics 44: 281-292. Grown, C. (2008) ‘Indicators and Indexes of Gender Equality: What Do They Measure and What Do They Miss’, in M.
Buvinic, A. Morrison, A. W. Ofosu-Amaah, and M. Sjoblom (eds.), Equality for Women: Where Do We Stand on Millennium Development Goal 3?. Washington, DC: World Bank.
Grown, C., G. R. Gupta, and Z. Khan (2003) Promises to Keep: Achieving Gender Equality and the Empowerment of Women, Background Paper for the Task Force on Education and Gender Equality of the Millennium Project, International Center for Research on Women, Washington, D.C.
Grown, C., G. R. Gupta, and Z. Khan (2003) Promises to Keep: Achieving Gender Equality and the Empowerment of Women, Background Paper for the Task Force on Education and Gender Equality of the Millennium Project, International Center for Research on Women, Washington, D.C.
Kabeer, N., R. Assaad, A. Darkwah, S. Mahmud, H. Sholkamy, S. Tasneem, and D. Tsikata (2013) ‘Paid Work, Women’s Empowerment and Inclusive Growth: Transforming the Structures of Constraint’. New York: UN Women.
Macmillan, R. and C. Kruttschnitt (2004) ‘Patterns of Violence Against Women: Risk Factors and Consequences’, National Institute of Justice Grant No. 2002-IJ-CX-001, Final Report.
Milanovic, B. (2005) ‘Worlds Apart: Measuring International and Global Inequality’, Princeton University Press.Oduro, A., W. Baah-Boateng, and L. Boakye-Yiadom (2011) ‘Measuring the Gender Asset Gap in Ghana’, Department
of Economics, University of Ghana. Permanyer, I. (2013) ‘A Critical Assessment of the UNDP’s Gender Inequality Index’, Feminist Economics 19(2): 1-32 Seguino, S. (2007) ‘Plus Ça Change? Evidence on Global Trends in Gender Norms and Stereotypes’, Feminist Economics
13(2): 1-28. Seguino, S. (2010) ‘Gender, Distribution, and Balance of Payments Constrained Growth in Developing Countries’,
Review of Political Economy 22(3): 373–404. Seguino, S. (2010) ‘Gender, Distribution, and Balance of Payments Constrained Growth in Developing Countries’,
Review of Political Economy 22(3): 373–404. Seguino, S. (2013)a. ‘From Micro-level Gender Relations to the Macro Economy and Back Again: Theory and Policy’,in
Deborah Figart and Tonia Warnecke (eds.), Handbook of Research on Gender and Economic Life. Edward Elgar.Seguino, S. (2013)b. ‘Toward Gender Justice: Confronting Strati cation and Power’, Géneros 2(1): 1-36 Tejani, S. and W. Milberg (2016) ‘Global Defeminization? Industrial Upgrading, Occupational Segmentation and
Manufacturing Employment in Middle-Income Countries’, Feminist Economics. DOI: 10.1080/13545701.2015.1120880Tertilt, M. and G. van den Berg (2012) ‘Family Violence Over the Business Cycle’, Mimeo, University of Mannheim.
UNICEF and UN Women (2013) ‘Global Thematic Consultation on the Post-2015 Development Agenda: Addressing Inequalities Synthesis Report of Global Public Consultation’. New York: Authors.
UNDP (2009) ‘Human Development Report 2009’. New York: Authors.

30 Journal of African Development (2016) 18:1–30
Table A.1. Data and Sources
Category Variable YearsNumber of countries
Source
Capabilities Total years educational attainment, 15+ 1990-2010 145 Barro and Lee (2010)
Secondary school enrollment rate (gross) 1990-2010 112 World Development Indicators
Life expectancy 1990-2011 182 World Development Indicators
Livelihoods Employment-to-population ratio, 15 + 1991-2010 177
International Labour Organization modeled estimate (published in World Development Indicators)
Unemployment rate 1991-2007 67
International Labour Organization modeled estimate (World Development Indicators)
Share employed in industrial sector 1990-2009 167 World Development Indicators
Female share of parliamentary seats 1997-2011 156 Gender Statistics (World Bank)
Note: Data were accessed December 2013.
APPENDIX
Related Documents