GLOBAL TRENDS IN CLEAN ENERGY INVESTMENT South Africa stands out in subdued Q1 for clean energy investment Luke Mills 10 April 2015

Welcome message from author
This document is posted to help you gain knowledge. Please leave a comment to let me know what you think about it! Share it to your friends and learn new things together.
Transcript

GLOBAL TRENDS IN CLEAN ENERGY INVESTMENT
South Africa stands out in subdued
Q1 for clean energy investment
Luke Mills
10 April 2015

1
CONTENTS
10 April 2015
1. Annual clean energy investment overview
2. Quarterly trends in clean energy: new investment
3. Quarterly trends in clean energy: funds in circulation
4. Clean energy indexes

ANNUAL CLEAN ENERGY INVESTMENT OVERVIEW

3
Note: Total values include estimates for undisclosed deals. AF = asset finance,
SDC = small distributed capacity. Source: Bloomberg New Energy Finance
10 April 2015
2014 CLEAN ENERGY INVESTMENT TYPES & FLOWS ($BN)
Technology
development
Equipment
manufacturing/ scale-up
Projects
Asset and company
mergers, acquisitions,
refinancing, buy-outs
etc.
+2
+15
+14 +3
+19 53 -4
+171
+17
+74 310
+75 385
VC Corp RD&D Gov R&D PE Public markets new equity
Total company investment
Re-invested Renewable energy AF
Digital energy & storage AF
SDC Total investment
M&A/buy-outs etc.
Total transactions

4
Note: Total values include estimates for undisclosed deals. Includes corporate and government R&D, and spending for
digital energy and energy storage projects (not reported in quarterly statistics). Source: Bloomberg New Energy Finance
10 April 2015
NEW INVESTMENT IN CLEAN ENERGY 2004-14 ($BN)
$60bn
$88bn
$128bn
$175bn
$205bn $206bn
$272bn
$318bn
$294bn
$268bn
$310bn
46%
46%
36%
17%
0.5%
32%
17%-7%
-9%
16%
2004 2005 2006 2007 2008 2009 2010 2011 2012 2013 2014
5
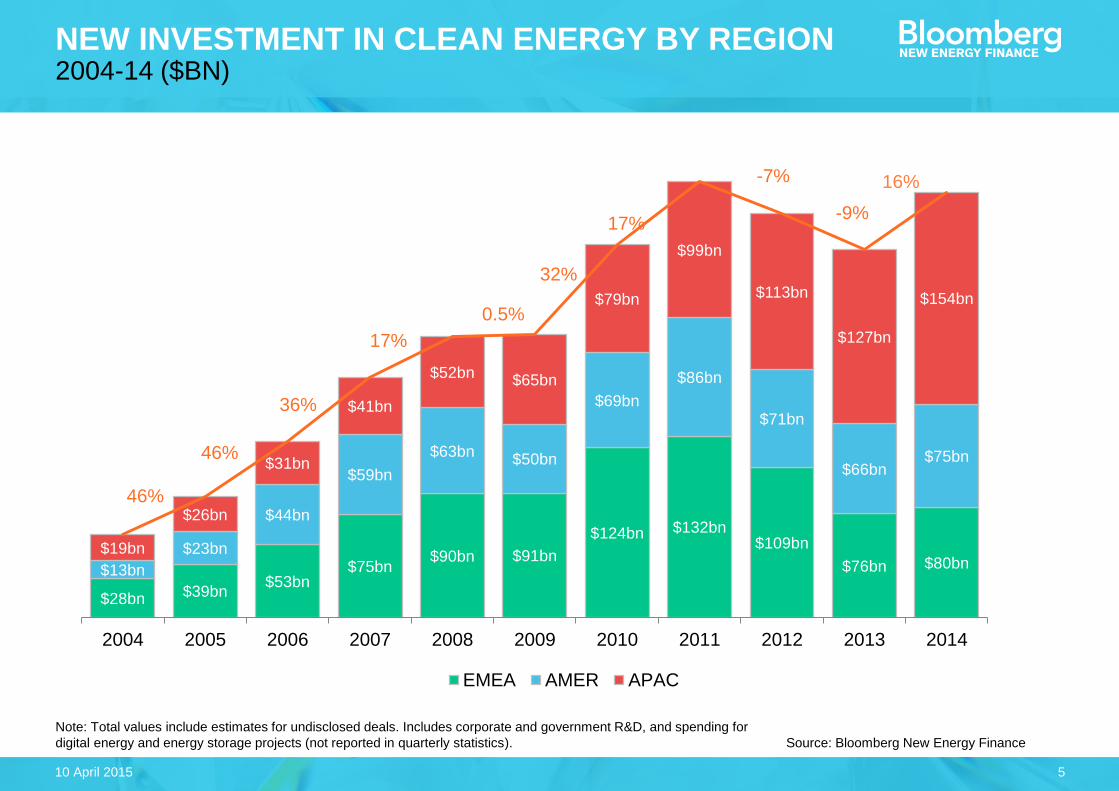
Note: Total values include estimates for undisclosed deals. Includes corporate and government R&D, and spending for
digital energy and energy storage projects (not reported in quarterly statistics). Source: Bloomberg New Energy Finance
10 April 2015
NEW INVESTMENT IN CLEAN ENERGY BY REGION 2004-14 ($BN)
$28bn $39bn$53bn
$75bn$90bn $91bn
$124bn $132bn$109bn
$76bn $80bn$13bn
$23bn
$44bn
$59bn
$63bn$50bn
$69bn
$86bn
$71bn
$66bn$75bn
$19bn
$26bn
$31bn
$41bn
$52bn $65bn
$79bn
$99bn
$113bn
$127bn
$154bn
46%
46%
36%
17%
0.5%
32%
17%
-7%
-9%
16%
2004 2005 2006 2007 2008 2009 2010 2011 2012 2013 2014
EMEA AMER APAC

6
Notes: The funds raised by green bonds are neither entirely inclusive nor exclusive of figures for clean energy asset finance. Bloomberg New Energy Finance will release additional
further details on green bond investment activity in a future press release. ‘Sovereign, supranational & agency’ includes bonds issued by issued by international financial institutions,
agencies and provinces to finance green projects. ‘Labelled corporate’ includes bonds issued by companies and explicitly labelled as green. ‘US municipal’ refers to bonds issued by US
municipalities to finance green projects. ‘Project’ refers to project bonds backed by renewable energy projects. ‘ABS’ refers to asset-backed securities whose cashflows come from a
portfolio of underlying receivables such as loans, leases and PPAs associated with green projects. Source: Bloomberg New Energy Finance
ANNUAL HISTORICAL GREEN BOND ISSUANCE, BY TYPE, 2007-14 ($BN)
0
5
10
15
20
25
30
35
40
2007 2008 2009 2010 2011 2012 2013 2014
ABS
Project
US municipal
Labelled corporate
Supranational,sovereign & agency

QUARTERLY TRENDS IN CLEAN ENERGY: NEW INVESTMENT

8
Note: Total values include estimates for undisclosed deals. Excludes corporate and government R&D, and spending for
digital energy and energy storage projects (reported in annual statistics only). Source: Bloomberg New Energy Finance
10 April 2015
NEW INVESTMENT IN CLEAN ENERGY Q1 2004-Q1 2015 ($BN)
9.3
12.2
9.010.6
13.2
20.5
15.7
20.621.8
27.323.2
37.1
27.8
35.4
37.6
52.4
35.9
51.9
46.044.4
30.4
50.6
47.6
44.8
50.4
56.2
58.6
68.9
57.3
77.7
73.8
64.8
54.0
71.6
60.2
64.4
43.1
64.6
54.8
61.559.3
72.1
65.1
67.6
50.5
Q1
Q2
Q3
Q4
Q1
Q2
Q3
Q4
Q1
Q2
Q3
Q4
Q1
Q2
Q3
Q4
Q1
Q2
Q3
Q4
Q1
Q2
Q3
Q4
Q1
Q2
Q3
Q4
Q1
Q2
Q3
Q4
Q1
Q2
Q3
Q4
Q1
Q2
Q3
Q4
Q1
Q2
Q3
Q4
Q1
2004 2005 2006 2007 2008 2009 2010 2011 2012 2013 2014 '15
Four quarter running average

9
Note: Total values include estimates for undisclosed deals. Excludes corporate and government R&D, and spending for
digital energy and energy storage projects (reported in annual statistics only). Source: Bloomberg New Energy Finance
10 April 2015
NEW INVESTMENT IN CLEAN ENERGY BY REGION Q1 2004-Q1 2015 ($BN)
9.312.2
9.010.6
13.2
20.5
15.7
20.621.8
27.3
23.2
37.1
27.8
35.437.6
52.4
35.9
51.9
46.044.4
30.4
50.647.6
44.8
50.4
56.258.6
68.9
57.3
77.7
73.8
64.8
54.0
71.6
60.2
64.4
43.1
64.6
54.8
61.5
59.3
72.1
65.1
67.6
50.5
Q1
Q2
Q3
Q4
Q1
Q2
Q3
Q4
Q1
Q2
Q3
Q4
Q1
Q2
Q3
Q4
Q1
Q2
Q3
Q4
Q1
Q2
Q3
Q4
Q1
Q2
Q3
Q4
Q1
Q2
Q3
Q4
Q1
Q2
Q3
Q4
Q1
Q2
Q3
Q4
Q1
Q2
Q3
Q4
Q1
2004 2005 2006 2007 2008 2009 2010 2011 2012 2013 2014 '15
EMEA AMER APAC

10
Note: Total values include estimates for undisclosed deals. Excludes corporate and government R&D, and spending for
digital energy and energy storage projects (reported in annual statistics only). Source: Bloomberg New Energy Finance
10 April 2015
NEW INVESTMENT IN CLEAN ENERGY IN EUROPE Q1 2004-Q1 2015 ($BN)
4.4
7.9
4.15.46.0
10.9
7.48.27.8
13.9
7.9
16.0
9.6
16.914.2
24.4
13.9
23.2 22.3
19.9
12.4
27.4
22.3
17.0
22.9
25.4
29.431.0
27.3
33.9
29.8
26.5
21.5
23.8
19.0
22.3
15.9
13.013.3
11.7
13.9 13.1
9.2
17.8
9.7
Q1
Q2
Q3
Q4
Q1
Q2
Q3
Q4
Q1
Q2
Q3
Q4
Q1
Q2
Q3
Q4
Q1
Q2
Q3
Q4
Q1
Q2
Q3
Q4
Q1
Q2
Q3
Q4
Q1
Q2
Q3
Q4
Q1
Q2
Q3
Q4
Q1
Q2
Q3
Q4
Q1
Q2
Q3
Q4
Q1
2004 2005 2006 2007 2008 2009 2010 2011 2012 2013 2014 '15
Four quarter running average

11
Note: Total values include estimates for undisclosed deals. Excludes corporate and government R&D, and spending for
digital energy and energy storage projects (reported in annual statistics only). Source: Bloomberg New Energy Finance
10 April 2015
NEW INVESTMENT IN CLEAN ENERGY IN THE US Q1 2004-Q1 2015 ($BN)
1.21.60.8
1.72.0
4.0
2.13.6
6.36.46.5
10.2
7.37.5
9.4
11.3
9.610.9
8.37.3
3.3
8.9
6.55.66.6
9.5
7.3
12.9
6.1
16.7
18.6
10.09.2
14.7
7.97.2
4.0
9.8
6.6
16.1
9.5
12.9
10.2
8.2
9.6
Q1
Q2
Q3
Q4
Q1
Q2
Q3
Q4
Q1
Q2
Q3
Q4
Q1
Q2
Q3
Q4
Q1
Q2
Q3
Q4
Q1
Q2
Q3
Q4
Q1
Q2
Q3
Q4
Q1
Q2
Q3
Q4
Q1
Q2
Q3
Q4
Q1
Q2
Q3
Q4
Q1
Q2
Q3
Q4
Q1
2004 2005 2006 2007 2008 2009 2010 2011 2012 2013 2014 '15
Four quarter running average

12
Note: Total values include estimates for undisclosed deals. Excludes corporate and government R&D, and spending for
digital energy and energy storage projects (reported in annual statistics only). Source: Bloomberg New Energy Finance
10 April 2015
NEW INVESTMENT IN CLEAN ENERGY IN CHINA Q1 2004-Q1 2015 ($BN)
0.60.30.60.91.42.1
1.52.51.92.1
3.13.13.13.9
5.2
3.53.8
7.86.76.4
8.07.4
10.3
12.7
7.5
9.811.0
10.110.1
14.011.8
11.6
10.6
19.9
16.414.4
8.4
18.6
17.7
15.7
14.4
25.5
24.3
17.0
11.0
Q1
Q2
Q3
Q4
Q1
Q2
Q3
Q4
Q1
Q2
Q3
Q4
Q1
Q2
Q3
Q4
Q1
Q2
Q3
Q4
Q1
Q2
Q3
Q4
Q1
Q2
Q3
Q4
Q1
Q2
Q3
Q4
Q1
Q2
Q3
Q4
Q1
Q2
Q3
Q4
Q1
Q2
Q3
Q4
Q1
2004 2005 2006 2007 2008 2009 2010 2011 2012 2013 2014 '15
Four quarter running average

13
Note: Total values include estimates for undisclosed deals. Excludes corporate and government R&D, and spending for
digital energy and energy storage projects (reported in annual statistics only). Source: Bloomberg New Energy Finance
10 April 2015
NEW INVESTMENT IN CLEAN ENERGY BY SECTOR Q1 2004-Q1 2015 ($BN)
9.312.2
9.010.6
13.2
20.5
15.7
20.6
21.8
27.3
23.2
37.1
27.8
35.437.6
52.4
35.9
51.9
46.044.4
30.4
50.647.6
44.8
50.4
56.258.6
68.9
57.3
77.7
73.8
64.8
54.0
71.6
60.2
64.4
43.1
64.6
54.8
61.559.3
72.1
65.1
67.6
50.5
Q1
Q2
Q3
Q4
Q1
Q2
Q3
Q4
Q1
Q2
Q3
Q4
Q1
Q2
Q3
Q4
Q1
Q2
Q3
Q4
Q1
Q2
Q3
Q4
Q1
Q2
Q3
Q4
Q1
Q2
Q3
Q4
Q1
Q2
Q3
Q4
Q1
Q2
Q3
Q4
Q1
Q2
Q3
Q4
Q1
2004 2005 2006 2007 2008 2009 2010 2011 2012 2013 2014 '15
Wind Solar Biofuels Other

14
Note: Total values include estimates for undisclosed deals. Excludes corporate and government R&D, and spending for
digital energy and energy storage projects (reported in annual statistics only). Source: Bloomberg New Energy Finance
10 April 2015
EMEA NEW INVESTMENT IN CLEAN ENERGY BY SECTOR Q1 2004-Q1 2015 ($BN)
4.4
8.2
4.25.5
6.3
11.1
7.58.47.9
14.0
8.3
16.6
10.0
17.4
14.8
25.5
14.4
23.623.0
20.7
12.8
27.9
22.6
17.5
24.1
25.9
29.8
33.1
28.5
34.5
30.0
27.3
22.2
24.6
21.5
28.7
16.717.1
14.2
14.616.0
15.5
11.3
23.7
14.1
Q1
Q2
Q3
Q4
Q1
Q2
Q3
Q4
Q1
Q2
Q3
Q4
Q1
Q2
Q3
Q4
Q1
Q2
Q3
Q4
Q1
Q2
Q3
Q4
Q1
Q2
Q3
Q4
Q1
Q2
Q3
Q4
Q1
Q2
Q3
Q4
Q1
Q2
Q3
Q4
Q1
Q2
Q3
Q4
Q1
2004 2005 2006 2007 2008 2009 2010 2011 2012 2013 2014 '15
Wind Solar Other

15
Note: Total values include estimates for undisclosed deals. Excludes corporate and government R&D, and spending for
digital energy and energy storage projects (reported in annual statistics only). Source: Bloomberg New Energy Finance
10 April 2015
AMER NEW INVESTMENT IN CLEAN ENERGY BY SECTOR Q1 2004-Q1 2015 ($BN)
1.62.01.82.42.8
5.23.9
6.2
8.38.48.8
13.3
11.210.3
13.5
17.3
12.4
15.8
11.9
13.7
5.5
12.0
9.910.511.7
14.7
10.9
18.9
10.4
20.2
22.4
17.4
12.7
18.3
12.412.6
6.7
14.7
10.9
20.1
14.8
18.8
14.5
14.9
12.7
Q1
Q2
Q3
Q4
Q1
Q2
Q3
Q4
Q1
Q2
Q3
Q4
Q1
Q2
Q3
Q4
Q1
Q2
Q3
Q4
Q1
Q2
Q3
Q4
Q1
Q2
Q3
Q4
Q1
Q2
Q3
Q4
Q1
Q2
Q3
Q4
Q1
Q2
Q3
Q4
Q1
Q2
Q3
Q4
Q1
2004 2005 2006 2007 2008 2009 2010 2011 2012 2013 2014 '15
Wind Solar Other

16
Note: Total values include estimates for undisclosed deals. Excludes corporate and government R&D, and spending for
digital energy and energy storage projects (reported in annual statistics only). Source: Bloomberg New Energy Finance
10 April 2015
APAC NEW INVESTMENT IN CLEAN ENERGY BY SECTOR Q1 2004-Q1 2015 ($BN)
3.32.0
3.02.64.14.24.3
6.05.65.0
6.17.36.6
7.89.39.69.0
12.511.1
10.0
12.110.7
15.1
16.8
14.615.7
17.916.9
18.5
22.921.3
20.119.1
28.7
26.3
23.2
19.7
32.8
29.8
26.7
28.6
37.7
39.3
29.1
23.8
Q1
Q2
Q3
Q4
Q1
Q2
Q3
Q4
Q1
Q2
Q3
Q4
Q1
Q2
Q3
Q4
Q1
Q2
Q3
Q4
Q1
Q2
Q3
Q4
Q1
Q2
Q3
Q4
Q1
Q2
Q3
Q4
Q1
Q2
Q3
Q4
Q1
Q2
Q3
Q4
Q1
Q2
Q3
Q4
Q1
2004 2005 2006 2007 2008 2009 2010 2011 2012 2013 2014 '15
Wind Solar Other

17
*Asset finance adjusted for re-invested equity
Note: Total values include estimates for undisclosed deals. Excludes corporate and government R&D, and spending for
digital energy and energy storage projects (reported in annual statistics only). Source: Bloomberg New Energy Finance
10 April 2015
NEW INVESTMENT IN CLEAN ENERGY BY ASSET CLASS Q1 2004-Q1 2015 ($BN)
9.312.2
9.010.6
13.2
20.5
15.7
20.621.8
27.3
23.2
37.1
27.8
35.437.6
52.4
35.9
51.9
46.044.4
30.4
50.647.6
44.8
50.4
56.258.6
68.9
57.3
77.7
73.8
64.8
54.0
71.6
60.2
64.4
43.1
64.6
54.8
61.559.3
72.1
65.167.6
50.5
Q1
Q2
Q3
Q4
Q1
Q2
Q3
Q4
Q1
Q2
Q3
Q4
Q1
Q2
Q3
Q4
Q1
Q2
Q3
Q4
Q1
Q2
Q3
Q4
Q1
Q2
Q3
Q4
Q1
Q2
Q3
Q4
Q1
Q2
Q3
Q4
Q1
Q2
Q3
Q4
Q1
Q2
Q3
Q4
Q1
2004 2005 2006 2007 2008 2009 2010 2011 2012 2013 2014 '15
Asset finance* Public markets VC/PE Small distributed capacity

18
Source: Bloomberg New Energy Finance
10 April 2015
PUBLIC MARKET NEW INVESTMENT IN CLEAN ENERGY Q1 2004-Q1 2015 ($BN)
Note: Total values include estimates for undisclosed deals.
0.20.1 0.40.80.90.7
2.61.8
4.3
1.0
3.23.23.83.8
13.2
1.1
6.9
2.8
1.00.4
4.84.0
5.9
1.4
3.33.6
5.54.54.4
1.51.00.8
1.51.9
0.61.0
3.8
2.1
5.4
6.4
5.25.3
1.72.2
Q1
Q2
Q3
Q4
Q1
Q2
Q3
Q4
Q1
Q2
Q3
Q4
Q1
Q2
Q3
Q4
Q1
Q2
Q3
Q4
Q1
Q2
Q3
Q4
Q1
Q2
Q3
Q4
Q1
Q2
Q3
Q4
Q1
Q2
Q3
Q4
Q1
Q2
Q3
Q4
Q1
Q2
Q3
Q4
Q1
2004 2005 2006 2007 2008 2009 2010 2011 2012 2013 2014 '15
Four quarter running average

19
Source: Bloomberg New Energy Finance
10 April 2015
TOP PUBLIC MARKET TRANSACTIONS OF THE QUARTER Q1 2015
Organisation Stock exchange Sector Type of
transaction
New equity
raised
Total
offering size
SunEdison New York Stock
Exchange (NYSE) Solar Convertible $460m $460m
TerraForm Power NASDAQ Global Select
Market (GS) Solar Secondary $404.8m $404.8m
Pattern Energy NASDAQ Global Select
Market (GS) Wind Secondary $204.8m $351.m
Xinyi Solar Holdings Hong Kong Stock
Exchange (HKEX) Solar Secondary $148.2m $148.2m
SolarEdge Technologies NASDAQ Global Select
Market (GS) Solar IPO $144.9m $144.9m

20
Note: Total values include estimates for undisclosed deals. Source: Bloomberg New Energy Finance
10 April 2015
VC/PE NEW INVESTMENT IN CLEAN ENERGY Q1 2004-Q1 2015 ($BN)
0.20.60.30.30.60.70.40.81.11.51.8
1.22.1
1.51.82.62.4
3.1
4.2
2.6
1.3
1.82.21.4
2.82.81.61.92.02.32.01.91.81.9
1.21.5 1.51.10.60.91.2
1.51.0
1.11.0
Q1
Q2
Q3
Q4
Q1
Q2
Q3
Q4
Q1
Q2
Q3
Q4
Q1
Q2
Q3
Q4
Q1
Q2
Q3
Q4
Q1
Q2
Q3
Q4
Q1
Q2
Q3
Q4
Q1
Q2
Q3
Q4
Q1
Q2
Q3
Q4
Q1
Q2
Q3
Q4
Q1
Q2
Q3
Q4
Q1
2004 2005 2006 2007 2008 2009 2010 2011 2012 2013 2014 '15
Four quarter running average
21
Source: Bloomberg New Energy Finance
10 April 2015
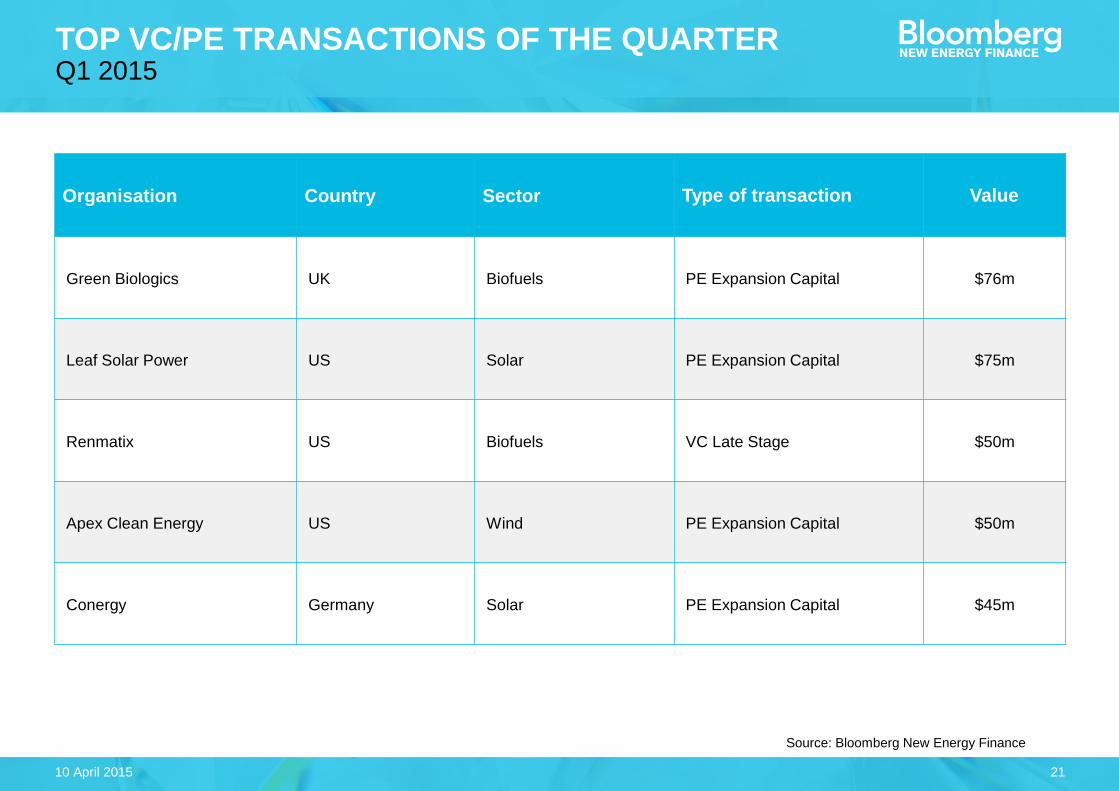
TOP VC/PE TRANSACTIONS OF THE QUARTER Q1 2015
Organisation Country Sector Type of transaction Value
Green Biologics UK Biofuels PE Expansion Capital $76m
Leaf Solar Power US Solar PE Expansion Capital $75m
Renmatix US Biofuels VC Late Stage $50m
Apex Clean Energy US Wind PE Expansion Capital $50m
Conergy Germany Solar PE Expansion Capital $45m
22
Note: Total values include estimates for undisclosed deals. Excludes spending for digital energy and energy storage
projects (reported in annual statistics only). Source: Bloomberg New Energy Finance
10 April 2015
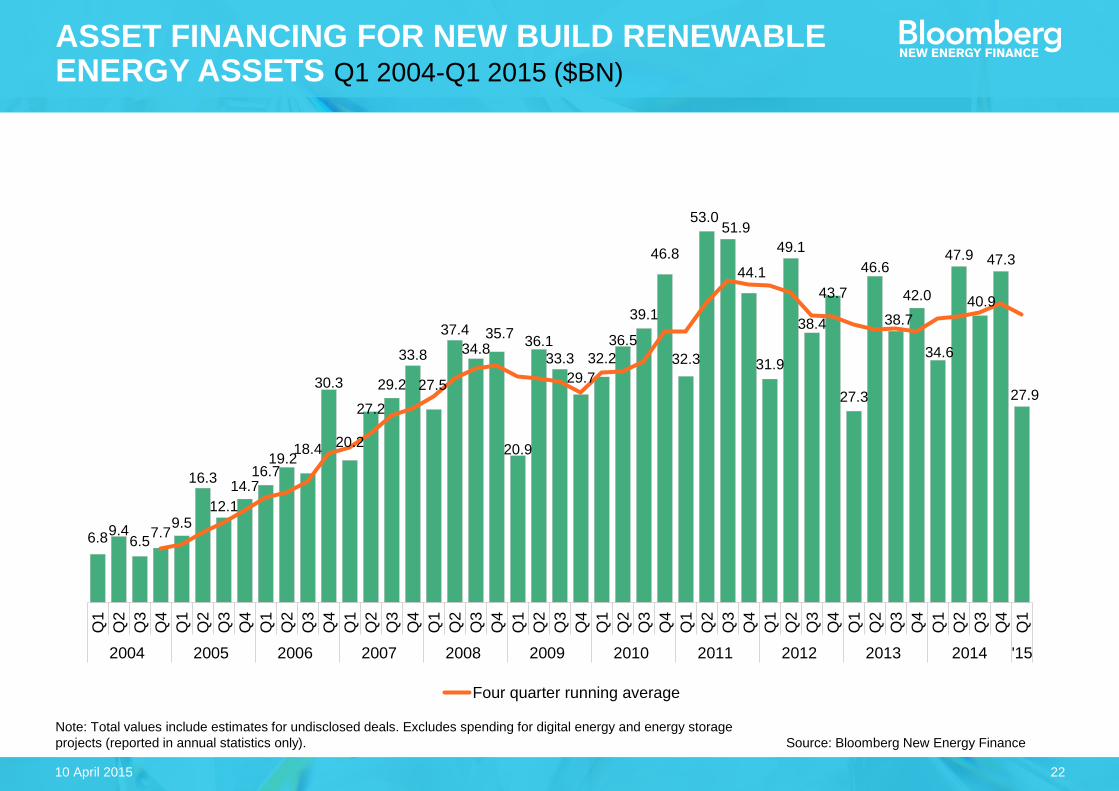
ASSET FINANCING FOR NEW BUILD RENEWABLE ENERGY ASSETS Q1 2004-Q1 2015 ($BN)
6.89.4
6.57.7
9.5
16.3
12.1
14.716.7
19.218.4
30.3
20.2
27.2
29.2
33.8
27.5
37.4
34.835.7
20.9
36.1
33.3
29.7
32.2
36.5
39.1
46.8
32.3
53.051.9
44.1
31.9
49.1
38.4
43.7
27.3
46.6
38.7
42.0
34.6
47.9
40.9
47.3
27.9
Q1
Q2
Q3
Q4
Q1
Q2
Q3
Q4
Q1
Q2
Q3
Q4
Q1
Q2
Q3
Q4
Q1
Q2
Q3
Q4
Q1
Q2
Q3
Q4
Q1
Q2
Q3
Q4
Q1
Q2
Q3
Q4
Q1
Q2
Q3
Q4
Q1
Q2
Q3
Q4
Q1
Q2
Q3
Q4
Q1
2004 2005 2006 2007 2008 2009 2010 2011 2012 2013 2014 '15
Four quarter running average

23
Source: Bloomberg New Energy Finance
10 April 2015
TOP ASSET FINANCE TRANSACTIONS OF THE QUARTER Q1 2015
Project name Country Sector Type of transaction Capacity Value
Nordsee 1 Offshore Wind
Farm Germany Wind Term loan 332MW $1279m
Xina Solar One STEG Plant South Africa Solar Term loan 100MW $888m
Ilangalethu Karoshoek Solar
Valley STEG Plant South Africa Solar Term loan 100MW Undisclosed
Apex Kay Wind Farm US Wind Construction loan 300MW $427m
Balko Wind Farm US Wind Construction loan 300MW Undisclosed

QUARTERLY TRENDS IN CLEAN ENERGY: FUNDS IN CIRCULATION

25
Note: Total values include estimates for undisclosed deals. Excludes spending for digital energy and energy storage
projects (reported in annual statistics only). Source: Bloomberg New Energy Finance
10 April 2015
FUNDS IN CIRCULATION IN CLEAN ENERGY Q1 2004-Q1 2015 ($BN)
2.93.3
1.6
4.04.5
8.47.1
12.6
9.0
10.9
5.6
14.0
9.5
14.7
18.6
21.9
18.3
11.8
14.4
17.5
12.3
17.7
15.9
20.1
16.8
11.6
13.7
19.7
12.2
18.1
29.4
20.8
19.2
15.1
12.0
25.3
20.3
18.0
16.2
16.7
18.4
18.9
21.3
16.6
19.0
Q1
Q2
Q3
Q4
Q1
Q2
Q3
Q4
Q1
Q2
Q3
Q4
Q1
Q2
Q3
Q4
Q1
Q2
Q3
Q4
Q1
Q2
Q3
Q4
Q1
Q2
Q3
Q4
Q1
Q2
Q3
Q4
Q1
Q2
Q3
Q4
Q1
Q2
Q3
Q4
Q1
Q2
Q3
Q4
Q1
2004 2005 2006 2007 2008 2009 2010 2011 2012 2013 2014 '15
Four quarter running average

26
Source: Bloomberg New Energy Finance
10 April 2015
TOP TRANSACTIONS FOR FUNDS IN CIRCULATION Q1 2015
Organisation Country Sector Type of
transaction Acquirer Value
First Wind Holdings US Wind Equity (company) SunEdison, TerraForm Power $1898m
Ormat Industries Israel Geothermal Equity (company) Ormat Technologies $1642m
NRG Energy US Wind Asset NRG Yield $1226m
Saeta Yield Spain Wind Investor Exit Undisclosed $503m
NRG US Portfolio NRG Yield
Acquisition US Wind Balance Sheet NRG Yield
Undisclosed
(785MW)

27
Note: Total values include estimates for undisclosed deals Source: Bloomberg New Energy Finance
10 April 2015
CORPORATE M&A TRANSACTIONS IN CLEAN ENERGY Q1 2004-Q1 2015 ($BN)
1.21.00.92.1
1.4
5.5
2.0
4.54.73.5
2.7
3.63.74.8
7.2
9.3
7.6
3.1
5.5
3.5
5.4
3.0
6.2
8.27.3
3.74.6
6.2
3.4
7.6
16.6
8.8
5.4
2.92.23.1
4.74.7
4.9
2.6
6.6
3.1 3.62.4
8.6
Q1
Q2
Q3
Q4
Q1
Q2
Q3
Q4
Q1
Q2
Q3
Q4
Q1
Q2
Q3
Q4
Q1
Q2
Q3
Q4
Q1
Q2
Q3
Q4
Q1
Q2
Q3
Q4
Q1
Q2
Q3
Q4
Q1
Q2
Q3
Q4
Q1
Q2
Q3
Q4
Q1
Q2
Q3
Q4
Q1
2004 2005 2006 2007 2008 2009 2010 2011 2012 2013 2014 '15
Four quarter running average

28
Note: Total values include estimates for undisclosed deals Source: Bloomberg New Energy Finance
10 April 2015
RENEWABLE ENERGY ASSET ACQUISITIONS & REFINANCING Q1 2004-Q1 2015 ($BN)
1.41.70.6
1.51.71.5
2.8
6.5
3.94.0
2.4
8.9
3.2
6.9
9.810.8
9.9
6.26.9
12.3
6.7
12.7
8.79.7
8.17.1
7.89.17.8
10.0
11.311.0
12.711.0
9.0
21.1
15.2
10.410.5
13.2
10.7
14.0
16.6
13.2
8.2
Q1
Q2
Q3
Q4
Q1
Q2
Q3
Q4
Q1
Q2
Q3
Q4
Q1
Q2
Q3
Q4
Q1
Q2
Q3
Q4
Q1
Q2
Q3
Q4
Q1
Q2
Q3
Q4
Q1
Q2
Q3
Q4
Q1
Q2
Q3
Q4
Q1
Q2
Q3
Q4
Q1
Q2
Q3
Q4
Q1
2004 2005 2006 2007 2008 2009 2010 2011 2012 2013 2014 '15
Four quarter running average

CLEAN ENERGY INDEXES

30 10 April 2015
Note: Values as of 09 April 2015; NASDAQ and S&P 500 rebased to 100 on 1 Jan 2003 Source: Bloomberg New Energy Finance
NEX CLEAN ENERGY INDEX 2003–15 YTD
S&P 500NASDAQNEX
0
100
200
300
400
500
Jan 03 Jan 05 Jan 07 Jan 09 Jan 11 Jan 13 Jan 15

31 10 April 2015
Note: Values as of 09 April 2015; NASDAQ and S&P 500 rebased to 100 on 1 Jan 2011 Source: Bloomberg New Energy Finance
NEX CLEAN ENERGY INDEX 2012–15 YTD
S&P 500NASDAQNEX
40
60
80
100
120
140
160
180
200
Jan 12 Jul 12 Jan 13 Jul 13 Jan 14 Jul 14 Jan 15 Jul 15
32 10 April 2015
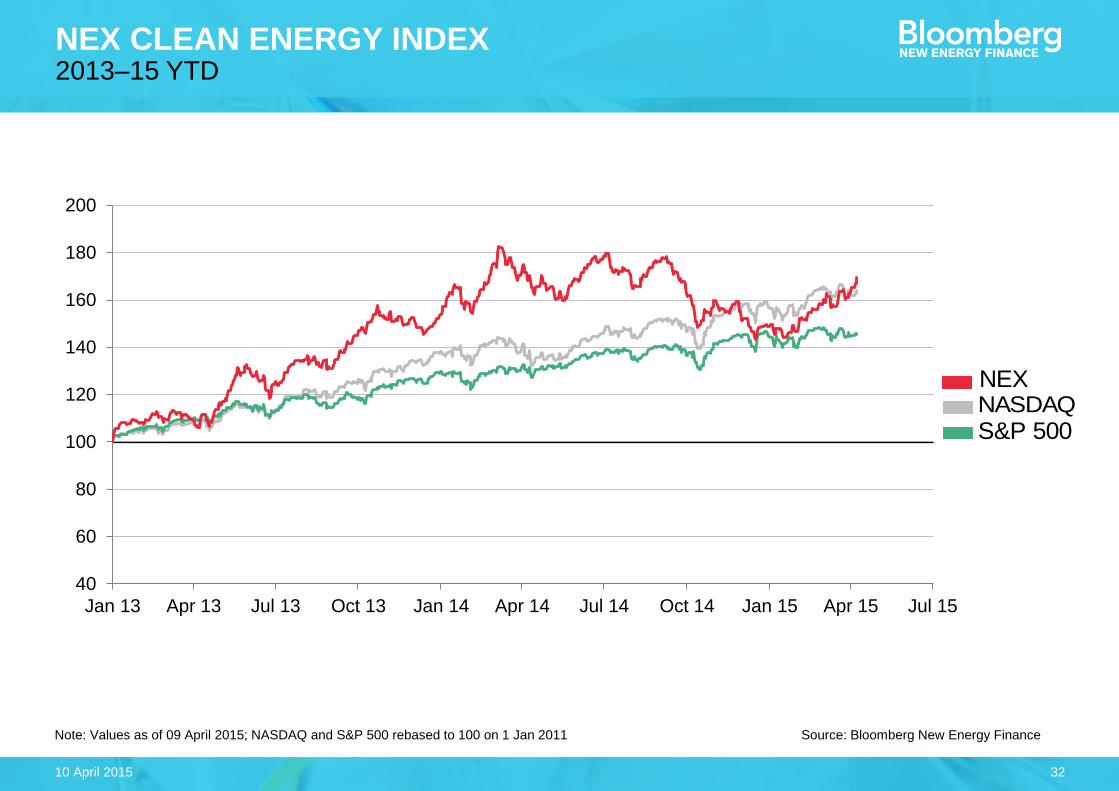
Note: Values as of 09 April 2015; NASDAQ and S&P 500 rebased to 100 on 1 Jan 2011 Source: Bloomberg New Energy Finance
NEX CLEAN ENERGY INDEX 2013–15 YTD
S&P 500NASDAQNEX
40
60
80
100
120
140
160
180
200
Jan 13 Apr 13 Jul 13 Oct 13 Jan 14 Apr 14 Jul 14 Oct 14 Jan 15 Apr 15 Jul 15

33 10 April 2015
Note: Values as of 10 April 2015; NASDAQ and S&P 500 rebased to 100 on 1 Jan 2011 Source: Bloomberg New Energy Finance
NEX CLEAN ENERGY INDEX 2014–15 YTD
S&P 500NASDAQNEX
80
90
100
110
120
130
Jan 14 Mar 14 May 14 Jul 14 Sep 14 Nov 14 Jan 15 Mar 15 May 15 Jul 15
S&P 500NASDAQNEX
40
60
80
100
120
140
160
180
200
Jan 13 Apr 13 Jul 13 Oct 13 Jan 14 Apr 14 Jul 14 Oct 14 Jan 15 Apr 15 Jul 15

34
Note: Values as of 10 April 2015; NASDAQ and S&P 500 rebased to 1,000 on 30 December 2005 Source: Bloomberg New Energy Finance
10 April 2015
NYSE BNEF REGIONAL CLEAN ENERGY INDEXES 2006-15 YTD
0
500
1,000
1,500
2,000
2,500
3,000
Jan 06 Jan 07 Jan 08 Jan 09 Jan 10 Jan 11 Jan 12 Jan 13 Jan 14 Jan 15
NYSE NEF AMERIndex
NYSE NEF APACIndex
NYSE NEF EMEAIndex
MSCI World &Emerging

35
Note: Values as of 10 April 2015; NASDAQ and S&P 500 rebased to 1,000 on 30 December 2005 Source: Bloomberg New Energy Finance
10 April 2015
NYSE GLOBAL CLEAN ENERGY SECTOR INDEXES 2006-15 YTD
0
500
1,000
1,500
2,000
2,500
3,000
3,500
4,000
Jan 06 Jan 07 Jan 08 Jan 09 Jan 10 Jan 11 Jan 12 Jan 13 Jan 14 Jan 15
NYSE BNEFWind Index
NYSE BNEFSolar Index
NYSE BNEFEST Index
MSCI World &Emerging

36
This publication is the copyright of Bloomberg New Energy Finance. No portion of this document may be photocopied,
reproduced, scanned into an electronic system or transmitted, forwarded or distributed in any way without prior consent of
Bloomberg New Energy Finance.
The information contained in this publication is derived from carefully selected sources we believe are reasonable. We do
not guarantee its accuracy or completeness and nothing in this document shall be construed to be a representation of such
a guarantee. Any opinions expressed reflect the current judgment of the author of the relevant article or features, and does
not necessarily reflect the opinion of Bloomberg New Energy Finance, Bloomberg Finance L.P., Bloomberg L.P. or any of
their affiliates ("Bloomberg"). The opinions presented are subject to change without notice. Bloomberg accepts no
responsibility for any liability arising from use of this document or its contents. Nothing herein shall constitute or be
construed as an offering of financial instruments, or as investment advice or recommendations by Bloomberg of an
investment strategy or whether or not to "buy," "sell" or "hold" an investment.
COPYRIGHT AND DISCLAIMER
10 April 2015
Unique analysis, tools and data for decision-makers driving
change in the energy system
MARKETS Renewable Energy
Energy Smart Technologies
Advanced Transport
Gas
Carbon and RECs
SERVICES Americas Service
Asia Pacific Service
EMEA Service
Applied Research
Events and Workshops Noemi Glickman Marketing & Communications
+44 (0)20 7392 0575
Related Documents