Citation: Zhang, X.; Zhang, L.; Pu, Y.; Sun, M.; Zhao, Y.; Zhang, D.; Wang, X.; Li, Y.; Guo, D.; He, S. Global, Regional, and National Burden of Protein–Energy Malnutrition: A Systematic Analysis for the Global Burden of Disease Study. Nutrients 2022, 14, 2592. https://doi.org/ 10.3390/nu14132592 Academic Editor: Christophe Moinard Received: 16 May 2022 Accepted: 21 June 2022 Published: 22 June 2022 Publisher’s Note: MDPI stays neutral with regard to jurisdictional claims in published maps and institutional affil- iations. Copyright: © 2022 by the authors. Licensee MDPI, Basel, Switzerland. This article is an open access article distributed under the terms and conditions of the Creative Commons Attribution (CC BY) license (https:// creativecommons.org/licenses/by/ 4.0/). nutrients Article Global, Regional, and National Burden of Protein–Energy Malnutrition: A Systematic Analysis for the Global Burden of Disease Study Xu Zhang 1,† , Lu Zhang 2,† , Yuanchun Pu 2,† , Min Sun 1 , Yan Zhao 1 , Dan Zhang 1 , Xin Wang 1 , Yarui Li 1 , Dan Guo 1 and Shuixiang He 1, * 1 Department of Gastroenterology, The First Affiliated Hospital of Xi’an Jiaotong University, Xi’an 710061, China; [email protected] (X.Z.); [email protected] (M.S.); [email protected] (Y.Z.); [email protected] (D.Z.); [email protected] (X.W.); [email protected] (Y.L.); [email protected] (D.G.) 2 Department of Urology, The First Affiliated Hospital of Xi’an Jiaotong University, Xi’an 710061, China; [email protected] (L.Z.); [email protected] (Y.P.) * Correspondence: [email protected] † These authors contributed equally to this work. Abstract: Background: Statistical data on the prevalence, mortality, and disability-adjusted life years (DALYs) of protein–energy malnutrition are valuable for health resource planning and policy-making. We aimed to estimate protein–energy malnutrition burdens worldwide according to gender, age, and sociodemographic index (SDI) between 1990 and 2019. Methods: Detailed data on protein–energy malnutrition from 1990 to 2019 was extracted from the Global Burden of Disease (GBD) database. The global prevalence, deaths, and DALYs attributable to protein–energy malnutrition and the corresponding age-standardized rates (ASRs) were analyzed. Results: In 2019, the global prevalence of protein–energy malnutrition increased to 14,767,275 cases. The age-standardized prevalence rate (ASPR) showed an increasing trend between 1990 and 2019, while the age-standardized deaths rate (ASDR) and age-standardized DALYs rate presented a significantly decreasing trend in the same period. Meanwhile, there was a clearly ASPR, ASDR, and age-standardized DALYs rate downtrend of the prediction curve when the SDI went up. Conclusions: PEM still has a relatively serious disease burden in the world, especially in children and the elderly. At the same time, this phenomenon will be more obvious due to the aging of the world’s population. Effective prevention measures should be strengthened to continuously improve public health conditions. Keywords: protein–energy malnutrition; global burden of disease; prevalence; death; disability-adjusted life years 1. Introduction Malnutrition was defined as “a subacute or chronic state of nutrition, in which a combination of varying degrees of under- or overnutrition and inflammatory activity has led to changes in body composition and diminished function” [1,2]. Protein–Energy Malnutrition (PEM) is a series of diseases due to the malnutrition of all macronutrients, including marasmus, intermediate states of kwashiorkor-marasmus, and kwashiorkor. PEM is a common nutritional problem worldwide and can be seen in both developed and developing countries. The prevalence of the PEM in the older communities varied by region, from 0.8% to 24.6%, and it is also affected by the gender sampling frame and rurality [3]. The number of cases of children with PEM is declining globally but also varies by region; for example, it continues to decline in Asia but is increasing in Africa [4]. In addition, PEM poses a threat to public health, especially in children and the elderly, by impairing the immune response, which can lead to death [3,5]. Although the global Nutrients 2022, 14, 2592. https://doi.org/10.3390/nu14132592 https://www.mdpi.com/journal/nutrients

Welcome message from author
This document is posted to help you gain knowledge. Please leave a comment to let me know what you think about it! Share it to your friends and learn new things together.
Transcript

Citation: Zhang, X.; Zhang, L.; Pu, Y.;
Sun, M.; Zhao, Y.; Zhang, D.; Wang,
X.; Li, Y.; Guo, D.; He, S. Global,
Regional, and National Burden of
Protein–Energy Malnutrition: A
Systematic Analysis for the Global
Burden of Disease Study. Nutrients
2022, 14, 2592. https://doi.org/
10.3390/nu14132592
Academic Editor: Christophe
Moinard
Received: 16 May 2022
Accepted: 21 June 2022
Published: 22 June 2022
Publisher’s Note: MDPI stays neutral
with regard to jurisdictional claims in
published maps and institutional affil-
iations.
Copyright: © 2022 by the authors.
Licensee MDPI, Basel, Switzerland.
This article is an open access article
distributed under the terms and
conditions of the Creative Commons
Attribution (CC BY) license (https://
creativecommons.org/licenses/by/
4.0/).
nutrients
Article
Global, Regional, and National Burden of Protein–EnergyMalnutrition: A Systematic Analysis for the Global Burden ofDisease StudyXu Zhang 1,†, Lu Zhang 2,†, Yuanchun Pu 2,†, Min Sun 1, Yan Zhao 1, Dan Zhang 1, Xin Wang 1, Yarui Li 1, Dan Guo 1
and Shuixiang He 1,*
1 Department of Gastroenterology, The First Affiliated Hospital of Xi’an Jiaotong University,Xi’an 710061, China; [email protected] (X.Z.); [email protected] (M.S.);[email protected] (Y.Z.); [email protected] (D.Z.); [email protected] (X.W.);[email protected] (Y.L.); [email protected] (D.G.)
2 Department of Urology, The First Affiliated Hospital of Xi’an Jiaotong University, Xi’an 710061, China;[email protected] (L.Z.); [email protected] (Y.P.)
* Correspondence: [email protected]† These authors contributed equally to this work.
Abstract: Background: Statistical data on the prevalence, mortality, and disability-adjusted life years(DALYs) of protein–energy malnutrition are valuable for health resource planning and policy-making.We aimed to estimate protein–energy malnutrition burdens worldwide according to gender, age, andsociodemographic index (SDI) between 1990 and 2019. Methods: Detailed data on protein–energymalnutrition from 1990 to 2019 was extracted from the Global Burden of Disease (GBD) database.The global prevalence, deaths, and DALYs attributable to protein–energy malnutrition and thecorresponding age-standardized rates (ASRs) were analyzed. Results: In 2019, the global prevalenceof protein–energy malnutrition increased to 14,767,275 cases. The age-standardized prevalence rate(ASPR) showed an increasing trend between 1990 and 2019, while the age-standardized deaths rate(ASDR) and age-standardized DALYs rate presented a significantly decreasing trend in the sameperiod. Meanwhile, there was a clearly ASPR, ASDR, and age-standardized DALYs rate downtrendof the prediction curve when the SDI went up. Conclusions: PEM still has a relatively serious diseaseburden in the world, especially in children and the elderly. At the same time, this phenomenon willbe more obvious due to the aging of the world’s population. Effective prevention measures shouldbe strengthened to continuously improve public health conditions.
Keywords: protein–energy malnutrition; global burden of disease; prevalence; death; disability-adjustedlife years
1. Introduction
Malnutrition was defined as “a subacute or chronic state of nutrition, in which acombination of varying degrees of under- or overnutrition and inflammatory activityhas led to changes in body composition and diminished function” [1,2]. Protein–EnergyMalnutrition (PEM) is a series of diseases due to the malnutrition of all macronutrients,including marasmus, intermediate states of kwashiorkor-marasmus, and kwashiorkor.PEM is a common nutritional problem worldwide and can be seen in both developedand developing countries. The prevalence of the PEM in the older communities variedby region, from 0.8% to 24.6%, and it is also affected by the gender sampling frame andrurality [3]. The number of cases of children with PEM is declining globally but alsovaries by region; for example, it continues to decline in Asia but is increasing in Africa [4].In addition, PEM poses a threat to public health, especially in children and the elderly,by impairing the immune response, which can lead to death [3,5]. Although the global
Nutrients 2022, 14, 2592. https://doi.org/10.3390/nu14132592 https://www.mdpi.com/journal/nutrients

Nutrients 2022, 14, 2592 2 of 17
incidence rate of protein–energy malnutrition has decreased in recent years [4], with theprogress of medicine and health and the development of the food industry, it still causesan unavoidable health burden for all age groups. It is a top priority for us to make a hugecontribution to solving such a public burden.
Some previous studies provided disease data for a specific population, yet there hasbeen no research specifically addressing the global burden of protein–energy malnutritionand its changes. The purpose of this study was to assess the risk of protein–energymalnutrition based on global burden data and to describe the geographical location, age,gender, and SDI (socio-demographic index) of protein–energy malnutrition in 204 countriesand territories from 1990 to 2019. We calculated ASPR (age-standardized prevalence rate),DALY (disability-adjusted life year), EAPC (estimated annual percentage change), andother indicators which were already used in different fields, such as cardiovascular diseasesand pulmonary diseases, to clarify the different causes and trends of protein–energymalnutrition [6–8]. This study examines the various relationships of protein malnutritionin different regions and countries so that decision-makers can reasonably allocate socialresources and release the social health burden of protein capacity malnutrition.
2. Materials and Methods2.1. Data Source
The latest release of the Global Burden of Disease, Injuries, and Risk Factors Study (GBD)2019 results was applied. The data was obtained on the official GBD website (http://ghdx.healthdata.org/gbd-2019 (accessed on 20 January 2022)) according to operation guidelines,without any inclusion or exclusion criteria. Data sources for the burden of protein–energymalnutrition were extracted with the Global Health Data Exchange (GHDx) query tool(http://ghdx.healthdata.org/gbd-results-tool (accessed on 20 January 2022)). Protein–energymalnutrition includes moderate and severe acute malnutrition, commonly referred to as“wasting,” and was defined in terms of weight-for-height Z-scores (WHZ) on the WHO 2006growth standard for children. We quantified non-fatal PEM burden in four mutually exclusiveand collectively exhaustive categories, reflecting distinct gradations of disability that canoccur: moderate wasting without oedema (WHZ < −2 SD to < −3 SD), moderate wastingwith oedema (WHZ < −2 SD to < −3 SD), severe wasting without oedema (WHZ < −3 SD),and severe wasting with oedema (WHZ < −3 SD). For PEM, ICD 10 codes are E40–E46.9and E64.0, and ICD 9 codes are 260–263.9 [9]. We acquired data on the prevalence, mortality,and DALYs of protein–energy malnutrition and the respective age-standardized rate (ASR)of protein–energy malnutrition from 1990 to 2019. The 204 countries/territories were thencategorized into five categories on the basis of the sociodemographic index (SDI) in 2019: high,high-middle, middle, low-middle, and low SDI. Besides, the human development index (HDI)values were derived from the World Bank.
The GBD estimation process is based on identifying multiple relevant data sources,including censuses, household surveys, civil registration and vital statistics, disease reg-istries, health service use, and other sources. Each of these types of data is identifiedfrom a systematic review of published studies, searches of government and internationalorganization websites, primary data sources such as the Demographic and Health Surveys,and contributions of datasets by GBD collaborators. First, individual-level and tabulatedchild anthropometry data from health surveys, literature, and national reports were usedand centralized to inform the prevalence of weight-for-height Z-scores (WHZ) decrementin each category corresponding to our case definitions. Second, to inform the proportion ofchildren under 5 years who have signs of organ failure manifested as oedema (i.e., kwash-iorkor), a compiled dataset of surveys was conducted using Standardized Monitoring andAssessment of Relief and Transitions (SMART) methods. All data were extracted with themost detailed standard demographic identifiers available, including age, sex, country, year,and subnational location, if available [9].
Nutrients 2022, 14, 2592 3 of 17
2.2. Statistical Analysis
Estimated annual percentage change (EAPCs) and average annual percentage change(AAPCs) of age-standardized rates (ASRs) were calculated. We assumed that the naturallogarithm of ASR was linear along with time; hence, Y = α + βX + ε (X represents the cal-endar year, Y represents ln(ASR)), ε represents the error term, and β indicates the positiveor negative trends of ASRs). The formula of the EAPC was EAPC = 100 × (exp(β)− 1)and its 95% confidence intervals (CI) were calculated according to the linear model. WhenEAPC and the upper boundary of CI are negative, ASR represents a descending trend. Incontrast, ASR is considered to be in an upward trend.
Average Annual Percent Change (AAPC) is a single number which represents the occur-rence of disease in a population via applying the geometrically weighted averages for annualpercent changes. The analysis was performed by the JointPoint Regression Program 4.9.0.1(National Cancer Institute, Bethesda, MD, USA) provided by the United States NationalCancer Institute Surveillance Research Program. To obtain the AAPCs, the software wasapplied to track trends in GBD data over time and then fit an underlying model possible tothe data via connecting different line segments on a logarithmic scale. The segments are called“JointPoints”, and each is tested for significance by a Monte Carlo permutation method. Theanalyses were performed using R statistical software version 4.1.2 (https://www.r-project.org(accessed on 25 February 2022)). p < 0.05 was regarded as statistically significant.
3. Results3.1. Global Burden of Protein–Energy Malnutrition
In 2019, there were 14,767,275 (95% CI = 130,405,924–167,471,360) prevalence cases,and the age-standardized prevalence rate (ASPR) was 2006.4 (95% CI = 1786–2261.3) per100,000 population. It is noteworthy that ASPR EAPC showed an increasing trend of, onaverage, 0.19% (95% CI = 0.08–0.31%) per year (Table 1).
Table 1. The prevalence cases and age-standardized prevalence of PEM in 1990 and 2019, and itstemporal trends from 1990.
1990 2019 1990–2019
Prevalence CasesNo. (95% UI)
ASR per 100,000No. (95% UI)
Prevalence CasesNo. (95% UI)
ASR per 100,000No. (95% UI)
EAPCNo. (95% CI)
Global 100,977,331.3(92,783,224.2–110,877,370.1)
1743.1(1587.1–1928.7)
147,672,757.9(130,405,923.7–167,471,359.5)
2006.4(1786–2261.3) 0.19 (0.08–0.31)
Social-demographicindex
Low SDI 17,156,823.7(16,449,965.2–18,031,793.4)
2218.2(2076.1–2387.2)
28,682,621.5(26,973,402.2–30,794,848.6)
2030.2(1872.4–2221.8)
−0.61(−0.72–0.51)
Low-middle SDI 34,823,174.6(32,775,266.5–37,362,791.2)
2445.7(2262.2–2670.4)
42,123,907.2(37,747,744.6–47,459,684)
2429.1(2186.2–2723.2)
−0.45(−0.58–0.32)
Middle SDI 29,621,821.1(26,779,018.9–33,164,070.2)
1648.3(1479.7–1848.9)
44,926,275.8(38,798,928.9–52,033,671.7)
1996.2(1748.7–2288.2) 0.42 (0.31–0.52)
High-middle SDI 12,900,075.5(11,312,222.2–14,908,449.5)
1166(1029.2–1337.5)
21,951,415(18,393,911.9–26,054,900.4)
1638(1401.6–1919.3) 0.98 (0.85–1.1)
High SDI 6,429,788.8(5,347,783.1–7,673,702.3) 788.6 (661.2–944.7) 9,921,037.9
(8,203,301.8–11,768,169.2) 923.1 (765.9–1105.5) 0.2 (0.08–0.33)
Region
Central Asia 745,903.7(702,157.8–794,880.2) 849.7 (789.3–920) 825,914 (754,870–909,758.1) 874.5 (799.9–962.6) −0.07
(−0.15–0)
Central Europe 760,858.2(641,646.6–908,940.9) 718.7 (621.9–839.5) 826,696.3
(689,623.4–991,992.1) 858 (734.7–1012) 0.53 (0.45–0.61)
Eastern Europe 1,514,453.3(1,325,633.1–1,750,709.8) 795.2 (708.8–899.2) 1,374,636.6
(1,171,915.8–1,626,208.8) 866.9 (764.9–997.1) 0.04(−0.06–0.14)

Nutrients 2022, 14, 2592 4 of 17
Table 1. Cont.
1990 2019 1990–2019
Prevalence CasesNo. (95% UI)
ASR per 100,000No. (95% UI)
Prevalence CasesNo. (95% UI)
ASR per 100,000No. (95% UI)
EAPCNo. (95% CI)
Australasia 86,161.7 (71,127.9–102,835.3) 457.8 (384.1–541.3) 147,972.6(123,728.6–176,502.4) 522.9 (444.9–618.2) 0.41 (0.32–0.51)
High-incomeAsia Pacific
1,021,487.4(853,742.1–1,224,002.9) 664.5 (571.2–779.4) 1,218,063
(1,003,598.5–1,453,380.1) 716.6 (607.3–850) −0.15(−0.31–0.01)
High-incomeNorth America
1,747,931(1,392,721.8–2,150,830.2) 603.5 (481.9–748.9) 2,819,995.5
(2,271,045.4–3,422,009.3) 699.6 (558.7–863.1) −0.09(−0.27–0.1)
SouthernLatin America
338,303.3(293,896.6–390,650.5) 688.6 (596.8–795.6) 564,920.9
(477,318.1–666,322.6) 840.5 (715.9–985.5) 0.29 (0.06–0.52)
Western Europe 3,851,175.4(3,163,177.4–4,659,506) 983.4 (811.4–1201) 5,681,745.9
(4,686,331.5–6,704,396.3)1167.2
(959.1–1407.5) 0.39 (0.26–0.52)
AndeanLatin America
240,068.3(218,594.8–261,646.9) 652.1 (583.5–720) 355,853.7
(318,216.1–396,580.6) 573.8 (513.2–638.7) −0.92(−1.08–0.75)
Caribbean 325,151.1(298,094.6–356,433.9) 887.2 (805.6–976.6) 390,393.7
(347,659.3–436,540.6) 873.3 (785.8–970.6) −0.32(−0.41–0.23)
CentralLatin America
2,025,781.6(1,806,272–2,281,193.9)
1296.3(1134.6–1475)
2,681,644.3(2,293,249.8–3,139,277.2)
1102.6(948.2–1282.6)
−0.84(−1.14–0.55)
TropicalLatin America
1,159,104.5(1,044,944.5–1,292,708.6) 769.7 (687.3–864.7) 1,415,034.7
(1,225,954.6–1,634,539.4) 694.2 (613.7–790) −0.76(−0.9–0.63)
North Africa andMiddle East
5,892,716.2(5,553,048.4–6,340,665.1)
1298(1199.3–1424.7)
8,814,709.6(7,949,141.2–9,906,526.1)
1477.4(1335.7–1649.6) 0.23 (0.12–0.34)
South Asia 43,696,425.7(40,926,199.5–47,183,646.5)
3125(2874.5–3435.9)
57,490,327.3(50,908,475.1–65,795,679.3)
3316.7(2961.3–3752.9)
−0.27(−0.4–0.13)
East Asia 14,029,975.9(11,926,576.9–16,629,041.4) 1190 (1013–1403.5) 26,118,724.4
(21,263,244.6–31,657,526)1731.3
(1425.6–2098) 1.05 (0.91–1.19)
Oceania 147,114.8(139,460.9–155,676)
1817.8(1690.5–1947.6)
283,672.2(266,582.1–302,257.4)
1780.8(1647.1–1922.7)
−0.18(−0.3–0.06)
Southeast Asia 12,093,977.1(11,147,165.8–13,222,689.6)
2450.7(2227.3–2707.1)
16,142,385.4(14,315,450.9–18,265,959.5)
2563.6(2297.1–2876.1)
−0.07(−0.17–0.03)
CentralSub-Saharan Africa
1,332,271.9(1,282,265.5–1,387,876.2)
1514.5(1434.8–1600.2)
2,394,812.8(2,282,754.9–2,514,402.1)
1355.2(1274.6–1440.8)
−0.54(−0.65–0.44)
EasternSub-Saharan Africa
4,387,305.3(4,215,311.8–4,574,173)
1621.8(1513.8–1740)
7,009,047.6(6,721,523.8–7,341,028.7)
1347.4(1266–1438.5)
−0.84(−0.91–0.76)
SouthernSub-Saharan Africa
647,947.4(603,654.8–699,495)
1098.7(1006.1–1202.6)
789,790.3(724,192.5–864,048)
1012.4(925.9–1107.4)
−0.59(−0.71–0.47)
WesternSub-Saharan Africa
4,933,217.4(4,750,330.9–5,167,049)
1695.9(1592.7–1819)
10,326,417(9,839,148.9–10,911,512.6)
1690.4(1572.9–1821.5)
−0.12(−0.24–0.01)
There were 212,242 (95% CI = 185,403–246,217) death cases and the ASDR (age-standardized deaths rate) was 3 (95% CI = 2.6–3.5) per 100,000 population. Conversely,the EAPCs of the ASDR was −5.15% (95% CI = −5.5%–4.8%), which shows a decreasetrend (Table S2).
At the same time, PEM led 15,256,524 (95% CI = 12,565,114–18,327,803) DALYs with anage-standardized rate of DALYs 218.3 (95% CI = 179.5–262.8) per 100,000 population. Theage-standardized DALYs rate shows a significantly decreasing trend in the same period,−5.03% (95% CI = −5.27–4.79%) (Table S2).
3.2. Regional Burden of Protein–Energy Malnutrition
For different regions, in 2019, the highest ASPRs (per 100,000) appeared in South Asia(3316.7 (95% CI = 2961.3–3752.9)), Southeast Asia (2563.6 (95% CI = 2297.1–2876.1)), Oceania(1780.8 (95% CI = 1647.1–1922.7)), East Asia (1731.3 (95% CI = 1425.6–2098)), and WesternSub-Saharan Africa (1690.4 (95% CI = 1572.9–1821.5)), with the lowest ASPRs in Australasia

Nutrients 2022, 14, 2592 5 of 17
(522.9 (95% CI = 444.9–618.2)), Andean Latin America (573.8 (95% CI = 513.2–638.7)), andTropical Latin America (694.2 (95% CI = 613.7–790)). The biggest increase trend was inEast Asia (1.05 (95% CI = 0.91–1.19)), and the biggest decrease trend was in Andean LatinAmerica (−0.92 (−1.08–0.75) (Table 1)).
In the ASDR (per 100,000) part, the highest value was Eastern Sub-Saharan Africa (17.6(95% CI = 14.6–20.7)), with the lowest values in Eastern Europe (0.1 (95% CI = 0.1–0.1)),Central Europe (0.2 (95% CI = 0.1–0.2)), and Central Asia (0.2 (95% CI = 0.2–0.2)). Thehighest trend appeared in Central Europe (1.06 (95% CI = 0.5–1.63)), with the lowest trendin East Asia (−8.82 (95% CI = −11.27–6.31)) (Table S1).
The highest age-standardized rate of DALYs appeared in Eastern Sub-Saharan Africa(716.6 (95% CI = 585.7–886)), and the lowest were in Australasia (18.3 (95% CI = 12.6–25.8))and High-income Asia Pacific (20.2 (95% CI = 14.5–27.6)). The EAPC had the highest score inWestern Europe (0.44 (95% CI = 0.3–0.57)), which showed the biggest increase trend. Relatively,the biggest decrease trend appeared in East Asia (−8.99 (95% CI = −11.16–6.77)) (Table S2).
For the AAPC of prevalence, East Asia was top, High−middle SDI second, withEastern Sub−Saharan Africa at the bottom (Figure 1A). In the AAPC of deaths, most regionshad a negative number, with Central Europe, High−income North America, Australasia,Western Europe, and South Asia possessing the most negative number simultaneously(Figure 1B). As for the AAPC of DALYs, Western Europe had the biggest value, and SouthAsia had the smallest (Figure 1C). The relative values of DALYs are YLLs and YLDs.Only High−income North America achieved a positive value in the AAPC of YLLs, andEast Asia received the smallest negative number. However, East Asia got the biggestAAPC of YLDs. Eastern Sub−Saharan Africa was at the bottom in the AAPC of YLDs(Supplementary Figure S1).
3.3. National Burden of Protein–Energy Malnutrition
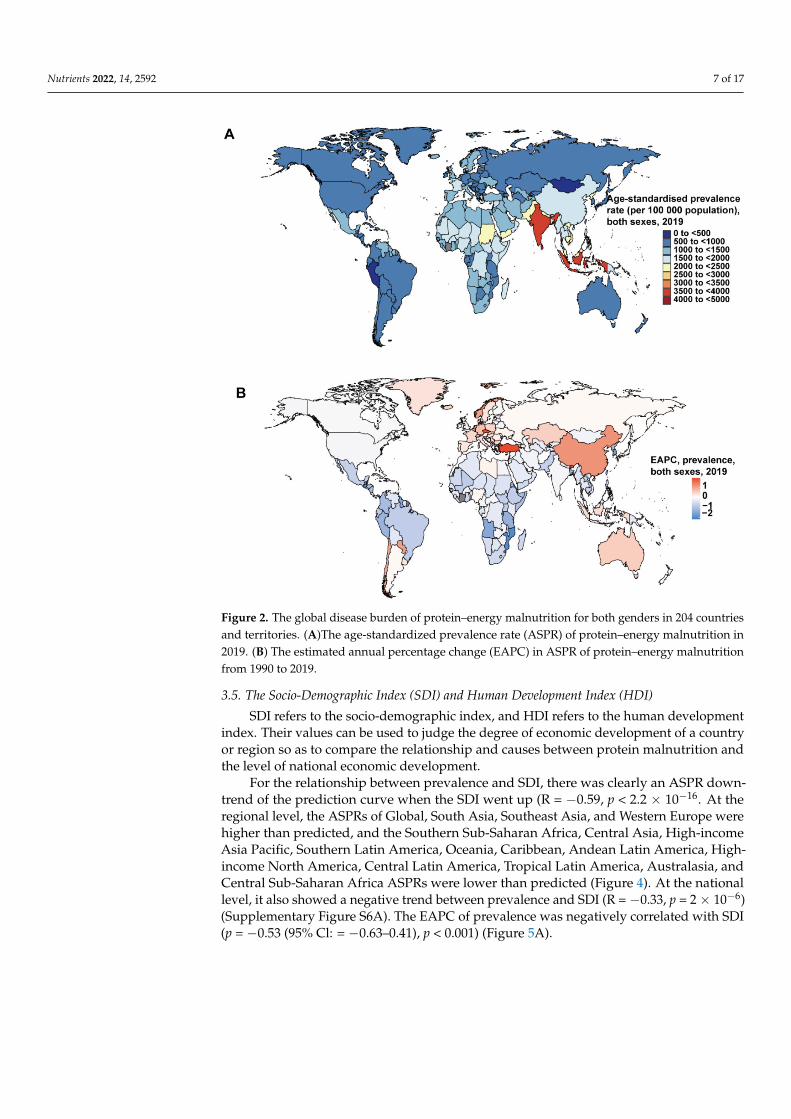
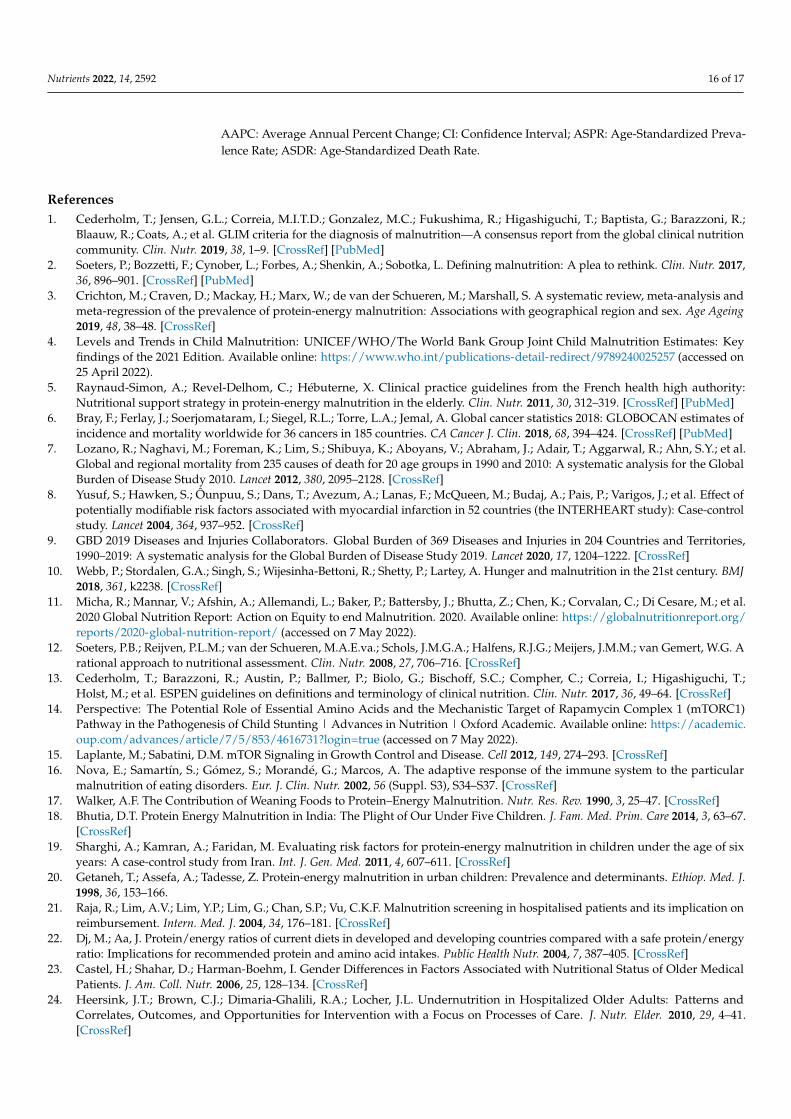
At the national level, the Maldives had the highest number of ASPR in 2019, whereasMongolia and Peru had the smallest number (Figure 2A). The Czech Republic had thebiggest EAPC of prevalence, and Guatemala had the smallest (Figure 1B). Mali had thehighest number of ASDRs (Supplementary Figure S2A). The Czech Republic had thebiggest EAPC of ASDR, and the Democratic People’s Republic of Korea had the smallest(Supplementary Figure S2B). Eritrea had the highest age-standardized DALYs rate, whileSingapore had the smallest number (Supplementary Figure S3A). The Czech Republic hadthe biggest EAPC of DALYs, and Cambodia had the smallest (Supplementary Figure S3B).
3.4. Age and Sex
For the prevalence rate, the prevalence basically increased with age, except childrenaged 1–4 had the highest prevalence (Figure 3A). For the death rate, the prevalence in-creased significantly with age, peaking at 95+, except in children aged 1–4 (Figure 3B).With the DALYs rate, the value of minors decreased with age, the value of adults increasedsignificantly with age, and female children aged 1–4 years were significantly higher thanmale children (Figure 3C). The trend of the DALYs rate also appeared in the YLL rate andYLD rate (Figure S4).

Nutrients 2022, 14, 2592 6 of 17Nutrients 2022, 14, x FOR PEER REVIEW 6 of 16
Figure 1. Average annual percentage change (AAPC) of the (A) age-standardized prevalence rate,
(B) age-standardized death rate, and (C) age-standardized disability-adjusted life year rates for pro-
tein–energy malnutrition from 1990 to 2019. AAPC was obtained representing the average percent
increase or decrease in PEM rates per year over each specified period of time to summarize and
compare these trends over the entire time period. Red dot represents a AAPC value greater than
zero, while blue dot represents a AAPC value less than zero.
Figure 1. Average annual percentage change (AAPC) of the (A) age-standardized prevalence rate,(B) age-standardized death rate, and (C) age-standardized disability-adjusted life year rates forprotein–energy malnutrition from 1990 to 2019. AAPC was obtained representing the average percentincrease or decrease in PEM rates per year over each specified period of time to summarize andcompare these trends over the entire time period. Red dot represents a AAPC value greater than zero,while blue dot represents a AAPC value less than zero.
Nutrients 2022, 14, 2592 7 of 17
Nutrients 2022, 14, x FOR PEER REVIEW 7 of 16
3.3. National Burden of Protein–Energy Malnutrition
At the national level, the Maldives had the highest number of ASPR in 2019, whereas
Mongolia and Peru had the smallest number (Figure 2A). The Czech Republic had the
biggest EAPC of prevalence, and Guatemala had the smallest (Figure 1B). Mali had the
highest number of ASDRs (Supplementary Figure S2A). The Czech Republic had the big-
gest EAPC of ASDR, and the Democratic People’s Republic of Korea had the smallest
(Supplementary Figure S2B). Eritrea had the highest age-standardized DALYs rate, while
Singapore had the smallest number (Supplementary Figure S3A). The Czech Republic had
the biggest EAPC of DALYs, and Cambodia had the smallest (Supplementary Figure S3B).
Figure 2. The global disease burden of protein–energy malnutrition for both genders in 204 coun-
tries and territories. (A)The age-standardized prevalence rate (ASPR) of protein–energy malnutri-
tion in 2019. (B) The estimated annual percentage change (EAPC) in ASPR of protein–energy mal-
nutrition from 1990 to 2019.
3.4. Age and Sex
For the prevalence rate, the prevalence basically increased with age, except children
aged 1–4 had the highest prevalence (Figure 3A). For the death rate, the prevalence in-
creased significantly with age, peaking at 95+, except in children aged 1–4 (Figure 3B).
With the DALYs rate, the value of minors decreased with age, the value of adults in-
creased significantly with age, and female children aged 1–4 years were significantly
higher than male children (Figure 3C). The trend of the DALYs rate also appeared in the
YLL rate and YLD rate (Figure S4).
Figure 2. The global disease burden of protein–energy malnutrition for both genders in 204 countriesand territories. (A)The age-standardized prevalence rate (ASPR) of protein–energy malnutrition in2019. (B) The estimated annual percentage change (EAPC) in ASPR of protein–energy malnutritionfrom 1990 to 2019.
3.5. The Socio-Demographic Index (SDI) and Human Development Index (HDI)
SDI refers to the socio-demographic index, and HDI refers to the human developmentindex. Their values can be used to judge the degree of economic development of a countryor region so as to compare the relationship and causes between protein malnutrition andthe level of national economic development.
For the relationship between prevalence and SDI, there was clearly an ASPR down-trend of the prediction curve when the SDI went up (R = −0.59, p < 2.2 × 10⁻¹⁶. At theregional level, the ASPRs of Global, South Asia, Southeast Asia, and Western Europe werehigher than predicted, and the Southern Sub-Saharan Africa, Central Asia, High-incomeAsia Pacific, Southern Latin America, Oceania, Caribbean, Andean Latin America, High-income North America, Central Latin America, Tropical Latin America, Australasia, andCentral Sub-Saharan Africa ASPRs were lower than predicted (Figure 4). At the nationallevel, it also showed a negative trend between prevalence and SDI (R = −0.33, p = 2 × 10⁻⁶)(Supplementary Figure S6A). The EAPC of prevalence was negatively correlated with SDI(p = −0.53 (95% Cl: = −0.63–0.41), p < 0.001) (Figure 5A).

Nutrients 2022, 14, 2592 8 of 17Nutrients 2022, 14, x FOR PEER REVIEW 8 of 16
Figure 3. The prevalence, death, and disability-adjusted life year (DALY) rates of protein–energy
malnutrition among gender and age. (A) Prevalence. (B) Death rate. (C) DALY rate.
3.5. The Socio-Demographic Index (SDI) and Human Development Index (HDI)
SDI refers to the socio-demographic index, and HDI refers to the human develop-
ment index. Their values can be used to judge the degree of economic development of a
Figure 3. The prevalence, death, and disability-adjusted life year (DALY) rates of protein–energymalnutrition among gender and age. (A) Prevalence. (B) Death rate. (C) DALY rate.

Nutrients 2022, 14, 2592 9 of 17
Nutrients 2022, 14, x FOR PEER REVIEW 9 of 16
country or region so as to compare the relationship and causes between protein malnutri-
tion and the level of national economic development.
For the relationship between prevalence and SDI, there was clearly an ASPR down-
trend of the prediction curve when the SDI went up (R = −0.59, p < 2.2 × 10⁻¹⁶. At the re-
gional level, the ASPRs of Global, South Asia, Southeast Asia, and Western Europe were
higher than predicted, and the Southern Sub-Saharan Africa, Central Asia, High-income
Asia Pacific, Southern Latin America, Oceania, Caribbean, Andean Latin America, High-
income North America, Central Latin America, Tropical Latin America, Australasia, and
Central Sub-Saharan Africa ASPRs were lower than predicted (Figure 4). At the national
level, it also showed a negative trend between prevalence and SDI (R = −0.33, p= 2 × 10⁻⁶)
(Supplementary Figure S6A). The EAPC of prevalence was negatively correlated with SDI
(p = −0.53 (95% Cl: = −0.63–0.41), p < 0.001) (Figure 5A).
Figure 4. Age-standardized prevalence rates for protein–energy malnutrition for 21 GBD regions by
socio-demographic index (SDI), 1990–2019. There was clearly an ASPR downtrend of the prediction
curve when the SDI went up. Expected values based on the socio-demographic index and disease
rates in all locations are shown as the black line.
For the relationship between deaths and SDI, there was clearly an ASDR downtrend
of the prediction curve when the SDI went up (R = −0.73, p < 2.2 × 10⁻¹⁶). At the regional
level, the ASDRs of Global, Southern Sub-Saharan Africa, Eastern Sub-Saharan Africa,
Andean Latin America, Central Latin America, Tropical Latin America, Central Sub-Sa-
haran Africa, and Southeast Asia were higher than predicted, and Central Asia, South
Asia, Oceania, North Africa, and the Middle East were lower than predicted (Supplemen-
tary Figure S5A). At the national level, it also showed a negative trend between deaths
and SDI (R = −0.69, p < 2.2e × 10−16) (Supplementary Figure S6B). The EAPC of deaths was
negatively correlated with SDI (p = −0.42 (95% Cl: −0.53–0.29), p < 0.001) (Figure 5B).
Figure 4. Age-standardized prevalence rates for protein–energy malnutrition for 21 GBD regions bysocio-demographic index (SDI), 1990–2019. There was clearly an ASPR downtrend of the predictioncurve when the SDI went up. Expected values based on the socio-demographic index and diseaserates in all locations are shown as the black line.
For the relationship between deaths and SDI, there was clearly an ASDR downtrend ofthe prediction curve when the SDI went up (R = −0.73, p < 2.2 × 10⁻¹⁶). At the regional level,the ASDRs of Global, Southern Sub-Saharan Africa, Eastern Sub-Saharan Africa, AndeanLatin America, Central Latin America, Tropical Latin America, Central Sub-Saharan Africa,and Southeast Asia were higher than predicted, and Central Asia, South Asia, Oceania,North Africa, and the Middle East were lower than predicted (Supplementary Figure S5A).At the national level, it also showed a negative trend between deaths and SDI (R = −0.69,p < 2.2 × 10⁻¹⁶) (Supplementary Figure S6B). The EAPC of deaths was negatively corre-lated with SDI (p = −0.42 (95% Cl: −0.53–0.29), p < 0.001) (Figure 5B).
For the relationship between DALYs and SDI, there was clearly an age-standardizedDALYs rate downtrend of the prediction curve when the SDI went up (R = −0.73,p < 2.2 × 10⁻¹⁶). At the regional level, the age-standardized DALYs rates of Global,Southern Sub-Saharan Africa, Eastern Europe, the Caribbean, Central Sub-SaharanAfrica, and Western Europe were higher than predicted, and Central Asia, Oceania, NorthAfrica, and the Middle East were lower than predicted (Supplementary Figure S5B). Atthe national level, it also showed a negative trend between deaths and SDI (R = −0.66,p < 2.2 × 10⁻¹⁶) (Supplementary Figure S6C). The EAPC of DALYs was negatively corre-lated with SDI (p = −0.64 (95% Cl: −0.72–0.54), p < 0.001) (Figure 5C).
For the relationship between EAPC and HDI, EAPC of prevalence was negativelycorrelated with HDI (p = −0.53 (95% Cl: −0.63–0.41), p < 0.001) (Supplementary Figure S7A).The EAPC of deaths was negatively correlated with HDI (p = −0.42 (95% Cl: −0.54–0.29),p < 0.001) (Supplementary Figure S7B). The EAPC of DALYs was negatively correlatedwith HDI (p = −0.64 (95% Cl: −0.72–0.55), p < 0.001) (Supplementary Figure S7C).

Nutrients 2022, 14, 2592 10 of 17Nutrients 2022, 14, x FOR PEER REVIEW 10 of 16
Figure 5. The association between the socio-demographic index (SDI) and estimated annual per-
centage change (EAPC) in age-standardized prevalence rate (ASPR), age-standardized death rate
(ASDR), and age-standardized disability-adjusted life years of protein–energy malnutrition. SDI
(2019) was negatively associated with EAPC in (A) ASPR (� = −0.53, p < 0.001), (B) APSR (� = −0.42,
p < 0.001), and (C) age-standardized DALY (� = −0.64, p < 0.001).
For the relationship between DALYs and SDI, there was clearly an age-standardized
DALYs rate downtrend of the prediction curve when the SDI went up (R = −0.73, p < 2.2 ×
10−16). At the regional level, the age-standardized DALYs rates of Global, Southern Sub-
Saharan Africa, Eastern Europe, the Caribbean, Central Sub-Saharan Africa, and Western
Europe were higher than predicted, and Central Asia, Oceania, North Africa, and the Mid-
dle East were lower than predicted (Supplementary Figure S5B). At the national level, it
also showed a negative trend between deaths and SDI (R =−0.66, p < 2.2 × 10⁻¹⁶) (Supple-
mentary Figure S6C). The EAPC of DALYs was negatively correlated with SDI (p = −0.64
(95% Cl: −0.72–0.54), p < 0.001) (Figure 5C).
For the relationship between EAPC and HDI, EAPC of prevalence was negatively
correlated with HDI (p = −0.53 (95% Cl: −0.63–0.41), p < 0.001) (Supplementary Figure S7A).
The EAPC of deaths was negatively correlated with HDI (p = −0.42 (95% Cl: −0.54–0.29), p
Figure 5. The association between the socio-demographic index (SDI) and estimated annual percent-age change (EAPC) in age-standardized prevalence rate (ASPR), age-standardized death rate (ASDR),and age-standardized disability-adjusted life years of protein–energy malnutrition. SDI (2019) wasnegatively associated with EAPC in (A) ASPR (ρ = −0.53, p < 0.001), (B) APSR (ρ = −0.42, p < 0.001),and (C) age-standardized DALY (ρ = −0.64, p < 0.001).
We divided the SDI into five levels: High SDI, High-middle SDI, Middle SDI, Low-middle SDI, and Low SDI. The number of prevalence cases in High SDI and High-middleSDI regions was significantly lower than that in Middle SDI, Low-middle SDI, and Low SDIregions. The High SDI and High-middle SDI regions’ cases were dominated by people overthe age of 15, while the Middle SDI, Low-middle SDI, and Low SDI regions’ cases weredominated by people under the age of 15. Meanwhile, the Low−middle SDI region hadthe highest number of cases in children under 5 years of age (Figure 6). As for the deathcases, the global death cases were mainly children under 5 years old. The Low-middleSDI and Low SDI regions had the largest number of overall cases, but they are decreasing

Nutrients 2022, 14, 2592 11 of 17
year by year. In terms of age composition, the High SDI had always been dominated bythe 75+ age group, and the High-middle SDI and Middle SDI areas gradually transitionedfrom children under 5 years old to 75+ over time, and Low-middle SDI and Low SDIareas had always been mainly for children under 5 years old. In particular, between 1995and 2002, the total number of cases in the Low-middle SDI region increased abnormally(Supplementary Figure S8). For DALYs cases, the total number of cases in the world andregions decreased other than High SDI. Among them, Low-middle SDI and Low SDIhad the largest total number of cases, and the High SDI region had the smallest totalnumber of cases. In terms of age composition, the Middle SDI, Low−middle SDI, andLow SDI regions were dominated by the age group under 5 years old. The proportionof people under the age of 5 in the High−middle SDI and Middle SDI regions has beendecreasing. The Low−middle SDI region also increased abnormally between 1995 and2002 (Supplementary Figure S9).
Nutrients 2022, 14, x FOR PEER REVIEW 11 of 16
< 0.001) (Supplementary Figure S7B). The EAPC of DALYs was negatively correlated with
HDI (p = −0.64 (95% Cl: −0.72–0.55), p < 0.001) (Supplementary Figure S7C).
We divided the SDI into five levels: High SDI, High-middle SDI, Middle SDI, Low-
middle SDI, and Low SDI. The number of prevalence cases in High SDI and High-middle
SDI regions was significantly lower than that in Middle SDI, Low-middle SDI, and Low
SDI regions. The High SDI and High-middle SDI regions’ cases were dominated by people
over the age of 15, while the Middle SDI, Low-middle SDI, and Low SDI regions’ cases
were dominated by people under the age of 15. Meanwhile, the Low−middle SDI region
had the highest number of cases in children under 5 years of age (Figure 6). As for the
death cases, the global death cases were mainly children under 5 years old. The Low-
middle SDI and Low SDI regions had the largest number of overall cases, but they are
decreasing year by year. In terms of age composition, the High SDI had always been dom-
inated by the 75+ age group, and the High-middle SDI and Middle SDI areas gradually
transitioned from children under 5 years old to 75+ over time, and Low-middle SDI and
Low SDI areas had always been mainly for children under 5 years old. In particular, be-
tween 1995 and 2002, the total number of cases in the Low-middle SDI region increased
abnormally (Supplementary Figure S8). For DALYs cases, the total number of cases in the
world and regions decreased other than High SDI. Among them, Low-middle SDI and
Low SDI had the largest total number of cases, and the High SDI region had the smallest
total number of cases. In terms of age composition, the Middle SDI, Low−middle SDI, and
Low SDI regions were dominated by the age group under 5 years old. The proportion of
people under the age of 5 in the High−middle SDI and Middle SDI regions has been de-
creasing. The Low−middle SDI region also increased abnormally between 1995 and 2002
(Supplementary Figure S9).
Figure 6. The proportion of the five age groups for protein–energy malnutrition prevalence cases
between 1990 and 2019 globally, and in High, High-middle, Middle, Low-middle, and Low SDI
quintiles. The populations were divided into five age groups: under 5, 5–14 years, 15–49 years, 50–
69 years, and 70+ years. SDI values can be used to judge the degree of economic development of a
country or region.
In the JointPoint figure, the prevalence of Global, High SDI, High-middle SDI, and
Middle SDI increased from 1990 to 2011, and the Low-middle SDI and Low SDI decreased
at the same time. The prevalence of all SDI groups went through a U-shaped curve from
2011 to 2019 (Figure 7; Supplementary Figure S10). As for the JointPoint of deaths, Global,
High-middle SDI, Middle SDI, and Low SDI decreased from 1990 to 2019, and the High
Figure 6. The proportion of the five age groups for protein–energy malnutrition prevalence casesbetween 1990 and 2019 globally, and in High, High-middle, Middle, Low-middle, and Low SDIquintiles. The populations were divided into five age groups: under 5, 5–14 years, 15–49 years,50–69 years, and 70+ years. SDI values can be used to judge the degree of economic development ofa country or region.
In the JointPoint figure, the prevalence of Global, High SDI, High-middle SDI, andMiddle SDI increased from 1990 to 2011, and the Low-middle SDI and Low SDI de-creased at the same time. The prevalence of all SDI groups went through a U-shapedcurve from 2011 to 2019 (Figure 7; Supplementary Figure S10). As for the JointPointof deaths, Global, High-middle SDI, Middle SDI, and Low SDI decreased from 1990 to2019, and the High SDI and Low-middle SDI also decreased from 2000 to 2019 (Figure 7;Supplementary Figure S11). The JointPoint of all SDI groups except the High SDI decreasedover time (Figure 7; Supplementary Figure S12).

Nutrients 2022, 14, 2592 12 of 17
Nutrients 2022, 14, x FOR PEER REVIEW 12 of 16
SDI and Low-middle SDI also decreased from 2000 to 2019 (Figure 7; Supplementary Fig-
ure S11). The JointPoint of all SDI groups except the High SDI decreased over time (Figure
7; Supplementary Figure S12).
Figure 7. JointPoint regression analysis for protein–energy malnutrition from 1990 to 2019. (A) Age-
standardized prevalence rate globally; (B) Age-standardized death rate globally; (C) Age-standard-
ized disability-adjusted life years globally. The prevalence of protein–energy malnutrition increased
from 1990 to 2011 globally, and went through a U-shaped curve from 2011 to 2019. The JointPoint
of deaths and DALYs decreased between 2000 and 2019.
4. Discussion
This study is the first experiment to use the GBD2019 database to investigate the
global burden of PEM. We comprehensively assessed the prevalence, deaths, DALYs,
Figure 7. JointPoint regression analysis for protein–energy malnutrition from 1990 to 2019.(A) Age-standardized prevalence rate globally; (B) Age-standardized death rate globally; (C) Age-standardized disability-adjusted life years globally. The prevalence of protein–energy malnutritionincreased from 1990 to 2011 globally, and went through a U-shaped curve from 2011 to 2019. TheJointPoint of deaths and DALYs decreased between 2000 and 2019.
4. Discussion
This study is the first experiment to use the GBD2019 database to investigate the globalburden of PEM. We comprehensively assessed the prevalence, deaths, DALYs, YLLs, YLDs,and corresponding ASRs of PEM and compared data across countries, regions, age, sex,and SDI. Globally, both the ASDR and age-standardized rate of DALY decreased from

Nutrients 2022, 14, 2592 13 of 17
1990 to 2019, but ASPR increased slightly. There is a relationship between economic leveland malnutrition [10,11]. The improvement of the economic level and medical sciencecan cause the improvement of the expected life span, which could increase in ASPR ofPEM. At the same time, because the PEM diagnostic standards continuously improvedbetween 1990 and 2019, the screening of PEM is more comprehensive, which may lead tothe continuous increase in PEM’s ASPR, and also lead to abnormal turning points in theJointPoint diagrams [2,12,13]. The decline in ASDR and ASR DALYS can also be attributedto the improvement of medical technology.
The burden of PEM has an obvious relationship with the socioeconomic level. Socioe-conomic indicators HDI and SDI were negatively correlated with PEM burdens, whichmeans that higher socioeconomic levels have lower PEM burdens. High HDI represents ahigher level of prevention and treatment, and higher SDI represents a higher social securitycapability. These are all favorable factors to reduce the burden of PEM.
The age distribution of patients with PEM has a good concentration. We found thatPEM patients are mainly concentrated in the children group and older group. For thechildren group, PEM is the most serious malnutrition in children. Child patients generallylack the amino acids required for growth and development. The lack of amino acids willaffect the normal growth of cells and collectives. For example, the lack of amino acids willcause the main growth regulation of cells, Mechanical Target of Rapamycin Complex 1(MTORC1), to synthesize and inhibit the growth of cells and the body, which leads to slowdevelopment and immune function defects [14–16]. PEM causes 56% of children’s deathsin developing countries [17]. The main risk factors for children’s PEM are environmental,poverty, gender, food culture, and immunization [16,18–20], which will be reflected inthe burden level of different regions. However, the high SDI place can guarantee a betternutritional level for children. Compared with the condition of the children group, theelderly group is different. PEM can be seen in about 50% of the elderly in hospitalization.With the increase in age, the elderly groups have gradually experienced a loss of appetite,insufficient diet, and weakened intestinal absorption capacity, which can easily lead toPEM. The elderly with PEM are prone to decreased concentration of ornithine, histidine,glutamic acid, and glutamine, which leads to the symptoms of decreased physical functionand decreased immune function, which eventually leads to death [21,22]. Therefore,government and medical institutions need to pay special attention to the development ofchildren and elderly PEM, actively test relevant indicators, and formulate positive strategiesto prevent death.
As in this experiment, women had been found to be at a higher risk of PEM than menin several studies [23,24], but no specific studies have demonstrated whether the specificreasons are related to gender inequality, physiological differences, or life expectancy, etc. [3].This also suggests the direction of our future research in order to provide women withmore preventive and therapeutic measures.
At the regional level, ASPR, ASDR, age-standardized DALYs rate, EAPC, and AAPCvary from place to place. South Asia, Southeast Asia, and East Asia occupy the top positionsin the ASPR rankings, while East Asia also has the highest EAPC of ASPR, the lowest EAPCof ASDR, the lowest EAPC of DALYS, and the highest AAPC of prevalence. The rapidrise of ASPR in East Asia may be related to the general rapid aging of countries in EastAsia [25,26]. Moreover, the elderly are more likely to obtain PEM. At the same time, SouthAsia, Southeast Asia, and East Asia are generally developing countries, and the ability toprovide formal medical services is not as good as that of developed countries [27]. However,in East Asian countries such as China, the number of PEM has decreased significantlyin recent years due to rapid economic development, the substantial improvement in thequality of medical services, and major efforts in PEM prevention [28]. At the same time,China has the largest population base in East Asia, so it is the most likely reason for thedecline in ASDR and DALYs [3]. Rapidly developing economies and incomplete healthcaresystems also pose enormous challenges to PEM public health services in East Asia [26].Although Eastern Sub-Saharan Africa had the lowest AAPC of prevalence, it had the

Nutrients 2022, 14, 2592 14 of 17
highest ASDR and age-standardized DALYs rate, which is closely related to the lower totalpopulation, economic level, and medical level of this region [29,30]. At the same time,maize as the main energy source in Eastern Sub-Saharan Africa also leads to the apparentlack of tryptophan and lysine in the region [31]. This region needs certain dietary guidancepolicies to promote the reduction in the PEM burden.
This study has performed a comprehensive review of the PEM burden at the global,regional, and national levels, but there exist some limitations. Because of the complexityand breadth of the data, the PEM burden should be interpreted cautiously. Fewer data areavailable from countries and regions with lower SDI values, and the disease burden may beunderestimated because of different levels of registration management. Moreover, thoughthe data of the GBD study are considered of high quality, differences in data collecting,extracting, coding, and quality of data sources inevitably compromise the robustness andaccuracy of GBD estimates. Obviously, the quality of data collection coding and datasources is qualitatively related to the economic and political level of countries and regions.In developed countries, especially developed countries with relatively complete medicalsystems, such as the United Kingdom, the United States, and France, the data obtained arerelatively reliable and complete, while in some developing countries, such as most Africanand Central Asian countries, due to imperfections in the economy, war, or the imperfectionof the medical system, statistics may be lost or wrong. At the same time, the true burdenof the disease may be underestimated due to the difficulty of diagnosing PEM. Last butnot least, the fluctuations in disease burden data may partly represent the detection biasassociated with adjustments in screening protocols rather than real changes.
5. Conclusions
This study provides a reference for monitoring the burden and trends of PEM at theglobal, regional, and national levels, which is crucial to conducting interventions that mightslow down the rising burden of PEM. Our findings found that PEM still has a relativelyserious disease burden in the world, especially in lower SDI regions, children, and theelderly. Consequently, more attention should be paid to developing early prevention andtreatment measures for PEM in lower SDI regions and countries, such as safeguarding thefood supply, eliminating hunger, and improving overall nutritional status. At the sametime, particular attention to children and elderly PEM is needed. Effective steps, such asenhancing nutrition-related health education, strengthening nutritional support, and earlyaggressive treatment, should be formulated to relieve the burden of PEM. Further studiesare required to identify more useful public health interventions.
Supplementary Materials: The following are available online at https://www.mdpi.com/article/10.3390/nu14132592/s1, Figure S1. Average annual percentage change (AAPC) of the (A) yearsof life lost (YLL), and (B) years lived with disability (YLD) rate for protein-energy malnutritionfrom 1990 to 2019. AAPC was obtained representing the average percent increase or decreasein PEM rates per year over each specified period of time to summarise and compare these trensover the entire time period. Figure S2. The global disease burden of protein-energy malnutritionfor both genders in 204 countries and territories. (A) The Age-standardised death rate (ASDR)of protein-energy malnutrition in 2019. (B) The estimated annual percentage change (EAPC)in ASDR of protein-energy malnutrition from 1990 to 2019. Figure S3. The global disease bur-den of pro-tein-energy malnutrition for both genders in 204 countries and territories. (A) TheAge-standardised DALY rate of pro-tein-energy malnutrition in 2019. (B) The estimated annualpercentage change (EAPC) in Age-standardised DALY rate of pro-tein-energy malnutrition from1990 to 2019. Figure S4. The years of life lost (YLL), and years lived with disability (YLD) rates ofprotein-energy malnutrition among gen-der and age. (A) YLL rate. (B) YLD rate. Figure S5. Age-standardised (A) death rates, and (B) disability-adjusted life year for protein-energy malnutritionfor 21 GBD regionsand by Socio-demographic Index, 1990–2019. There was a clearly ASR down-trend of prediction curve when the SDI went up. Expected values based on Socio-demographicIndex and disease rates in all locations are shown as the black line. Figure S6. Age-standardised(A) prevalence, (B) death, and (C) DALY rates for PEM for 195 countries and territories by Socio-

Nutrients 2022, 14, 2592 15 of 17
demographic Index, 1990–2019. There was a clearly ASR downtrend of prediction curve when theSDI went up. Expected values based on Socio-demographic Index and disease rates in all locationsare shown as the black line. Figure S7. The association between Human Development Index(HDI) and estimated annual per-centage change (EAPC) in Age-standardized prevalence rate(ASPR), Age-standardized death rate (ASDR), and age-standardized disabil-ity-adjusted life yearsof protein-energy malnutrition. HDI (2019) was negatively associated with EAPC in (A) ASPR(ρ = −0.53, p < 0.001), (B) APSR (ρ = −0.42, p < 0.001), and (C) age-standardized DALY (ρ = −0.64,p < 0.001). Figure S8. The pro-portion of the five age groups for protein-energy malnutrition deathcases between 1990 and 2019 globally, and in high, high-middle, middle, low-middle, and low SDIquintiles. The populations were divided into five age groups: under 5, 5–14 years, 15–49 years,50–69 years, and 70+ years. SDI values can be used to judge the degree of economic developmentof a coun-try or region. Figure S9. The proportion of the five age groups for protein-energymalnutrition DALY cases between 1990 and 2019 globally, and in high, high-middle, middle,low-middle, and low SDI quintiles. The populations were divided into five age groups: under 5,5–14 years, 15–49 years, 50–69 years, and 70+ years. SDI values can be used to judge the degree ofeconomic development of a country or region. Figure S10. Joinpoint regression analysis of theage-standardized prevalence rates for PEM from 1990 to 2019. (A) Age-standardized prevalencerate in high SDI quintiles; (B) Age-standardized prevalence rate in high-middle SDI quintiles;(C) Age-standardized prevalence rate in middle SDI quintiles; (D) Age-standardized prevalencerate in low-middle SDI quintiles; (E) Age-standardized prevalence rate in low SDI quintiles. Theprevalence of High SDI, High-middle SDI, Middle SDI quintiles increased in 1990–2011, and theLow-middle SDI, Low SDI decreased at the same time. And the prevalence of all SDI groupswent through a U-shaped curve in 2011–2019. Figure S11. Joinpoint regression analysis of theage-standardized death rates for PEM from 1990 to 2019. (A) Age-standardized death rate in highSDI quintiles; (B) Age-standardized death rate in high-middle SDI quintiles; (C) Age-standardizeddeath rate in middle SDI quintiles; (D) Age-standardized death rate in low-middle SDI quintiles;(E) Age-standardized death rate in low SDI quintiles. As for the jointpoint of deaths, High-middleSDI, Middle SDI, Low SDI decreased in 1990–2019 and the High SDI, Low-middle SDI de-creased in2000–2019. Figure S12. Joinpoint regression analysis of the age-standardized DALY rates for PEMfrom 1990 to 2019. (A) Age-standardized DALY rate in high SDI quintiles; (B) Age-standardizedDALY rate in high-middle SDI quintiles; (C) Age-standardized DALY rate in middle SDI quintiles;(D) Age-standardized DALY rate in low-middle SDI quintiles; (E) Age-standardized DALY ratein low SDI quintiles. The jointpoint of all SDI groups except the High SDI group decreased bythe time. Table S1. The death cases and age-standardized death of PEM in 1990 and 2019, and itstemporal trends from 1990 to 2019. Table S2. The DALY cases and age-standardized DALY of PEMin 1990 and 2019, and its temporal trends from 1990 to 2019.
Author Contributions: Conceptualization, X.Z. and S.H.; Formal analysis, L.Z., Y.P., M.S., D.Z. andD.G.; Investigation, X.Z., Y.P., Y.Z. and Y.L.; Methodology, X.Z., L.Z., X.W. and S.H.; Supervision, S.H.All authors have read and agreed to the published version of the manuscript.
Funding: This research received no external funding.
Institutional Review Board Statement: The data used in this article were from the GBD publicdatabase and do not require institutional review board approval or other ethics approval or consentof the study subjects.
Informed Consent Statement: The institutions that conducted the surveys were responsible forobtaining informed consent from the participants.
Data Availability Statement: Data are available in a public, open access repository. All of the dataare publically available. Data are available on request.
Conflicts of Interest: The authors declare no conflict of interest.
Abbreviations
PEM: Protein–Energy Malnutrition; GBD: Global Burden of Disease, Injuries, and Risk Fac-tors Study; DALYs: Disability-Adjusted Life Years; GHDx: Global Health Data Exchange; ASR:Age-Standardized Rates; YLL: Years of Life Lost; YLD: Years Lived with Disability; SDI: Socio-Demographic Index; HDI: Human Development Index; EAPC: Estimated Annual Percentage Change;
Nutrients 2022, 14, 2592 16 of 17
AAPC: Average Annual Percent Change; CI: Confidence Interval; ASPR: Age-Standardized Preva-lence Rate; ASDR: Age-Standardized Death Rate.
References1. Cederholm, T.; Jensen, G.L.; Correia, M.I.T.D.; Gonzalez, M.C.; Fukushima, R.; Higashiguchi, T.; Baptista, G.; Barazzoni, R.;
Blaauw, R.; Coats, A.; et al. GLIM criteria for the diagnosis of malnutrition—A consensus report from the global clinical nutritioncommunity. Clin. Nutr. 2019, 38, 1–9. [CrossRef] [PubMed]
2. Soeters, P.; Bozzetti, F.; Cynober, L.; Forbes, A.; Shenkin, A.; Sobotka, L. Defining malnutrition: A plea to rethink. Clin. Nutr. 2017,36, 896–901. [CrossRef] [PubMed]
3. Crichton, M.; Craven, D.; Mackay, H.; Marx, W.; de van der Schueren, M.; Marshall, S. A systematic review, meta-analysis andmeta-regression of the prevalence of protein-energy malnutrition: Associations with geographical region and sex. Age Ageing2019, 48, 38–48. [CrossRef]
4. Levels and Trends in Child Malnutrition: UNICEF/WHO/The World Bank Group Joint Child Malnutrition Estimates: Keyfindings of the 2021 Edition. Available online: https://www.who.int/publications-detail-redirect/9789240025257 (accessed on25 April 2022).
5. Raynaud-Simon, A.; Revel-Delhom, C.; Hébuterne, X. Clinical practice guidelines from the French health high authority:Nutritional support strategy in protein-energy malnutrition in the elderly. Clin. Nutr. 2011, 30, 312–319. [CrossRef] [PubMed]
6. Bray, F.; Ferlay, J.; Soerjomataram, I.; Siegel, R.L.; Torre, L.A.; Jemal, A. Global cancer statistics 2018: GLOBOCAN estimates ofincidence and mortality worldwide for 36 cancers in 185 countries. CA Cancer J. Clin. 2018, 68, 394–424. [CrossRef] [PubMed]
7. Lozano, R.; Naghavi, M.; Foreman, K.; Lim, S.; Shibuya, K.; Aboyans, V.; Abraham, J.; Adair, T.; Aggarwal, R.; Ahn, S.Y.; et al.Global and regional mortality from 235 causes of death for 20 age groups in 1990 and 2010: A systematic analysis for the GlobalBurden of Disease Study 2010. Lancet 2012, 380, 2095–2128. [CrossRef]
8. Yusuf, S.; Hawken, S.; Ôunpuu, S.; Dans, T.; Avezum, A.; Lanas, F.; McQueen, M.; Budaj, A.; Pais, P.; Varigos, J.; et al. Effect ofpotentially modifiable risk factors associated with myocardial infarction in 52 countries (the INTERHEART study): Case-controlstudy. Lancet 2004, 364, 937–952. [CrossRef]
9. GBD 2019 Diseases and Injuries Collaborators. Global Burden of 369 Diseases and Injuries in 204 Countries and Territories,1990–2019: A systematic analysis for the Global Burden of Disease Study 2019. Lancet 2020, 17, 1204–1222. [CrossRef]
10. Webb, P.; Stordalen, G.A.; Singh, S.; Wijesinha-Bettoni, R.; Shetty, P.; Lartey, A. Hunger and malnutrition in the 21st century. BMJ2018, 361, k2238. [CrossRef]
11. Micha, R.; Mannar, V.; Afshin, A.; Allemandi, L.; Baker, P.; Battersby, J.; Bhutta, Z.; Chen, K.; Corvalan, C.; Di Cesare, M.; et al.2020 Global Nutrition Report: Action on Equity to end Malnutrition. 2020. Available online: https://globalnutritionreport.org/reports/2020-global-nutrition-report/ (accessed on 7 May 2022).
12. Soeters, P.B.; Reijven, P.L.M.; van der Schueren, M.A.E.va.; Schols, J.M.G.A.; Halfens, R.J.G.; Meijers, J.M.M.; van Gemert, W.G. Arational approach to nutritional assessment. Clin. Nutr. 2008, 27, 706–716. [CrossRef]
13. Cederholm, T.; Barazzoni, R.; Austin, P.; Ballmer, P.; Biolo, G.; Bischoff, S.C.; Compher, C.; Correia, I.; Higashiguchi, T.;Holst, M.; et al. ESPEN guidelines on definitions and terminology of clinical nutrition. Clin. Nutr. 2017, 36, 49–64. [CrossRef]
14. Perspective: The Potential Role of Essential Amino Acids and the Mechanistic Target of Rapamycin Complex 1 (mTORC1)Pathway in the Pathogenesis of Child Stunting | Advances in Nutrition | Oxford Academic. Available online: https://academic.oup.com/advances/article/7/5/853/4616731?login=true (accessed on 7 May 2022).
15. Laplante, M.; Sabatini, D.M. mTOR Signaling in Growth Control and Disease. Cell 2012, 149, 274–293. [CrossRef]16. Nova, E.; Samartín, S.; Gómez, S.; Morandé, G.; Marcos, A. The adaptive response of the immune system to the particular
malnutrition of eating disorders. Eur. J. Clin. Nutr. 2002, 56 (Suppl. S3), S34–S37. [CrossRef]17. Walker, A.F. The Contribution of Weaning Foods to Protein–Energy Malnutrition. Nutr. Res. Rev. 1990, 3, 25–47. [CrossRef]18. Bhutia, D.T. Protein Energy Malnutrition in India: The Plight of Our Under Five Children. J. Fam. Med. Prim. Care 2014, 3, 63–67.
[CrossRef]19. Sharghi, A.; Kamran, A.; Faridan, M. Evaluating risk factors for protein-energy malnutrition in children under the age of six
years: A case-control study from Iran. Int. J. Gen. Med. 2011, 4, 607–611. [CrossRef]20. Getaneh, T.; Assefa, A.; Tadesse, Z. Protein-energy malnutrition in urban children: Prevalence and determinants. Ethiop. Med. J.
1998, 36, 153–166.21. Raja, R.; Lim, A.V.; Lim, Y.P.; Lim, G.; Chan, S.P.; Vu, C.K.F. Malnutrition screening in hospitalised patients and its implication on
reimbursement. Intern. Med. J. 2004, 34, 176–181. [CrossRef]22. Dj, M.; Aa, J. Protein/energy ratios of current diets in developed and developing countries compared with a safe protein/energy
ratio: Implications for recommended protein and amino acid intakes. Public Health Nutr. 2004, 7, 387–405. [CrossRef]23. Castel, H.; Shahar, D.; Harman-Boehm, I. Gender Differences in Factors Associated with Nutritional Status of Older Medical
Patients. J. Am. Coll. Nutr. 2006, 25, 128–134. [CrossRef]24. Heersink, J.T.; Brown, C.J.; Dimaria-Ghalili, R.A.; Locher, J.L. Undernutrition in Hospitalized Older Adults: Patterns and
Correlates, Outcomes, and Opportunities for Intervention with a Focus on Processes of Care. J. Nutr. Elder. 2010, 29, 4–41.[CrossRef]

Nutrients 2022, 14, 2592 17 of 17
25. Fuster, V. Changing Demographics. J. Am. Coll. Cardiol. 2017, 69, 3002–3005. [CrossRef]26. Li, F. Physical activity and health in the presence of China’s economic growth: Meeting the public health challenges of the aging
population. J. Sport Health Sci. 2016, 5, 258–269. [CrossRef]27. Walton, E.; Allen, S. Malnutrition in developing countries. Paediatr. Child Health 2011, 21, 418–424. [CrossRef]28. FAO. The State of Food Insecurity in the World, 2005: Eradicating World Hunger-Key to Achieving the Millennium Development Goals;
Food & Agriculture Organization: Rome, Italy, 2005.29. High Level Panel of Experts. 2nd Note on critical and emerging issues for food security and nutrition. A note by the
High Level Panel of Experts on Food Security and Nutrition of the Committee on World Food Security. Available on-line: https://www.fao.org/fileadmin/user_upload/hlpe/hlpe_documents/Critical-Emerging-Issues-2016/HLPE_Note-to-CFS_Critical-and-Emerging-Issues-2nd-Edition__27-April-2017_.pdf (accessed on 25 April 2022).
30. Ashworth, A.; Chopra, M.; McCoy, D.; Sanders, D.; Jackson, D.; Karaolis, N.; Sogaula, N.; Schofield, C. WHO guidelines formanagement of severe malnutrition in rural South African hospitals: Effect on case fatality and the influence of operationalfactors. Lancet 2004, 363, 1110–1115. [CrossRef]
31. Nuss, E.T.; Tanumihardjo, S.A. Quality Protein Maize for Africa: Closing the Protein Inadequacy Gap in Vulnerable Populations.Adv. Nutr. 2011, 2, 217–224. [CrossRef]
Related Documents