Global PMI Trade downturn pushes global growth to two-year low October 10 th 2018 © 2018 IHS Markit. All Rights Reserved.

Welcome message from author
This document is posted to help you gain knowledge. Please leave a comment to let me know what you think about it! Share it to your friends and learn new things together.
Transcript

© 2016 IHS Markit. All Rights Reserved.© 2016 IHS Markit. All Rights Reserved.
Global PMITrade downturn pushes global growth to two-year low
October 10th 2018
© 2018 IHS Markit. All Rights Reserved.

© 2016 IHS Markit. All Rights Reserved.
Global PMI slides to two-year low amid export-led slowdown
Global economic growth moderated to a two-year low in September in a broad-based slowdown, according to the latest PMI
surveys. The headline JPMorgan Global Composite PMI, compiled by IHS Markit, fell for a third successive month in September,
down from 53.4 in August to 52.8, its lowest since September 2016. The latest reading is indicative of annual global GDP growth
slipping below 2.5% (at market exchange rates). Business confidence about the year ahead likewise fell to the gloomiest for two
years, suggesting growth may weaken further in coming months.
Slower growth was recorded across both manufacturing and services, the former down to a two-year low while the latter showed
the joint-slowest rise for two years. A key area of weakness remained global exports, which fell for the first time in over two years
in September, representing a marked turnaround in worldwide trade since the surging growth seen at the start of the year.
Global PMI indicators*
2
Global PMI* output & economic growth
Sources: IHS Markit, JPMorgan. Sources: IHS Markit, JPMorgan.* PMI shown above is a GDP-weighted average of the survey manufacturing and services indices.© 2018 IHS Markit. All Rights Reserved.

© 2016 IHS Markit. All Rights Reserved.
Slowdown led by emerging markets
Emerging markets grew especially slowly in September, reporting
the smallest expansion of output since October of last year,
though developed world growth moderated to a two-year low.
Output expanded at softer rates across all four major developed
markets, albeit remaining encouragingly robust in the US, UK and
eurozone. A more worrying slowdown was seen in Japan, where
growth was the weakest seen for two years.
Trends were more mixed among the largest emerging markets.
Output rose at faster rates in both China and Russia as improved
service sector expansions offset lacklustre factory performances.
Growth meanwhile hit a four-month low in India and Brazil saw
the second-steepest fall in output since early 2017.
3
Sources: IHS Markit, CIPS, Caixin, Nikkei.NB. All data refer to a GDP-weighted average of the PMI survey manufacturing and services indices.© 2018 IHS Markit. All Rights Reserved.

© 2016 IHS Markit. All Rights Reserved.
Services dominate global order book growth rankingsGlobal sector PMI data showed new order inflows rising in all 26
detailed sub-sectors excluding paper & forest producers. However,
only eight sub-sectors reported orders to have risen at a faster rate
than their respective year-to-date average. Two of the worst-
performing sectors were especially notable: machinery &
equipment makers – a key bellwether of global capex – saw the
weakest influx of new orders for two years, while chemical
producers meanwhile also saw only a marginal rise in new orders.
With the exceptions of construction material producers and drink
makers, services dominated the top half of the rankings.
4
Source: IHS Markit.© 2018 IHS Markit. All Rights Reserved.
Global Sector PMI New Orders Index
Source: IHS Markit, JPMorgan.

© 2016 IHS Markit. All Rights Reserved.
5
Global trade deterioratesFalling exports acted as a drag on factory output, order book
growth and hiring in September, pulling the JPMorgan Global
Manufacturing PMI down to its lowest since November 2016.
Declining exports were seen in 12 of the 29 countries
surveyed in September, half of which were Asian, including
China, where exports fell at the steepest rate since February
2016 (dropping for a sixth straight month), and Japan,
where exports fell for a second month.
Although export performance picked up in the US and UK, it
remained lacklustre by recent standards, with the latter
rounding off the worst quarter for just over two years. Trade
was more mixed in the eurozone, though the region as a
whole saw the weakest export growth since June 2013.
Sources: IHS Markit, JPMorgan, CBA, ISO, CIPS, NEVI, Nikkei, BME, Bank Austria, Investec, AERCE, Caixin, HPI, CBA.© 2018 IHS Markit. All Rights Reserved.
Source: IHS Markit, JPMorgan.
© 2016 IHS Markit. All Rights Reserved.
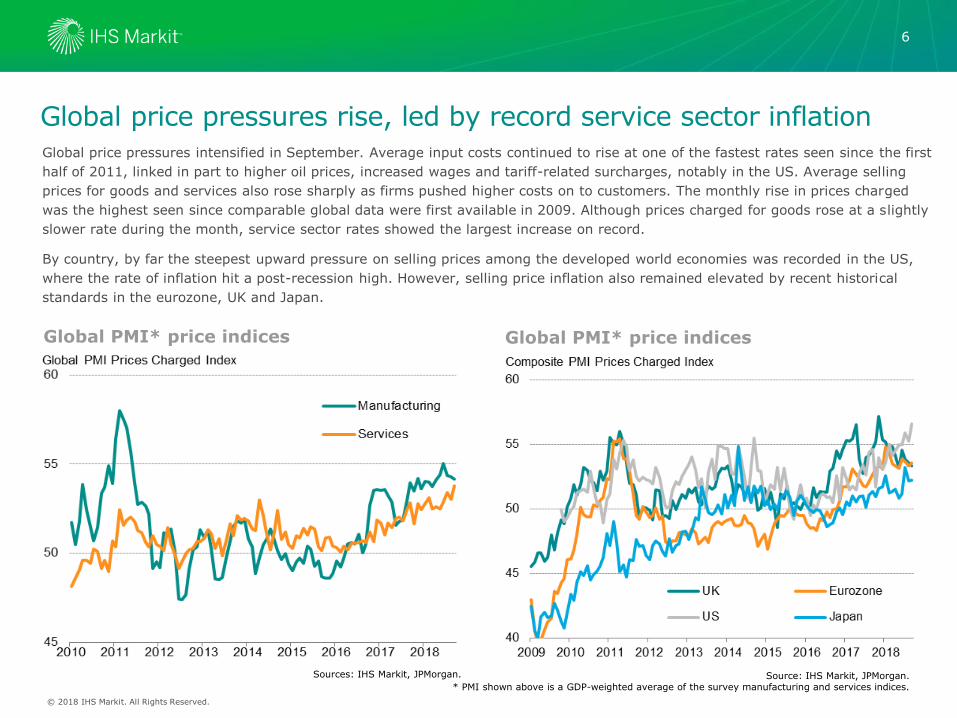
Global price pressures rise, led by record service sector inflationGlobal price pressures intensified in September. Average input costs continued to rise at one of the fastest rates seen since the first
half of 2011, linked in part to higher oil prices, increased wages and tariff-related surcharges, notably in the US. Average selling
prices for goods and services also rose sharply as firms pushed higher costs on to customers. The monthly rise in prices charged
was the highest seen since comparable global data were first available in 2009. Although prices charged for goods rose at a slightly
slower rate during the month, service sector rates showed the largest increase on record.
By country, by far the steepest upward pressure on selling prices among the developed world economies was recorded in the US,
where the rate of inflation hit a post-recession high. However, selling price inflation also remained elevated by recent historical
standards in the eurozone, UK and Japan.
Global PMI* price indices
6
Global PMI* price indices
Sources: IHS Markit, JPMorgan. Source: IHS Markit, JPMorgan.* PMI shown above is a GDP-weighted average of the survey manufacturing and services indices.
© 2018 IHS Markit. All Rights Reserved.
© 2016 IHS Markit. All Rights Reserved.
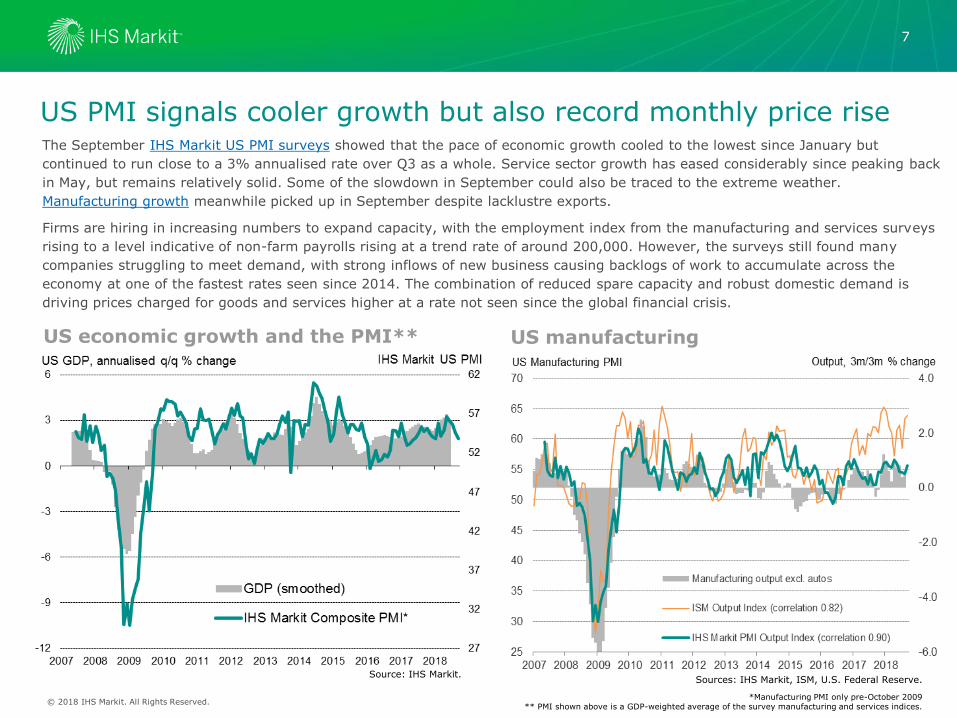
US PMI signals cooler growth but also record monthly price riseThe September IHS Markit US PMI surveys showed that the pace of economic growth cooled to the lowest since January but
continued to run close to a 3% annualised rate over Q3 as a whole. Service sector growth has eased considerably since peaking back
in May, but remains relatively solid. Some of the slowdown in September could also be traced to the extreme weather.
Manufacturing growth meanwhile picked up in September despite lacklustre exports.
Firms are hiring in increasing numbers to expand capacity, with the employment index from the manufacturing and services surveys
rising to a level indicative of non-farm payrolls rising at a trend rate of around 200,000. However, the surveys still found many
companies struggling to meet demand, with strong inflows of new business causing backlogs of work to accumulate across the
economy at one of the fastest rates seen since 2014. The combination of reduced spare capacity and robust domestic demand is
driving prices charged for goods and services higher at a rate not seen since the global financial crisis.
US manufacturing
7
US economic growth and the PMI**
© 2018 IHS Markit. All Rights Reserved.*Manufacturing PMI only pre-October 2009
** PMI shown above is a GDP-weighted average of the survey manufacturing and services indices.
Source: IHS Markit.Sources: IHS Markit, ISM, U.S. Federal Reserve.

© 2016 IHS Markit. All Rights Reserved.
Eurozone PMI signals solid Q3 but dips close to two-year low
September’s PMI survey data showed the pace of eurozone growth slowing to one of the weakest seen over the past two years amid
especially poor performances in Spain and Italy. Manufacturing led the slowdown, with export orders close to stalling. However, the
survey data still indicate a robust Q3 on the whole, with GDP set to rise by almost 0.5%. The survey data also suggest prior GDP
data could be revised higher. Upward revisions to GDP are more common at times of strong and accelerating growth.
While job gains remained close to record highs, the degree to which such robust jobs growth will persist remains in doubt. Business
activity growth has exceeded new order inflows in recent months, and consequently backlogs of work rose at a rate which would
historically be commensurate with considerably slower jobs growth than currently being seen. The overall rise in unfinished business
was the smallest for two years. Hiring will therefore likely moderate unless demand revives.
Eurozone employment
8
Eurozone economic growth and PMI*
*PMI shown above is a GDP weighted average of the manufacturing and services indices.
© 2018 IHS Markit. All Rights Reserved.
© 2016 IHS Markit. All Rights Reserved.
*PMI shown above is a GDP weighted average of the manufacturing, services and construction indices.
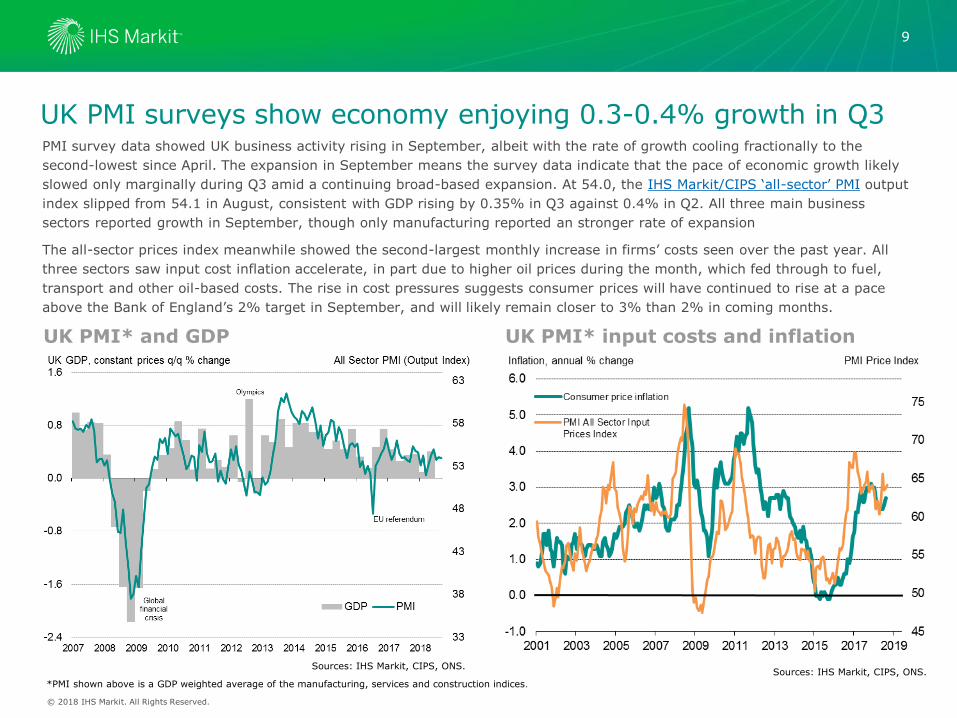
UK PMI surveys show economy enjoying 0.3-0.4% growth in Q3PMI survey data showed UK business activity rising in September, albeit with the rate of growth cooling fractionally to the
second-lowest since April. The expansion in September means the survey data indicate that the pace of economic growth likely
slowed only marginally during Q3 amid a continuing broad-based expansion. At 54.0, the IHS Markit/CIPS ‘all-sector’ PMI output
index slipped from 54.1 in August, consistent with GDP rising by 0.35% in Q3 against 0.4% in Q2. All three main business
sectors reported growth in September, though only manufacturing reported an stronger rate of expansion
The all-sector prices index meanwhile showed the second-largest monthly increase in firms’ costs seen over the past year. All
three sectors saw input cost inflation accelerate, in part due to higher oil prices during the month, which fed through to fuel,
transport and other oil-based costs. The rise in cost pressures suggests consumer prices will have continued to rise at a pace
above the Bank of England’s 2% target in September, and will likely remain closer to 3% than 2% in coming months.
UK PMI* input costs and inflation
9
© 2018 IHS Markit. All Rights Reserved.
UK PMI* and GDP
Sources: IHS Markit, CIPS, ONS.Sources: IHS Markit, CIPS, ONS.

© 2016 IHS Markit. All Rights Reserved.
Japan PMI at two-year low signals softer output growth
The latest survey data indicate that Japan’s economy continued to enjoy solid growth in September, but also that the upturn is
losing momentum. The Nikkei Japan Composite PMI™ Output Index slipped from 52.0 in August to 50.7 in September, posting the
weakest expansion for two years. The average reading for Q3 was nevertheless commensurate with annual GDP growth of around
1%, albeit edging closer to stagnation as the quarter proceeded. September saw only a fractional rise in service sector activity and
the smallest rise in factory output for two years, the latter linked to a second successive monthly drop in export orders.
While adverse weather is likely to have dampened service sector activity in particular, suggesting business may rebound in
October, manufacturers woes look longer lasting. The survey showed evidence that trade wars and tariffs have dented demand for
Japanese manufactured goods, and also contributed to pushing business optimism about the year ahead close to a two-year low.
Japan manufacturing exports
10
Japan economic growth and the PMI*
© 2018 IHS Markit. All Rights Reserved.
Sources: IHS Markit, Nikkei, Japan Cabinet Office.
* PMI shown is a GDP-weighted average of the manufacturing and services indices.Sources: IHS Markit, Nikkei, Datastream.
© 2016 IHS Markit. All Rights Reserved.
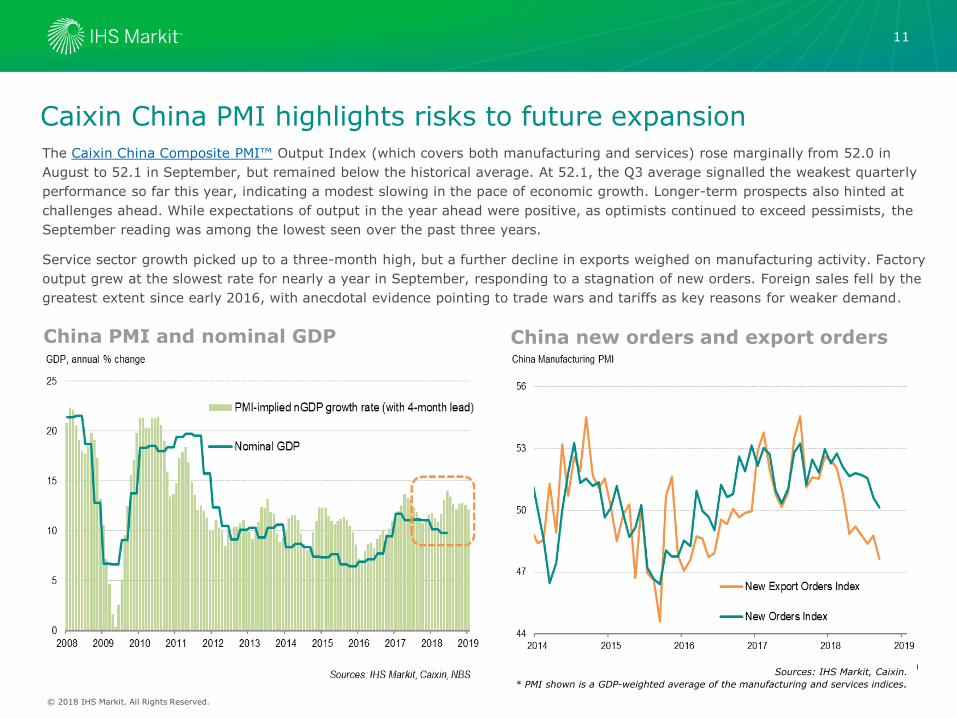
Caixin China PMI highlights risks to future expansion The Caixin China Composite PMI™ Output Index (which covers both manufacturing and services) rose marginally from 52.0 in
August to 52.1 in September, but remained below the historical average. At 52.1, the Q3 average signalled the weakest quarterly
performance so far this year, indicating a modest slowing in the pace of economic growth. Longer-term prospects also hinted at
challenges ahead. While expectations of output in the year ahead were positive, as optimists continued to exceed pessimists, the
September reading was among the lowest seen over the past three years.
Service sector growth picked up to a three-month high, but a further decline in exports weighed on manufacturing activity. Factory
output grew at the slowest rate for nearly a year in September, responding to a stagnation of new orders. Foreign sales fell by the
greatest extent since early 2016, with anecdotal evidence pointing to trade wars and tariffs as key reasons for weaker demand.
China new orders and export orders
11
China PMI and nominal GDP
© 2018 IHS Markit. All Rights Reserved.
Sources: IHS Markit, Caixin. Sources: IHS Markit, Caixin.
* PMI shown is a GDP-weighted average of the manufacturing and services indices.

© 2016 IHS Markit. All Rights Reserved.
Disclaimer
The information contained in this presentation is confidential. Any unauthorised use, disclosure, reproduction or dissemination,in full or in part, in any media or by any means, without the prior written permission of IHS Markit or any of its affiliates("Markit") is strictly prohibited.
Opinions, statements, estimates and projections in this presentation (including other media) are solely those of the individual author(s) at the time of writing and do not necessarily reflect the opinions of IHS Markit. Neither IHS Markit nor the author(s)has any obligation to update this presentation in the event that any content, opinion, statement, estimate or projection (collectively, "information") changes or subsequently becomes inaccurate.
IHS Markit makes no warranty, expressed or implied, as to the accuracy, completeness or timeliness of any information in thispresentation, and shall not in any way be liable to any recipient for any inaccuracies or omissions. Without limiting the foregoing, Markit shall have no liability whatsoever to any recipient, whether in contract, in tort (including negligence), under warranty, under statute or otherwise, in respect of any loss or damage suffered by any recipient as a result of or in connectionwith any information provided, or any course of action determined, by it or any third party, whether or not based on any information provided.
The inclusion of a link to an external website by IHS Markit should not be understood to be an endorsement of that website orthe site's owners (or their products/services). IHS Markit is not responsible for either the content or output of external websites.
Copyright ©2018, IHS Markit Limited. All rights reserved and all intellectual property rights are retained by IHS Markit.
12
© 2018 IHS Markit. All Rights Reserved.
Related Documents