The Global Use of Medicines: Outlook Through 2016 July 2012 Report by the IMS Institute for Healthcare Informatics

Welcome message from author
This document is posted to help you gain knowledge. Please leave a comment to let me know what you think about it! Share it to your friends and learn new things together.
Transcript
The Global Useof Medicines:
OutlookThrough 2016
July 2012
Report by the IMS Institute for Healthcare Informatics
The Global Use of Medicines: Outlook Through 2016Report by the IMS Institute for Healthcare Informatics
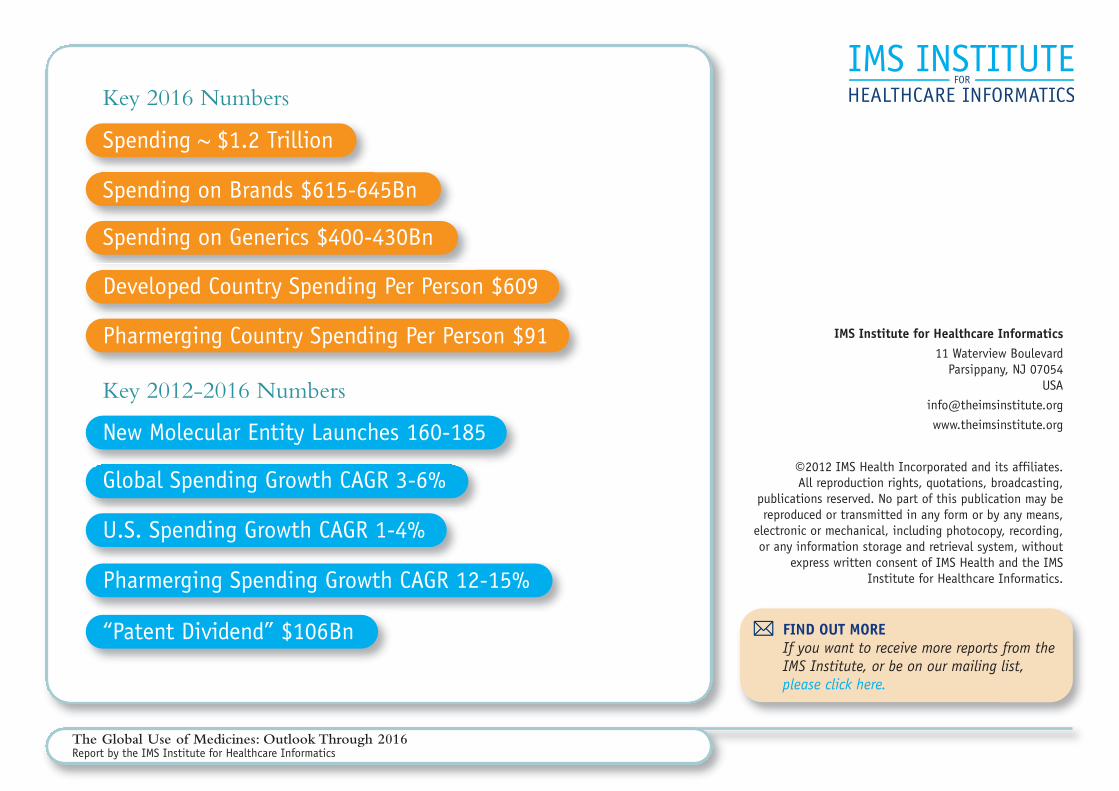
Key 2012-2016 Numbers
Key 2016 Numbers
Developed Country Spending Per Person $609
Pharmerging Country Spending Per Person $91
Global Spending Growth CAGR 3-6%
U.S. Spending Growth CAGR 1-4%
Pharmerging Spending Growth CAGR 12-15%
“Patent Dividend” $106Bn
Spending on Brands $615-645Bn
New Molecular Entity Launches 160-185
Spending on Generics $400-430Bn
Spending ~ $1.2 Trillion
IMS Institute for Healthcare Informatics11 Waterview Boulevard
Parsippany, NJ 07054USA
www.theimsinstitute.org
©2012 IMS Health Incorporated and its affiliates.All reproduction rights, quotations, broadcasting,
publications reserved. No part of this publication may bereproduced or transmitted in any form or by any means,
electronic or mechanical, including photocopy, recording,or any information storage and retrieval system, without
express written consent of IMS Health and the IMSInstitute for Healthcare Informatics.
FIND OUT MORE If you want to receive more reports from the IMS Institute, or be on our mailing list, please click here.
1The Global Use of Medicines: Outlook Through 2016Report by the IMS Institute for Healthcare Informatics
Contents
Introduction .......................................................... 2
Executive Summary .................................................. 3
Global Spending on Medicines .................................. 4
Transformations in Disease Treatment ....................... 11
Global Spending Growth ......................................... 17
Notes on Sources ................................................. 29
Appendices .......................................................... 30
About the IMS Institute ........................................ 33
The future level of global spending on medicines underscores the similar challenges of access and affordability which face those whoconsume and pay for healthcare around the world.
In the developed markets, including the United States and Europe, the current economic downturn will amplify many of the long-termconcerns about aging populations afflicted with expensive chronic diseases and the desire by all healthcare stakeholders to control costs.Across countries, similar policies are already being implemented to rein in spending on expensive therapies, increase the use of generics,address pricing directly through price cuts or indirectly via discounts or rebates, and develop a market for biosimilars as a lower-costalternative to original biologics.
Alternatively, the fast growing pharmerging markets will be driven predominantly by economic gains and rising incomes. This rise inincomes, particularly for the lowest earners, coupled with government commitments to support expanded access to basic healthcare services,will make medicines more broadly available and affordable to millions of people.
Further, new therapies for a range of diseases affecting both developed and developing world populations are currently, or will soon become,available transforming patient care. Despite this progress, however, significant gaps remain in the drug arsenal.
In this report we quantify these factors and examine the spending and usage of medicines globally through 2016. We intend this report toprovide a foundation for meaningful discussion about the value, cost and role of medicines in healthcare over the next five years. Our reportwas developed as a public service without industry or government funding.
Michael KleinrockDirector, Research DevelopmentIMS Institute for Healthcare Informatics
Introduction
2The Global Use of Medicines: Outlook Through 2016Report by the IMS Institute for Healthcare Informatics
Executive summaryGLOBAL SPENDING ON MEDICINES Annual global spending on medicines will reachnearly $1.2 trillion by 2016, as the pharmergingmarkets, biologics and generics contribute more tospending. In the developed markets, including theUnited States, Europe and Japan, spending willdecline to 57% of the global total due to expiringpatents for a number of significant brand-namedrugs, slower increases in spending on brandedproducts, and increased cost containment measuresby payers. Alternatively, pharmerging markets willreach 30% of global spending by 2016, as populationand economic growth contribute to dramaticallyhigher use of medicines in these markets.
Overall, the top 20 therapy areas will account for42% of global spending, led by cancer, diabetes andasthma/COPD.
An accelerated shift to the use of generic medicinesis expected, both from an unprecedented level ofpatent expiries in the U.S., and from volume-drivengrowth in the largely generic-using pharmergingmarkets. At the same time, lower-cost versions ofexpensive biologic medicines, or biosimilars, willcontinue to be launched, though slowly, and willaccount for only $4-6Bn, or 2%, of the $200-210Bnin spending on biologics by 2016.
By 2016, net spending on medicines, after off-invoice discounts and rebates, will surpass $1 trillionglobally. Off-invoice transactions will continue torise, particularly for generics, representing inaggregate an estimated $180-190Bn in 2016.
TRANSFORMATIONS IN DISEASE TREATMENTS New medicines will transform patient care in a largenumber of diseases including cancer, heart disease andcentral nervous system disorders. Few medicines areavailable uniformly to all patients globally followinglaunch, and the time lag in some countries for gainingaccess to these medicines can be significant. Provenmedicines, which were only previously available in afew countries, will become more widely available overthe next five years, bringing important advances in carefor diabetes, cancer and autoimmune diseases to millions.
Global launches for New Molecular Entities (NME)will rebound, as 32 to 37 NMEs per year are expectedto be launched, through 2016. Innovative therapiesare anticipated for Alzheimer’s and autoimmunediseases, diabetes, cancer, and infectious, cardiovascularand respiratory conditions, as well as orphan diseases.
In 2004, the World Health Organization reportedthat significant gaps existed in pharmaceuticalsavailable to treat certain priority diseases, and issueda call to action to address these gaps. In the yearssince, significant efforts have been made to addresssome of these disease areas, though gaps will remain.
GLOBAL SPENDING GROWTH Annual global spending growth will increase from$30Bn in 2012, to $70Bn in 2016, driven by volumegrowth in pharmerging markets and higher spendingby developed nations. The pharmerging countrieswill double their spending on pharmaceuticals overthe next five years, as annual growth is forecast toincrease from $24Bn in 2012, to $35-45Bn in 2016.
Spending on medicines in the pharmerging marketswill increase by $150-165Bn, driven by risingincomes and macroeconomic expansion, andincreasing access to medicines supported through arange of government policies and programs.
The developed markets are expected to grow slowly dueto patent expiries and the sustained impact of the globaleconomic crisis felt in these countries since 2008. Patentexpiries will reduce brand spending by $127Bn through2016, yielding a five-year “patent dividend” of $106Bn.
In the U.S., spending growth will recover, butremain at historically low levels. Patent expiries andthe introduction of low-cost generics will reducespending throughout the forecast period.
In Europe, growth is expected to be in the -1% to2% range through 2016, compared to 3.8% for2007-2011, as national debt incurred due to theglobal economic crisis is anticipated to be addressedthrough austerity programs and healthcare costcontainment. Limited savings from patent expiriesare also prompting policy shifts that encourage thegreater use of generics and lower reimbursement,such as those already enacted in Spain in 2010.
The Japanese market for pharmaceuticals will increaseslightly over the next five years with growth forecastbetween 1-4% and punctuated by biennial price cuts.Reforms, implemented in 2010, will continue toencourage greater adoption of new medicines and alsoshift usage from off-patent brands to generics. WhileJapan’s population as a whole will decline, an agingpopulation is expected to drive up demand for medicines.
3The Global Use of Medicines: Outlook Through 2016Report by the IMS Institute for Healthcare Informatics
Global Spending on Medicines
• By 2016, developed markets will decline to 57% of global spending due topatent expiries, slower brand spending growth and increased costcontainment actions by payers.
• Pharmerging markets share of spending will increase by 10 percentage points to 30% of global spending over the next five years, as population andeconomic growth will drive a dramatically higher use of medicines in thesemarkets.
• There will be an accelerated shift in spending to generics; biologic medicinesare expected to account for $200-210Bn of global spending, while biosimilarswill be between $4-6Bn, or 2% of biologics spending.
• Off-invoice discounts and rebates will represent an estimated $180-190Bn in2016, which would lower estimated global spending by 15-16% to $995-1,005Bn.
Global spending on medicines annually will grow to nearly $1.2 trillion by 2016, as the pharmerging markets, biologics andgenerics contribute a greater share of spending.
4The Global Use of Medicines: Outlook Through 2016Report by the IMS Institute for Healthcare Informatics
5The Global Use of Medicines: Outlook Through 2016Report by the IMS Institute for Healthcare Informatics
GLOBAL SPENDING ON MEDICINES
Global spending will reach nearly $1.2 trillion by 2016
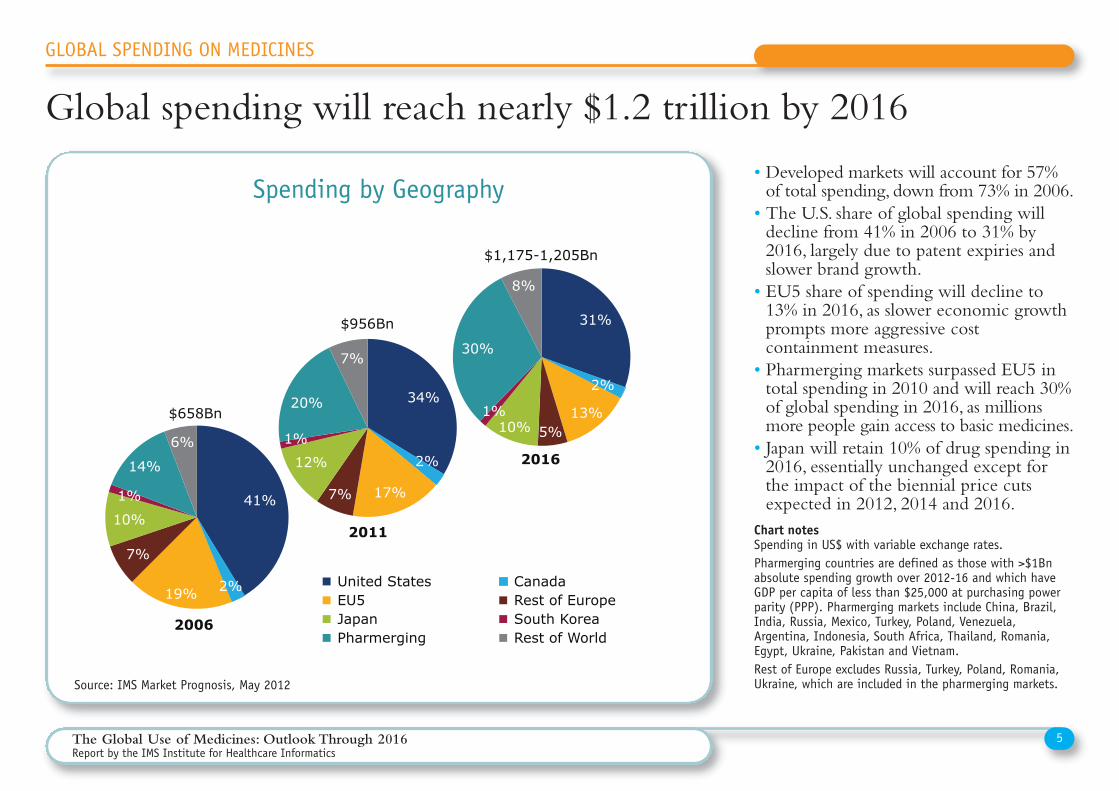
• Developed markets will account for 57%of total spending, down from 73% in 2006.• The U.S. share of global spending willdecline from 41% in 2006 to 31% by2016, largely due to patent expiries andslower brand growth.• EU5 share of spending will decline to13% in 2016, as slower economic growthprompts more aggressive costcontainment measures.• Pharmerging markets surpassed EU5 intotal spending in 2010 and will reach 30%of global spending in 2016, as millionsmore people gain access to basic medicines.• Japan will retain 10% of drug spending in2016, essentially unchanged except forthe impact of the biennial price cutsexpected in 2012, 2014 and 2016.
Spending by Geography
Chart notesSpending in US$ with variable exchange rates.Pharmerging countries are defined as those with >$1Bnabsolute spending growth over 2012-16 and which haveGDP per capita of less than $25,000 at purchasing powerparity (PPP). Pharmerging markets include China, Brazil,India, Russia, Mexico, Turkey, Poland, Venezuela,Argentina, Indonesia, South Africa, Thailand, Romania,Egypt, Ukraine, Pakistan and Vietnam.Rest of Europe excludes Russia, Turkey, Poland, Romania,Ukraine, which are included in the pharmerging markets.
31%
2%
13% 5% 10%
1%
30%
8%
2016
34%
2%
17% 7%
12%
1%
20%
7%
United States Canada EU5 Rest of Europe Japan South Korea Pharmerging Rest of World
2011
41%
2% 19%
7%
10%
1%
14%
6%
2006
$658Bn
$956Bn
$1,175-1,205Bn
Global spending on medicines nearly $1.2 trillion by 2016
Source: IMS Market Prognosis, May 2012
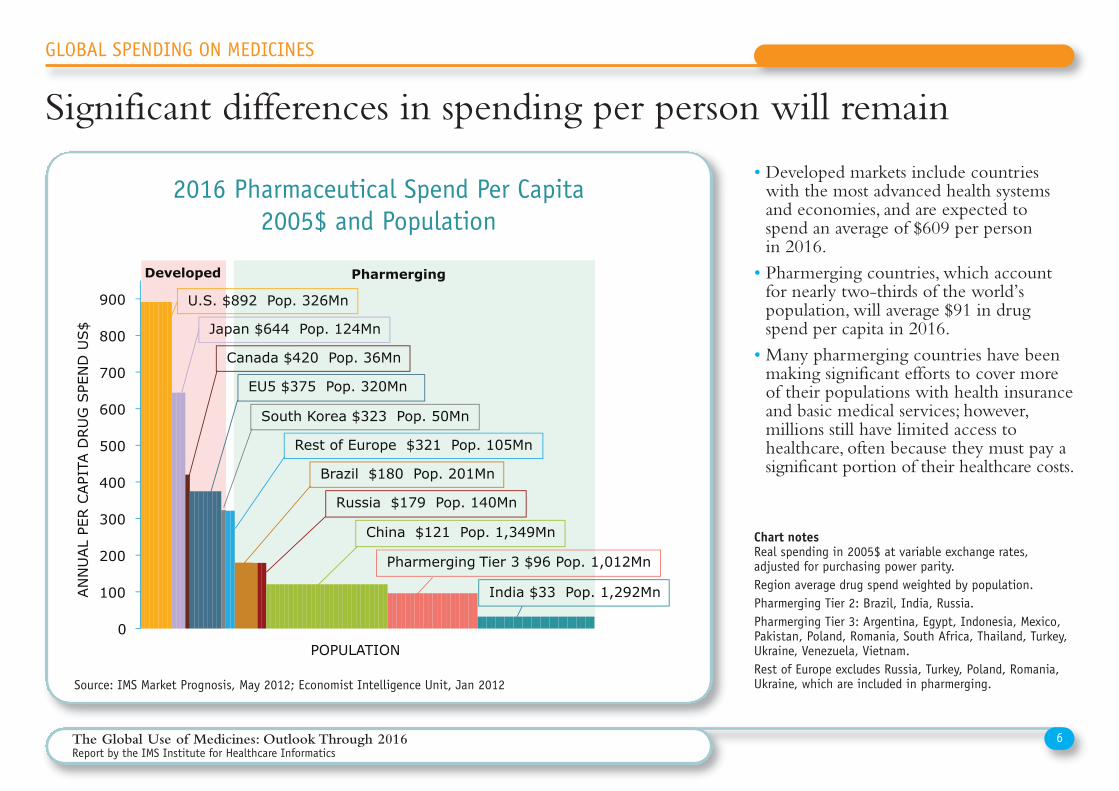
• Developed markets include countrieswith the most advanced health systemsand economies, and are expected tospend an average of $609 per person in 2016.• Pharmerging countries, which accountfor nearly two-thirds of the world’spopulation, will average $91 in drugspend per capita in 2016.• Many pharmerging countries have beenmaking significant efforts to cover moreof their populations with health insuranceand basic medical services; however,millions still have limited access tohealthcare, often because they must pay asignificant portion of their healthcare costs.
Significant differences in spending per person will remain
2016 Pharmaceutical Spend Per Capita2005$ and Population
Chart notesReal spending in 2005$ at variable exchange rates,adjusted for purchasing power parity.Region average drug spend weighted by population.Pharmerging Tier 2: Brazil, India, Russia.Pharmerging Tier 3: Argentina, Egypt, Indonesia, Mexico,Pakistan, Poland, Romania, South Africa, Thailand, Turkey,Ukraine, Venezuela, Vietnam.Rest of Europe excludes Russia, Turkey, Poland, Romania,Ukraine, which are included in pharmerging.
6The Global Use of Medicines: Outlook Through 2016Report by the IMS Institute for Healthcare Informatics
Source: IMS Market Prognosis, May 2012; Economist Intelligence Unit, Jan 2012
GLOBAL SPENDING ON MEDICINES
0
100
200
300
400
500
600
700
800
900
AN
NU
AL
PER C
API
TA D
RU
G S
PEN
D U
S$
POPULATION
Significant differences in spending per person remain
U.S. $892 Pop. 326Mn
Japan $644 Pop. 124Mn
Canada $420 Pop. 36Mn
EU5 $375 Pop. 320Mn
South Korea $323 Pop. 50Mn
Rest of Europe $321 Pop. 105Mn
Brazil $180 Pop. 201Mn
Russia $179 Pop. 140Mn
China $121 Pop. 1,349Mn
Pharmerging Tier 3 $96 Pop. 1,012Mn
India $33 Pop. 1,292Mn
Developed Pharmerging
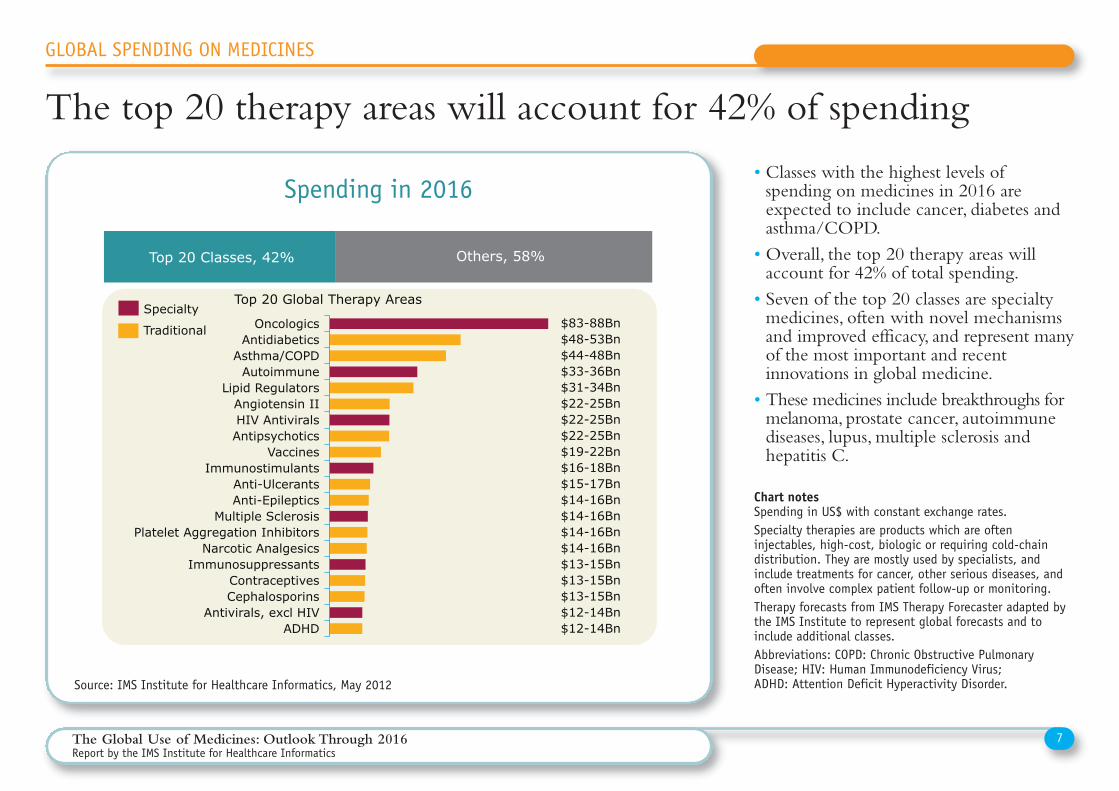
• Classes with the highest levels ofspending on medicines in 2016 areexpected to include cancer, diabetes andasthma/COPD.• Overall, the top 20 therapy areas willaccount for 42% of total spending.• Seven of the top 20 classes are specialtymedicines, often with novel mechanismsand improved efficacy, and represent manyof the most important and recentinnovations in global medicine.• These medicines include breakthroughs formelanoma, prostate cancer, autoimmunediseases, lupus, multiple sclerosis andhepatitis C.
Spending in 2016
Chart notesSpending in US$ with constant exchange rates. Specialty therapies are products which are ofteninjectables, high-cost, biologic or requiring cold-chaindistribution. They are mostly used by specialists, andinclude treatments for cancer, other serious diseases, andoften involve complex patient follow-up or monitoring.Therapy forecasts from IMS Therapy Forecaster adapted bythe IMS Institute to represent global forecasts and toinclude additional classes.Abbreviations: COPD: Chronic Obstructive PulmonaryDisease; HIV: Human Immunodeficiency Virus; ADHD: Attention Deficit Hyperactivity Disorder.
7The Global Use of Medicines: Outlook Through 2016Report by the IMS Institute for Healthcare Informatics
ADHD Antivirals, excl HIV
Cephalosporins Contraceptives
Immunosuppressants Narcotic Analgesics
Platelet Aggregation Inhibitors Multiple Sclerosis
Anti-Epileptics Anti-Ulcerants
Immunostimulants Vaccines
Antipsychotics HIV Antivirals Angiotensin II
Lipid Regulators Autoimmune
Asthma/COPD Antidiabetics
Oncologics
Others, 58%
The top 20 therapy areas account for 42% of spending
Top 20 Global Therapy Areas
$83-88Bn $48-53Bn $44-48Bn $33-36Bn $31-34Bn $22-25Bn $22-25Bn $22-25Bn $19-22Bn $16-18Bn $15-17Bn $14-16Bn $14-16Bn $14-16Bn $14-16Bn $13-15Bn $13-15Bn $13-15Bn $12-14Bn $12-14Bn
Specialty
Traditional
Top 20 Classes, 42%
Source: IMS Institute for Healthcare Informatics, May 2012
GLOBAL SPENDING ON MEDICINES
The top 20 therapy areas will account for 42% of spending
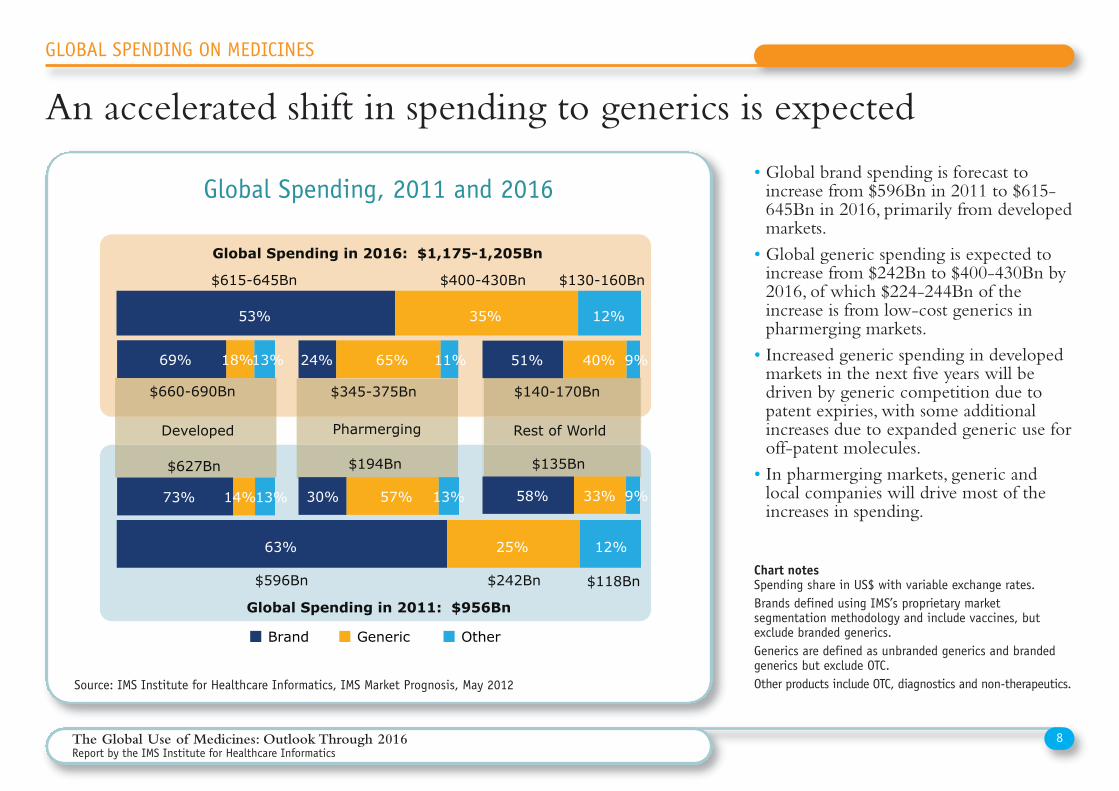
• Global brand spending is forecast toincrease from $596Bn in 2011 to $615-645Bn in 2016, primarily from developedmarkets.• Global generic spending is expected toincrease from $242Bn to $400-430Bn by2016, of which $224-244Bn of theincrease is from low-cost generics inpharmerging markets.• Increased generic spending in developedmarkets in the next five years will bedriven by generic competition due topatent expiries, with some additionalincreases due to expanded generic use foroff-patent molecules.• In pharmerging markets, generic andlocal companies will drive most of theincreases in spending.
Global Spending, 2011 and 2016
Chart notesSpending share in US$ with variable exchange rates.Brands defined using IMS’s proprietary marketsegmentation methodology and include vaccines, butexclude branded generics. Generics are defined as unbranded generics and brandedgenerics but exclude OTC.Other products include OTC, diagnostics and non-therapeutics.
8The Global Use of Medicines: Outlook Through 2016Report by the IMS Institute for Healthcare Informatics
An accelerated shift in spending to generics is expected
53% 35% 12%
58%
51%
33%
40%
9%
9%
73%
69%
14%
18%
13%
13%
30%
24%
57%
65%
13%
11%
63% 25% 12%
Brand Generic Other
Global Spending in 2011: $956Bn
Global Spending in 2016: $1,175-1,205Bn
$660-690Bn $345-375Bn $140-170Bn
$596Bn $242Bn $118Bn
$627Bn $194Bn $135Bn
$615-645Bn $400-430Bn $130-160Bn
Pharmerging Developed Rest of World
Source: IMS Institute for Healthcare Informatics, IMS Market Prognosis, May 2012
GLOBAL SPENDING ON MEDICINES
An accelerated shift in spending to generics is expected
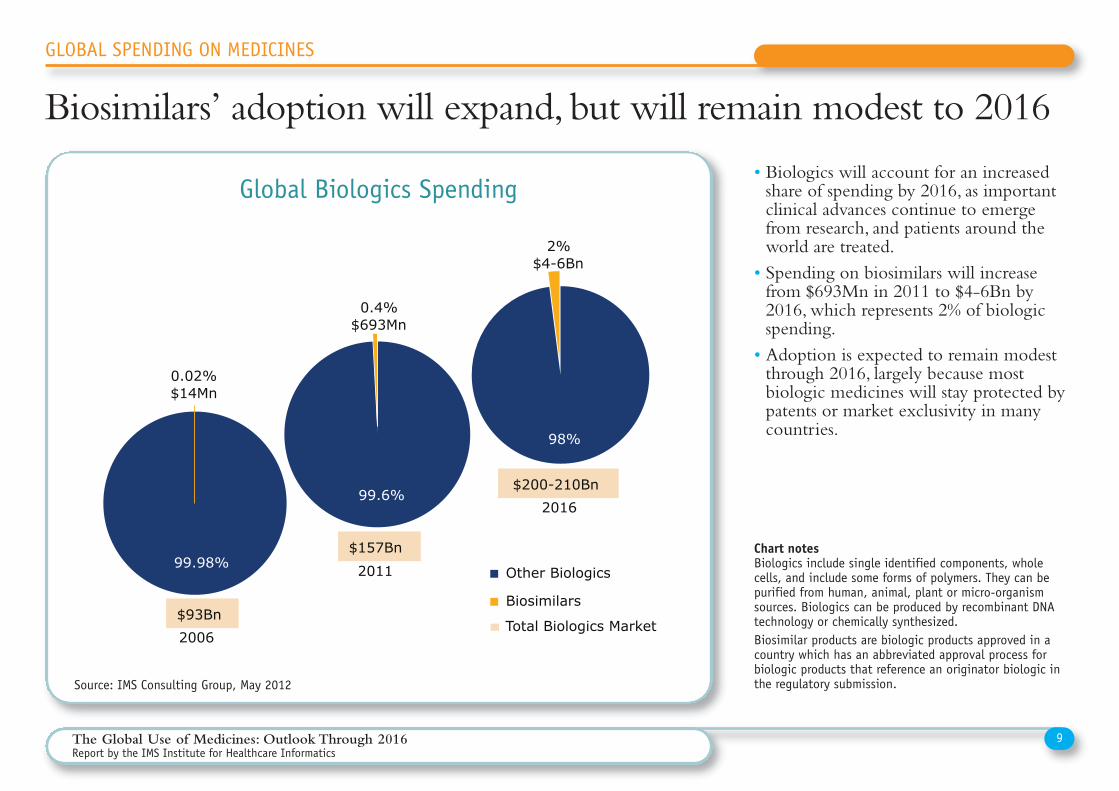
• Biologics will account for an increasedshare of spending by 2016, as importantclinical advances continue to emergefrom research, and patients around theworld are treated.• Spending on biosimilars will increasefrom $693Mn in 2011 to $4-6Bn by2016, which represents 2% of biologicspending.• Adoption is expected to remain modestthrough 2016, largely because mostbiologic medicines will stay protected bypatents or market exclusivity in manycountries.
Global Biologics Spending
Chart notesBiologics include single identified components, wholecells, and include some forms of polymers. They can bepurified from human, animal, plant or micro-organismsources. Biologics can be produced by recombinant DNAtechnology or chemically synthesized.Biosimilar products are biologic products approved in acountry which has an abbreviated approval process forbiologic products that reference an originator biologic inthe regulatory submission.
9The Global Use of Medicines: Outlook Through 2016Report by the IMS Institute for Healthcare Informatics
98%
2% $4-6Bn
99.6%
0.4% $693Mn
Other Biologics
Biosimilars
2016
2011
0.02% $14Mn
2006
Biosimilars ’ adoption will continue, but will remain modest to 2016
$93Bn
$157Bn
$200-210Bn
99.98%
Total Biologics Market
Source: IMS Consulting Group, May 2012
GLOBAL SPENDING ON MEDICINES
Biosimilars’ adoption will expand, but will remain modest to 2016
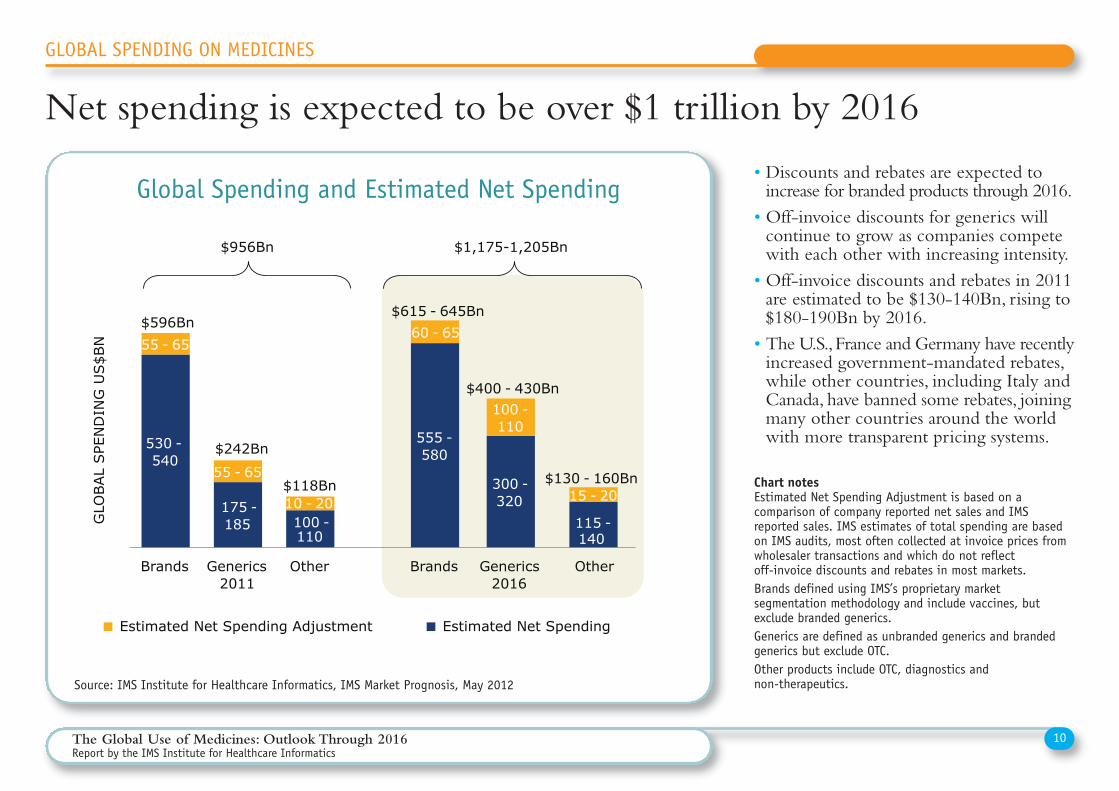
• Discounts and rebates are expected toincrease for branded products through 2016.• Off-invoice discounts for generics willcontinue to grow as companies competewith each other with increasing intensity.• Off-invoice discounts and rebates in 2011are estimated to be $130-140Bn, rising to$180-190Bn by 2016.• The U.S., France and Germany have recentlyincreased government-mandated rebates,while other countries, including Italy andCanada, have banned some rebates, joiningmany other countries around the worldwith more transparent pricing systems.
Global Spending and Estimated Net Spending
Chart notesEstimated Net Spending Adjustment is based on acomparison of company reported net sales and IMSreported sales. IMS estimates of total spending are basedon IMS audits, most often collected at invoice prices fromwholesaler transactions and which do not reflect off-invoice discounts and rebates in most markets.Brands defined using IMS’s proprietary marketsegmentation methodology and include vaccines, butexclude branded generics. Generics are defined as unbranded generics and brandedgenerics but exclude OTC.Other products include OTC, diagnostics and non-therapeutics.
10The Global Use of Medicines: Outlook Through 2016Report by the IMS Institute for Healthcare Informatics
530 - 540
175 - 185 100 -
110
555 - 580
300 - 320
115 - 140
55 - 65
55 - 65
10 - 20
60 - 65
100 - 110
15 - 20
Brands Generics 2011
Other Brands Generics 2016
Other
GLO
BAL
SPE
ND
ING
US$B
N
Estimated Net Spending Adjustment Estimated Net Spending
Net spending is expected to be over $1 trillion by 2016
$956Bn
$118Bn
$596Bn
$1,175-1,205Bn
$615 - 645Bn
$400 - 430Bn
$130 - 160Bn
$242Bn
Source: IMS Institute for Healthcare Informatics, IMS Market Prognosis, May 2012
GLOBAL SPENDING ON MEDICINES
Net spending is expected to be over $1 trillion by 2016
Transformations in Disease Treatment
• From 2006-2010, 140 NMEs were launched globally, with the developedmarkets gaining the most from these new product introductions. While fewmedicines are uniformly available across most countries, the most innovativeones are broadly available, across developed and pharmerging markets,including medicines for treating diabetes, HPV and thrombosis.
• Greater availability of existing and new medicines will transform care astreatments for global priority diseases improve and clusters of newtherapies, with existing or novel mechanisms of action, provide moreoptions for patients.
• More new medicines will be launched per year during the next five years,including innovative therapies for Alzheimer’s, autoimmune diseases,diabetes, and a number of cancers and orphan diseases.
• Treatments for priority diseases will improve, but gaps will remain.
New medicines will transform patient care in a large number of diseasesincluding cancer, heart disease and central nervous disorders, thoughsignificant gaps will remain in several global priority diseases.
11The Global Use of Medicines: Outlook Through 2016Report by the IMS Institute for Healthcare Informatics
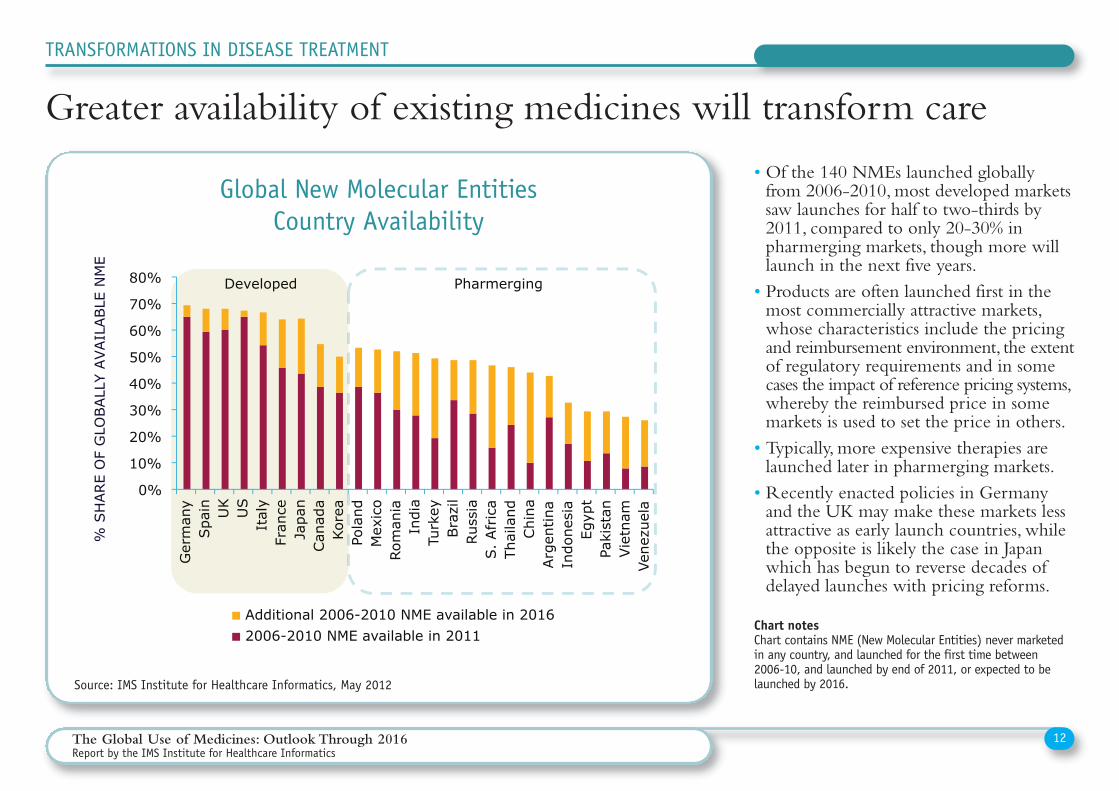
• Of the 140 NMEs launched globallyfrom 2006-2010, most developed marketssaw launches for half to two-thirds by2011, compared to only 20-30% inpharmerging markets, though more willlaunch in the next five years.• Products are often launched first in themost commercially attractive markets,whose characteristics include the pricingand reimbursement environment, the extentof regulatory requirements and in somecases the impact of reference pricing systems,whereby the reimbursed price in somemarkets is used to set the price in others.• Typically, more expensive therapies arelaunched later in pharmerging markets.• Recently enacted policies in Germanyand the UK may make these markets lessattractive as early launch countries, whilethe opposite is likely the case in Japanwhich has begun to reverse decades ofdelayed launches with pricing reforms.
Global New Molecular EntitiesCountry Availability
Chart notesChart contains NME (New Molecular Entities) never marketedin any country, and launched for the first time between 2006-10, and launched by end of 2011, or expected to belaunched by 2016.
12The Global Use of Medicines: Outlook Through 2016Report by the IMS Institute for Healthcare Informatics
Source: IMS Institute for Healthcare Informatics, May 2012
TRANSFORMATIONS IN DISEASE TREATMENT
Greater availability of existing medicines will transform care
Developed Pharmerging
Greater availability of existing medicines will transform care %
SH
ARE
OF
GLO
BALL
Y AVAIL
ABLE
NM
E
0%
10%
20%
30%
40%
50%
60%
70%
80%
Ger
man
y Spa
in
UK
US
Ital
y Fr
ance
Ja
pan
Can
ada
Kor
ea
Pola
nd
Mex
ico
Rom
ania
In
dia
Turk
ey
Bra
zil
Rus
sia
S.
Afr
ica
Thai
land
Chi
na
Arg
entina
In
done
sia
Egyp
t Pa
kist
an
Vie
tnam
Ve
nezu
ela
Additional 2006-2010 NME available in 2016 2006-2010 NME available in 2011
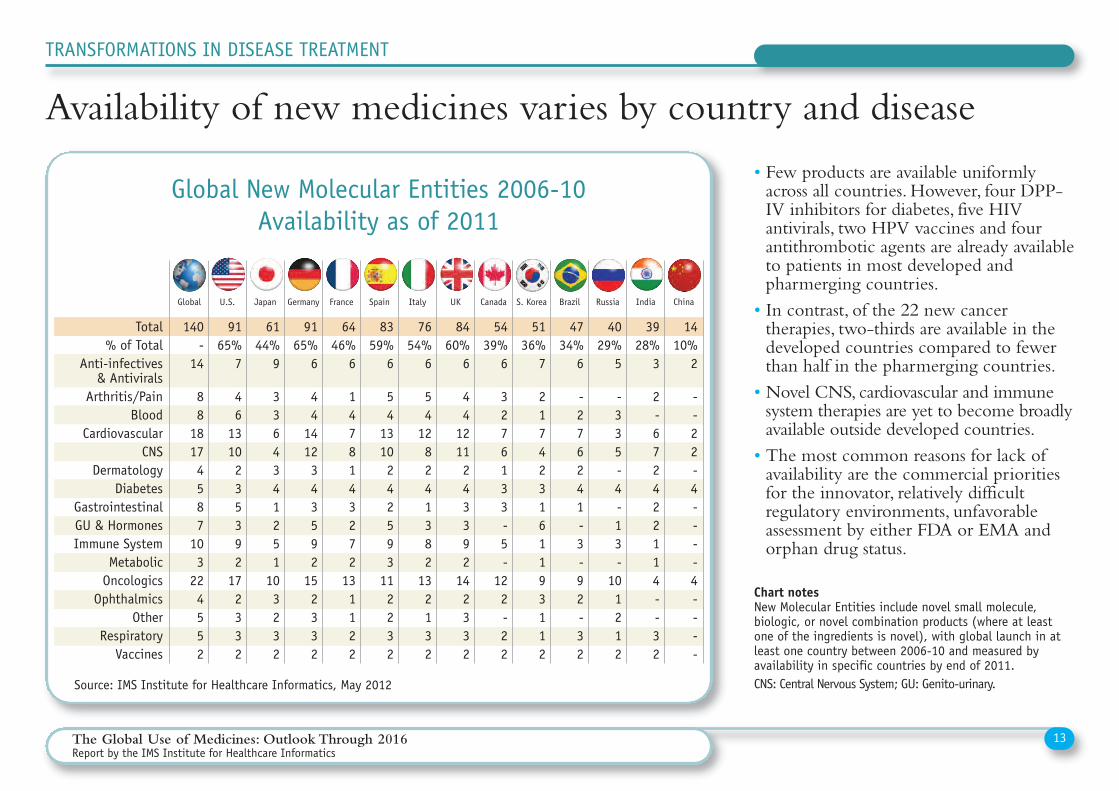
• Few products are available uniformlyacross all countries. However, four DPP-IV inhibitors for diabetes, five HIVantivirals, two HPV vaccines and fourantithrombotic agents are already availableto patients in most developed andpharmerging countries.• In contrast, of the 22 new cancertherapies, two-thirds are available in thedeveloped countries compared to fewerthan half in the pharmerging countries.• Novel CNS, cardiovascular and immunesystem therapies are yet to become broadlyavailable outside developed countries.• The most common reasons for lack ofavailability are the commercial prioritiesfor the innovator, relatively difficultregulatory environments, unfavorableassessment by either FDA or EMA andorphan drug status.
Global New Molecular Entities 2006-10Availability as of 2011
Source: IMS Institute for Healthcare Informatics, May 2012
Chart notesNew Molecular Entities include novel small molecule,biologic, or novel combination products (where at leastone of the ingredients is novel), with global launch in atleast one country between 2006-10 and measured byavailability in specific countries by end of 2011.CNS: Central Nervous System; GU: Genito-urinary.
13The Global Use of Medicines: Outlook Through 2016Report by the IMS Institute for Healthcare Informatics
TRANSFORMATIONS IN DISEASE TREATMENT
Availability of new medicines varies by country and disease
1410%
2
--22-4----4----
3928%
3
2-672422114--32
4029%
5
-335-4-13-
101212
4734%
6
-276241-3-92-32
5136%
7
217423161193112
5439%
6
3276133-5-
122-22
8460%
6
44
1211243392
142332
7654%
6
54
128241382
132132
8359%
6
54
1310242593
112232
6446%
6
1478143272
131122
9165%
6
44
1412343592
152332
6144%
9
3364341251
103232
9165%
7
46
1310235392
172332
140-
14
88
18174587
103
224552
Total% of Total
Anti-infectives & Antivirals
Arthritis/PainBlood
CardiovascularCNS
DermatologyDiabetes
GastrointestinalGU & HormonesImmune System
MetabolicOncologics
OphthalmicsOther
RespiratoryVaccines
Global U.S. Japan Germany France Spain Italy UK Canada S. Korea Brazil Russia India China
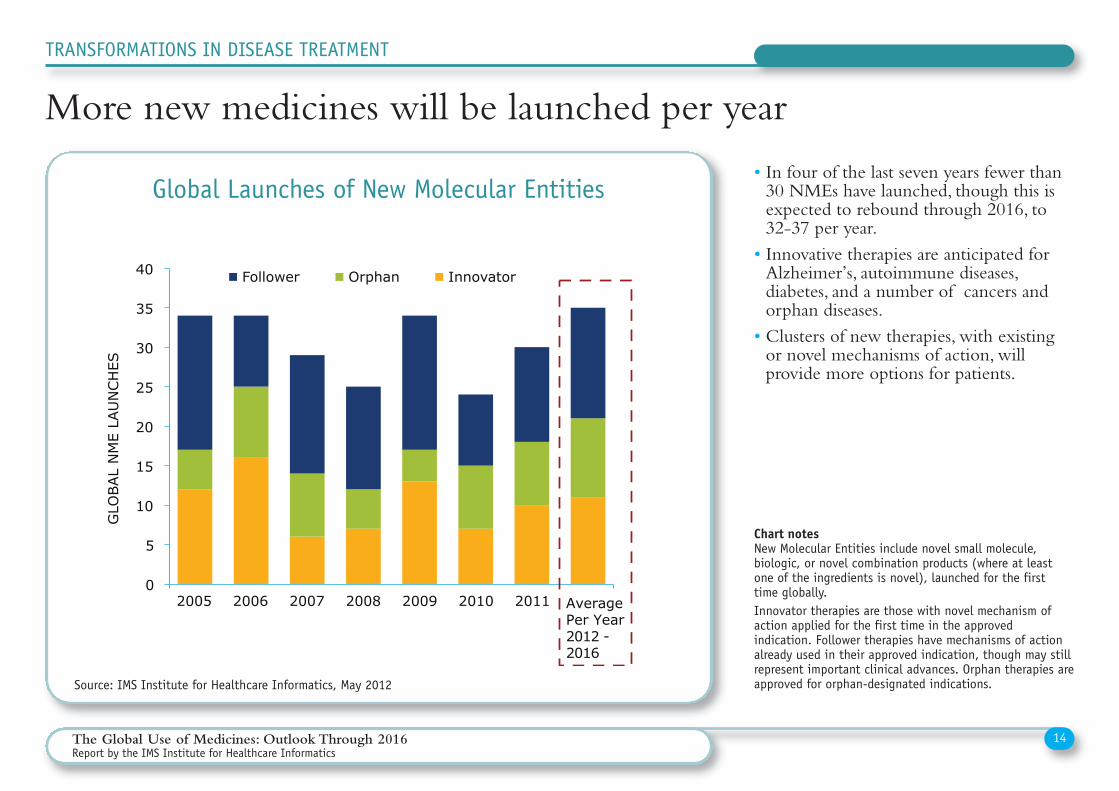
• In four of the last seven years fewer than30 NMEs have launched, though this isexpected to rebound through 2016, to32-37 per year.• Innovative therapies are anticipated forAlzheimer’s, autoimmune diseases,diabetes, and a number of cancers andorphan diseases.• Clusters of new therapies, with existingor novel mechanisms of action, willprovide more options for patients.
Global Launches of New Molecular Entities
Source: IMS Institute for Healthcare Informatics, May 2012
Chart notesNew Molecular Entities include novel small molecule,biologic, or novel combination products (where at leastone of the ingredients is novel), launched for the first time globally.Innovator therapies are those with novel mechanism ofaction applied for the first time in the approvedindication. Follower therapies have mechanisms of actionalready used in their approved indication, though may stillrepresent important clinical advances. Orphan therapies areapproved for orphan-designated indications.
14The Global Use of Medicines: Outlook Through 2016Report by the IMS Institute for Healthcare Informatics
TRANSFORMATIONS IN DISEASE TREATMENT
More new medicines will be launched per yearMore new medicines will be launched per year than historically
0
5
10
15
20
25
30
35
40
2005 2006 2007 2008 2009 2010 2011 AveragePer Year2012 -2016
Follower Orphan Innovator
GLO
BAL
NM
E LA
UN
CH
ES
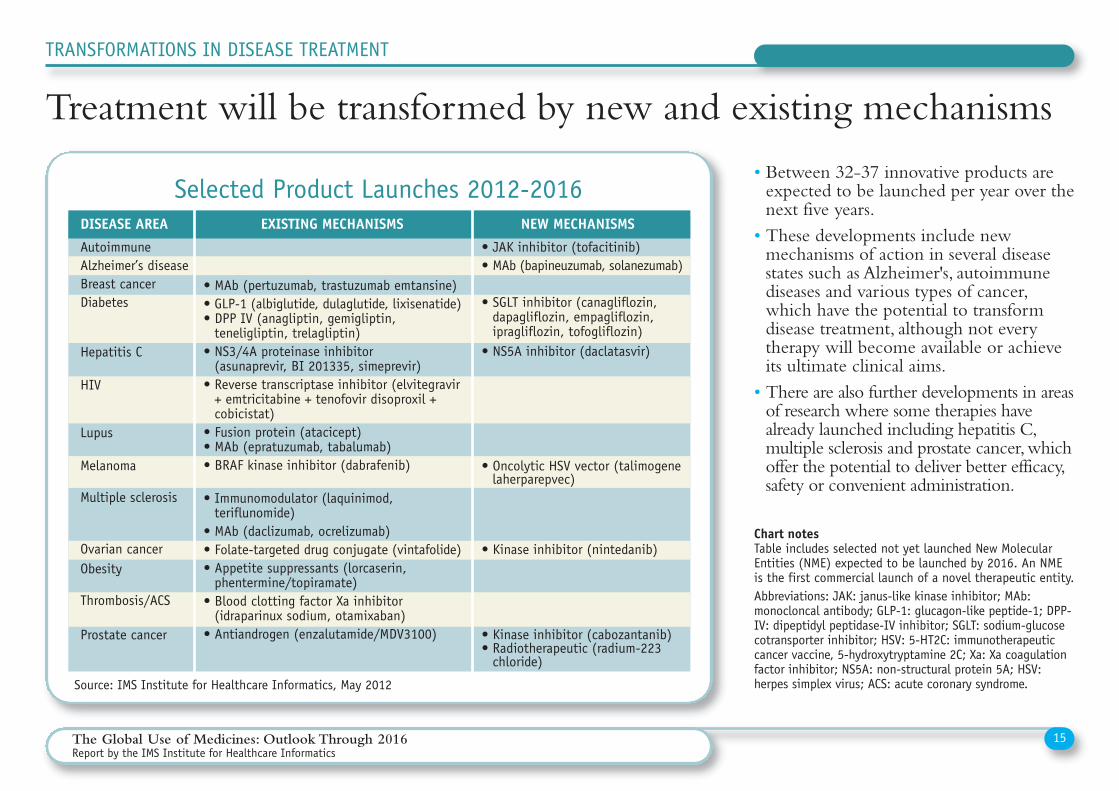
• Between 32-37 innovative products areexpected to be launched per year over thenext five years.• These developments include newmechanisms of action in several diseasestates such as Alzheimer's, autoimmunediseases and various types of cancer,which have the potential to transformdisease treatment, although not everytherapy will become available or achieveits ultimate clinical aims.• There are also further developments in areasof research where some therapies havealready launched including hepatitis C,multiple sclerosis and prostate cancer, whichoffer the potential to deliver better efficacy,safety or convenient administration.
Selected Product Launches 2012-2016
Source: IMS Institute for Healthcare Informatics, May 2012
Chart notesTable includes selected not yet launched New MolecularEntities (NME) expected to be launched by 2016. An NMEis the first commercial launch of a novel therapeutic entity.Abbreviations: JAK: janus-like kinase inhibitor; MAb:monocloncal antibody; GLP-1: glucagon-like peptide-1; DPP-IV: dipeptidyl peptidase-IV inhibitor; SGLT: sodium-glucosecotransporter inhibitor; HSV: 5-HT2C: immunotherapeuticcancer vaccine, 5-hydroxytryptamine 2C; Xa: Xa coagulationfactor inhibitor; NS5A: non-structural protein 5A; HSV:herpes simplex virus; ACS: acute coronary syndrome.
15The Global Use of Medicines: Outlook Through 2016Report by the IMS Institute for Healthcare Informatics
TRANSFORMATIONS IN DISEASE TREATMENT
Treatment will be transformed by new and existing mechanisms
DISEASE AREA EXISTING MECHANISMS NEW MECHANISMS
AutoimmuneAlzheimer’s disease Breast cancerDiabetes
Hepatitis C
HIV
Lupus
Melanoma
Multiple sclerosis
Ovarian cancerObesity
Thrombosis/ACS
Prostate cancer
• JAK inhibitor (tofacitinib)• MAb (bapineuzumab, solanezumab)
• SGLT inhibitor (canagliflozin,dapagliflozin, empagliflozin,ipragliflozin, tofogliflozin)
• NS5A inhibitor (daclatasvir)
• Oncolytic HSV vector (talimogenelaherparepvec)
• Kinase inhibitor (nintedanib)
• Kinase inhibitor (cabozantanib)• Radiotherapeutic (radium-223chloride)
• MAb (pertuzumab, trastuzumab emtansine)• GLP-1 (albiglutide, dulaglutide, lixisenatide)• DPP IV (anagliptin, gemigliptin,teneligliptin, trelagliptin)
• NS3/4A proteinase inhibitor (asunaprevir, BI 201335, simeprevir)
• Reverse transcriptase inhibitor (elvitegravir+ emtricitabine + tenofovir disoproxil +cobicistat)
• Fusion protein (atacicept)• MAb (epratuzumab, tabalumab)• BRAF kinase inhibitor (dabrafenib)
• Immunomodulator (laquinimod,teriflunomide)
• MAb (daclizumab, ocrelizumab)• Folate-targeted drug conjugate (vintafolide)• Appetite suppressants (lorcaserin,phentermine/topiramate)
• Blood clotting factor Xa inhibitor(idraparinux sodium, otamixaban)
• Antiandrogen (enzalutamide/MDV3100)
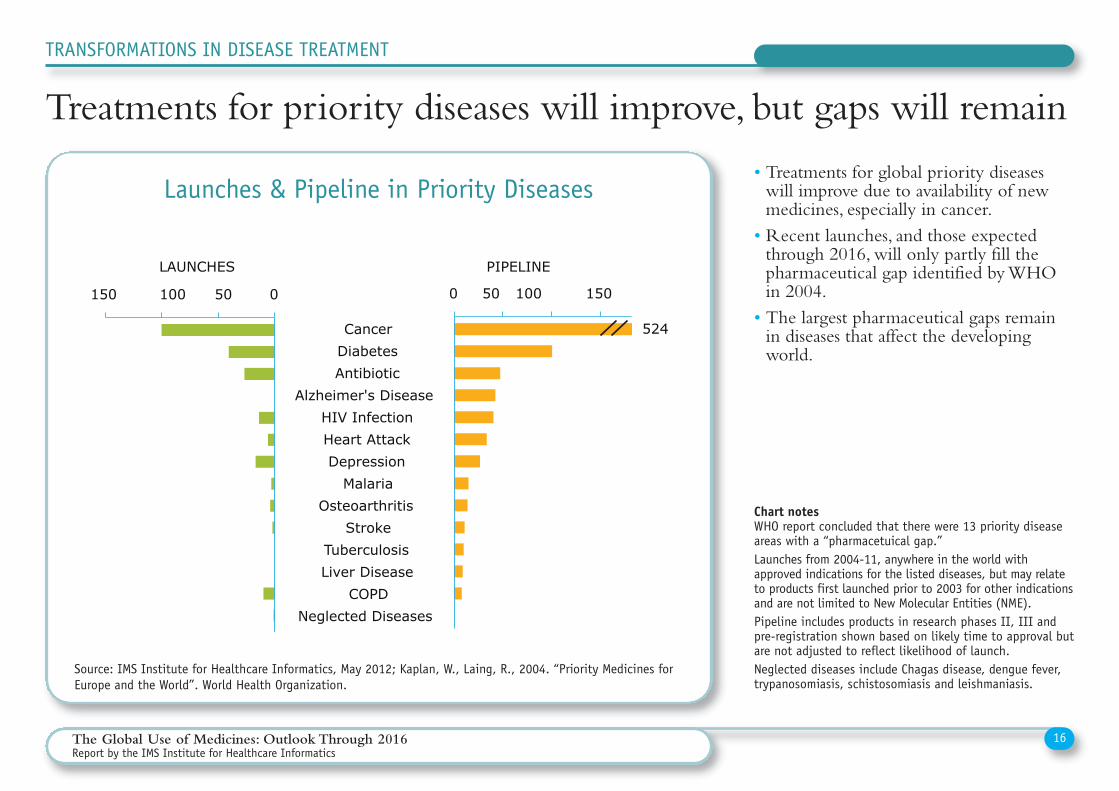
• Treatments for global priority diseaseswill improve due to availability of newmedicines, especially in cancer.• Recent launches, and those expectedthrough 2016, will only partly fill thepharmaceutical gap identified by WHOin 2004.• The largest pharmaceutical gaps remainin diseases that affect the developingworld.
Launches & Pipeline in Priority Diseases
Source: IMS Institute for Healthcare Informatics, May 2012; Kaplan, W., Laing, R., 2004. “Priority Medicines forEurope and the World”. World Health Organization.
Chart notesWHO report concluded that there were 13 priority diseaseareas with a “pharmacetuical gap.”Launches from 2004-11, anywhere in the world withapproved indications for the listed diseases, but may relateto products first launched prior to 2003 for other indicationsand are not limited to New Molecular Entities (NME).Pipeline includes products in research phases II, III andpre-registration shown based on likely time to approval butare not adjusted to reflect likelihood of launch.Neglected diseases include Chagas disease, dengue fever,trypanosomiasis, schistosomiasis and leishmaniasis.
16The Global Use of Medicines: Outlook Through 2016Report by the IMS Institute for Healthcare Informatics
TRANSFORMATIONS IN DISEASE TREATMENT
Treatments for priority diseases will improve, but gaps will remain
0 50 100 150
Cancer Diabetes Antibiotic
Alzheimer's DiseaseHIV Infection Heart Attack Depression
Malaria Osteoarthritis
Stroke Tuberculosis Liver Disease
COPD Neglected Diseases
0 50 100 150
Treatments for priority diseases will improve, but gaps will remain
PIPELINE LAUNCHES
524
Global Spending Growth
• Spending on medicines is expected to exceed $1 trillion in 2013, reachingnearly $1,200Bn by 2016 despite slowing growth and reduced contributionfrom developed markets due to patent expiries and the sustained impact of theeconomic crisis.
• The pharmerging markets will double their spending on pharmaceuticals,growing $150-165Bn by 2016, and driven by rising incomes, continued lowcost for drugs, and government sponsored programs designed to increase accessto medicines.
• Patent expiries will reduce brand spending in developed markets by $127Bnover the next five years offset by generic spending, and yielding a “patentdividend” of $106Bn through 2016.
• In the U.S., spending growth will increase, but remain at historically low levels;European growth will be significantly less through 2016 in the -1 to 2% range;spending on medicines will grow between 1-4% in Japan over the next fiveyears, and it will continue to be punctuated by biennial price cuts in 2012, 2014 and 2016.
Annual global spending growth on medicines will increase from $30Bn in2012 up to $70Bn in 2016, driven by volume growth in pharmergingmarkets and higher spending in developed markets.
17The Global Use of Medicines: Outlook Through 2016Report by the IMS Institute for Healthcare Informatics
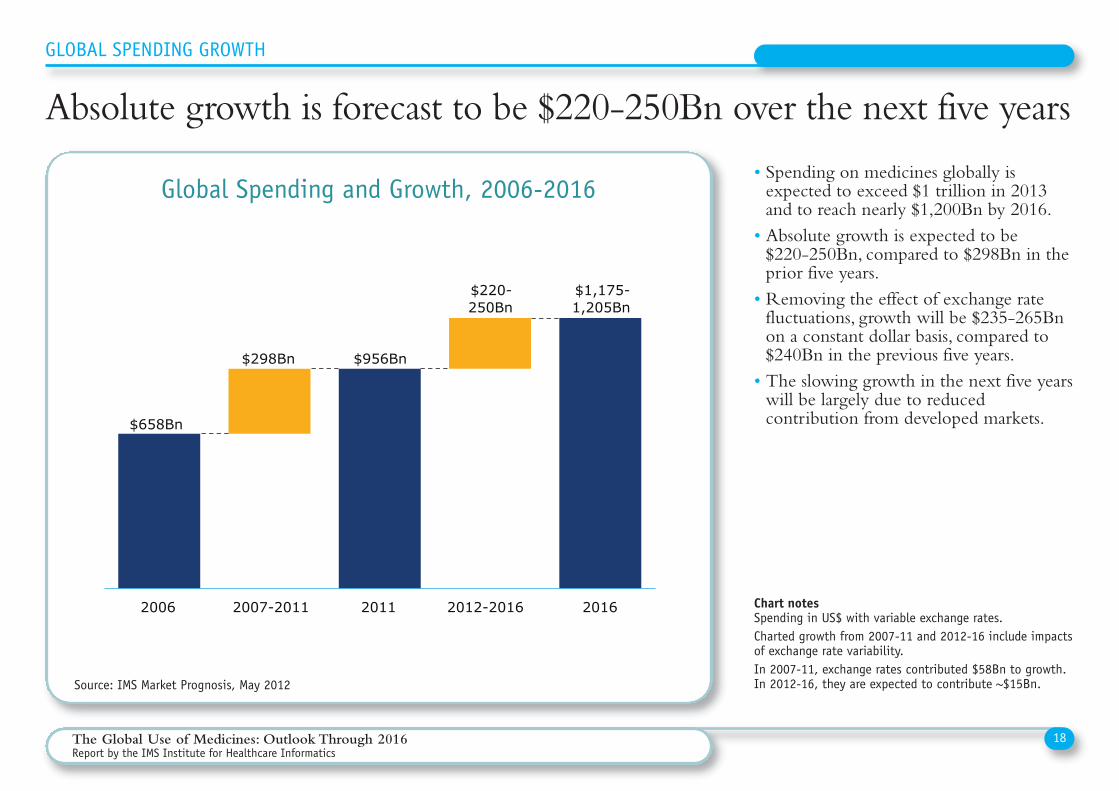
• Spending on medicines globally isexpected to exceed $1 trillion in 2013and to reach nearly $1,200Bn by 2016.• Absolute growth is expected to be $220-250Bn, compared to $298Bn in theprior five years.• Removing the effect of exchange ratefluctuations, growth will be $235-265Bnon a constant dollar basis, compared to$240Bn in the previous five years.• The slowing growth in the next five yearswill be largely due to reducedcontribution from developed markets.
Absolute growth is forecast to be $220-250Bn over the next five years
Global Spending and Growth, 2006-2016
Source: IMS Market Prognosis, May 2012
Chart notesSpending in US$ with variable exchange rates.Charted growth from 2007-11 and 2012-16 include impactsof exchange rate variability.In 2007-11, exchange rates contributed $58Bn to growth.In 2012-16, they are expected to contribute ~$15Bn.
18The Global Use of Medicines: Outlook Through 2016Report by the IMS Institute for Healthcare Informatics
GLOBAL SPENDING GROWTH
2006 2007-2011 2011 2012-2016 2016
$658Bn
$298Bn $956Bn
$220-250Bn
$1,175-1,205Bn
Growth is forecast to be $40-70Bn less than the last five years
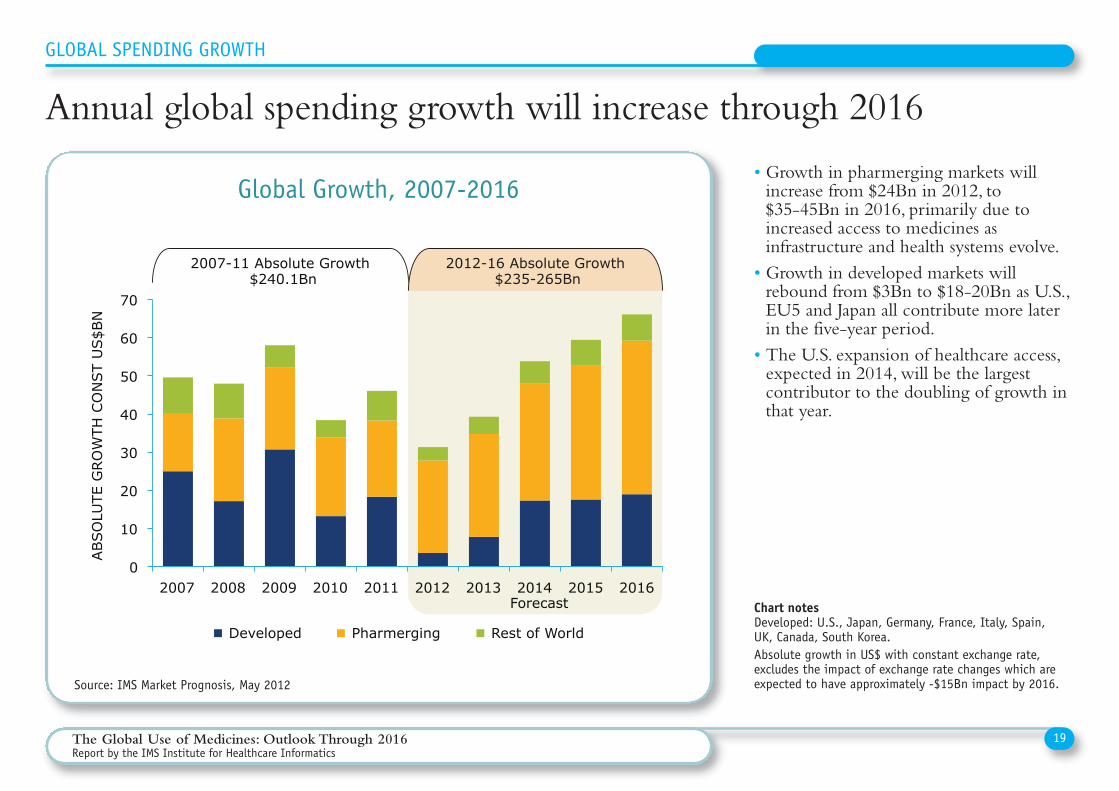
• Growth in pharmerging markets willincrease from $24Bn in 2012, to $35-45Bn in 2016, primarily due toincreased access to medicines asinfrastructure and health systems evolve.• Growth in developed markets willrebound from $3Bn to $18-20Bn as U.S.,EU5 and Japan all contribute more laterin the five-year period.• The U.S. expansion of healthcare access,expected in 2014, will be the largestcontributor to the doubling of growth inthat year.
Global Growth, 2007-2016
Source: IMS Market Prognosis, May 2012
Chart notesDeveloped: U.S., Japan, Germany, France, Italy, Spain, UK, Canada, South Korea.Absolute growth in US$ with constant exchange rate,excludes the impact of exchange rate changes which areexpected to have approximately -$15Bn impact by 2016.
19The Global Use of Medicines: Outlook Through 2016Report by the IMS Institute for Healthcare Informatics
GLOBAL SPENDING GROWTH
Annual global spending growth will increase through 2016
0
10
20
30
40
50
60
70
2007 2008 2009 2010 2011 2012 2013 2014 2015 2016
Developed Pharmerging Rest of World
ABSO
LUTE
GRO
WTH
CO
NST
US$B
N
Global spending growth will accelerate from $30 to $70Bn in 2016
2007-11 Absolute Growth $240.1Bn
2012-16 Absolute Growth $235-265Bn
Forecast
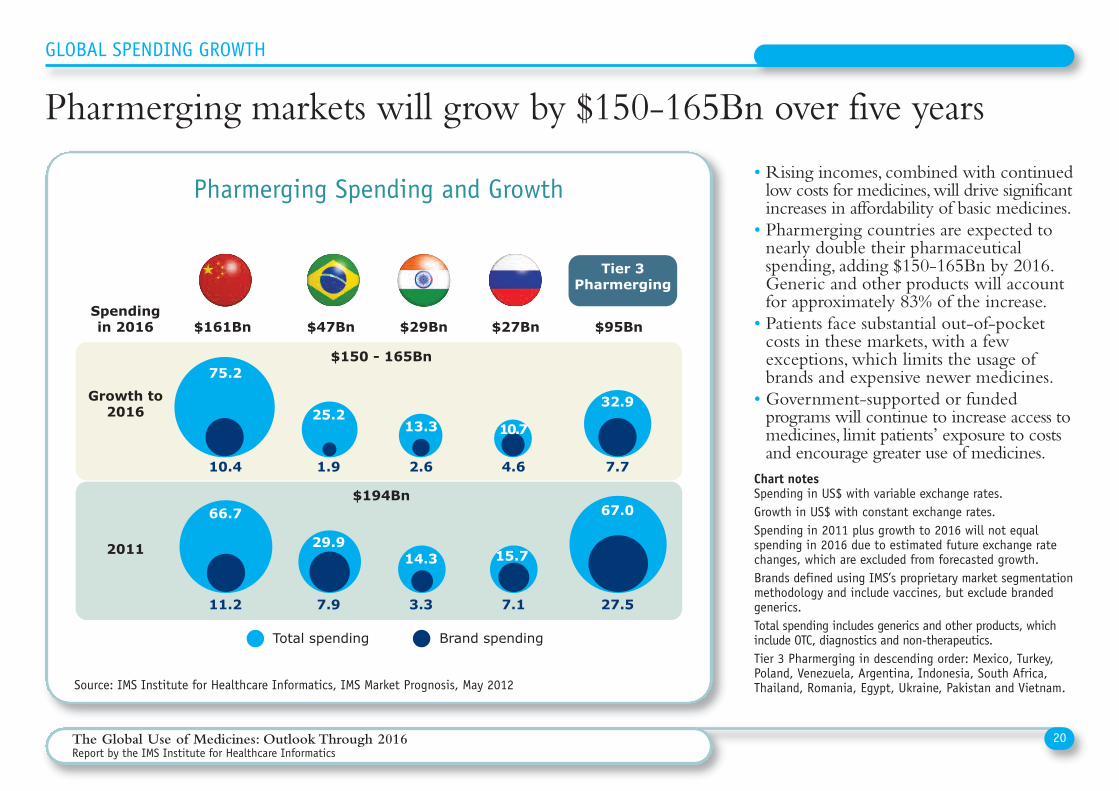
• Rising incomes, combined with continuedlow costs for medicines, will drive significantincreases in affordability of basic medicines.• Pharmerging countries are expected tonearly double their pharmaceuticalspending, adding $150-165Bn by 2016.Generic and other products will accountfor approximately 83% of the increase.• Patients face substantial out-of-pocketcosts in these markets, with a fewexceptions, which limits the usage ofbrands and expensive newer medicines.• Government-supported or fundedprograms will continue to increase access tomedicines, limit patients’ exposure to costsand encourage greater use of medicines.
Source: IMS Institute for Healthcare Informatics, IMS Market Prognosis, May 2012
Chart notesSpending in US$ with variable exchange rates.Growth in US$ with constant exchange rates.Spending in 2011 plus growth to 2016 will not equalspending in 2016 due to estimated future exchange ratechanges, which are excluded from forecasted growth.Brands defined using IMS’s proprietary market segmentationmethodology and include vaccines, but exclude brandedgenerics. Total spending includes generics and other products, whichinclude OTC, diagnostics and non-therapeutics.Tier 3 Pharmerging in descending order: Mexico, Turkey,Poland, Venezuela, Argentina, Indonesia, South Africa,Thailand, Romania, Egypt, Ukraine, Pakistan and Vietnam.
20The Global Use of Medicines: Outlook Through 2016Report by the IMS Institute for Healthcare Informatics
GLOBAL SPENDING GROWTH
Pharmerging markets will grow by $150-165Bn over five years
Pharmerging Spending and Growth
75.2
$150�-�165Bn
Growth�to2016
Spendingin�2016
Total spending Brand spending
Tier�3Pharmerging
$161Bn $47Bn $29Bn $27Bn $95Bn
2011
$194Bn
25.213.3 10.7
32.9
66.7
29.9
14.3 15.7
67.0
10.4 1.9 2.6 4.6 7.7
11.2 7.9 3.3 7.1 27.5
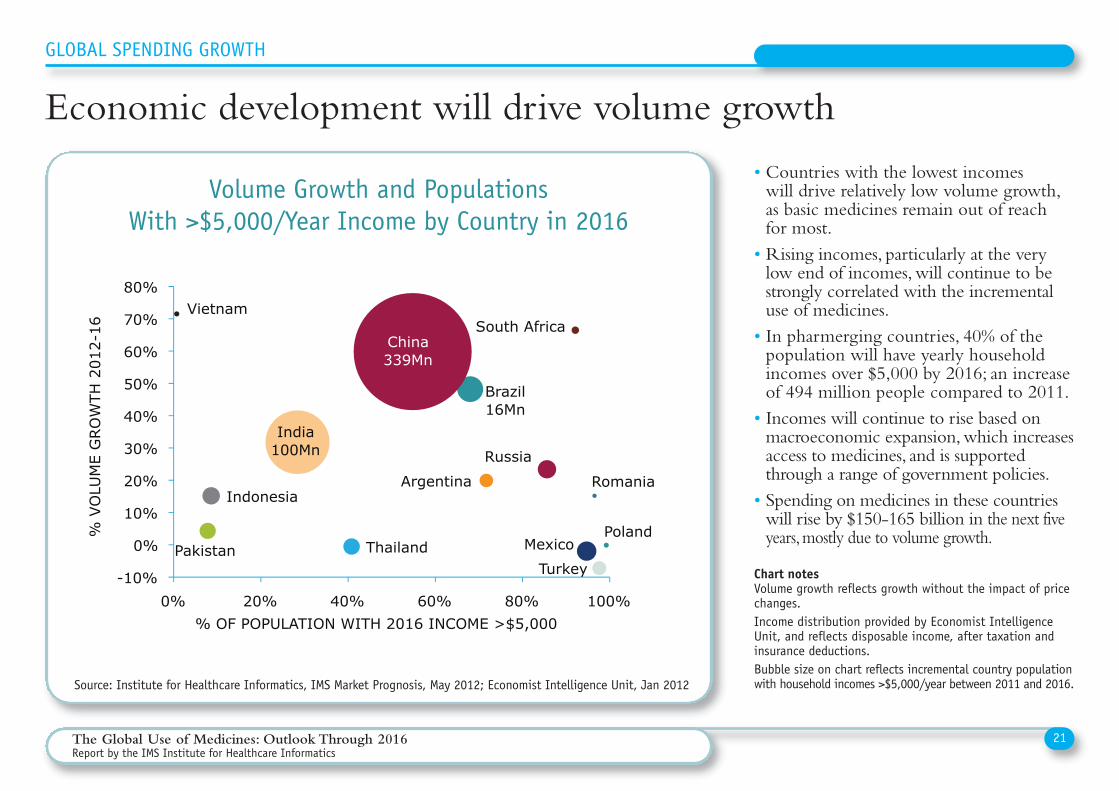
• Countries with the lowest incomes will drive relatively low volume growth,as basic medicines remain out of reach for most.• Rising incomes, particularly at the verylow end of incomes, will continue to bestrongly correlated with the incrementaluse of medicines.• In pharmerging countries, 40% of thepopulation will have yearly householdincomes over $5,000 by 2016; an increaseof 494 million people compared to 2011.• Incomes will continue to rise based onmacroeconomic expansion, which increasesaccess to medicines, and is supportedthrough a range of government policies.• Spending on medicines in these countrieswill rise by $150-165 billion in the next fiveyears, mostly due to volume growth.
Economic development will drive volume growth
Volume Growth and Populations With >$5,000/Year Income by Country in 2016
Chart notesVolume growth reflects growth without the impact of pricechanges.Income distribution provided by Economist IntelligenceUnit, and reflects disposable income, after taxation andinsurance deductions.Bubble size on chart reflects incremental country populationwith household incomes >$5,000/year between 2011 and 2016.
21The Global Use of Medicines: Outlook Through 2016Report by the IMS Institute for Healthcare Informatics
Source: Institute for Healthcare Informatics, IMS Market Prognosis, May 2012; Economist Intelligence Unit, Jan 2012
GLOBAL SPENDING GROWTH
Argentina
Brazil 16Mn
China 339Mn
India 100Mn
Indonesia
Mexico Pakistan Poland
Romania
Russia
South Africa
Thailand Turkey
Vietnam
-10%
0%
10%
20%
30%
40%
50%
60%
70%
80%
0% 20% 40% 60% 80% 100%
% V
OLU
ME
GRO
WTH
201
2-16
% OF POPULATION WITH 2016 INCOME >$5,000
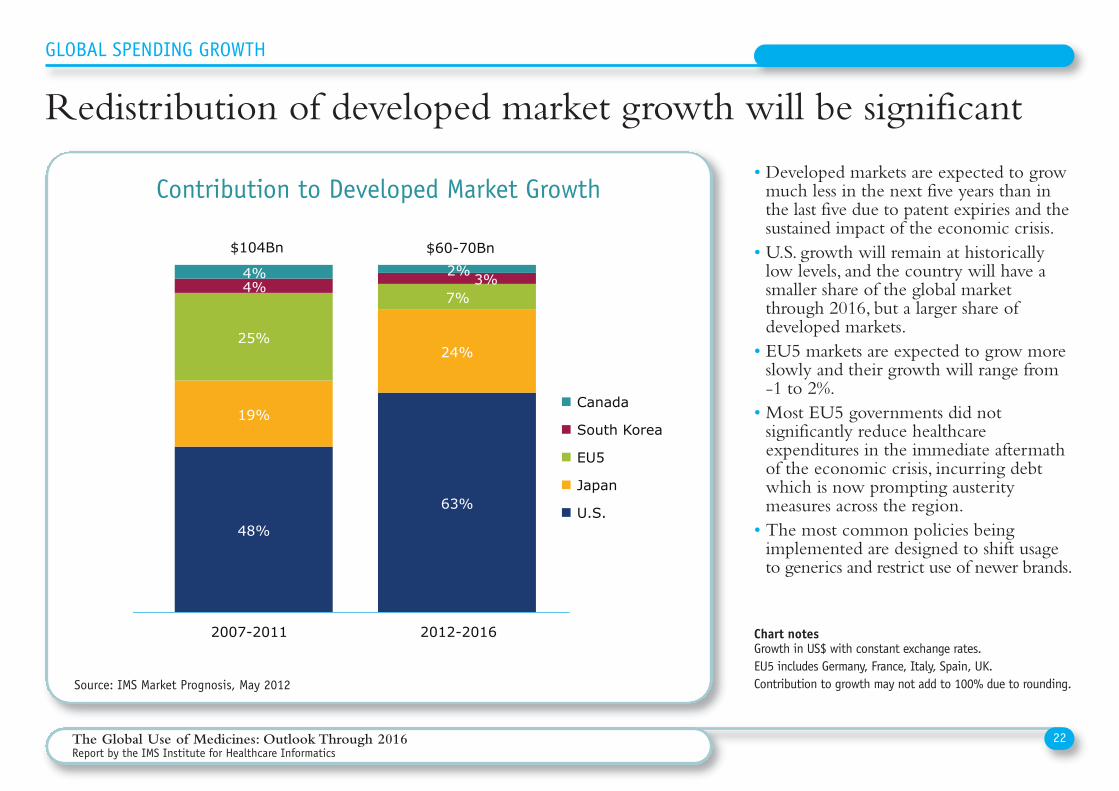
• Developed markets are expected to growmuch less in the next five years than inthe last five due to patent expiries and thesustained impact of the economic crisis.• U.S. growth will remain at historicallylow levels, and the country will have asmaller share of the global marketthrough 2016, but a larger share ofdeveloped markets.• EU5 markets are expected to grow moreslowly and their growth will range from -1 to 2%.• Most EU5 governments did notsignificantly reduce healthcareexpenditures in the immediate aftermathof the economic crisis, incurring debtwhich is now prompting austeritymeasures across the region.• The most common policies beingimplemented are designed to shift usageto generics and restrict use of newer brands.
Source: IMS Market Prognosis, May 2012
Chart notesGrowth in US$ with constant exchange rates.EU5 includes Germany, France, Italy, Spain, UK.Contribution to growth may not add to 100% due to rounding.
22The Global Use of Medicines: Outlook Through 2016Report by the IMS Institute for Healthcare Informatics
GLOBAL SPENDING GROWTH
Redistribution of developed market growth will be significant
Contribution to Developed Market Growth
48%
63%
19%
24% 25%
7% 4% 3% 4% 2%
2007-2011 2012-2016
Canada
South Korea
EU5
Japan
U.S.
Developed markets hampered by U.S. expiries and weak EU5
$104Bn $60-70Bn
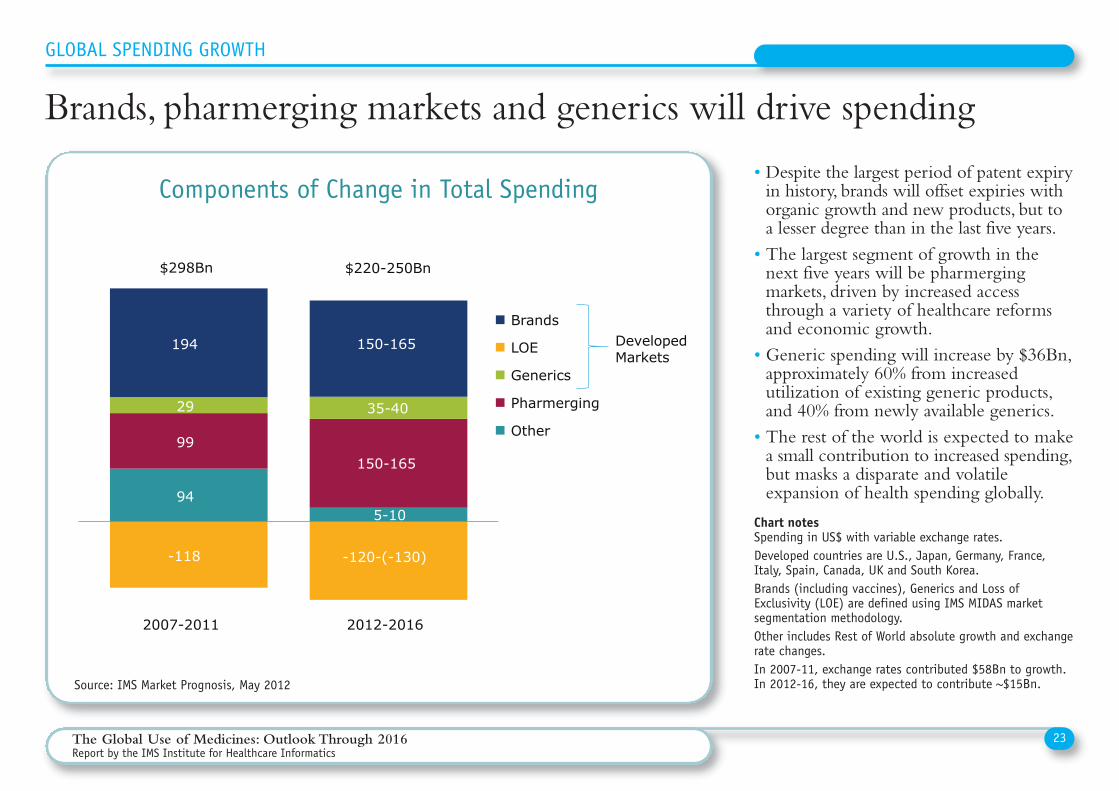
• Despite the largest period of patent expiryin history, brands will offset expiries withorganic growth and new products, but toa lesser degree than in the last five years.• The largest segment of growth in thenext five years will be pharmergingmarkets, driven by increased accessthrough a variety of healthcare reformsand economic growth.• Generic spending will increase by $36Bn,approximately 60% from increasedutilization of existing generic products,and 40% from newly available generics.• The rest of the world is expected to makea small contribution to increased spending,but masks a disparate and volatileexpansion of health spending globally.
Source: IMS Market Prognosis, May 2012
Chart notesSpending in US$ with variable exchange rates.Developed countries are U.S., Japan, Germany, France,Italy, Spain, Canada, UK and South Korea.Brands (including vaccines), Generics and Loss ofExclusivity (LOE) are defined using IMS MIDAS marketsegmentation methodology.Other includes Rest of World absolute growth and exchangerate changes.In 2007-11, exchange rates contributed $58Bn to growth.In 2012-16, they are expected to contribute ~$15Bn.
23The Global Use of Medicines: Outlook Through 2016Report by the IMS Institute for Healthcare Informatics
GLOBAL SPENDING GROWTH
Brands, pharmerging markets and generics will drive spending
Components of Change in Total Spending
945-10
99 150-165
29 35-40
-118 -120-(-130)
194 150-165
2007-2011 2012-2016
Brands
LOE
Generics
Pharmerging
Other
Brands, pharmerging markets and generics drive growth
$298Bn $220-250Bn
DevelopedMarkets
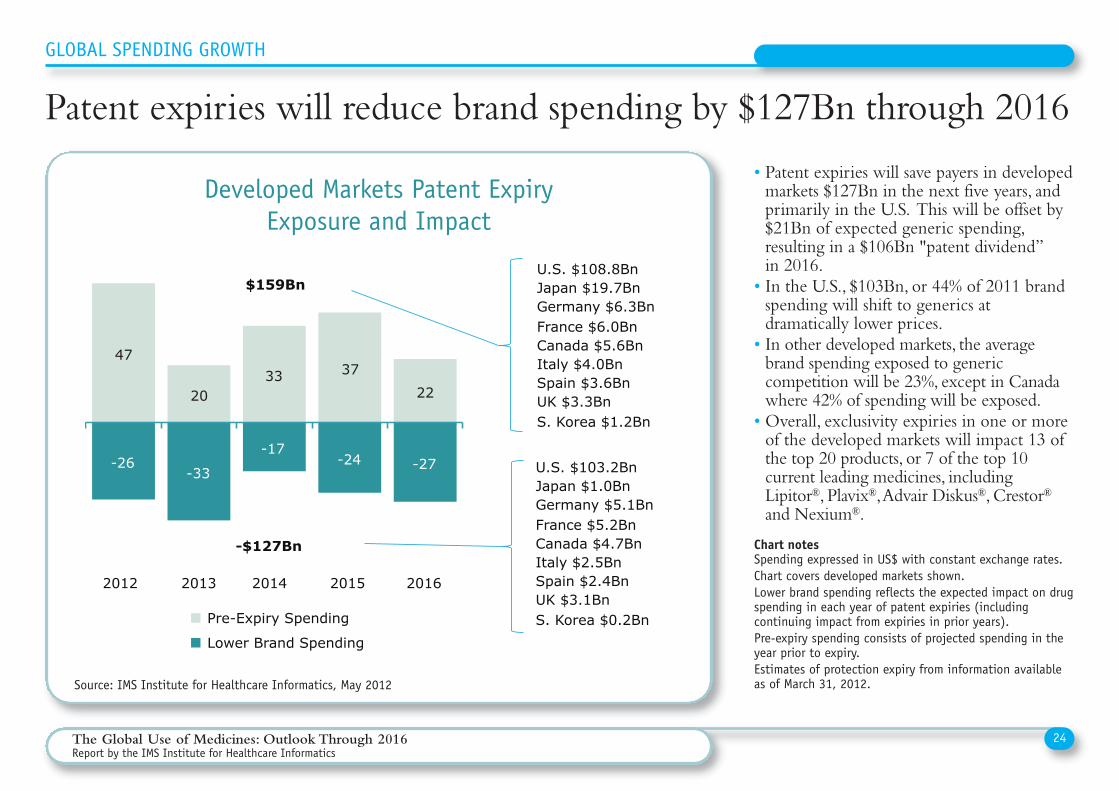
• Patent expiries will save payers in developedmarkets $127Bn in the next five years, andprimarily in the U.S. This will be offset by$21Bn of expected generic spending,resulting in a $106Bn "patent dividend” in 2016.• In the U.S., $103Bn, or 44% of 2011 brandspending will shift to generics atdramatically lower prices.• In other developed markets, the averagebrand spending exposed to genericcompetition will be 23%, except in Canadawhere 42% of spending will be exposed.• Overall, exclusivity expiries in one or moreof the developed markets will impact 13 ofthe top 20 products, or 7 of the top 10current leading medicines, includingLipitor®, Plavix®, Advair Diskus®, Crestor®and Nexium®.
Source: IMS Institute for Healthcare Informatics, May 2012
Chart notesSpending expressed in US$ with constant exchange rates.Chart covers developed markets shown.Lower brand spending reflects the expected impact on drugspending in each year of patent expiries (includingcontinuing impact from expiries in prior years).Pre-expiry spending consists of projected spending in theyear prior to expiry.Estimates of protection expiry from information availableas of March 31, 2012.
24The Global Use of Medicines: Outlook Through 2016Report by the IMS Institute for Healthcare Informatics
GLOBAL SPENDING GROWTH
Patent expiries will reduce brand spending by $127Bn through 2016
Developed Markets Patent ExpiryExposure and Impact
Patent expiries will reduce brand spending by $127Bn through 2016
47
20 33 37
22
-26 -33
-17 -24 -27
2012 2013 2014 2015 2016
Pre-Expiry Spending
Lower Brand Spending
$159Bn
-$127Bn
U.S. $108.8Bn Japan $19.7Bn Germany $6.3Bn France $6.0Bn Canada $5.6Bn Italy $4.0Bn Spain $3.6Bn UK $3.3Bn S. Korea $1.2Bn
U.S. $103.2Bn Japan $1.0Bn Germany $5.1Bn France $5.2Bn Canada $4.7Bn Italy $2.5Bn Spain $2.4Bn UK $3.1Bn S. Korea $0.2Bn
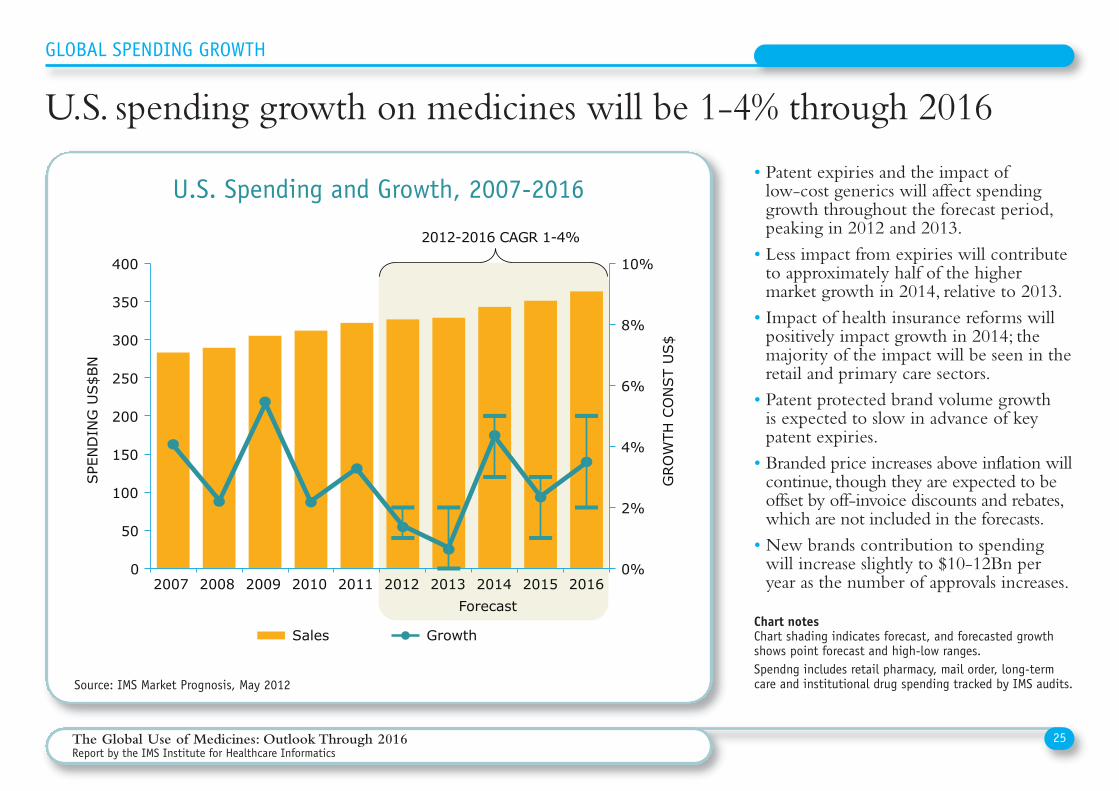
• Patent expiries and the impact of low-cost generics will affect spendinggrowth throughout the forecast period,peaking in 2012 and 2013.• Less impact from expiries will contributeto approximately half of the highermarket growth in 2014, relative to 2013.• Impact of health insurance reforms willpositively impact growth in 2014; themajority of the impact will be seen in theretail and primary care sectors.• Patent protected brand volume growth is expected to slow in advance of keypatent expiries.• Branded price increases above inflation willcontinue, though they are expected to beoffset by off-invoice discounts and rebates,which are not included in the forecasts.• New brands contribution to spendingwill increase slightly to $10-12Bn peryear as the number of approvals increases.
Source: IMS Market Prognosis, May 2012
Chart notesChart shading indicates forecast, and forecasted growthshows point forecast and high-low ranges.Spendng includes retail pharmacy, mail order, long-termcare and institutional drug spending tracked by IMS audits.
25The Global Use of Medicines: Outlook Through 2016Report by the IMS Institute for Healthcare Informatics
GLOBAL SPENDING GROWTH
U.S. spending growth on medicines will be 1-4% through 2016
U.S. Spending and Growth, 2007-2016
0%
2%
4%
6%
8%
10%
0
50
100
150
200
250
300
350
400
2007 2008 2009 2010 2011 2012 2013 2014 2015 2016
GRO
WTH
CO
NST
US$
SPE
ND
ING
US$B
N
Sales Growth
U.S. spending growth recovers after patent cliff in 2012/13
Forecast
2012-2016 CAGR 1-4%
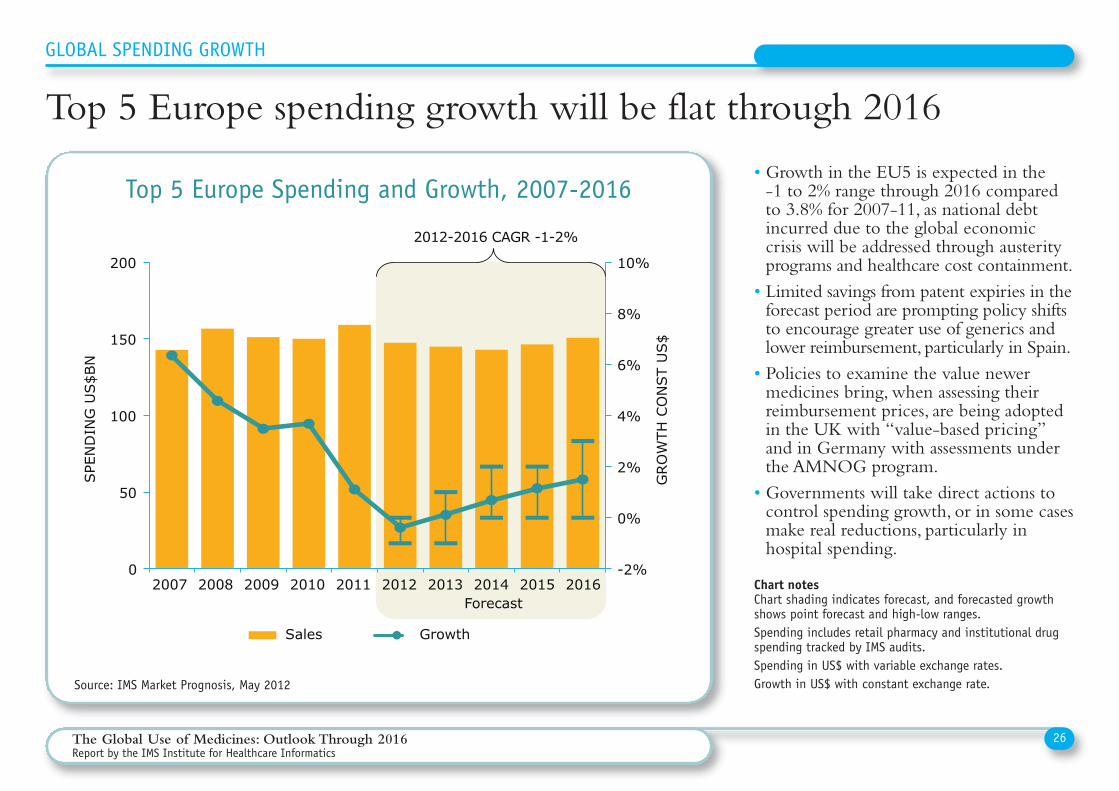
• Growth in the EU5 is expected in the -1 to 2% range through 2016 comparedto 3.8% for 2007-11, as national debtincurred due to the global economiccrisis will be addressed through austerityprograms and healthcare cost containment.• Limited savings from patent expiries in theforecast period are prompting policy shiftsto encourage greater use of generics andlower reimbursement, particularly in Spain.• Policies to examine the value newermedicines bring, when assessing theirreimbursement prices, are being adoptedin the UK with “value-based pricing”and in Germany with assessments underthe AMNOG program.• Governments will take direct actions tocontrol spending growth, or in some casesmake real reductions, particularly inhospital spending.
Source: IMS Market Prognosis, May 2012
Chart notesChart shading indicates forecast, and forecasted growthshows point forecast and high-low ranges.Spending includes retail pharmacy and institutional drugspending tracked by IMS audits.Spending in US$ with variable exchange rates. Growth in US$ with constant exchange rate.
26The Global Use of Medicines: Outlook Through 2016Report by the IMS Institute for Healthcare Informatics
GLOBAL SPENDING GROWTH
Top 5 Europe spending growth will be flat through 2016
Top 5 Europe Spending and Growth, 2007-2016
Top 5 Europe not expected to grow substantially in next five years
-2%
0%
2%
4%
6%
8%
10%
0
50
100
150
200
2007 2008 2009 2010 2011 2012 2013 2014 2015 2016
GRO
WTH
CO
NST
US$
SPE
ND
ING
US$B
N
Sales Growth
Forecast
2012-2016 CAGR -1-2%
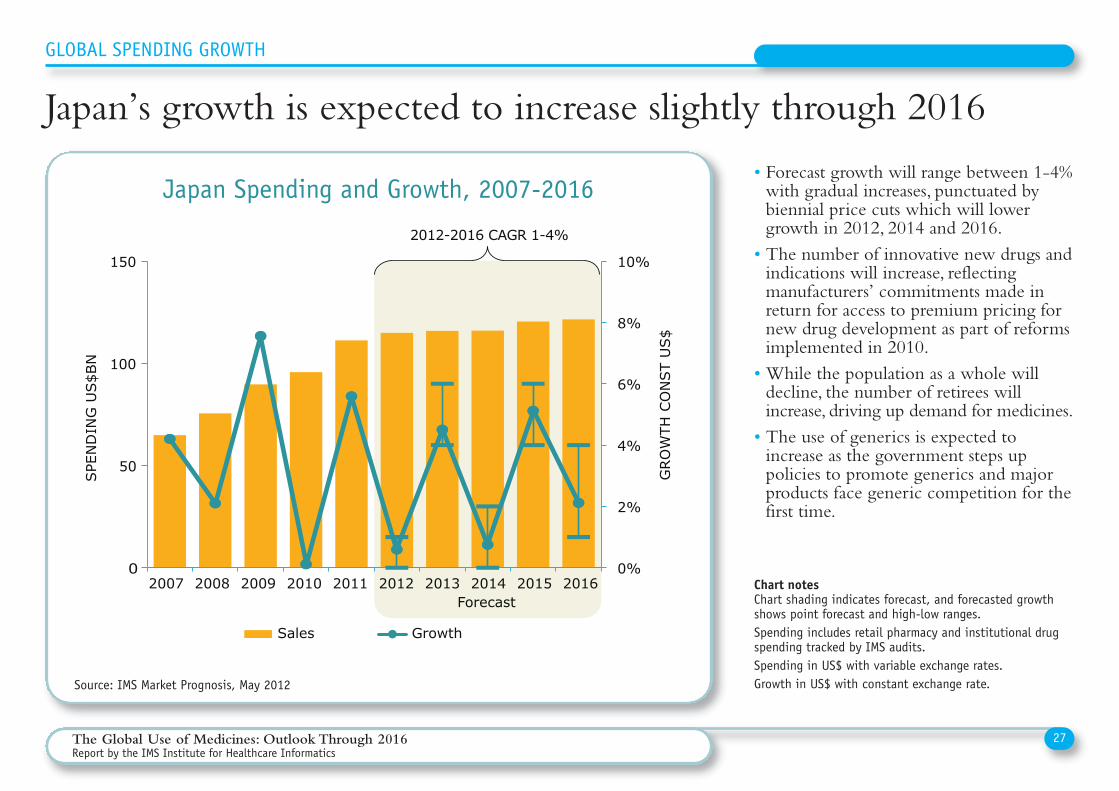
• Forecast growth will range between 1-4%with gradual increases, punctuated bybiennial price cuts which will lowergrowth in 2012, 2014 and 2016.• The number of innovative new drugs andindications will increase, reflectingmanufacturers’ commitments made inreturn for access to premium pricing fornew drug development as part of reformsimplemented in 2010.• While the population as a whole willdecline, the number of retirees willincrease, driving up demand for medicines.• The use of generics is expected toincrease as the government steps uppolicies to promote generics and majorproducts face generic competition for thefirst time.
Source: IMS Market Prognosis, May 2012
Chart notesChart shading indicates forecast, and forecasted growthshows point forecast and high-low ranges.Spending includes retail pharmacy and institutional drugspending tracked by IMS audits.Spending in US$ with variable exchange rates. Growth in US$ with constant exchange rate.
27The Global Use of Medicines: Outlook Through 2016Report by the IMS Institute for Healthcare Informatics
GLOBAL SPENDING GROWTH
Japan’s growth is expected to increase slightly through 2016
Japan Spending and Growth, 2007-2016
Japan’s growth is expected to improve over the next five years
Forecast
0%
2%
4%
6%
8%
10%
0
50
100
150
2007 2008 2009 2010 2011 2012 2013 2014 2015 2016
GRO
WTH
CO
NST
US$
SPE
ND
ING
US$B
N
Sales Growth
2012-2016 CAGR 1-4%
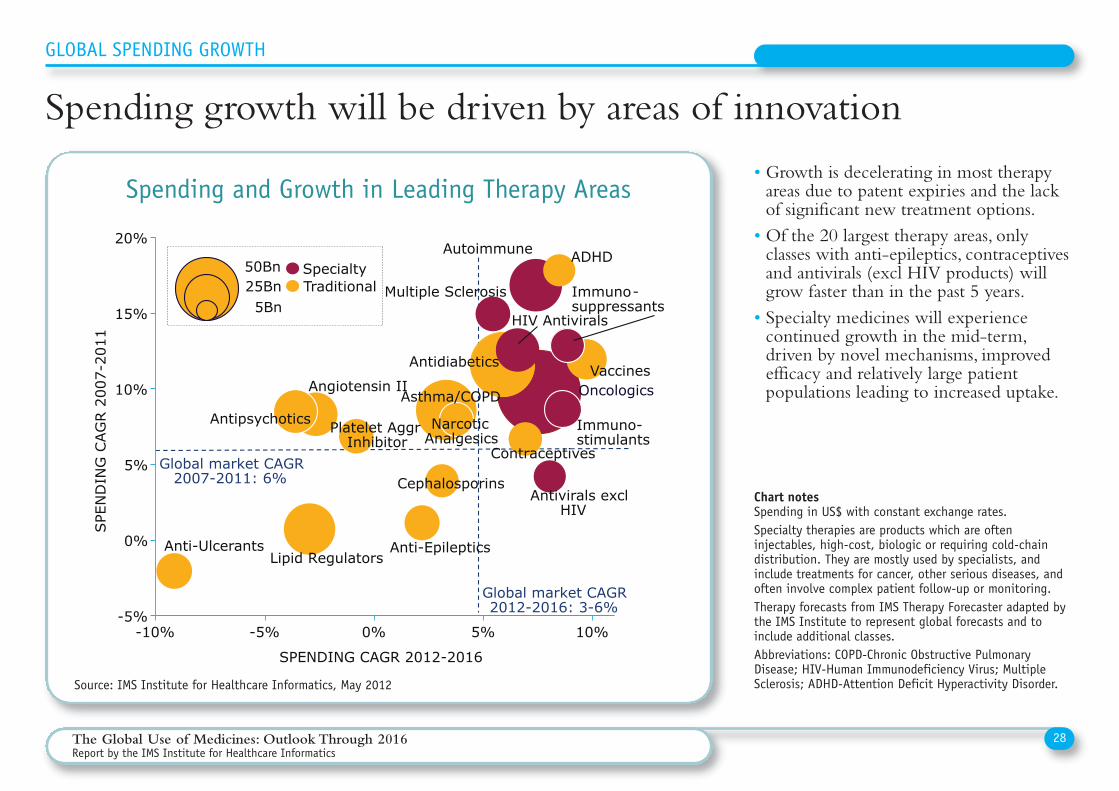
• Growth is decelerating in most therapyareas due to patent expiries and the lackof significant new treatment options.• Of the 20 largest therapy areas, onlyclasses with anti-epileptics, contraceptivesand antivirals (excl HIV products) willgrow faster than in the past 5 years.• Specialty medicines will experiencecontinued growth in the mid-term,driven by novel mechanisms, improvedefficacy and relatively large patientpopulations leading to increased uptake.
Source: IMS Institute for Healthcare Informatics, May 2012
Chart notesSpending in US$ with constant exchange rates. Specialty therapies are products which are ofteninjectables, high-cost, biologic or requiring cold-chaindistribution. They are mostly used by specialists, andinclude treatments for cancer, other serious diseases, andoften involve complex patient follow-up or monitoring.Therapy forecasts from IMS Therapy Forecaster adapted bythe IMS Institute to represent global forecasts and toinclude additional classes.Abbreviations: COPD-Chronic Obstructive PulmonaryDisease; HIV-Human Immunodeficiency Virus; MultipleSclerosis; ADHD-Attention Deficit Hyperactivity Disorder.
28The Global Use of Medicines: Outlook Through 2016Report by the IMS Institute for Healthcare Informatics
GLOBAL SPENDING GROWTH
Spending growth will be driven by areas of innovation
Spending and Growth in Leading Therapy Areas
Global market CAGR 2007-2011: 6%
Global market CAGR 2012-2016: 3-6%
Oncologics
Antidiabetics
Asthma/COPD
Autoimmune
Lipid Regulators
Angiotensin II
HIV Antivirals
Antipsychotics
Vaccines
Anti-Ulcerants Anti-Epileptics
Multiple Sclerosis
Platelet Aggr Inhibitor
Narcotic Analgesics
Contraceptives
Cephalosporins Antivirals excl
HIV
ADHD 50Bn
5Bn 25Bn
-5%
0%
5%
10%
15%
20%
-10% -5% 0% 5% 10%
SPE
ND
ING
CAG
R 2
007-
2011
SPENDING CAGR 2012-2016
Spending growth driven by areas with the most innovation
Specialty Traditional
Immuno-stimulants
Immuno- suppressants
Definitions and conventions:• This report is based on the IMS products and servicesdetailed in the panel to the right and the research ofthe IMS Institute for Healthcare Informatics.
• Spending is reported at ex-manufacturer prices anddoes not reflect off-invoice discounts and rebates.
• Values are converted from local currencies to US$using variable exchange rates, except where noted.
• Growth is calculated using US$ at constant (Q4 2011) exchange rates.
• Products are categorized as brands, generics or otherusing IMS’s proprietary MIDAS™ marketsegmentation methodology.
• Developed markets are defined as the U.S., Japan, Top5 Europe countries (Germany, France, Italy, Spain,UK), Canada and South Korea.
• Pharmerging countries are defined as those with>$1Bn absolute spending growth over 2012-16 andwhich have GDP per capita of less than $25,000 atpurchasing power parity (PPP). Tier 1: China; Tier 2:Brazil, India, Russia; Tier 3: Mexico, Turkey, Poland,Venezuela, Argentina, Indonesia, South Africa,Thailand, Romania, Egypt, Ukraine, Pakistan and Vietnam.
NOTES ON SOURCES
IMS Market Prognosis™ is a comprehensive,strategic market forecasting publication thatprovides insight to decision makers about theeconomic and political issues which can affectspending on healthcare globally. It useseconometric modeling from the EconomistIntelligence Unit to deliver in-depth analysis ata global, regional and country level abouttherapy class dynamics, distribution channelchanges and brand vs generic product spending.
IMS MIDAS™ is a unique data platform forassessing worldwide healthcare markets. Itintegrates IMS national audits into a globallyconsistent view of the pharmaceutical market,tracking virtually every product in hundreds oftherapeutic classes and providing estimatedproduct volumes, trends and market sharethrough retail and non-retail channels. MIDASdata is updated monthly and retains 12 years of history.
IMS LifeCycle™R&D Focus™ is a globaldatabase for evaluating the market for medicines,covering more than 31,000 drugs in R&D andover 8,900 drugs in active developmentworldwide. It includes information about thecommercial, scientific and clinical features of theproducts, analyst predications of futureperformance, and reference information on theirregulatory stage globally.
IMS LifeCycle™New Product Focus™ is acomprehensive worldwide tracking service ofhistorical product launches since 1982. Itincludes information about product launches ineach country, including the indication andprice at the time of the initial launch, andcovers more than 300,000 launches.
IMS PharmaQuery™ is an online research tooldesigned to unravel the complexities of pricingand reimbursement in 31 key world markets. Itprovides detailed information on the rules andregulations, theories and practices, trends anddevelopments, in pricing and reimbursement inboth developed and emerging markets.
IMS Therapy Forecaster™ includes sales andvolume forecasts for major therapy areas in 10key markets, and includes interactive modelingand event-based forecasts and comprehensivemarket summaries.
29The Global Use of Medicines: Outlook Through 2016Report by the IMS Institute for Healthcare Informatics
30The Global Use of Medicines: Outlook Through 2016Report by the IMS Institute for Healthcare Informatics
APPENDIX 1
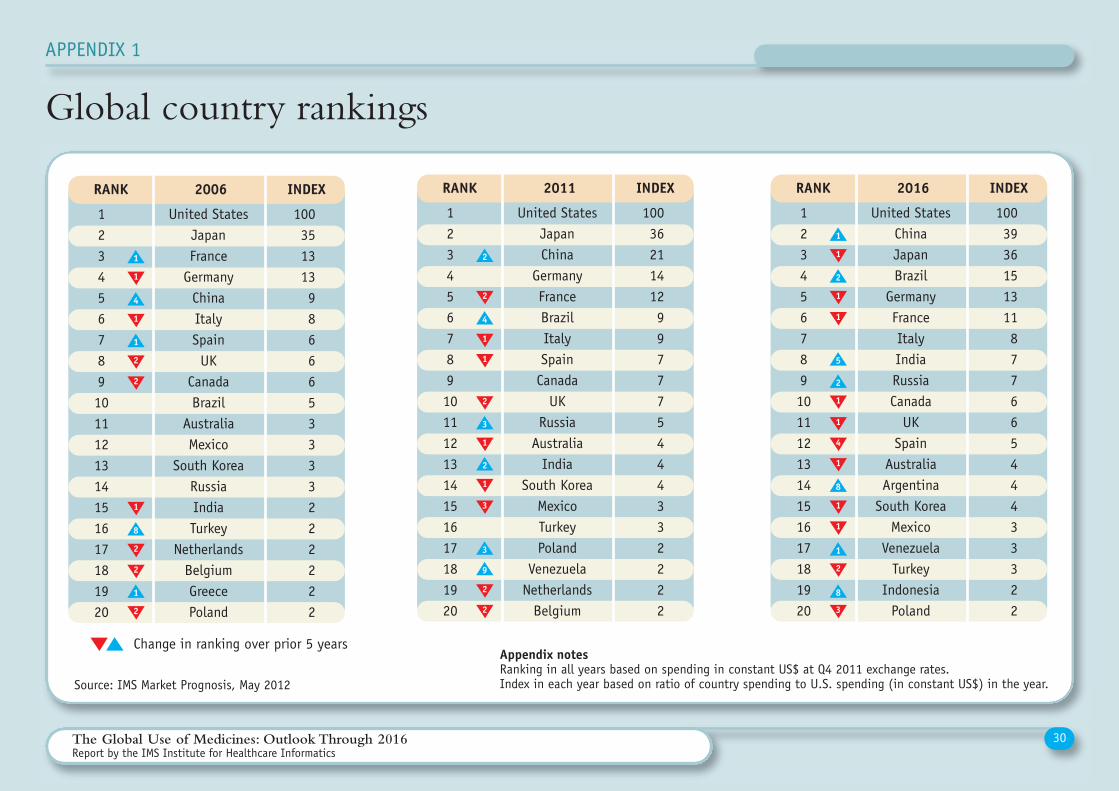
Global country rankings
Source: IMS Market Prognosis, May 2012
RANK 2006 INDEX
1234567891011121314151617181920
1003513139866653333222222
United StatesJapanFrance
GermanyChinaItalySpainUK
CanadaBrazil
AustraliaMexico
South KoreaRussiaIndiaTurkey
NetherlandsBelgiumGreecePoland
1
1
4
1
1
2
1
8
2
1
2
2
2
RANK 2011 INDEX
1234567891011121314151617181920
10036211412997775444332222
United StatesJapanChina
Germany FranceBrazilItalySpainCanada
UKRussia
AustraliaIndia
South KoreaMexicoTurkeyPoland
VenezuelaNetherlandsBelgium
2
3
1
2
1
3
1
2
9
3
2
2
2
1
RANK 2016 INDEX
1234567891011121314151617181920
100393615131187766544433322
United StatesChina JapanBrazil
Germany FranceItalyIndia Russia Canada
UK Spain
AustraliaArgentina
South KoreaMexico
VenezuelaTurkey
IndonesiaPoland
1
1
2
1
5
2
1
1
1
8
1
8
3
2
1
1
4
1
Change in ranking over prior 5 yearsAppendix notesRanking in all years based on spending in constant US$ at Q4 2011 exchange rates. Index in each year based on ratio of country spending to U.S. spending (in constant US$) in the year.
4
APPENDIX 2
31The Global Use of Medicines: Outlook Through 2016Report by the IMS Institute for Healthcare Informatics
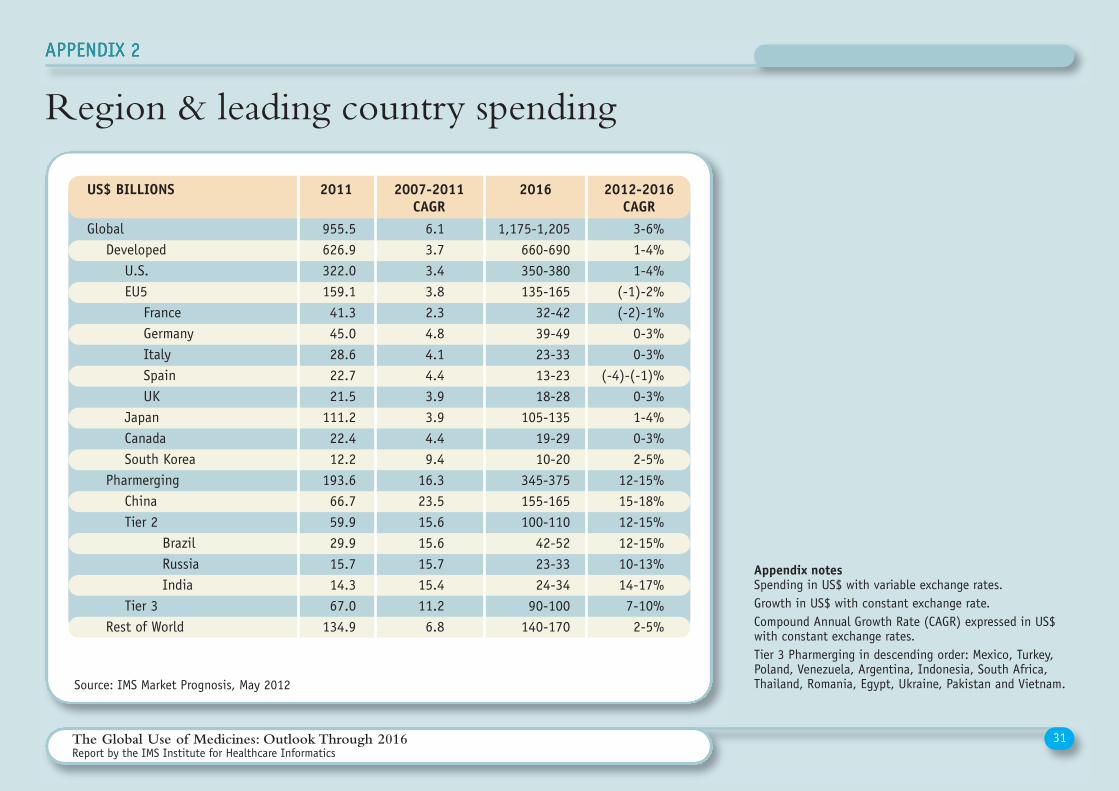
Region & leading country spending
Appendix notesSpending in US$ with variable exchange rates. Growth in US$ with constant exchange rate.Compound Annual Growth Rate (CAGR) expressed in US$with constant exchange rates.Tier 3 Pharmerging in descending order: Mexico, Turkey,Poland, Venezuela, Argentina, Indonesia, South Africa,Thailand, Romania, Egypt, Ukraine, Pakistan and Vietnam.Source: IMS Market Prognosis, May 2012
US$ BILLIONS 2011 2007-2011CAGR
2016 2012-2016CAGR
GlobalDeveloped
U.S.EU5
FranceGermanyItalySpainUK
JapanCanadaSouth Korea
PharmergingChinaTier 2
BrazilRussiaIndia
Tier 3Rest of World
6.13.73.43.82.34.84.14.43.93.94.49.4
16.323.515.615.615.715.411.26.8
1,175-1,205660-690350-380135-165
32-4239-4923-3313-2318-28
105-13519-2910-20
345-375155-165100-110
42-5223-3324-34
90-100140-170
3-6%1-4%1-4%
(-1)-2%(-2)-1%
0-3%0-3%
(-4)-(-1)%0-3%1-4%0-3%2-5%
12-15%15-18%12-15%12-15%10-13%14-17%7-10%2-5%
955.5626.9322.0159.141.345.028.622.721.5
111.222.412.2
193.666.759.929.915.714.367.0
134.9
32The Global Use of Medicines: Outlook Through 2016Report by the IMS Institute for Healthcare Informatics
APPENDIX 3
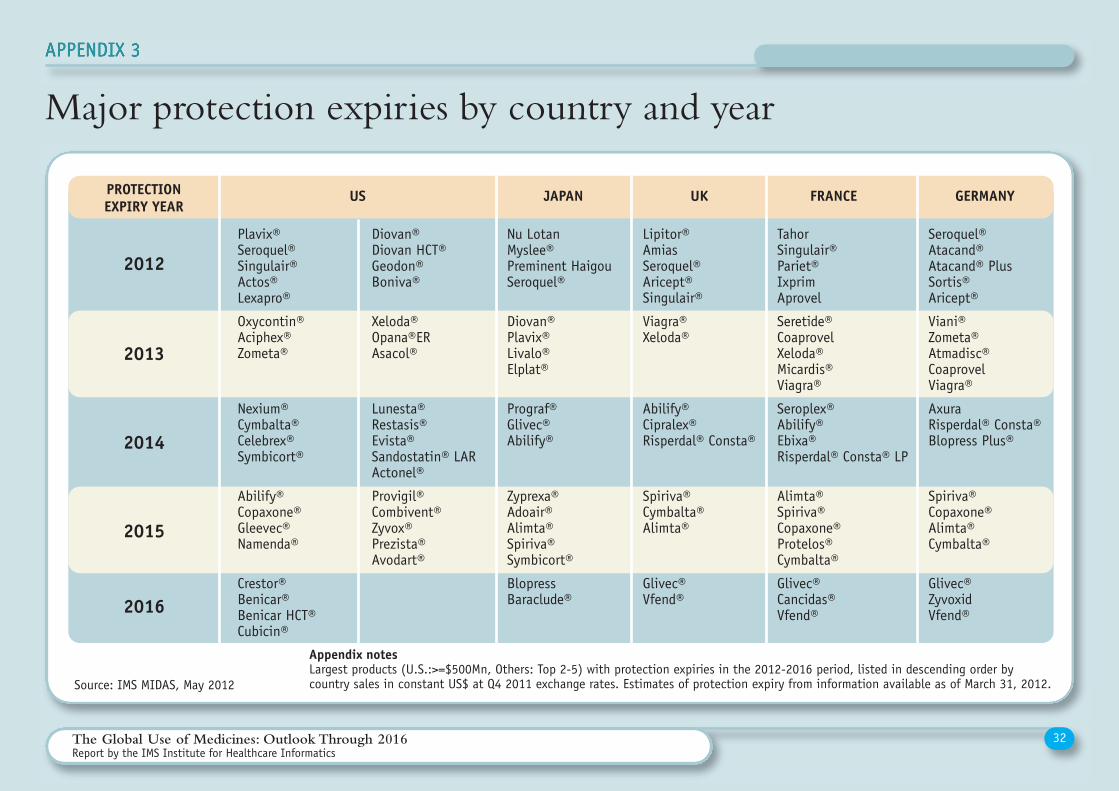
Major protection expiries by country and year
Appendix notesLargest products (U.S.:>=$500Mn, Others: Top 2-5) with protection expiries in the 2012-2016 period, listed in descending order bycountry sales in constant US$ at Q4 2011 exchange rates. Estimates of protection expiry from information available as of March 31, 2012.Source: IMS MIDAS, May 2012
GERMANY
Seroquel®Atacand® Atacand® PlusSortis®Aricept®
Viani®Zometa®Atmadisc®CoaprovelViagra®
AxuraRisperdal® Consta®Blopress Plus®
Spiriva®Copaxone® Alimta®Cymbalta®
Glivec®ZyvoxidVfend®
FRANCE
TahorSingulair®Pariet®IxprimAprovel
Seretide®CoaprovelXeloda®Micardis®Viagra®
Seroplex®Abilify®Ebixa®Risperdal® Consta® LP
Alimta®Spiriva®Copaxone®Protelos®Cymbalta®
Glivec®Cancidas®Vfend®
UK
Lipitor®AmiasSeroquel®Aricept®Singulair®
Viagra®Xeloda®
Abilify®Cipralex®Risperdal® Consta®
Spiriva®Cymbalta®Alimta®
Glivec®Vfend®
JAPAN
Nu LotanMyslee®Preminent HaigouSeroquel®
Diovan®Plavix®Livalo®Elplat®
Prograf®Glivec®Abilify®
Zyprexa®Adoair®Alimta®Spiriva®Symbicort®
BlopressBaraclude®
US
Diovan®Diovan HCT®Geodon®Boniva®
Xeloda®Opana®ERAsacol®
Lunesta®Restasis®Evista®Sandostatin® LARActonel®
Provigil®Combivent®Zyvox®Prezista®Avodart®
Plavix®Seroquel®Singulair®Actos®Lexapro®
Oxycontin®Aciphex®Zometa®
Nexium®Cymbalta®Celebrex®Symbicort®
Abilify®Copaxone®Gleevec®Namenda®
Crestor®Benicar®Benicar HCT®Cubicin®
PROTECTIONEXPIRY YEAR
2012
2013
2014
2015
2016
The Global Use of Medicines: Outlook Through 2016Report by the IMS Institute for Healthcare Informatics
About the InstituteThe IMS Institute for Healthcare Informatics leveragescollaborative relationships in the public and privatesectors to strengthen the vital role of information inadvancing healthcare globally. Its mission is to providekey policy setters and decision makers in the globalhealth sector with unique and transformational insightsinto healthcare dynamics derived from granular analysisof information.
Fulfilling an essential need within healthcare, theInstitute delivers objective, relevant insights and researchthat accelerate understanding and innovation critical tosound decision making and improved patient care.
With access to IMS’s extensive global data assets andanalytics, the Institute works in tandem with a broad setof healthcare stakeholders, including governmentagencies, academic institutions, the life sciences industryand payers, to drive a research agenda dedicated toaddressing today’s healthcare challenges.
By collaborating on research of common interest, itbuilds on a long-standing and extensive tradition ofusing IMS information and expertise to support theadvancement of evidence-based healthcare around theworld.
GUIDING PRINCIPLES
The Institute operates from a set of Guiding Principles:
The advancement of healthcare globally is a vital, continuous process.
Timely, high-quality and relevantinformation is critical to sound healthcaredecision making.
Insights gained from information andanalysis should be made widely available tohealthcare stakeholders.
Effective use of information is oftencomplex, requiring unique knowledge and expertise.
The ongoing innovation and reform in allaspects of healthcare require a dynamicapproach to understanding the entirehealthcare system.
Personal health information is confidentialand patient privacy must be protected.
The private sector has a valuable role toplay in collaborating with the public sectorrelated to the use of healthcare data.
R ESEARCH AGENDA
The research agenda for the Institute centerson five areas considered vital to theadvancement of healthcare globally:
Demonstrating the effective use ofinformation by healthcare stakeholdersglobally to improve health outcomes, reducecosts and increase access to available treatments.
Optimizing the performance of medical carethrough better understanding of diseasecauses, treatment consequences and measuresto improve quality and cost of healthcaredelivered to patients.
Understanding the future global role forbiopharmaceuticals, the dynamics that shapethe market and implications for manufacturers,public and private payers, providers, patients,pharmacists and distributors.
Researching the role of innovation in healthsystem products, processes and deliverysystems, and the business and policy systemsthat drive innovation.
Informing and advancing the healthcareagendas in developing nations throughinformation and analysis.
IMS Institute for Healthcare Informatics11 Waterview BoulevardParsippany, NJ 07054USA
www.theimsinstitute.org
IMS Health is a leading provider of information, services and technology for the healthcare industry around the world. With a presence in 100+ countries and morethan 55 years of industry experience, IMS helps stakeholders across healthcare - providers, payers, governments, pharmaceutical manufacturers, researchers and others - access the right insights, make smarter decisions and operate more efficiently. For more information go to www.imshealth.com. The IMS Institute for Healthcare Informatics is a research-driven entity of IMS that works with healthcare stakeholders across academia and in the public and privatesectors to advance healthcare globally.
Related Documents