Your Information Provider - - Independent, Unbiased, Authoritative - - Since 1958 Febr 6, 2017 © www.oilworld.de there somebody to pick me up tomorrow at the airport Global Oil Supply, Demand and Price Outlook With Special Emphasis on Palm Oil POTS Iran on 6 Febr 2017 Thomas Mielke, ISTA Mielke, Oil World, Global Market Research on Oilseeds, Oils and Meals Please feel free to contact me for assistance at <[email protected]>

Welcome message from author
This document is posted to help you gain knowledge. Please leave a comment to let me know what you think about it! Share it to your friends and learn new things together.
Transcript

Your Information Provider - - Independent, Unbiased, Authoritative - - Since 1958 Febr 6, 2017
© www.oilworld.de
there somebody to pick me up tomorrow at the airport
Global Oil Supply, Demand and Price Outlook
With Special Emphasis on Palm Oil
POTS Iran on 6 Febr 2017
Thomas Mielke, ISTA Mielke, Oil World,
Global Market Research on Oilseeds, Oils and Meals
Please feel free to contact me for assistance at <[email protected]>
Your Information Provider - - Independent, Unbiased, Authoritative - - Since 1958 Febr 6, 2017
© www.oilworld.de
there somebody to pick me up tomorrow at the airport
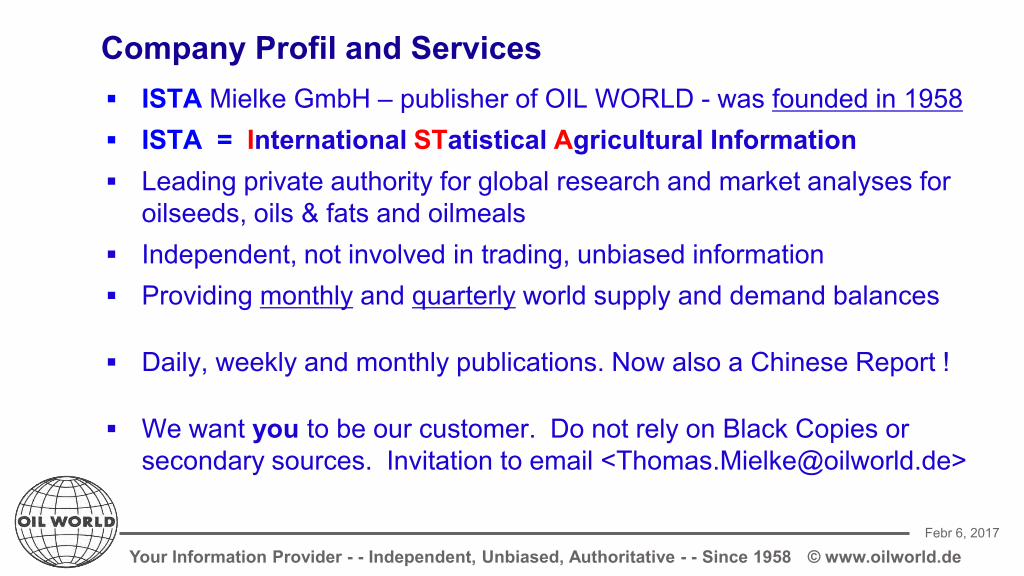
ISTA Mielke GmbH – publisher of OIL WORLD - was founded in 1958 ISTA = International STatistical Agricultural Information Leading private authority for global research and market analyses for
oilseeds, oils & fats and oilmeals Independent, not involved in trading, unbiased information Providing monthly and quarterly world supply and demand balances
Daily, weekly and monthly publications. Now also a Chinese Report !
We want you to be our customer. Do not rely on Black Copies or secondary sources. Invitation to email <[email protected]>
Company Profil and Services

Your Information Provider - - Independent, Unbiased, Authoritative - - Since 1958 Febr 6, 2017
© www.oilworld.de
Monthly Prices from Jan 1973 until Jan 2017 '74 '76 '78 '80 '82 '84 '86 '88 '90 '92 '94 '96 '98 '00 '02 '04 '06 '08 '10 '12 '14 '16
0
200
400
600
800
1000
1200
1400
1600
Palm oil crudeRape oil
cif Rotterdam in US-$ / MTMonthly Prices of 2 Oils
Palm oil is the Price Leader for Oils and Fats Worldwide
Your Information Provider - - Independent, Unbiased, Authoritative - - Since 1958 Febr 6, 2017
© www.oilworld.de
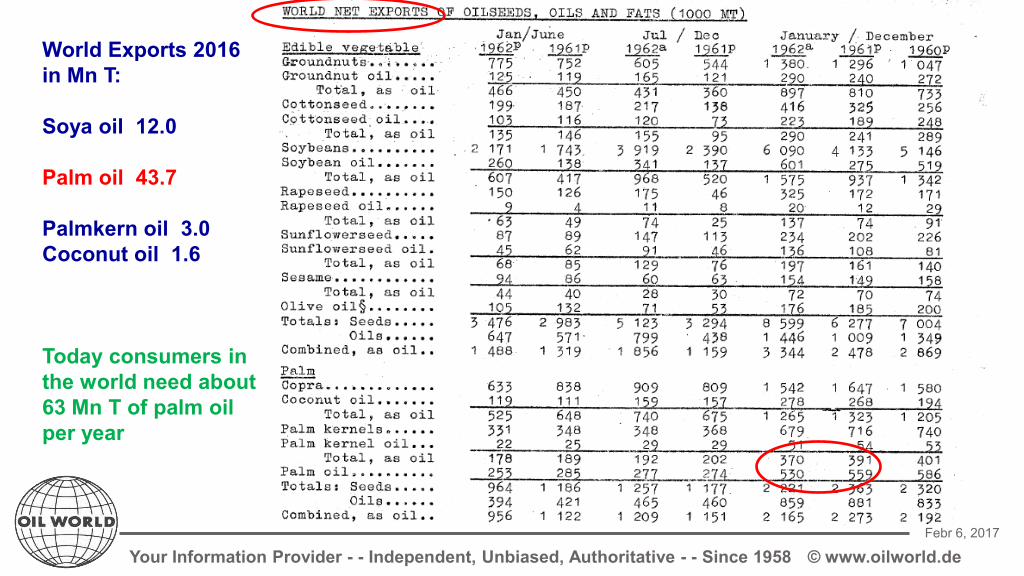
World Exports 2016 in Mn T: Soya oil 12.0 Palm oil 43.7 Palmkern oil 3.0 Coconut oil 1.6 Today consumers in the world need about 63 Mn T of palm oil per year
Your Information Provider - - Independent, Unbiased, Authoritative - - Since 1958 Febr 6, 2017
© www.oilworld.de
January 2014 until Jan 20171
2
3
4
5
6
7
8
9
10
11
12
1
2
3
4
5
6
7
8
9
10
11
12
1
2
3
4
5
6
7
8
9
10
11
12
1
400
500
600
700
800
900
1000
1100 S B O D u t c h
S un o i l E U
R ape o i l D u t c h
C P O c i f R ' dam
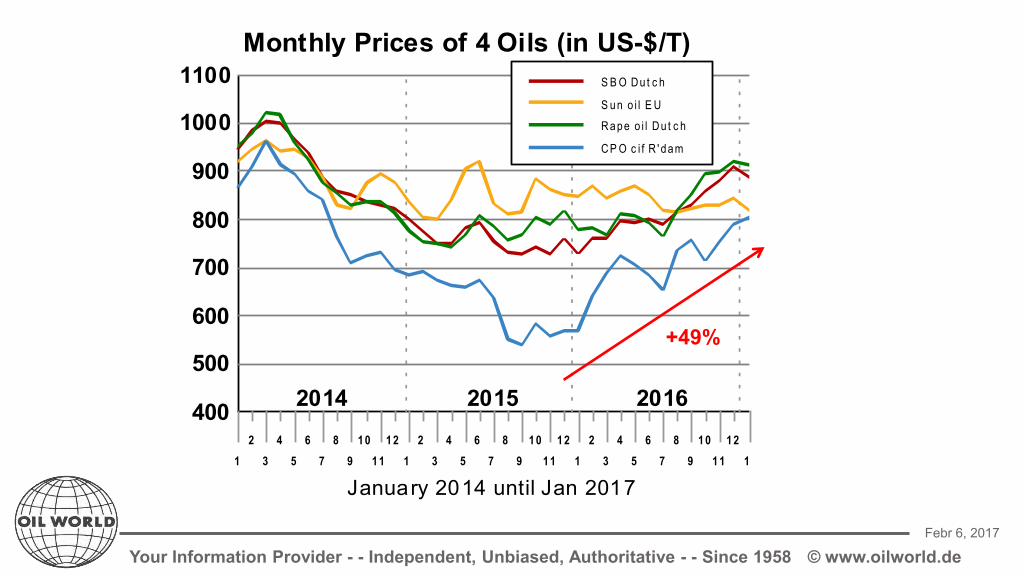
Monthly Prices of 4 Oils (in US-$/T)
2014 2015 2016
+49%

Your Information Provider - - Independent, Unbiased, Authoritative - - Since 1958 Febr 6, 2017
© www.oilworld.de
C P O , fo b Ind o .P al m s tea rin , fo b M al .
S oya oil , A rg .S un oi l, B la ck Se a
R a pe o il, R ott .P al m k. oil , R o tt .
300
500
700
900
1100
1300
1500
Oct/Jan 15/16Oct/Jan 16/17
(in US-$ per tonne)PRICES: Changes from a Year Ago
+39%
+14%
-3%+50%
+84%
+19%
Prices from 1 April 2016 until 3 Feb 2017Apr May Jun Jly Aug Sep Oct Nov Dec Jan
220023002400250026002700280029003000310032003300
First position in Malaysian Ringgit/TMALAYSIA: Crude Palm Oil Futures Close

Your Information Provider - - Independent, Unbiased, Authoritative - - Since 1958 Febr 6, 2017
© www.oilworld.de
95/96 98/99 01/02 04/05 07/08 10/11 13/14 16/17F0
10
20
30
40
50
60
7017 OILS & FATS : World Production (Mn T)
Sun oil
Rape oil
Soya oil
Palm oil
9 Other oils
4 Animal Fats

Your Information Provider - - Independent, Unbiased, Authoritative - - Since 1958 Febr 6, 2017
© www.oilworld.de
01/02 04/05 07/08 10/11 13/14 16/17F0
5
10
15
20
25
30
35
40
45
50Soy, Rape, Sun Oils4 Animal FatsPalm Oil 9 Other
17 OILS & FATS : World Exports (Mn T)
Your Information Provider - - Independent, Unbiased, Authoritative - - Since 1958 Febr 6, 2017
© www.oilworld.de
there somebody to pick me up tomorrow at the airport
95/96 98/99 01/02 04/05 07/08 10/11 13/14 16/17F0
5
10
15
20
25
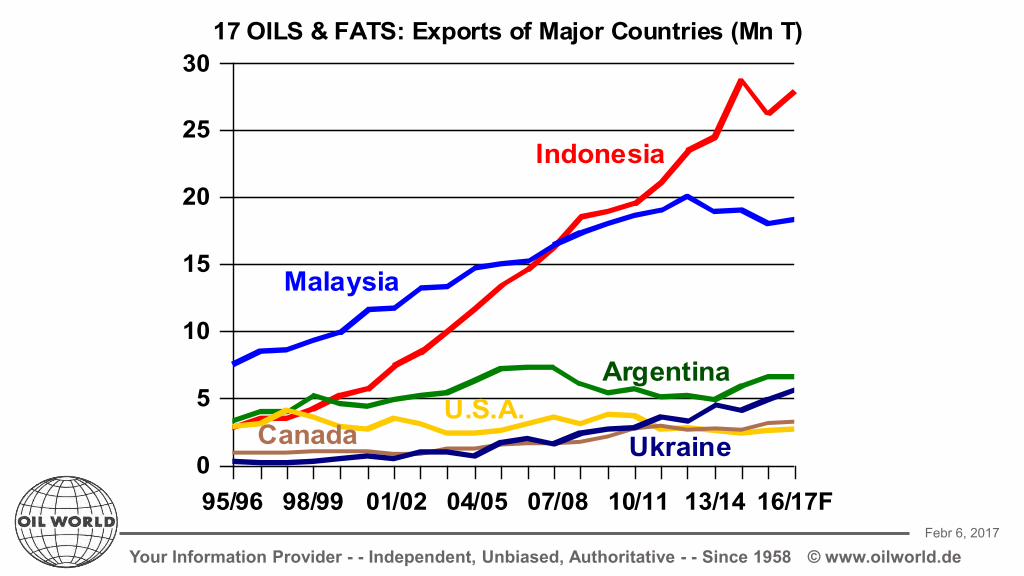
3017 OILS & FATS: Exports of Major Countries (Mn T)
Indonesia
ArgentinaU.S.A.
Canada Ukraine
Malaysia

Your Information Provider - - Independent, Unbiased, Authoritative - - Since 1958 Febr 6, 2017
© www.oilworld.de
(a) Palm oil, soya oil, sunflower oil & rapeseed oil 02/03
03/04
04/05
05/06
06/07
07/08
08/09
09/10
10/11
11/12
12/13
13/14
14/15
15/16
16/17F
-3-2-1012345
Palm Oil 4 Oils (a)10y-avg. Palm Oil 10y-avg. 4 Oils
Change from year ago4 Major Oils : World Exports (Mn T)
Below-average growth in palm oil exports means also much below-normal increase in total veg. oil exports
Your Information Provider - - Independent, Unbiased, Authoritative - - Since 1958 Febr 6, 2017
© www.oilworld.de
00/01 02/03 04/05 06/07 08/09 10/11 12/13 14/15 16/17
0
10
20
30
40
50
60
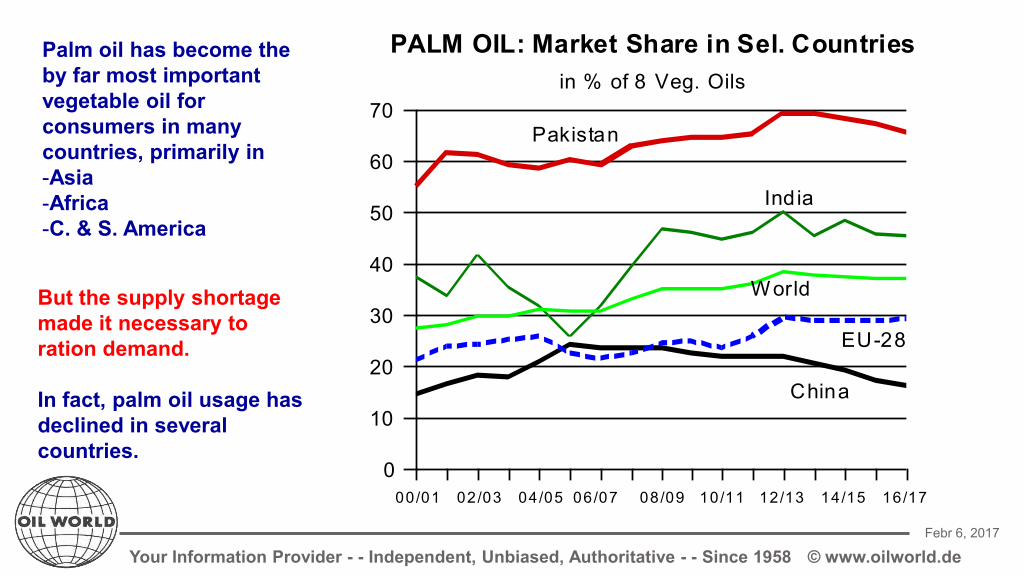
70in % of 8 Veg. Oils
PALM OIL: Market Share in Sel. Countries
Pakistan
EU-28
India
China
WorldBut the supply shortage made it necessary to ration demand. In fact, palm oil usage has declined in several countries.
Palm oil has become the by far most important vegetable oil for consumers in many countries, primarily in -Asia -Africa -C. & S. America
Your Information Provider - - Independent, Unbiased, Authoritative - - Since 1958 Febr 6, 2017
© www.oilworld.de
19801982
19841986
19881990
19921994
19961998
20002002
20042006
20082010
20122014
2016
0
10
20
30
40
50
60
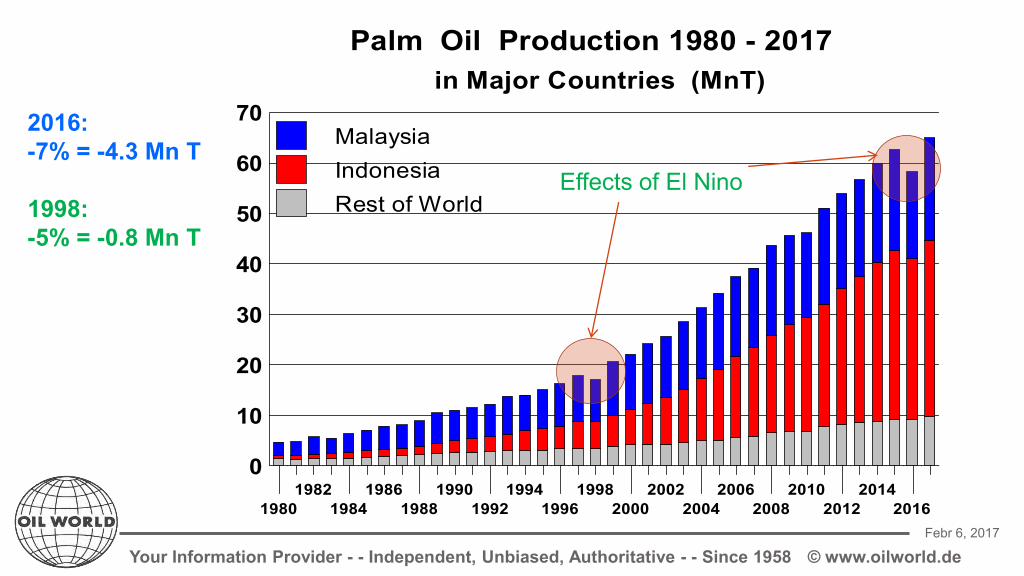
70MalaysiaIndonesiaRest of World
in Major Countries (MnT) Palm Oil Production 1980 - 2017
Effects of El Nino
2016: -7% = -4.3 Mn T 1998: -5% = -0.8 Mn T
Your Information Provider - - Independent, Unbiased, Authoritative - - Since 1958 Febr 6, 2017
© www.oilworld.de
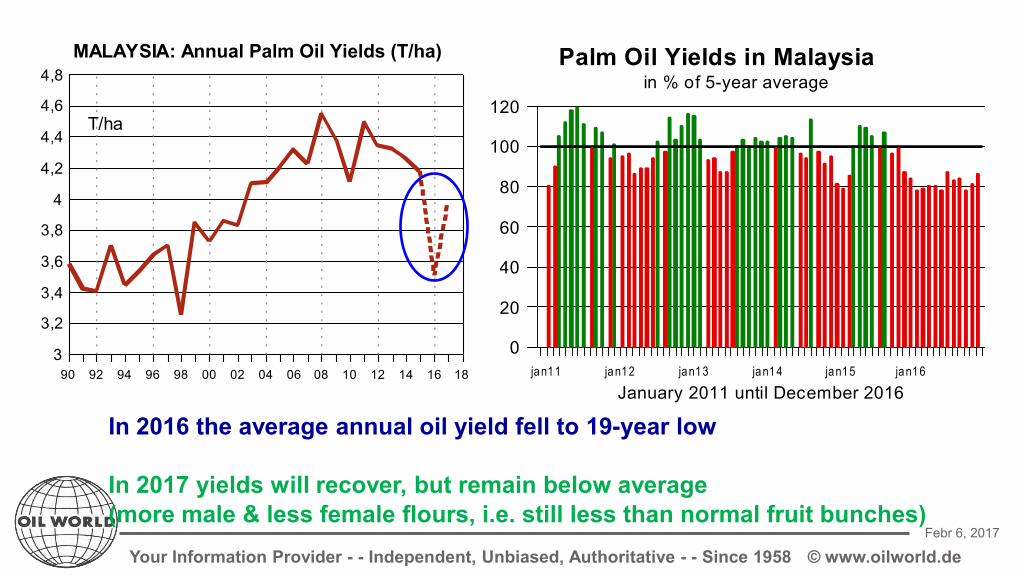
In 2016 the average annual oil yield fell to 19-year low In 2017 yields will recover, but remain below average (more male & less female flours, i.e. still less than normal fruit bunches)
90 92 94 96 98 00 02 04 06 08 10 12 14 16 183
3,2
3,4
3,6
3,8
4
4,2
4,4
4,6
4,8MALAYSIA: Annual Palm Oil Yields (T/ha)
T/ha
January 2011 until December 2016ja n1 1 ja n1 2 ja n1 3 ja n1 4 ja n1 5 ja n1 6
0
20
40
60
80
100
120in % of 5-year average
Palm Oil Yields in Malaysia

Your Information Provider - - Independent, Unbiased, Authoritative - - Since 1958 Febr 6, 2017
© www.oilworld.de ..
O c t o b e r / S e p t e m b e r12/13 13/14 14/15 15/16
-4-3-2-101234
Palm Oil Soya OilSun Oil Rape Oil
Change on Year in Mn T
World Production of 4 Major Oils
O c t o b e r / S e p t e m b e r 06/07
07/08 08/09
09/10 10/11
11/1212/13
13/1414/15
15/16-4
-2
0
24
6
8
10
12Production
Change From Year Ago in Mn T8 Veg. OILS: World Production
Unusual setback of production in 2015/16 …
…declines in palm oil & rapeseed oil could not be compensated
Your Information Provider - - Independent, Unbiased, Authoritative - - Since 1958 Febr 6, 2017
© www.oilworld.de
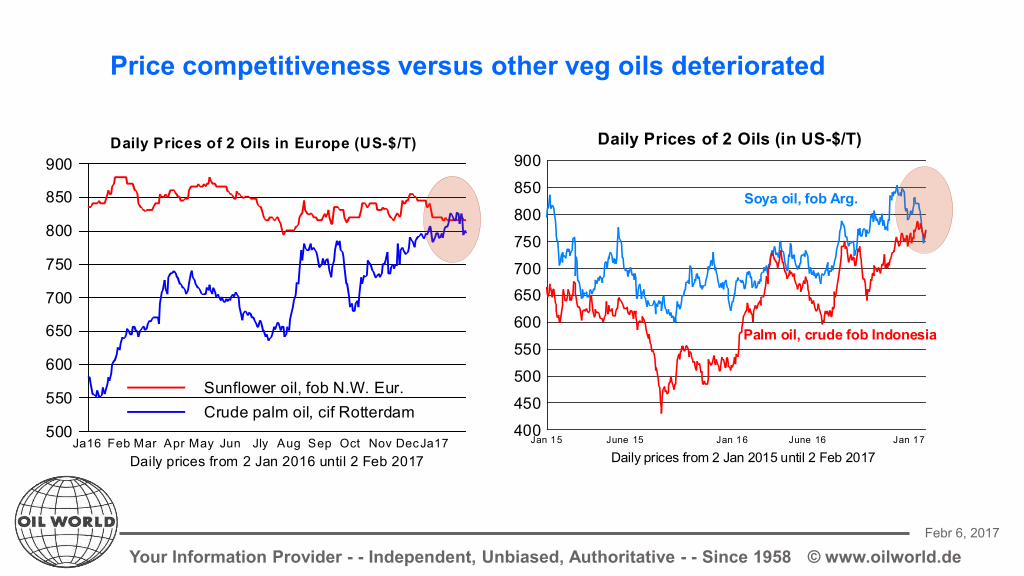
Daily prices from 2 Jan 2015 until 2 Feb 2017Jan 15 June 15 Jan 16 June 16 Jan 17
400
450
500
550
600
650700
750
800
850
900Daily Prices of 2 Oils (in US-$/T)
Palm oil, crude fob Indonesia
Soya oil, fob Arg.
Daily prices from 2 Jan 2016 until 2 Feb 2017Ja16 Feb Mar Apr May Jun Jly Aug Sep Oct Nov DecJa17
500
550
600
650
700
750
800
850
900
Sunflower oil, fob N.W. Eur.Crude palm oil, cif Rotterdam
Daily Prices of 2 Oils in Europe (US-$/T)
Price competitiveness versus other veg oils deteriorated
Your Information Provider - - Independent, Unbiased, Authoritative - - Since 1958 Febr 6, 2017
© www.oilworld.de
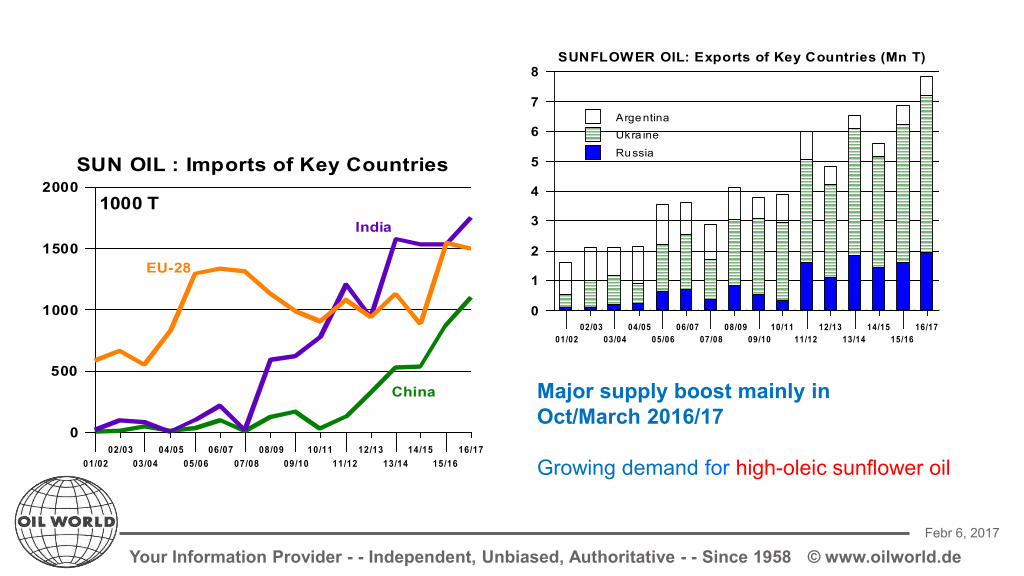
01/02
02/03
03/04
04/05
05/06
06/07
07/08
08/09
09/10
10/11
11/12
12/13
13/14
14/15
15/16
16/17
0
1
2
3
4
5
6
7
8
ArgentinaUkra ine
Russia
SUNFLOWER OIL: Exports of Key Countries (Mn T)
Major supply boost mainly in Oct/March 2016/17 Growing demand for high-oleic sunflower oil
01/02
02/03
03/04
04/05
05/06
06/07
07/08
08/09
09/10
10/11
11/12
12/13
13/14
14/15
15/16
16/17
0
500
1000
1500
2000SUN OIL : Imports of Key Countries
China
India1000 T
EU-28

Your Information Provider - - Independent, Unbiased, Authoritative - - Since 1958 Febr 6, 2017
© www.oilworld.de
Monthly prices from Jan 2003 until Jan 2017
Ja03 Ja05 Ja07 Ja09 Ja11 Ja13 Ja15 Ja170
150
300
450
600
750
900
1050
1200
1350
Crude mineral oilPalm oil, crude
Monthly Prices of Palm Oil & Crude Mineral Oil (US-$/T)
Annual average premiums/discounts from 2003 until 2016
20 03 20 04 20 05 20 06 20 07 20 08 20 09 20 10 20 11 20 12 20 13 20 14 20 15 20 16
-100-50
050
100150200250300350400450
nearest forward shipment
Annual Price Premiums Palm Oil vs Crude Mineral Oil (US-$/T)
Palm oil developed large premium versus energy prices

Your Information Provider - - Independent, Unbiased, Authoritative - - Since 1958 Febr 6, 2017
© www.oilworld.de ..
O c t o b e r / S e p t e m b e r12/13 13/14 14/15 15/16 16/17
-4
-2
0
2
4
6
Palm Oil Soya OilSun Oil Rape Oil
Change on Year in Mn T
World Production of 4 Major Oils
O c t o b e r / S e p t e m b e r 06/07
07/08 08/09
09/10 10/11
11/1212/13
13/1414/15
15/1616/17
-4
-2
0
2
4
6
8
10
12Produc tion
Change From Year Ago in Mn T8 Veg. OILS: World Production
Steep increase in production in 2016/17…
… extremely low stocks (-5.4 Mn) decisively curb supply and demand growth in 2016/17
Your Information Provider - - Independent, Unbiased, Authoritative - - Since 1958 Febr 6, 2017
© www.oilworld.de
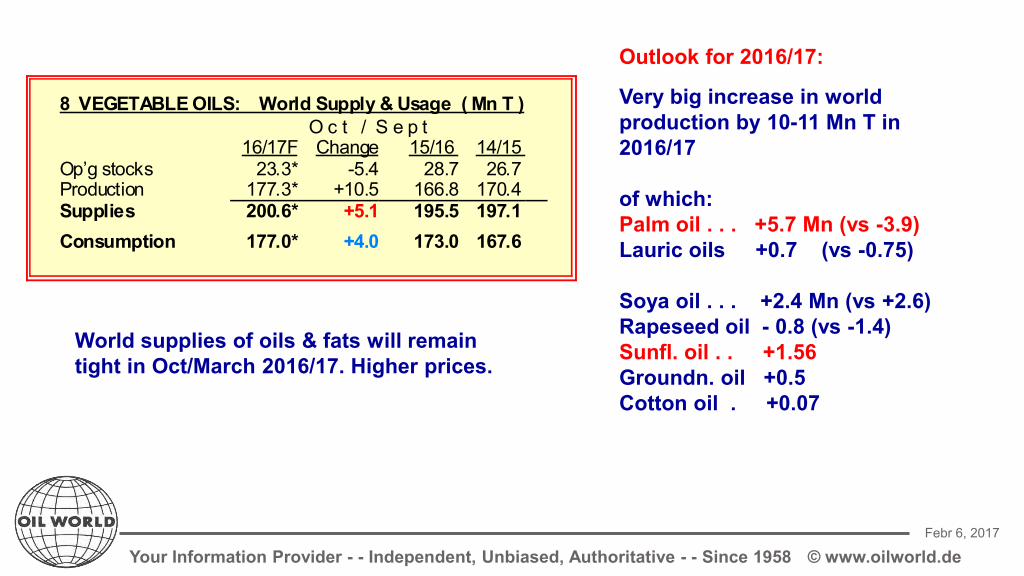
Outlook for 2016/17:
Very big increase in world production by 10-11 Mn T in 2016/17 of which: Palm oil . . . +5.7 Mn (vs -3.9) Lauric oils +0.7 (vs -0.75) Soya oil . . . +2.4 Mn (vs +2.6) Rapeseed oil - 0.8 (vs -1.4) Sunfl. oil . . +1.56 Groundn. oil +0.5 Cotton oil . +0.07
World supplies of oils & fats will remain tight in Oct/March 2016/17. Higher prices.
8 VEGETABLE OILS: World Supply & Usage ( Mn T )O c t / S e p t
16/17F Change 15/16 14/15 Op’g stocks 23.3* -5.4 28.7 26.7 Production 177.3* +10.5 166.8 170.4 Supplies 200.6* +5.1 195.5 197.1 Consumption 177.0* +4.0 173.0 167.6
8 VEGETABLE OILS: World Supply & Usage ( Mn T )O c t / S e p t
16/17F Change 15/16 14/15 Op’g stocks 23.3* -5.4 28.7 26.7 Production 177.3* +10.5 166.8 170.4 Supplies 200.6* +5.1 195.5 197.1 Consumption 177.0* +4.0 173.0 167.6

Your Information Provider - - Independent, Unbiased, Authoritative - - Since 1958 Febr 6, 2017
© www.oilworld.de
2013/14 2014/15 2015/16 2016 /17
-3
-2
-1
0
1
2
3Quarterly, Change on year in Mn T
PALM OIL : World Production Changes
Oct/Dec 2013 until July/Sept 2017

Your Information Provider - - Independent, Unbiased, Authoritative - - Since 1958 Febr 6, 2017
© www.oilworld.de
Outlook Jan/Mar 2017: With palm oil stocks down about 3.8 Mn T from a year earlier in early Jan 2017, the prospective year-on-year production growth by 1.3-1.4 Mn T will be more than offset, resulting in a further decline of world supplies by 2.4-2.5 Mn T in Jan/Mar 2017 versus a year earlier
2013/14 2014/15 2015/16 2016/17
-4
-3
-2
-1
0
1
2
3Quarterly, Change on year in Mn T
PALM OIL : World Supply Changes
Oct/Dec 2013 untilJuly/Sept 2017

Your Information Provider - - Independent, Unbiased, Authoritative - - Since 1958 Febr 6, 2017
© www.oilworld.de
World China India Indonesia Malaysia-6
-4
-2
0
2
413/14 14/15 15/16 16/17
PALM OIL Stocks, Annual Change (in Mn T)
World China India Indonesia Malaysia-6
-4
-2
0
2
413/14 14/15 15/16 16/17
17 OILS/FATS Stocks, Annual Change (in Mn T)
The Legacy of a Severe Production Deficit…
…Major Reduction in Stocks of Palm Oil, Rapeseed Oil and Others.
Your Information Provider - - Independent, Unbiased, Authoritative - - Since 1958 Febr 6, 2017
© www.oilworld.de
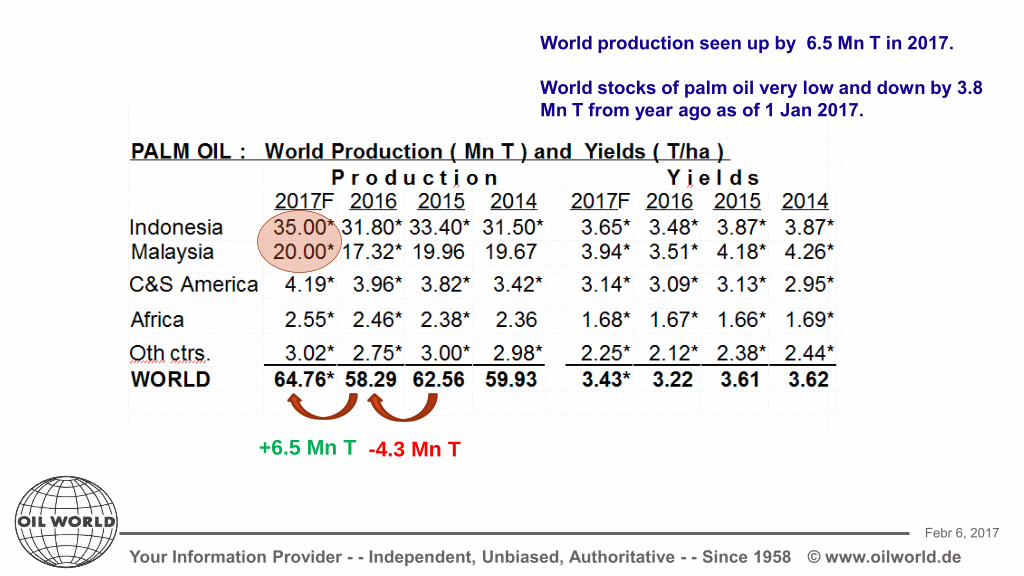
-4.3 Mn T +6.5 Mn T
World production seen up by 6.5 Mn T in 2017. World stocks of palm oil very low and down by 3.8 Mn T from year ago as of 1 Jan 2017.

Your Information Provider - - Independent, Unbiased, Authoritative - - Since 1958 Febr 6, 2017
© www.oilworld.de
Impacts from soybeans and other oilseeds
Your Information Provider - - Independent, Unbiased, Authoritative - - Since 1958 Febr 6, 2017
© www.oilworld.de
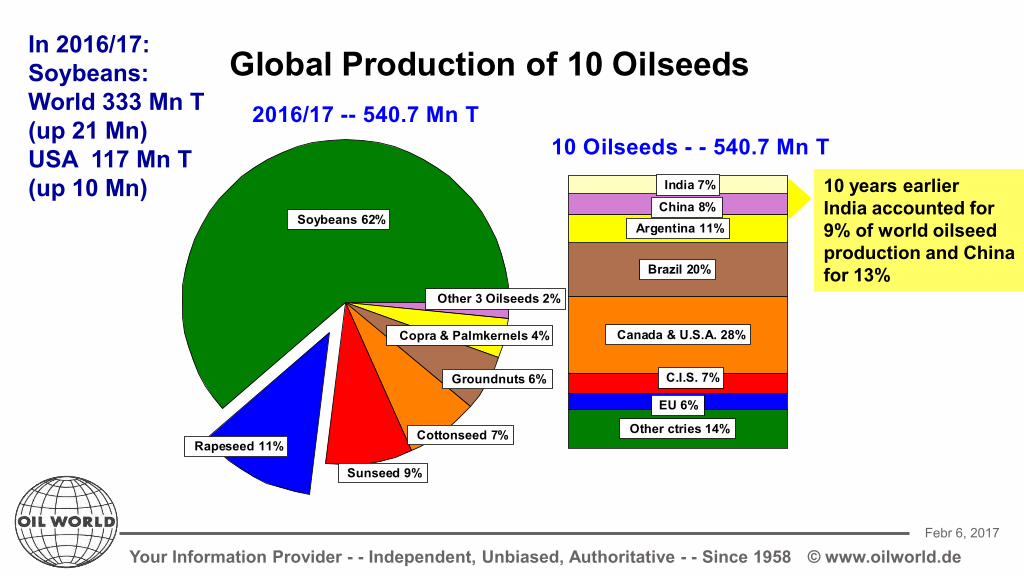
Soybeans 62%
Rapeseed 11%
Sunseed 9%
Cottonseed 7%
Groundnuts 6%
Copra & Palmkernels 4%
Other 3 Oilseeds 2%
2016/17 -- 540.7 Mn T
Other ctries 14%
EU 6%
C.I.S. 7%
Canada & U.S.A. 28%
Brazil 20%
Argentina 11%China 8%
India 7%
10 Oilseeds - - 540.7 Mn T
Global Production of 10 Oilseeds
10 years earlier India accounted for 9% of world oilseed production and China for 13%
In 2016/17: Soybeans: World 333 Mn T (up 21 Mn) USA 117 Mn T (up 10 Mn)

Your Information Provider - - Independent, Unbiased, Authoritative - - Since 1958 Febr 6, 2017
© www.oilworld.de
SOYBEANS Record yield and soybean output in the USA in 2016 But global dependence on US soybeans and products increasing in 2016/17 In Sept/Feb 2016/17 US soybean exports soaring to 46.3 Mn T (up 6 Mn T), thus 73% of world exports
U.S.A. : Soybean Supply & Demand ( Mn T ) S e p t e m b e r / A u g u s t
16/17F 15/16 14/15 13/14 12/13 Op. stocks . . . 5.35 5.19 2.50 3.83 4.61 Crop. . . . . . . . 117.21 106.86 106.88 91.39 82.79 Imports . . . . . .78* .66 .93 2.10 1.01
Exports . . . . . 57.80* 52.74 50.20 44.65 36.17 Crushings . . . 52.70* 51.33 51.16 47.38 45.97 Other use 3.32* 3.28 3.77 2.77 2.45
End. stocks . . 9.52* 5.35 5.19 2.50 3.83
Stocks/usage 8.4% 5.0% 4.9% 2.6% 4.5%

Your Information Provider - - Independent, Unbiased, Authoritative - - Since 1958 Febr 6, 2017
© www.oilworld.de
07/08
08/09
09/10
10/11
11/12
12/13
13/14
14/15
15/16
16/17
-1
-0,5
0
0,5
1
1,5
2
2,5
3
3,5Argentina Brazil
Soybean Area - change on year (Mn ha)

Your Information Provider - - Independent, Unbiased, Authoritative - - Since 1958 Febr 6, 2017
© www.oilworld.de
there somebody to pick me up tomorrow at the airport
FLOODED as of 18 Jan 2017 (in 1 000 ha ) BUENOS AIRES 1063 SANTA FE 821 CORDOBA 483 2367 THEREOF (estimated): SOYA 1000 CORN 1000 OTHER 367

Your Information Provider - - Independent, Unbiased, Authoritative - - Since 1958 Febr 6, 2017
© www.oilworld.de
75/76 81/82 87/88 93/94 99/00 04/05 10/11 16/17F0
20
40
60
80
100
120
140
160
180Soybean Crop Trend Since 74/75 (Mn T)
U.S.A.
Argentina, Brazil & Paraguay
Your Information Provider - - Independent, Unbiased, Authoritative - - Since 1958 Febr 6, 2017
© www.oilworld.de
1997 1999 2001 2003 2005 2007 2009 2011 2013 2015 2017F0
20
40
60
80
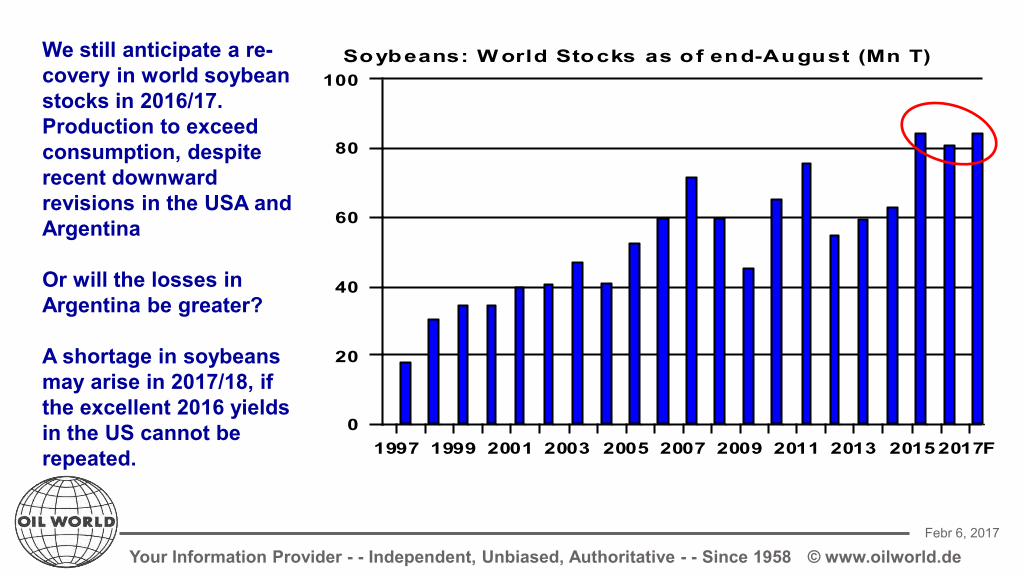
100Soybeans: W orld Stocks as of end-August (Mn T)We still anticipate a re-
covery in world soybean stocks in 2016/17. Production to exceed consumption, despite recent downward revisions in the USA and Argentina Or will the losses in Argentina be greater? A shortage in soybeans may arise in 2017/18, if the excellent 2016 yields in the US cannot be repeated.

Your Information Provider - - Independent, Unbiased, Authoritative - - Since 1958 Febr 6, 2017
© www.oilworld.de
D ai ly future s fro m 5 A pr 2 016 unt il 2 Feb 2 017
Apr M ay Jun Jly Aug Sep Oct N ov D ec Ja17 Feb
8 50
9 00
9 50
1 00 0
1 05 0
1 10 0
1 15 0
M a rc h 2 0 1 7 p o sit io n
5 0 -d a y m o vin g a ve ra g e
CBOT: Daily Soybean Futures (c/bu)

Your Information Provider - - Independent, Unbiased, Authoritative - - Since 1958 Febr 6, 2017
© www.oilworld.de
O c t o b e r / S e p t e m b e r94/95
95/9696/97
97/9898/99
99/00 00 /01
01 /02 02 /03
03 /04 04 /05
05 /06 06 /07
07 /08 08 /09
09 /1010/11
11/1212/13
13/1414/15
15/1616/17
0102030
405060
708090
100ChinaRest of world
Imports of Soybeans (Mn T)In Jan/Dec 2016 China imported: 83.7 Mn T of soybeans 3.8 Mn T of rapeseed
Your Information Provider - - Independent, Unbiased, Authoritative - - Since 1958 Febr 6, 2017
© www.oilworld.de
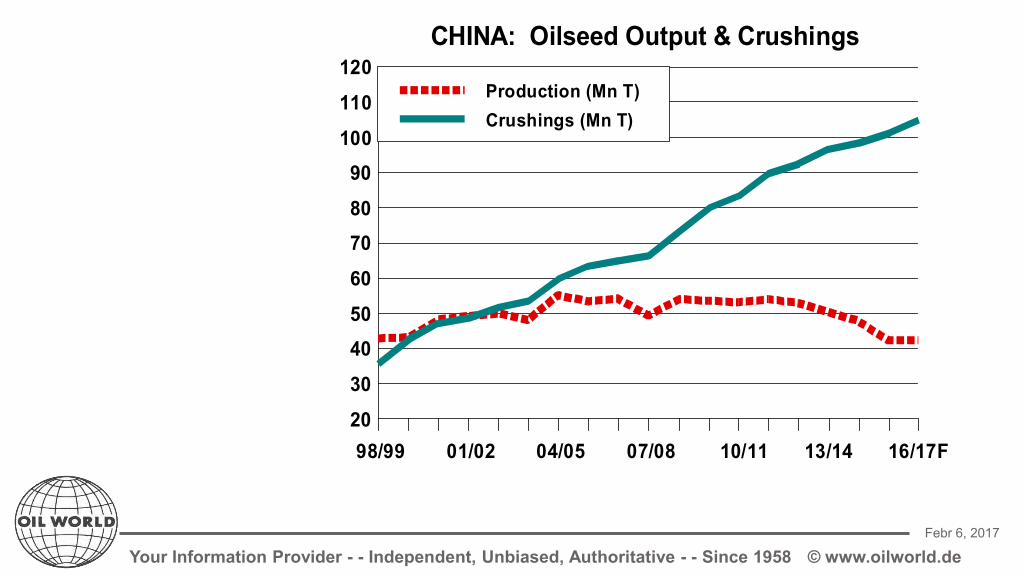
98/99 01/02 04/05 07/08 10/11 13/14 16/17F20
30
4050
60
7080
90100
110
120Production (Mn T)Crushings (Mn T)
CHINA: Oilseed Output & Crushings

Your Information Provider - - Independent, Unbiased, Authoritative - - Since 1958 Febr 6, 2017
© www.oilworld.de
O c t o b e r / S e p t e m b e r 00/01
01/02 02/03
03/04 04/05
05/06 06/07
07/08 08/09
09/1010/11
11/12 12/13
13/1414/15
15/1616/17F
80100120140160180200220240260280300
10 Oilseeds : World Crushings (Mn T)
9 other seeds
Soybeans
Further boost in world soybean crushings required in 2016/17, because 1) rising demand 2) still insufficient palm oil supplies 3) tightness of oth seeds 4) low stocks of veg oils This is creating a surplus in oilmeals, and has raised the oil share
Your Information Provider - - Independent, Unbiased, Authoritative - - Since 1958 Febr 6, 2017
© www.oilworld.de
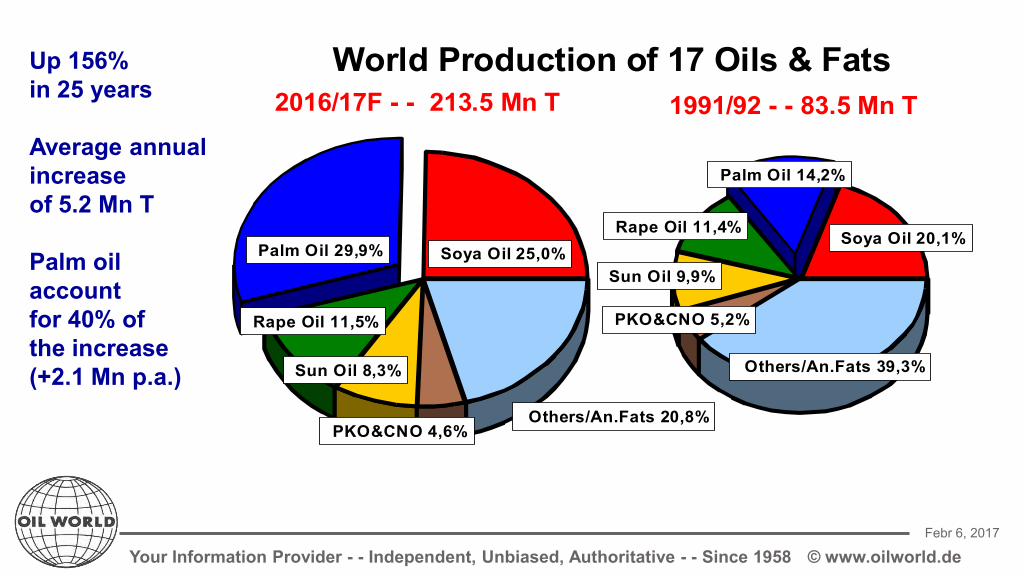
Soya Oil 25,0%Palm Oil 29,9%
Rape Oil 11,5%
Sun Oil 8,3%
PKO&CNO 4,6%Others/An.Fats 20,8%
2016/17F - - 213.5 Mn T
Soya Oil 20,1%
Palm Oil 14,2%
Rape Oil 11,4%
Sun Oil 9,9%
PKO&CNO 5,2%
Others/An.Fats 39,3%
1991/92 - - 83.5 Mn TWorld Production of 17 Oils & FatsUp 156%
in 25 years Average annual increase of 5.2 Mn T Palm oil account for 40% of the increase (+2.1 Mn p.a.)

Your Information Provider - - Independent, Unbiased, Authoritative - - Since 1958 Febr 6, 2017
© www.oilworld.de
Impacts from biodiesel

Your Information Provider - - Independent, Unbiased, Authoritative - - Since 1958 Febr 6, 2017
© www.oilworld.de
89/90 92/93 95/96 98/99 01/02 04/05 07/08 10/11 13/14 16/17F
020406080
100120140160180200220
biofuel food and other
Total Usage in Mn T17 Oils & Fats : World Consumption
Average demand growth in past 5 seasons: Total +6.4 Mn T per year Biofuel +1.6 Mn T Food/other +4.8 Mn T
Substantial Growth in World Demand of Oils/Fats ! !
Your Information Provider - - Independent, Unbiased, Authoritative - - Since 1958 Febr 6, 2017
© www.oilworld.de
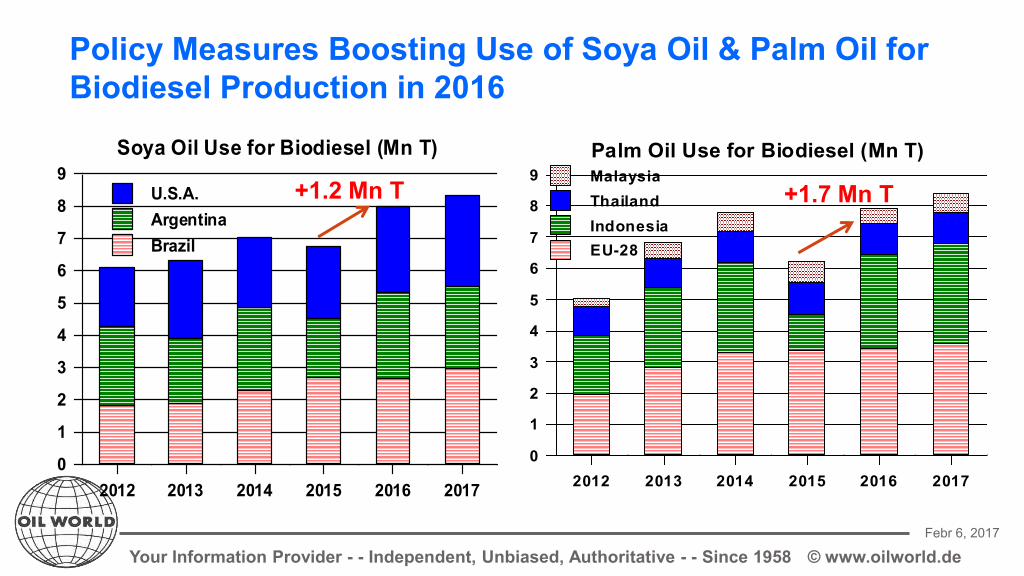
Policy Measures Boosting Use of Soya Oil & Palm Oil for Biodiesel Production in 2016
2012 2013 2014 2015 2016 20170
1
2
3
4
5
6
7
8
9 MalaysiaThailandIndonesiaEU-28
Palm Oil Use for Biodiesel (Mn T)
+1.7 Mn T
2012 2013 2014 2015 2016 20170
1
2
3
4
5
6
7
8
9U.S.A.ArgentinaBrazil
Soya Oil Use for Biodiesel (Mn T)
+1.2 Mn T

Your Information Provider - - Independent, Unbiased, Authoritative - - Since 1958 Febr 6, 2017
© www.oilworld.de
2005 2007 2009 2011 2013 2015 2017F0
5
10
15
20
25
30
35World Production of Biodiesel (Mn T)BIODIESEL: World Production by Country ( Mn T )
J a n u a r y / D e c e m b e r2017F 2016 2015 2014 2013
EU-28 12.40* 12.35* 12.37 12.20* 10.65 U.S.A. 6.20* 5.85* 4.90 4.80 4.72 Argentina 2.55* 2.63* 1.81 2.58 2.00 Brazil 3.80* 3.36* 3.46 3.00 2.56 Colombia .49* .45* .51 .52 .50 Singapore .88* .86* .82 .76 .79 Indonesia 3.20* 3.00* 1.16 2.92 2.60 Malaysia .60* .50* .67 .60 .47 Thailand. 1.10* .98* 1.03 .99 .93 Oth. ctries. 3.00* 2.94* 2.89 2.94* 2.65*Total 34.22* 32.92* 29.62 31.30 27.87
Change in +1.30* +3.30* -1.68 +3.43 +3.29
BIODIESEL: World Production by Country ( Mn T )J a n u a r y / D e c e m b e r
2017F 2016 2015 2014 2013 EU-28 12.40* 12.35* 12.37 12.20* 10.65 U.S.A. 6.20* 5.85* 4.90 4.80 4.72 Argentina 2.55* 2.63* 1.81 2.58 2.00 Brazil 3.80* 3.36* 3.46 3.00 2.56 Colombia .49* .45* .51 .52 .50 Singapore .88* .86* .82 .76 .79 Indonesia 3.20* 3.00* 1.16 2.92 2.60 Malaysia .60* .50* .67 .60 .47 Thailand. 1.10* .98* 1.03 .99 .93 Oth. ctries. 3.00* 2.94* 2.89 2.94* 2.65*Total 34.22* 32.92* 29.62 31.30 27.87
Change in +1.30* +3.30* -1.68 +3.43 +3.29

Your Information Provider - - Independent, Unbiased, Authoritative - - Since 1958 Febr 6, 2017
© www.oilworld.de
At the end of the season2003 2005 2007 2009 2011 2013 2015 2017F8
10
12
14
16
18
20
22
17 oils & fa ts
10 oilseeds
World Stocks in Percent of Annual Usage (%)In 2016/17 oils & fats stocks still drop relative to annual consumption. A second year (2017/18) without severe weather problems is required to bring oils & fats stocks to more comfortable levels. Oilseeds would tighten in case of an Argentine soya crop of close to 50 Mn T
Concluding Statements

Your Information Provider - - Independent, Unbiased, Authoritative - - Since 1958 Febr 6, 2017
© www.oilworld.de
there somebody to pick me up tomorrow at the airport
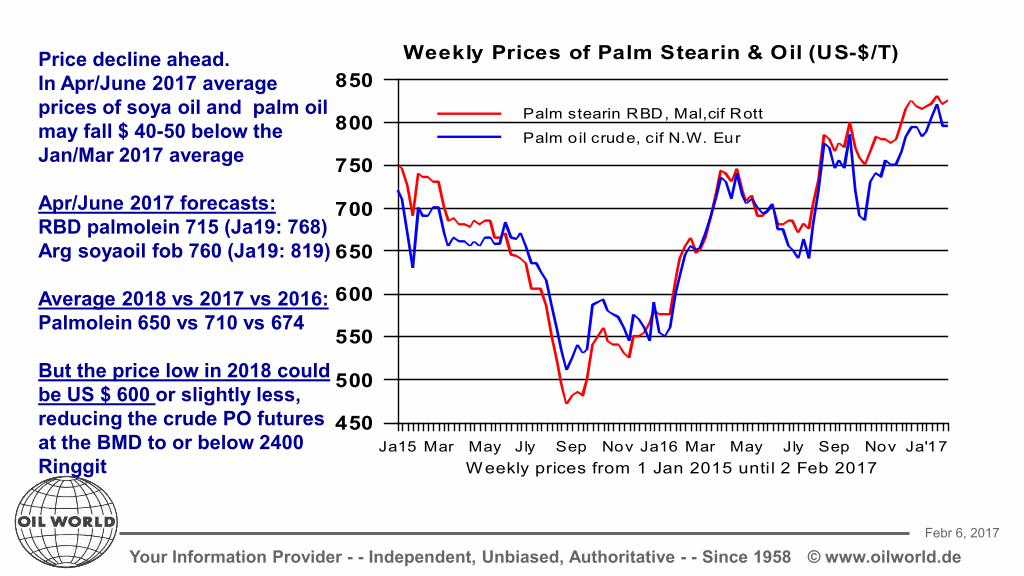
I expect a further rally in Jan/March 2017, with crude palm oil in Rotterdam likely to peak soon near US-$ 840 Crude palm oil (fob Indon) may peak at US-$ 800 Arg soy oil to peak at 840 Prices seen declining from March or April onward. The weakness should be limited at first but then be enforced in 2nd half 2017 and accelerate in 2018
Weekly prices from 1 Jan 2015 unti l 2 Feb 2017Ja15 Mar May Jly Sep Nov Ja16 Mar May Jly Sep Nov Ja'17
450
500
550
600
650
700
750
800
850Palm stearin RBD, Mal,cif Rott
Palm oil crude, cif N.W. Eur
Weekly Prices of Palm Stearin & Oil (US-$/T)
Your Information Provider - - Independent, Unbiased, Authoritative - - Since 1958 Febr 6, 2017
© www.oilworld.de
there somebody to pick me up tomorrow at the airport
Price decline ahead. In Apr/June 2017 average prices of soya oil and palm oil may fall $ 40-50 below the Jan/Mar 2017 average Apr/June 2017 forecasts: RBD palmolein 715 (Ja19: 768) Arg soyaoil fob 760 (Ja19: 819) Average 2018 vs 2017 vs 2016: Palmolein 650 vs 710 vs 674 But the price low in 2018 could be US $ 600 or slightly less, reducing the crude PO futures at the BMD to or below 2400 Ringgit Weekly prices from 1 Jan 2015 unti l 2 Feb 2017
Ja15 Mar May Jly Sep Nov Ja16 Mar May Jly Sep Nov Ja'17450
500
550
600
650
700
750
800
850Palm stearin RBD, Mal,cif Rott
Palm oil crude, cif N.W. Eur
Weekly Prices of Palm Stearin & Oil (US-$/T)

Your Information Provider - - Independent, Unbiased, Authoritative - - Since 1958 Febr 6, 2017
© www.oilworld.de
Lauric oil prices set to decline in the next 12 months on account of recovering production relatively inelastic demand
Premiums of lauric oil prices versus palm oil are set to narrow in 2017
Monthly prices from Jan 2011 until Jan 2017Jan'11 Jan'12 Jan'13 Jan'14 Jan'15 Jan'16 Jan'17
400600800
10001200140016001800200022002400
Palm oil crude, cif N.W. EurPalm olein RBD, Mal, fobPalmkern oil,Mal/Indo,cif RottCoconut oil,Phil/Indo,cif Rott
Monthly Prices of 4 Veg. Oils (US-$/T)

Your Information Provider - - Independent, Unbiased, Authoritative - - Since 1958 Febr 6, 2017
© www.oilworld.de
there somebody to pick me up tomorrow at the airport
Thank You for Your Kind Attention !
© Copyright 2017 ISTA Mielke GmbH. This information is destined for internal use only. Any copying, reproduction and/or redistribution of the proprietary content without the prior written consent of ISTA Mielke GmbH is prohibited. Any violation of our copyright will be PROSECUTED. The information and analyses given in this service are considered to be reliable. Every care is taken to ensure the accuracy and completeness of the contents. We cannot, however, accept any responsibility for them nor for the accuracy of our forecasts and opinions or any liability for the subscriber’s use. Kindly visit us on www.oilworld.de For further information you may call +49 40 76105021
Related Documents