U.S. Department of the Interior U.S. Geological Survey Open-File Report 2011–1073 Global Multi-resolution Terrain Elevation Data 2010 (GMTED2010)

Welcome message from author
This document is posted to help you gain knowledge. Please leave a comment to let me know what you think about it! Share it to your friends and learn new things together.
Transcript
U.S. Department of the InteriorU.S. Geological Survey
Open-File Report 2011–1073
Global Multi-resolution Terrain Elevation Data 2010 (GMTED2010)

Cover illustration: GMTED2010 dataset.
Global Multi-resolution Terrain Elevation Data 2010 (GMTED2010)
By Jeffrey J. Danielson and Dean B. Gesch
Open-File Report 2011–1073
U.S. Department of the InteriorU.S. Geological Survey

U.S. Department of the InteriorKEN SALAZAR, Secretary
U.S. Geological SurveyMarcia K. McNutt, Director
U.S. Geological Survey, Reston, Virginia: 2011
For more information on the USGS—the Federal source for science about the Earth, its natural and living resources, natural hazards, and the environment, visit http://www.usgs.gov or call 1–888–ASK–USGS.
For an overview of USGS information products, including maps, imagery, and publications, visit http://www.usgs.gov/pubprod
Any use of trade, product, or firm names is for descriptive purposes only and does not imply endorsement by the U.S. Government.
Although this report is in the public domain, permission must be secured from the individual copyright owners to reproduce any copyrighted materials contained within this report.
Suggested citation:Danielson, J.J., and Gesch, D.B., 2011, Global multi-resolution terrain elevation data 2010 (GMTED2010): U.S. Geo-logical Survey Open-File Report 2011–1073, 26 p.

iii
ContentsIntroduction.....................................................................................................................................................1Existing GTOPO30 Elevation Model ............................................................................................................1GMTED2010 Dataset Characteristics .........................................................................................................2Input Data Sources ........................................................................................................................................2Data Preprocessing .......................................................................................................................................5Generalization.................................................................................................................................................6Mosaicking......................................................................................................................................................7Pixel Alignment and Grid Coordinates .......................................................................................................7Output Data Products ....................................................................................................................................9Data Formats.................................................................................................................................................12
Generalized Elevation Products – Seamless Global Coverage (GRID) ......................................12Generalized Elevation Products – Tile-Based (GeoTIFF Image Format) ....................................12Spatially Referenced Metadata (ESRI Vector Shapefile Format) ...............................................12
Accuracy Assessment ................................................................................................................................12Raster-Based Assessment ................................................................................................................12Absolute Vertical Accuracy Assessment .......................................................................................12
Limitations and Caveats ..............................................................................................................................21Summary........................................................................................................................................................21References Cited..........................................................................................................................................22Appendix........................................................................................................................................................25
Figures 1. Map showing GTOPO30 elevation model .................................................................................1 2. Map showing GTOPO30 elevation sources ..............................................................................2 3. Map showing SRTM DTED®2 (void-filled) 1-arc-second coverage .....................................3 4. Map showing 15-arc-second SPOT 5 Reference3D Africa coverage .................................4 5. Diagram showing aggregate example using the maximum value (3 x 3 processing
window) ..........................................................................................................................................6 6. Diagram showing standard deviation example using blockstd routine (3 x 3 processing
window) ..........................................................................................................................................7 7. Diagram showing ArcGIS mosaic – blend method .................................................................8 8. Diagram showing “Pixel center” referencing of full resolution 1-arc-second SRTM
data .................................................................................................................................................8 9. Diagram showing spatial nesting of GMTED2010 pixels .............................................................8 10. Diagram showing the GMTED2010 layer extents (minimum and maximum latitude and
longitude) are a result of the coordinate system inherited from the 1-arc-second SRTM data ................................................................................................................................................10
11. Graphic showing comparison of the existing GTOPO30 and new GMTED2010 30-arc- second mean elevation product ...............................................................................................10
12. Map showing GMTED2010 spatially referenced metadata with void polygons having a dark dense appearance .........................................................................................................11

iv
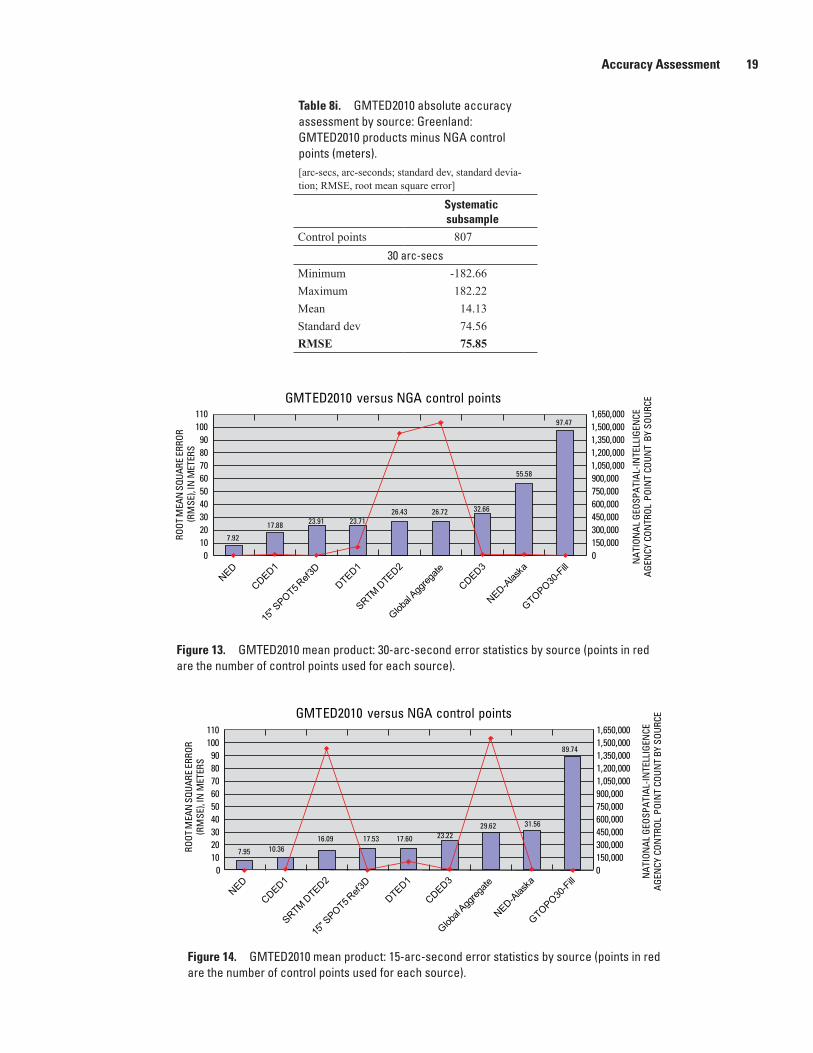
13. Graph showing GMTED2010 mean product: 30-arc-second error statistics by source (points in red are the number of control points used for each source) .............................19
14. Graph showing GMTED2010 mean product: 15-arc-second error statistics by source (points in red are the number of control points used for each source) ...............19
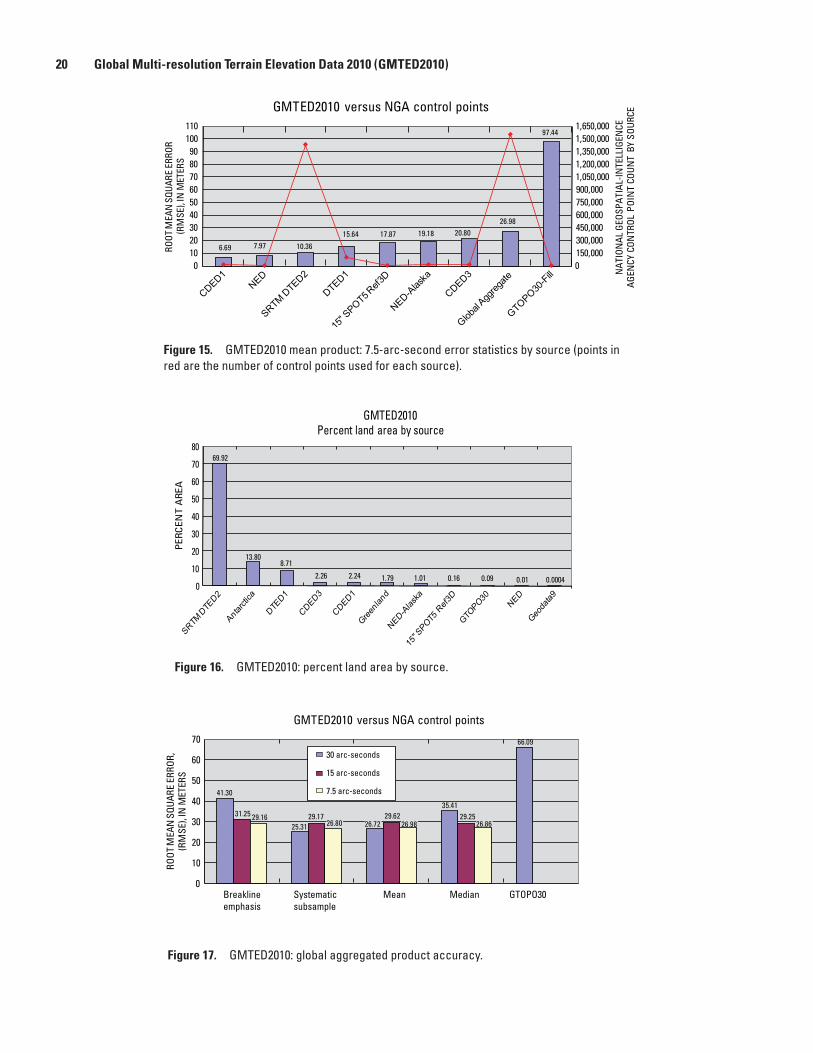
15. Graph showing GMTED2010 mean product: 7.5-arc-second error statistics by source (points in red are the number of control points used for each source) ...............20
16. Graph showing GMTED2010: percent land area by source .................................................20 17. Graph showing GMTED2010: global aggregated product accuracy ..................................20
Tables 1. Global land area percentage by source ...................................................................................5 2a. Input source data characteristics .............................................................................................5 2b. Input source data characteristics .............................................................................................6 3. Geographic extents, resolutions, and raster grid dimensions of GMTED2010 product
layers ..............................................................................................................................................9 4a. Spatially referenced metadata attribute data dictionary .....................................................11 4b. Example values - GMTED2010 spatially referenced metadata ...........................................11 5. GMTED2010 global accuracy assessment: raster-based comparison: GMTED2010
30-arc-second products minus GTOPO30 (meters) ..............................................................12 6. Removal of outliers beyond three standard deviations from the mean difference
between NGA control point dataset and the GMTED2010 systematic subsample product .........................................................................................................................................13
7. GMTED2010 absolute accuracy assessment: aggregated global data evaluation: GMTED2010 products and GTOPO30 minus NGA control points (meters) ........................14
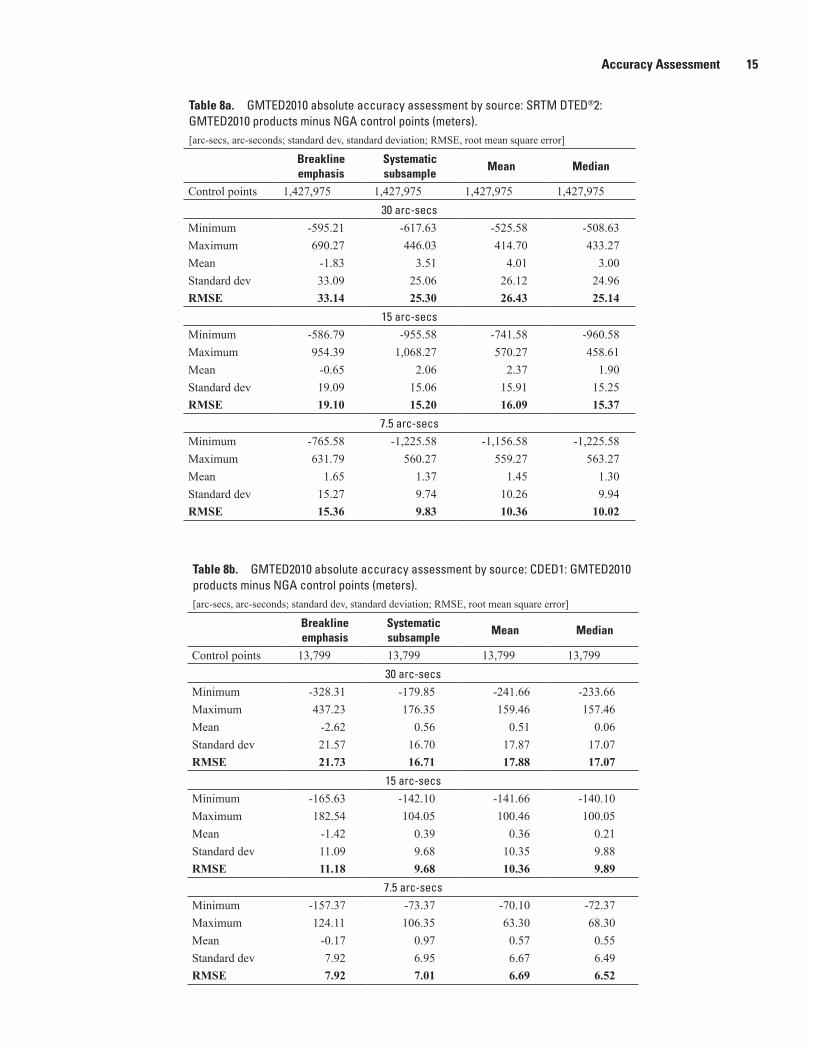
8a. GMTED2010 absolute accuracy assessment by source: SRTM DTED®2: GMTED2010 products minus NGA control points (meters) ................................................................................15
8b. GMTED2010 absolute accuracy assessment by source: CDED1: GMTED2010 products minus NGA control points (meters) .................................................................................................15
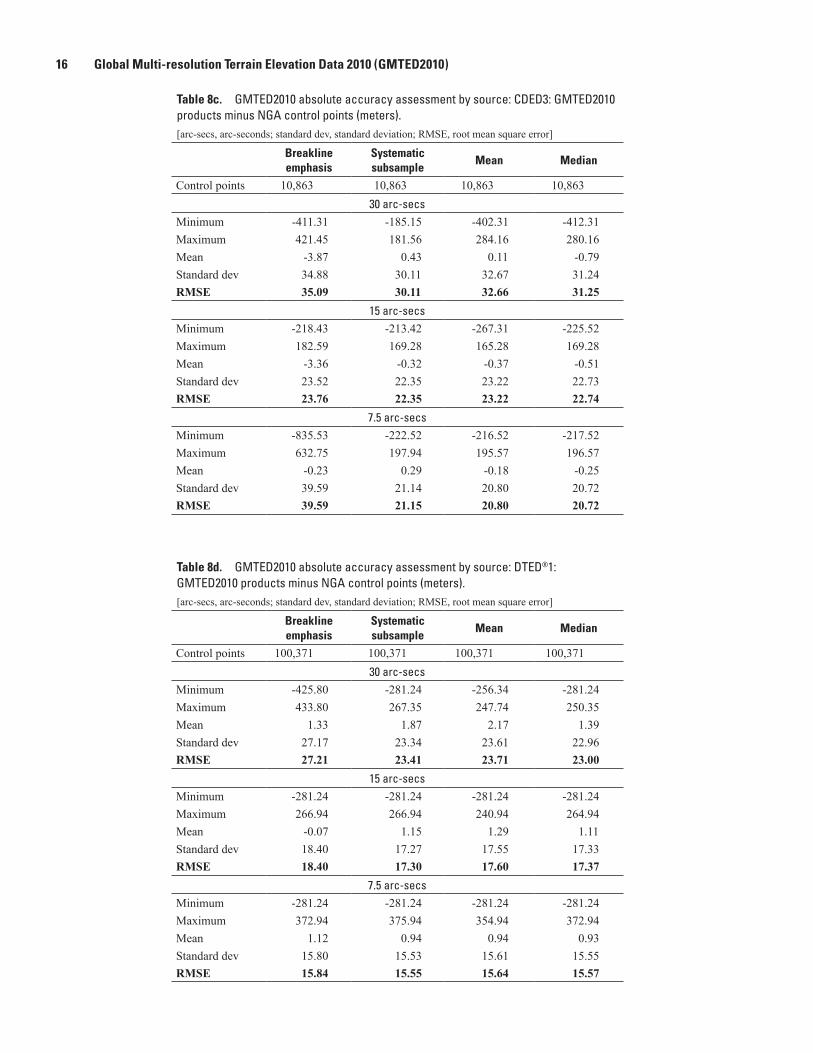
8c. GMTED2010 absolute accuracy assessment by source: CDED3: GMTED2010 products minus NGA control points (meters) .................................................................................................16
8d. GMTED2010 absolute accuracy assessment by source: DTED®1: GMTED2010 products minus NGA control points (meters) .................................................................................................16
8e. GMTED2010 absolute accuracy assessment by source: GTOPO30 fill data: GMTED2010 products minus NGA control points (meters) ................................................................................17
8f. GMTED2010 absolute accuracy assessment by source: NED: GMTED2010 products minus NGA control points (meters) .................................................................................................17
8g. GMTED2010 absolute accuracy assessment by source: NED-Alaska: GMTED2010 products minus NGA control points (meters) ................................................................................18
8h. GMTED2010 absolute accuracy assessment by source: 15-Arc-second SPOT5 Refer-ence3D: GMTED2010 products minus NGA control points (meters) ..........................................18
8i. GMTED2010 absolute accuracy assessment by source: Greenland: GMTED2010 products minus NGA control points (meters) ................................................................................19
Introduction In 1996, the U.S. Geological Survey (USGS) developed
a global topographic elevation model designated as GTOPO30 at a horizontal resolution of 30 arc-seconds for the entire Earth. Because no single source of topographic information covered the entire land surface, GTOPO30 was derived from eight raster and vector sources that included a substantial amount of U.S. Defense Mapping Agency data. The quality of the elevation data in GTOPO30 varies widely; there are no spatially-referenced metadata, and the major topographic features such as ridgelines and valleys are not well repre-sented. Despite its coarse resolution and limited attributes, GTOPO30 has been widely used for a variety of hydrological, climatological, and geomorphological applications as well as military applications, where a regional, continental, or global scale topographic model is required. These applications have ranged from delineating drainage networks and watersheds to using digital elevation data for the extraction of topographic structure and three-dimensional (3D) visualization exercises (Jenson and Domingue, 1988; Verdin and Greenlee, 1996; Lehner and others, 2008). Many of the fundamental geophysi-cal processes active at the Earth’s surface are controlled or strongly influenced by topography, thus the critical need for high-quality terrain data (Gesch, 1994). U.S. Department of Defense requirements for mission planning, geographic regis-tration of remotely sensed imagery, terrain visualization, and map production are similarly dependent on global topographic data.
Since the time GTOPO30 was com-pleted, the availability of higher-quality elevation data over large geographic areas has improved markedly. New data sources include global Digital Terrain Elevation Data (DTED®) from the Shuttle Radar Topography Mission (SRTM), Canadian elevation data, and data from the Ice, Cloud, and land Elevation Satel-lite (ICESat). Given the widespread use of GTOPO30 and the equivalent 30-arc-second DTED® level 0, the USGS and the National Geospatial-Intelligence Agency (NGA) have collaborated to produce an enhanced replacement for GTOPO30, the
Global Multi-resolution Terrain Elevation Data 2010 (GMTED2010)
By Jeffrey J. Danielson and Dean B. Gesch
Global Land One-km Base Elevation (GLOBE) model and other comparable 30-arc-second-resolution global models, using the best available data. The new model is called the Global Multi-resolution Terrain Elevation Data 2010, or GMTED2010 for short. This suite of products at three differ-ent resolutions (approximately 1,000, 500, and 250 meters) is designed to support many applications directly by providing users with generic products (for example, maximum, mini-mum, and median elevations) that have been derived directly from the raw input data that would not be available to the general user or would be very costly and time-consuming to produce for individual applications. The source of all the elevation data is captured in metadata for reference purposes. It is also hoped that as better data become available in the future, the GMTED2010 model will be updated.
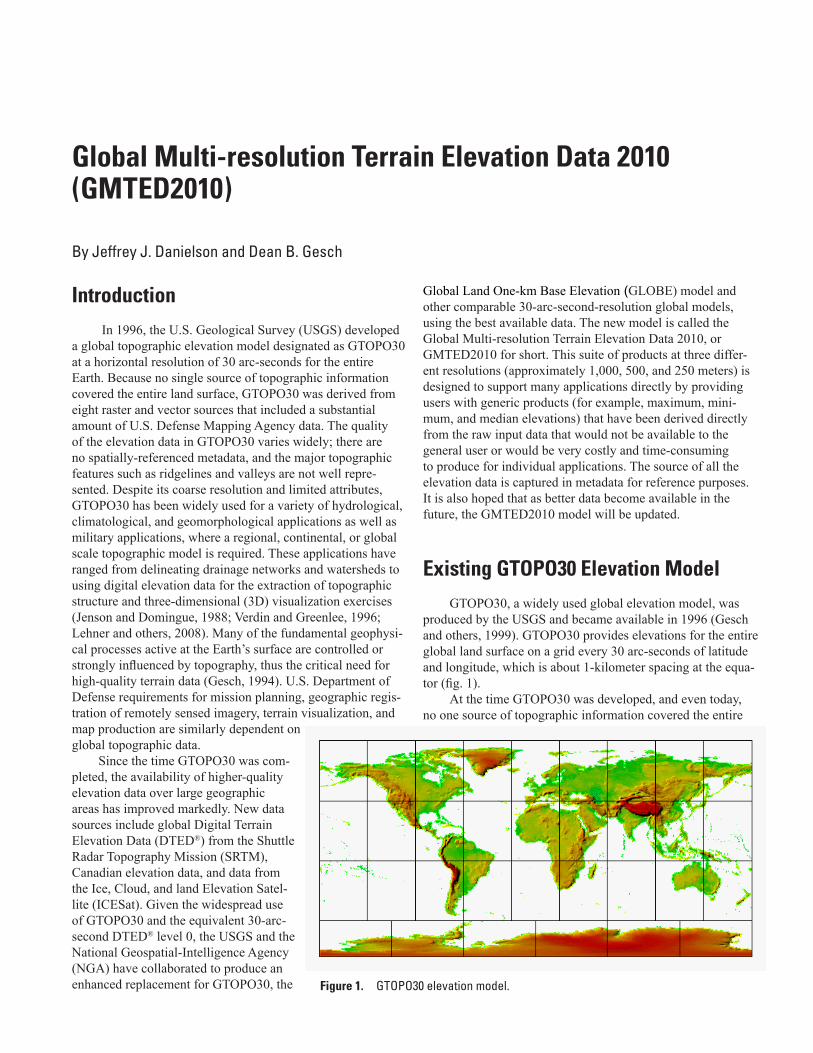
Existing GTOPO30 Elevation ModelGTOPO30, a widely used global elevation model, was
produced by the USGS and became available in 1996 (Gesch and others, 1999). GTOPO30 provides elevations for the entire global land surface on a grid every 30 arc-seconds of latitude and longitude, which is about 1-kilometer spacing at the equa-tor (fig. 1).
At the time GTOPO30 was developed, and even today, no one source of topographic information covered the entire
Figure 1. GTOPO30 elevation model.
2 Global Multi-resolution Terrain Elevation Data 2010 (GMTED2010)
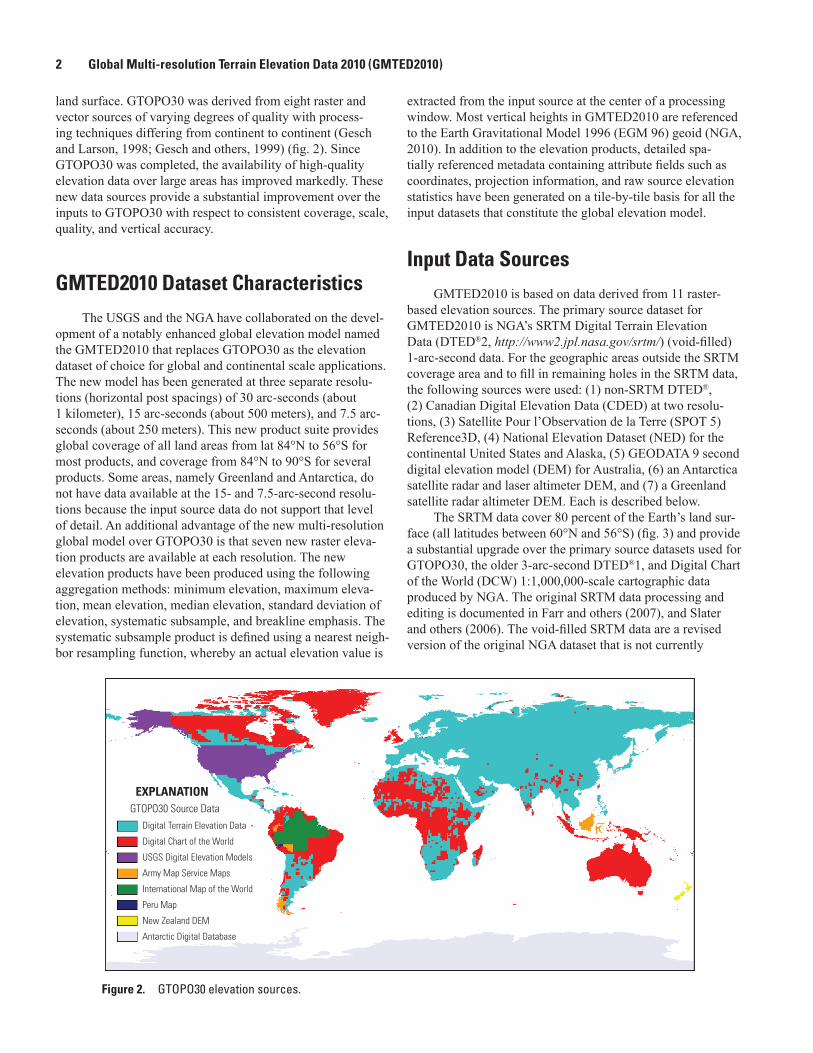
land surface. GTOPO30 was derived from eight raster and vector sources of varying degrees of quality with process-ing techniques differing from continent to continent (Gesch and Larson, 1998; Gesch and others, 1999) (fig. 2). Since GTOPO30 was completed, the availability of high-quality elevation data over large areas has improved markedly. These new data sources provide a substantial improvement over the inputs to GTOPO30 with respect to consistent coverage, scale, quality, and vertical accuracy.
GMTED2010 Dataset CharacteristicsThe USGS and the NGA have collaborated on the devel-
opment of a notably enhanced global elevation model named the GMTED2010 that replaces GTOPO30 as the elevation dataset of choice for global and continental scale applications. The new model has been generated at three separate resolu-tions (horizontal post spacings) of 30 arc-seconds (about 1 kilometer), 15 arc-seconds (about 500 meters), and 7.5 arc-seconds (about 250 meters). This new product suite provides global coverage of all land areas from lat 84°N to 56°S for most products, and coverage from 84°N to 90°S for several products. Some areas, namely Greenland and Antarctica, do not have data available at the 15- and 7.5-arc-second resolu-tions because the input source data do not support that level of detail. An additional advantage of the new multi-resolution global model over GTOPO30 is that seven new raster eleva-tion products are available at each resolution. The new elevation products have been produced using the following aggregation methods: minimum elevation, maximum eleva-tion, mean elevation, median elevation, standard deviation of elevation, systematic subsample, and breakline emphasis. The systematic subsample product is defined using a nearest neigh-bor resampling function, whereby an actual elevation value is
extracted from the input source at the center of a processing window. Most vertical heights in GMTED2010 are referenced to the Earth Gravitational Model 1996 (EGM 96) geoid (NGA, 2010). In addition to the elevation products, detailed spa-tially referenced metadata containing attribute fields such as coordinates, projection information, and raw source elevation statistics have been generated on a tile-by-tile basis for all the input datasets that constitute the global elevation model.
Input Data SourcesGMTED2010 is based on data derived from 11 raster-
based elevation sources. The primary source dataset for GMTED2010 is NGA’s SRTM Digital Terrain Elevation Data (DTED®2, http://www2.jpl.nasa.gov/srtm/) (void-filled) 1-arc-second data. For the geographic areas outside the SRTM coverage area and to fill in remaining holes in the SRTM data, the following sources were used: (1) non-SRTM DTED®, (2) Canadian Digital Elevation Data (CDED) at two resolu-tions, (3) Satellite Pour l’Observation de la Terre (SPOT 5) Reference3D, (4) National Elevation Dataset (NED) for the continental United States and Alaska, (5) GEODATA 9 second digital elevation model (DEM) for Australia, (6) an Antarctica satellite radar and laser altimeter DEM, and (7) a Greenland satellite radar altimeter DEM. Each is described below.
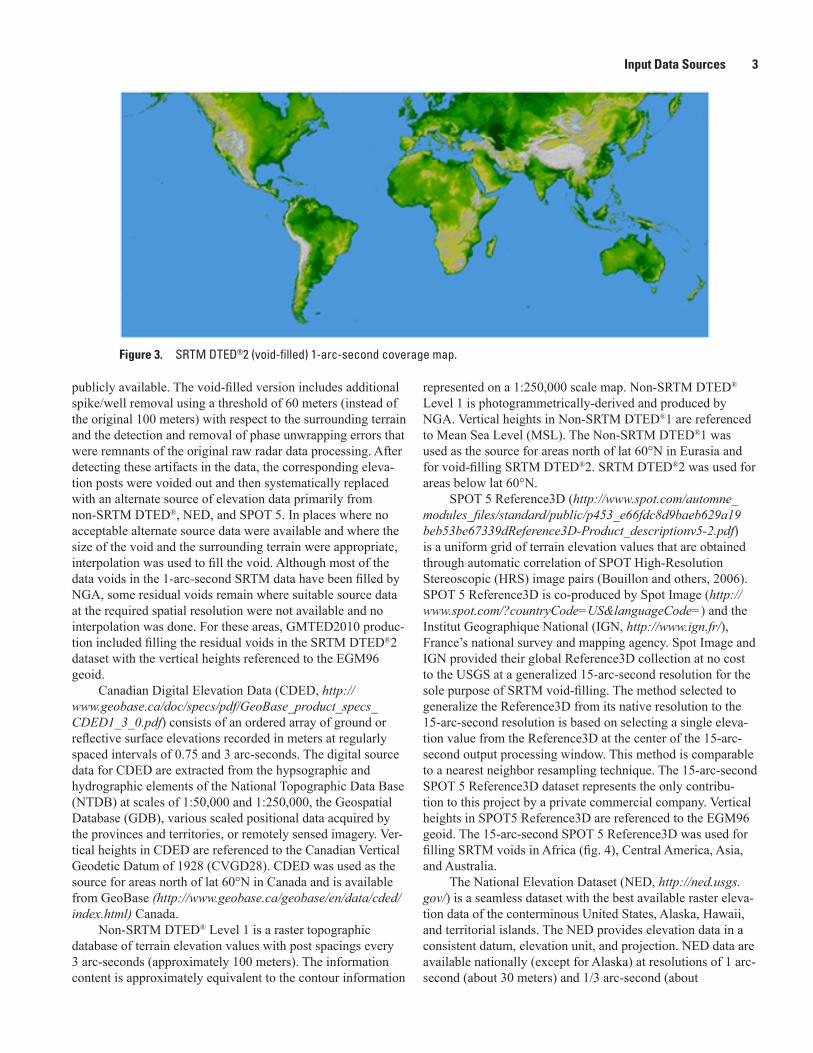
The SRTM data cover 80 percent of the Earth’s land sur-face (all latitudes between 60°N and 56°S) (fig. 3) and provide a substantial upgrade over the primary source datasets used for GTOPO30, the older 3-arc-second DTED®1, and Digital Chart of the World (DCW) 1:1,000,000-scale cartographic data produced by NGA. The original SRTM data processing and editing is documented in Farr and others (2007), and Slater and others (2006). The void-filled SRTM data are a revised version of the original NGA dataset that is not currently
Figure 2. GTOPO30 elevation sources.
EXPLANATION
Digital Terrain Elevation Data
Digital Chart of the World
USGS Digital Elevation Models
Army Map Service Maps
International Map of the World
Peru Map
New Zealand DEM
Antarctic Digital Database
GTOPO30 Source Data
Input Data Sources 3
publicly available. The void-filled version includes additional spike/well removal using a threshold of 60 meters (instead of the original 100 meters) with respect to the surrounding terrain and the detection and removal of phase unwrapping errors that were remnants of the original raw radar data processing. After detecting these artifacts in the data, the corresponding eleva-tion posts were voided out and then systematically replaced with an alternate source of elevation data primarily from non-SRTM DTED®, NED, and SPOT 5. In places where no acceptable alternate source data were available and where the size of the void and the surrounding terrain were appropriate, interpolation was used to fill the void. Although most of the data voids in the 1-arc-second SRTM data have been filled by NGA, some residual voids remain where suitable source data at the required spatial resolution were not available and no interpolation was done. For these areas, GMTED2010 produc-tion included filling the residual voids in the SRTM DTED®2 dataset with the vertical heights referenced to the EGM96 geoid.
Canadian Digital Elevation Data (CDED, http://www.geobase.ca/doc/specs/pdf/GeoBase_product_specs_CDED1_3_0.pdf) consists of an ordered array of ground or reflective surface elevations recorded in meters at regularly spaced intervals of 0.75 and 3 arc-seconds. The digital source data for CDED are extracted from the hypsographic and hydrographic elements of the National Topographic Data Base (NTDB) at scales of 1:50,000 and 1:250,000, the Geospatial Database (GDB), various scaled positional data acquired by the provinces and territories, or remotely sensed imagery. Ver-tical heights in CDED are referenced to the Canadian Vertical Geodetic Datum of 1928 (CVGD28). CDED was used as the source for areas north of lat 60°N in Canada and is available from GeoBase (http://www.geobase.ca/geobase/en/data/cded/index.html) Canada.
Non-SRTM DTED® Level 1 is a raster topographic database of terrain elevation values with post spacings every 3 arc-seconds (approximately 100 meters). The information content is approximately equivalent to the contour information
represented on a 1:250,000 scale map. Non-SRTM DTED® Level 1 is photogrammetrically-derived and produced by NGA. Vertical heights in Non-SRTM DTED®1 are referenced to Mean Sea Level (MSL). The Non-SRTM DTED®1 was used as the source for areas north of lat 60°N in Eurasia and for void-filling SRTM DTED®2. SRTM DTED®2 was used for areas below lat 60°N.
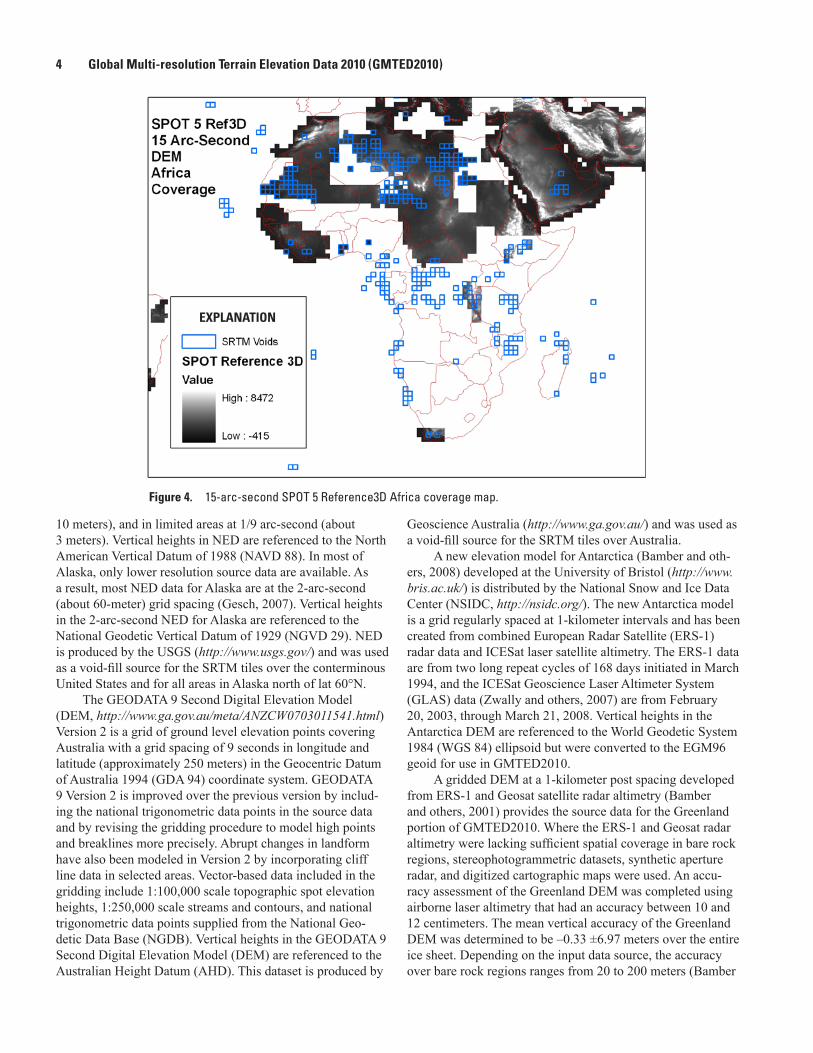
SPOT 5 Reference3D (http://www.spot.com/automne_modules_files/standard/public/p453_e66fdc8d9baeb629a19beb53be67339dReference3D-Product_descriptionv5-2.pdf) is a uniform grid of terrain elevation values that are obtained through automatic correlation of SPOT High-Resolution Stereoscopic (HRS) image pairs (Bouillon and others, 2006). SPOT 5 Reference3D is co-produced by Spot Image (http://www.spot.com/?countryCode=US&languageCode=) and the Institut Geographique National (IGN, http://www.ign.fr/), France’s national survey and mapping agency. Spot Image and IGN provided their global Reference3D collection at no cost to the USGS at a generalized 15-arc-second resolution for the sole purpose of SRTM void-filling. The method selected to generalize the Reference3D from its native resolution to the 15-arc-second resolution is based on selecting a single eleva-tion value from the Reference3D at the center of the 15-arc-second output processing window. This method is comparable to a nearest neighbor resampling technique. The 15-arc-second SPOT 5 Reference3D dataset represents the only contribu-tion to this project by a private commercial company. Vertical heights in SPOT5 Reference3D are referenced to the EGM96 geoid. The 15-arc-second SPOT 5 Reference3D was used for filling SRTM voids in Africa (fig. 4), Central America, Asia, and Australia.
The National Elevation Dataset (NED, http://ned.usgs.gov/) is a seamless dataset with the best available raster eleva-tion data of the conterminous United States, Alaska, Hawaii, and territorial islands. The NED provides elevation data in a consistent datum, elevation unit, and projection. NED data are available nationally (except for Alaska) at resolutions of 1 arc-second (about 30 meters) and 1/3 arc-second (about
Figure 3. SRTM DTED®2 (void-filled) 1-arc-second coverage map.
4 Global Multi-resolution Terrain Elevation Data 2010 (GMTED2010)
10 meters), and in limited areas at 1/9 arc-second (about 3 meters). Vertical heights in NED are referenced to the North American Vertical Datum of 1988 (NAVD 88). In most of Alaska, only lower resolution source data are available. As a result, most NED data for Alaska are at the 2-arc-second (about 60-meter) grid spacing (Gesch, 2007). Vertical heights in the 2-arc-second NED for Alaska are referenced to the National Geodetic Vertical Datum of 1929 (NGVD 29). NED is produced by the USGS (http://www.usgs.gov/) and was used as a void-fill source for the SRTM tiles over the conterminous United States and for all areas in Alaska north of lat 60°N.
The GEODATA 9 Second Digital Elevation Model (DEM, http://www.ga.gov.au/meta/ANZCW0703011541.html) Version 2 is a grid of ground level elevation points covering Australia with a grid spacing of 9 seconds in longitude and latitude (approximately 250 meters) in the Geocentric Datum of Australia 1994 (GDA 94) coordinate system. GEODATA 9 Version 2 is improved over the previous version by includ-ing the national trigonometric data points in the source data and by revising the gridding procedure to model high points and breaklines more precisely. Abrupt changes in landform have also been modeled in Version 2 by incorporating cliff line data in selected areas. Vector-based data included in the gridding include 1:100,000 scale topographic spot elevation heights, 1:250,000 scale streams and contours, and national trigonometric data points supplied from the National Geo-detic Data Base (NGDB). Vertical heights in the GEODATA 9 Second Digital Elevation Model (DEM) are referenced to the Australian Height Datum (AHD). This dataset is produced by
Geoscience Australia (http://www.ga.gov.au/) and was used as a void-fill source for the SRTM tiles over Australia.
A new elevation model for Antarctica (Bamber and oth-ers, 2008) developed at the University of Bristol (http://www.bris.ac.uk/) is distributed by the National Snow and Ice Data Center (NSIDC, http://nsidc.org/). The new Antarctica model is a grid regularly spaced at 1-kilometer intervals and has been created from combined European Radar Satellite (ERS-1) radar data and ICESat laser satellite altimetry. The ERS-1 data are from two long repeat cycles of 168 days initiated in March 1994, and the ICESat Geoscience Laser Altimeter System (GLAS) data (Zwally and others, 2007) are from February 20, 2003, through March 21, 2008. Vertical heights in the Antarctica DEM are referenced to the World Geodetic System 1984 (WGS 84) ellipsoid but were converted to the EGM96 geoid for use in GMTED2010.
A gridded DEM at a 1-kilometer post spacing developed from ERS-1 and Geosat satellite radar altimetry (Bamber and others, 2001) provides the source data for the Greenland portion of GMTED2010. Where the ERS-1 and Geosat radar altimetry were lacking sufficient spatial coverage in bare rock regions, stereophotogrammetric datasets, synthetic aperture radar, and digitized cartographic maps were used. An accu-racy assessment of the Greenland DEM was completed using airborne laser altimetry that had an accuracy between 10 and 12 centimeters. The mean vertical accuracy of the Greenland DEM was determined to be –0.33 ±6.97 meters over the entire ice sheet. Depending on the input data source, the accuracy over bare rock regions ranges from 20 to 200 meters (Bamber
Figure 4. 15-arc-second SPOT 5 Reference3D Africa coverage map.
EXPLANATION
Data Preprocessing 5
and others, 2001). Vertical heights in the Greenland DEM are referenced to the WGS 84 ellipsoid but were converted to the EGM96 Geoid for use in GMTED2010.
The percentage of the global land surface area derived from each GMTED2010 data source is displayed in table 1. GTOPO30 was used only as a source of last choice for filling residual voids in SRTM data.
Data PreprocessingData characteristics such as the projection system, coor-
dinate units, and horizontal and vertical datum vary among the input data sources (tables 2a and 2b). These input data characteristics (except for vertical datum) were standardized to a consistent set of parameters in order to create a seamless global elevation dataset. Every input dataset was ingested on
a tile-by-tile (1° x 1°) basis and transformed to the geographic WGS84 horizontal coordinate system with their respective horizontal units converted to decimal degrees and vertical units changed to integer meters. The Project Raster tool within ArcGIS 9.3 was used to carry out the data transformation to WGS84 using a bilinear resampling option. Vertical datum dif-ferences between the input data sources were not transformed but captured in the spatially referenced metadata, except for Greenland and Antarctica, where NGA transformed the verti-cal datum.
Voids in the SRTM data were filled using the Delta Sur-face Fill (DSF) method developed by NGA (Grohman and oth-ers, 2006). The DSF method replaces the void with fill source posts that are adjusted to the SRTM values found at the void interface. This process causes the fill to more closely follow the trend of the original SRTM surface while retaining the useful characteristics from the source fill data. A total of 1,573 1 x 1-degree SRTM tiles with partial missing data were filled using most of the source datasets listed in table 2a. The accompanying spatially referenced metadata document the source used to fill a particular area. There were three main causes for voids in the SRTM data: a few patches of land in North America were missed because the radar sen-sor did not collect data during 10 orbits of the mission, steep slopes caused shadow layover effects, and certain areas with sandy soils (for example, northern Africa) caused poor radar returns (Farr and others, 2007).
NGA received two files for the Greenland DEM (Bamber and others, 2001): (1) orthometric heights (H) and (2) cor-responding geoid heights (N) at 30-arc-second resolution. File (1) had geographic boundaries of lat 83.75° to 59.4°N, long 74° to 11°W, and file (2) had boundaries of lat 84° to 59.5°N, long 75° to 10°W. Although there was a slight offset between the files, they were aligned and both have a grid spac-ing of 36 arc-seconds in latitude and 90 arc-seconds in longi-tude. After confirming the sign convention used in the geoid height file (2), NGA recovered the WGS 84 ellipsoid heights (h) by adding the geoid height to the orthometric height: H +
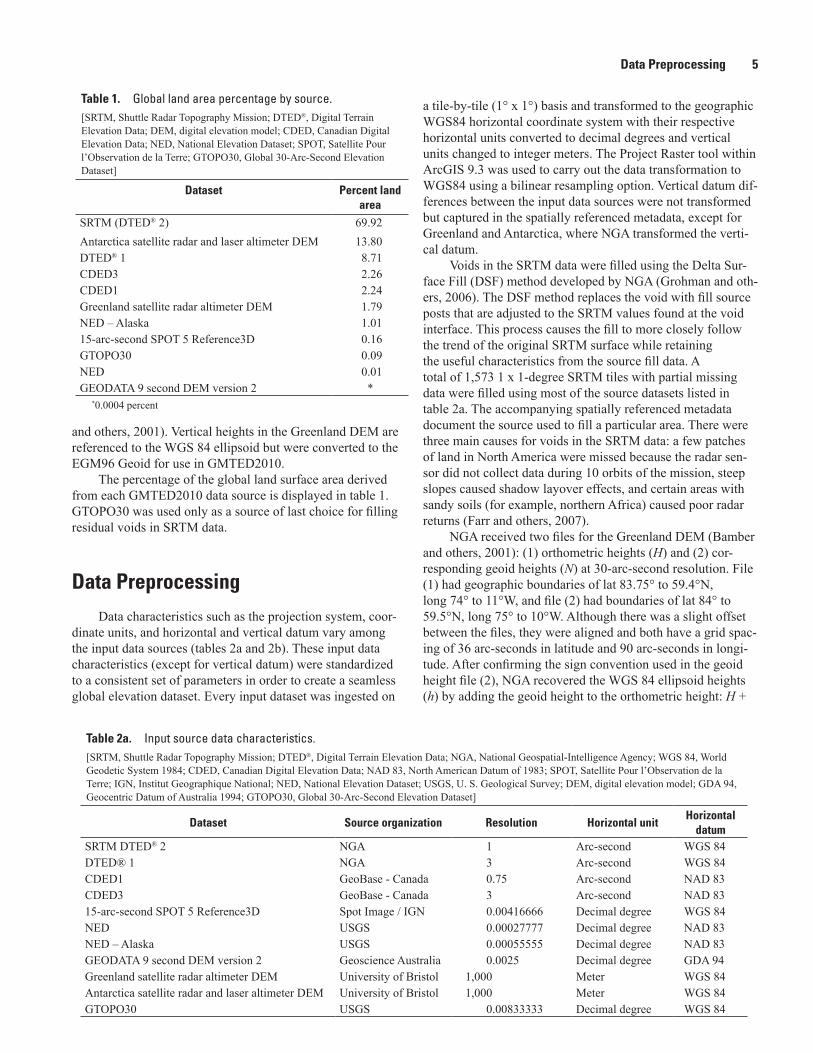
Table 1. Global land area percentage by source.[SRTM, Shuttle Radar Topography Mission; DTED®, Digital Terrain Elevation Data; DEM, digital elevation model; CDED, Canadian Digital Elevation Data; NED, National Elevation Dataset; SPOT, Satellite Pour l’Observation de la Terre; GTOPO30, Global 30-Arc-Second Elevation Dataset]
Dataset Percent land area
SRTM (DTED® 2) 69.92Antarctica satellite radar and laser altimeter DEM 13.80DTED® 1 8.71CDED3 2.26CDED1 2.24Greenland satellite radar altimeter DEM 1.79NED – Alaska 1.0115-arc-second SPOT 5 Reference3D 0.16GTOPO30 0.09NED 0.01GEODATA 9 second DEM version 2 *
*0.0004 percent
Table 2a. Input source data characteristics.[SRTM, Shuttle Radar Topography Mission; DTED®, Digital Terrain Elevation Data; NGA, National Geospatial-Intelligence Agency; WGS 84, World Geodetic System 1984; CDED, Canadian Digital Elevation Data; NAD 83, North American Datum of 1983; SPOT, Satellite Pour l’Observation de la Terre; IGN, Institut Geographique National; NED, National Elevation Dataset; USGS, U. S. Geological Survey; DEM, digital elevation model; GDA 94, Geocentric Datum of Australia 1994; GTOPO30, Global 30-Arc-Second Elevation Dataset]
Dataset Source organization Resolution Horizontal unitHorizontal
datumSRTM DTED® 2 NGA 1 Arc-second WGS 84DTED® 1 NGA 3 Arc-second WGS 84CDED1 GeoBase - Canada 0.75 Arc-second NAD 83CDED3 GeoBase - Canada 3 Arc-second NAD 8315-arc-second SPOT 5 Reference3D Spot Image / IGN 0.00416666 Decimal degree WGS 84NED USGS 0.00027777 Decimal degree NAD 83NED – Alaska USGS 0.00055555 Decimal degree NAD 83GEODATA 9 second DEM version 2 Geoscience Australia 0.0025 Decimal degree GDA 94Greenland satellite radar altimeter DEM University of Bristol 1,000 Meter WGS 84Antarctica satellite radar and laser altimeter DEM University of Bristol 1,000 Meter WGS 84GTOPO30 USGS 0.00833333 Decimal degree WGS 84

6 Global Multi-resolution Terrain Elevation Data 2010 (GMTED2010)
N = h. All values not over Greenland were set to 0.0 (where –0.1 was coded in the orthometric height file (1)). This dataset file was then bilinearly interpolated to the inner 30-arc-second by 30-arc-second grid points. Values correspond to the center of the 30-arc-second equi-angular grid cell. The EGM96 geoid height was then subtracted from the WGS 84 ellipsoid height to produce the EGM96 orthometric height at each 30-arc-second by 30-arc-second grid point. The resulting file was then “land-flagged” using NGA land flagging software in conjunc-tion with the World Vector Shoreline continental outline file. Negative values were set to 0.0. All land values not in Green-land were eliminated and all areas outside Greenland were set to 0.0. Additional error was introduced in the coastline through the interpolation process.
NGA received one file for the Antarctica DEM (Bamber and others, 2008). The DEM is on a 5,601 x 5,601 1-kilometer grid with the center at the South Pole and on a polar stereo projection with the standard parallel at lat 71°S. Elevations are with respect to the WGS 84 ellipsoid. NGA used the GEO-TRANS version 2.3 software to convert the data from polar stereographic to geodetic coordinates. The geoid undulations were computed in meters for the entire Antarctica dataset using EGM96 software with geopotential/correction coef-ficients. The geoid undulations were then subtracted from the ellipsoid heights to produce orthometric heights.
GeneralizationData processing was accomplished by developing
workflows in Python 2.5.1 and accessing Environmental System Research Institute’s (ESRI) ArcGIS 9.3.1 geoprocess-ing framework to perform raster and vector spatial analysis operations. The Geospatial Data Abstraction Library (GDAL), an open source image processing package, was used for the mosaic compilation of each continental area. To more effi-ciently handle the numerous input datasets and to standardize
the proper sequence of processing steps, the production procedures were automated to a great extent by using preset parameter values, scripted routines, and consistent naming conventions for input and output data files.
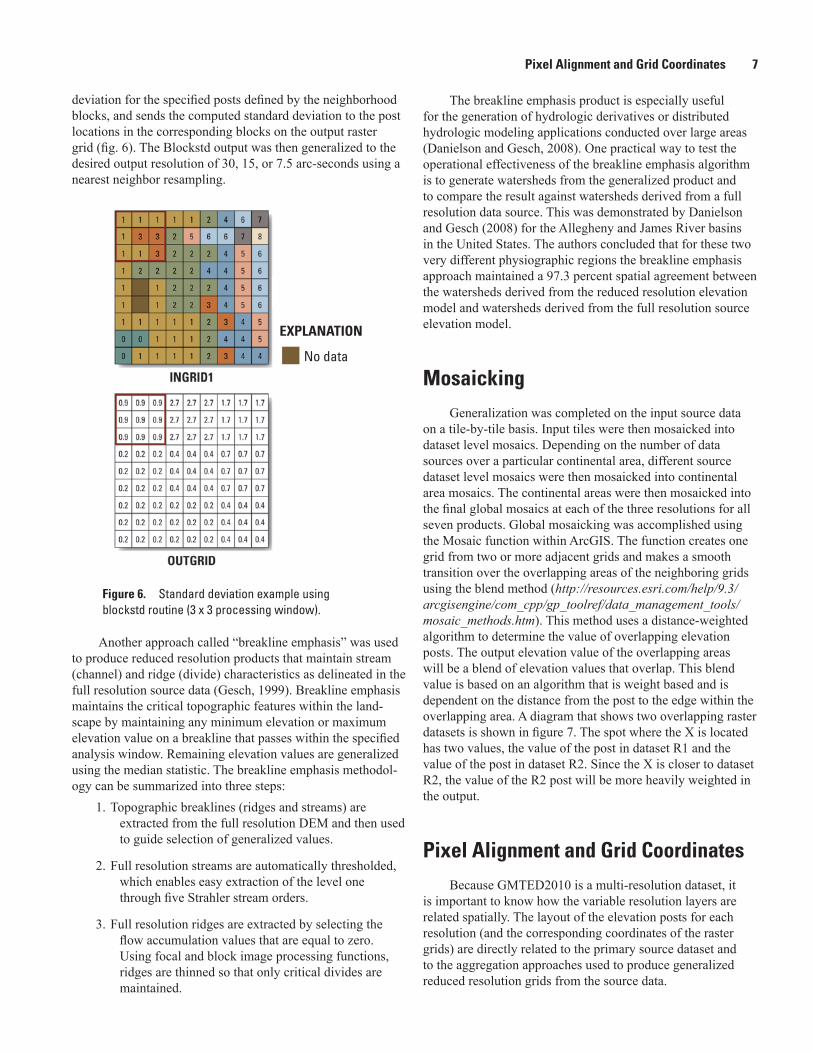
The generalization, or aggregation, approach produces reduced resolution data that represent the minimum, maxi-mum, mean, and median of the full resolution source eleva-tions within the aggregated output cell. The statistical-based products were generated using the Aggregate function within ArcGIS. The Aggregate function resamples an input raster grid to a coarser resolution based on a specified aggregation strategy (Minimum, Maximum, Mean, or Median) (fig. 5). The pixel resolution (horizontal resolution, post-spacing) of the input raster grid is multiplied by the cell factor, which corresponds to the desired pixel resolution of the output raster grid.
In addition, a systematic subsampling of the full resolu-tion source data was used to produce a reduced resolution version at each of the output grid spacings. The systematic subsample product was computed using the Resample func-tion in ArcGIS with the nearest neighbor option. The standard deviation product was generated using a combination of two functions in ArcGIS. A Blockstd function was first applied that partitions the input raster grid into blocks, finds the standard
Figure 5. Aggregate example using the maximum value (3 x 3 processing window).
Table 2b. Input source data characteristics.[SRTM, Shuttle Radar Topography Mission; DTED®, Digital Terrain Elevation Data; EGM96, Earth Gravitational Model 1996; MSL, Mean Sea Level; CDED, Canadian Digital Elevation Data; CVGD28, Canadian Vertical Geodetic Datum of 1928; SPOT, Satellite Pour l’Observation de la Terre; NED, National Elevation Dataset; NAVD 88, North American Vertical Datum of 1988; NGVD 29, National Geodetic Vertical Datum of 1929; DEM, digital elevation model; AHD, Australian Height Datum; WGS 84, World Geodetic System 1984; GTOPO30, Global 30-Arc-Second Elevation Dataset]
Dataset Projection system Vertical unit Vertical datum Surface typeSRTM DTED® 2 Geographic Integer meter EGM 96 Geoid ReflectiveDTED® 1 Geographic Integer meter MSL Bare-EarthCDED1 Geographic Integer meter CVGD28 ReflectiveCDED3 Geographic Integer meter CVGD28 Reflective15-arc-second SPOT 5 Reference3D Geographic Integer meter EGM96 Geoid Reflective NED Geographic Decimal meter NAVD 88 Bare-earthNED – Alaska Geographic Decimal meter NGVD 29 Bare-earthGEODATA 9 second DEM version 2 Geographic Integer meter AHD Bare-earthGreenland satellite radar altimeter DEM Polar stereographic Integer meter WGS 84 Ellipsoid ReflectiveAntarctica satellite radar and laser altimeter DEM Polar stereographic Integer meter WGS 84 Ellipsoid ReflectiveGTOPO30 Geographic Integer meter MSL Bare-earth
Pixel Alignment and Grid Coordinates 7
deviation for the specified posts defined by the neighborhood blocks, and sends the computed standard deviation to the post locations in the corresponding blocks on the output raster grid (fig. 6). The Blockstd output was then generalized to the desired output resolution of 30, 15, or 7.5 arc-seconds using a nearest neighbor resampling.
Another approach called “breakline emphasis” was used to produce reduced resolution products that maintain stream (channel) and ridge (divide) characteristics as delineated in the full resolution source data (Gesch, 1999). Breakline emphasis maintains the critical topographic features within the land-scape by maintaining any minimum elevation or maximum elevation value on a breakline that passes within the specified analysis window. Remaining elevation values are generalized using the median statistic. The breakline emphasis methodol-ogy can be summarized into three steps:
1. Topographic breaklines (ridges and streams) are extracted from the full resolution DEM and then used to guide selection of generalized values.
2. Full resolution streams are automatically thresholded, which enables easy extraction of the level one through five Strahler stream orders.
3. Full resolution ridges are extracted by selecting the flow accumulation values that are equal to zero. Using focal and block image processing functions, ridges are thinned so that only critical divides are maintained.
The breakline emphasis product is especially useful for the generation of hydrologic derivatives or distributed hydrologic modeling applications conducted over large areas (Danielson and Gesch, 2008). One practical way to test the operational effectiveness of the breakline emphasis algorithm is to generate watersheds from the generalized product and to compare the result against watersheds derived from a full resolution data source. This was demonstrated by Danielson and Gesch (2008) for the Allegheny and James River basins in the United States. The authors concluded that for these two very different physiographic regions the breakline emphasis approach maintained a 97.3 percent spatial agreement between the watersheds derived from the reduced resolution elevation model and watersheds derived from the full resolution source elevation model.
MosaickingGeneralization was completed on the input source data
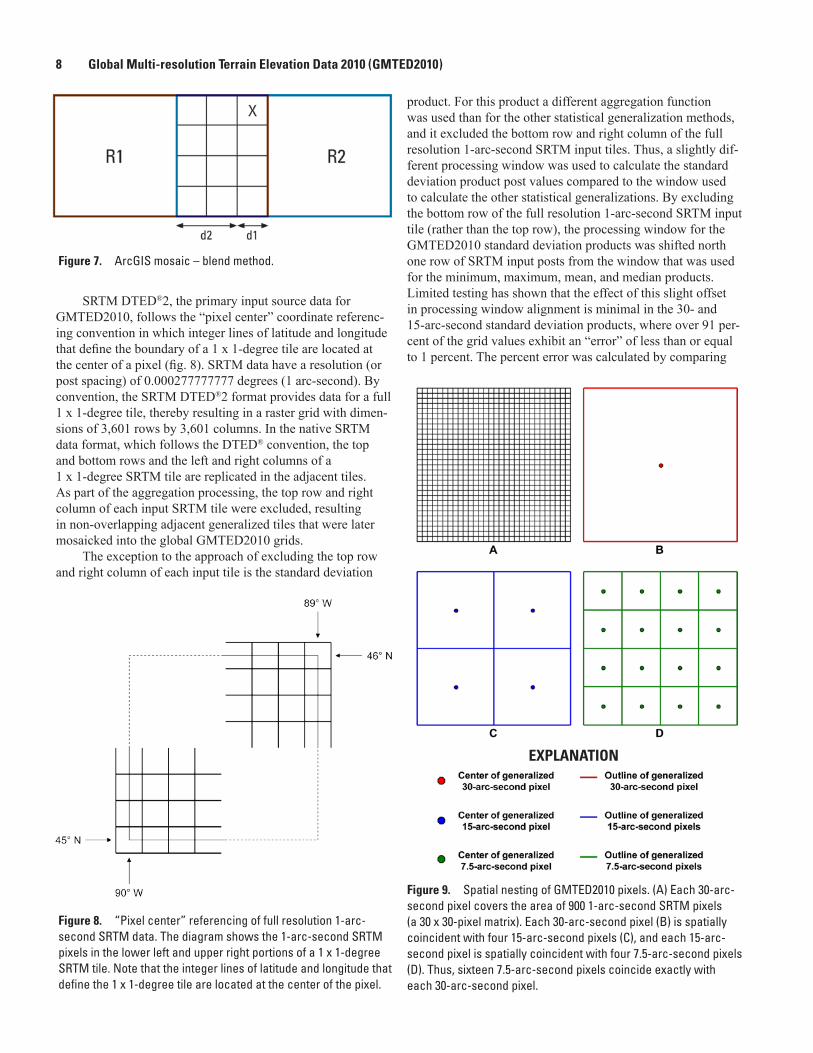
on a tile-by-tile basis. Input tiles were then mosaicked into dataset level mosaics. Depending on the number of data sources over a particular continental area, different source dataset level mosaics were then mosaicked into continental area mosaics. The continental areas were then mosaicked into the final global mosaics at each of the three resolutions for all seven products. Global mosaicking was accomplished using the Mosaic function within ArcGIS. The function creates one grid from two or more adjacent grids and makes a smooth transition over the overlapping areas of the neighboring grids using the blend method (http://resources.esri.com/help/9.3/arcgisengine/com_cpp/gp_toolref/data_management_tools/mosaic_methods.htm). This method uses a distance-weighted algorithm to determine the value of overlapping elevation posts. The output elevation value of the overlapping areas will be a blend of elevation values that overlap. This blend value is based on an algorithm that is weight based and is dependent on the distance from the post to the edge within the overlapping area. A diagram that shows two overlapping raster datasets is shown in figure 7. The spot where the X is located has two values, the value of the post in dataset R1 and the value of the post in dataset R2. Since the X is closer to dataset R2, the value of the R2 post will be more heavily weighted in the output.
Pixel Alignment and Grid CoordinatesBecause GMTED2010 is a multi-resolution dataset, it
is important to know how the variable resolution layers are related spatially. The layout of the elevation posts for each resolution (and the corresponding coordinates of the raster grids) are directly related to the primary source dataset and to the aggregation approaches used to produce generalized reduced resolution grids from the source data.
Figure 6. Standard deviation example using blockstd routine (3 x 3 processing window).
EXPLANATION
No data
8 Global Multi-resolution Terrain Elevation Data 2010 (GMTED2010)
SRTM DTED®2, the primary input source data for GMTED2010, follows the “pixel center” coordinate referenc-ing convention in which integer lines of latitude and longitude that define the boundary of a 1 x 1-degree tile are located at the center of a pixel (fig. 8). SRTM data have a resolution (or post spacing) of 0.000277777777 degrees (1 arc-second). By convention, the SRTM DTED®2 format provides data for a full 1 x 1-degree tile, thereby resulting in a raster grid with dimen-sions of 3,601 rows by 3,601 columns. In the native SRTM data format, which follows the DTED® convention, the top and bottom rows and the left and right columns of a 1 x 1-degree SRTM tile are replicated in the adjacent tiles. As part of the aggregation processing, the top row and right column of each input SRTM tile were excluded, resulting in non-overlapping adjacent generalized tiles that were later mosaicked into the global GMTED2010 grids.
The exception to the approach of excluding the top row and right column of each input tile is the standard deviation
product. For this product a different aggregation function was used than for the other statistical generalization methods, and it excluded the bottom row and right column of the full resolution 1-arc-second SRTM input tiles. Thus, a slightly dif-ferent processing window was used to calculate the standard deviation product post values compared to the window used to calculate the other statistical generalizations. By excluding the bottom row of the full resolution 1-arc-second SRTM input tile (rather than the top row), the processing window for the GMTED2010 standard deviation products was shifted north one row of SRTM input posts from the window that was used for the minimum, maximum, mean, and median products. Limited testing has shown that the effect of this slight offset in processing window alignment is minimal in the 30- and 15-arc-second standard deviation products, where over 91 per-cent of the grid values exhibit an “error” of less than or equal to 1 percent. The percent error was calculated by comparing
Figure 7. ArcGIS mosaic – blend method.
Figure 8. “Pixel center” referencing of full resolution 1-arc-second SRTM data. The diagram shows the 1-arc-second SRTM pixels in the lower left and upper right portions of a 1 x 1-degree SRTM tile. Note that the integer lines of latitude and longitude that define the 1 x 1-degree tile are located at the center of the pixel.
Figure 9. Spatial nesting of GMTED2010 pixels. (A) Each 30-arc-second pixel covers the area of 900 1-arc-second SRTM pixels (a 30 x 30-pixel matrix). Each 30-arc-second pixel (B) is spatially coincident with four 15-arc-second pixels (C), and each 15-arc-second pixel is spatially coincident with four 7.5-arc-second pixels (D). Thus, sixteen 7.5-arc-second pixels coincide exactly with each 30-arc-second pixel.
EXPLANATION

Output Data Products 9
the GMTED2010 standard deviation product grid values with values derived from a nonshifted processing window. The discrepancy between grid values in the GMTED2010 standard deviation products and those that would exist if the process-ing window had not effectively shifted the input SRTM tile by one row will be greatest at the 7.5-arc-second resolution and in low-relief areas. Users are cautioned to consider these issues when using the standard deviation products.
In the GMTED2010 30-arc-second products, each 30-arc-second (0.008333333333 degree) pixel covers the exact area covered by 900 1-arc-second SRTM pixels (a 30 x 30-pixel matrix). Likewise, each pixel in the GMTED2010 15-arc-second (0.004166666666 degree) products covers the exact area of 225 SRTM pixels (a 15 x 15 matrix), and the 7.5-arc-second (0.002083333333 degree) pixels each cover the exact area of a 7.5 x 7.5-pixel matrix of full resolution SRTM pixels. Additionally, the GMTED2010 30-, 15-, and 7.5-arc-second pixels are nested spatially with a 4-to-1 relationship between resolution pairs. Thus, each 30-arc-second pixel is spatially coincident with four 15-arc-second pixels, which are then each coincident with four 7.5-arc-second pixels. In summary, the area covered by 900 SRTM pixels (a 30 x 30 matrix) is exactly spatially coincident with one 30-arc-second pixel, four 15-arc-second pixels, and sixteen 7.5-arc-second pixels (fig. 9).
The spatial relationship of the input SRTM DTED®2 posts and the output GMTED2010 posts is a result of the aggregation approach used to generalize the SRTM data into
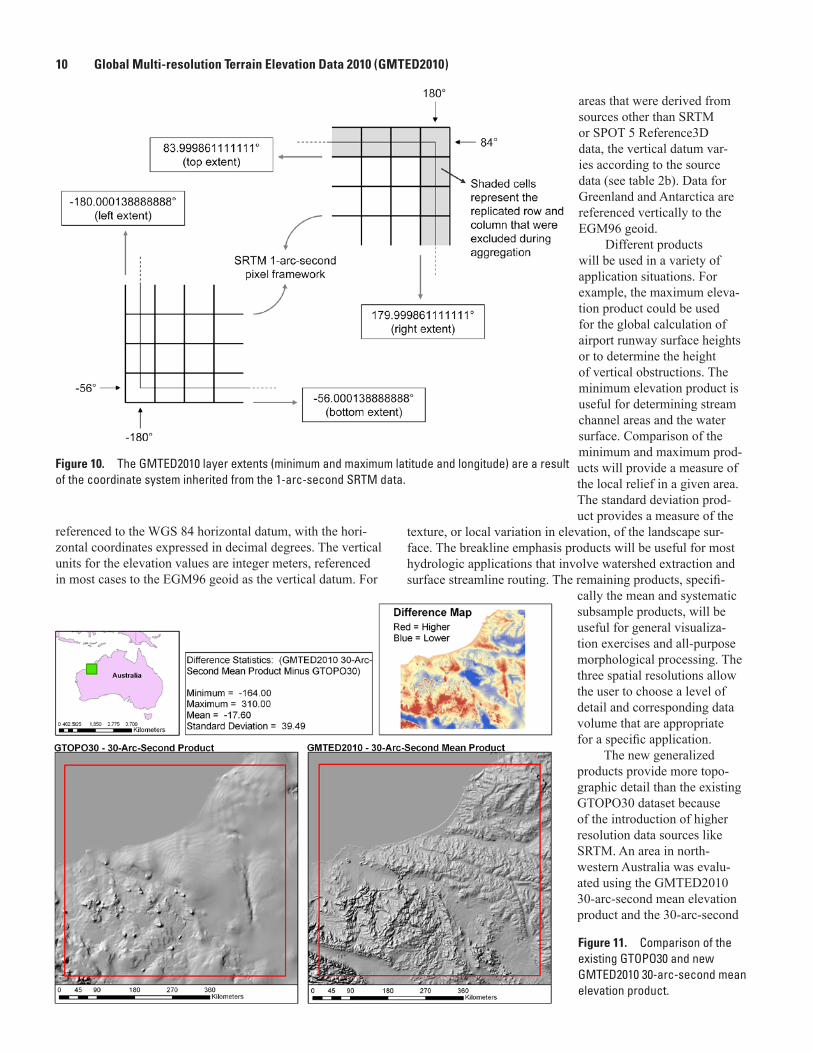
reduced resolution products, resulting in the coordinate refer-encing of the SRTM data being retained by the GMTED2010 data. The extents of the GMTED2010 raster grids in geo-graphic coordinates, the resolutions (pixel dimensions), and the corresponding grid dimensions (rows by columns) are listed in table 3. Note that because of the pixel center refer-encing of the input SRTM data (as described above), the full extent of each GMTED2010 grid as defined by the outside edges of the pixels differs from an integer value of latitude or longitude by 0.000138888888 degree (or 1/2 arc-second) (fig. 10). Users of the legacy GTOPO30 product should note that the coordinate referencing of GMTED2010 and GTOPO30 are not the same. In GTOPO30, the integer lines of latitude and longitude fall directly on the edges of a 30-arc-second pixel. Thus, when overlaying GMTED2010 with GTOPO30 a slight shift of 1/2 arc-second will be observed between the edges of corresponding 30-arc-second pixels.
Output Data ProductsThe new elevation products include the following: mini-
mum, maximum, mean, median, standard deviation, system-atic subsample, and breakline emphasis. There were 7 prod-ucts generated at each of the 3 resolutions, for a total of 21 products. All products are in a geographic coordinate system
Table 3. Geographic extents, resolutions, and raster grid dimensions of GMTED2010 product layers.[std. dev., standard deviation]
ProductResolution
(decimal de-grees)
West extent: mini-mum X-coordi-nate (longitude)
South extent: minimum
Y-coordinate (latitude)
East extent: maximum
X-coordinate (longitude)
North extent: maximum
Y-coordinate (latitude)
Rows Columns
30 a
rc-s
econ
ds
Minimum
0.0083333333 -180.0001388888
-56.0001388888
179.9998611111
83.9998611111 16,800
43,200
Maximum -56.0001388888 83.9998611111 16,800Mean * -90.0001388888 * 83.9998611111 * 20,880 *Median -56.0001388888 83.9998611111 16,800Std. dev. -56.0001388888 83.9998611111 16,800Sample * -90.0001388888 * 83.9998611111 * 20,880 *Breakline -56.0001388888 83.9998611111 16,800
15 a
rc-s
econ
ds
Minimum
0.0041666666 -180.0001388888 -56.0001388888 179.9998611111 83.9998611111 33,600 86,400
MaximumMeanMedianStd. dev.SampleBreakline
7.5
arc-
seco
nds
Minimum
0.0020833333 -180.0001388888 -56.0001388888 179.9998611111 83.9998611111 67,200 172,800
MaximumMeanMedianStd. dev.SampleBreakline
* The mean 30-arc-second and sample 30-arc-second layers contain Greenland and Antarctica (the other layers do not contain these landmasses).
10 Global Multi-resolution Terrain Elevation Data 2010 (GMTED2010)
referenced to the WGS 84 horizontal datum, with the hori-zontal coordinates expressed in decimal degrees. The vertical units for the elevation values are integer meters, referenced in most cases to the EGM96 geoid as the vertical datum. For
areas that were derived from sources other than SRTM or SPOT 5 Reference3D data, the vertical datum var-ies according to the source data (see table 2b). Data for Greenland and Antarctica are referenced vertically to the EGM96 geoid.
Different products will be used in a variety of application situations. For example, the maximum eleva-tion product could be used for the global calculation of airport runway surface heights or to determine the height of vertical obstructions. The minimum elevation product is useful for determining stream channel areas and the water surface. Comparison of the minimum and maximum prod-ucts will provide a measure of the local relief in a given area. The standard deviation prod-uct provides a measure of the
texture, or local variation in elevation, of the landscape sur-face. The breakline emphasis products will be useful for most hydrologic applications that involve watershed extraction and surface streamline routing. The remaining products, specifi-
cally the mean and systematic subsample products, will be useful for general visualiza-tion exercises and all-purpose morphological processing. The three spatial resolutions allow the user to choose a level of detail and corresponding data volume that are appropriate for a specific application.
The new generalized products provide more topo-graphic detail than the existing GTOPO30 dataset because of the introduction of higher resolution data sources like SRTM. An area in north-western Australia was evalu-ated using the GMTED2010 30-arc-second mean elevation product and the 30-arc-second
Figure 10. The GMTED2010 layer extents (minimum and maximum latitude and longitude) are a result of the coordinate system inherited from the 1-arc-second SRTM data.
Figure 11. Comparison of the existing GTOPO30 and new GMTED2010 30-arc-second mean elevation product.
Output Data Products 11
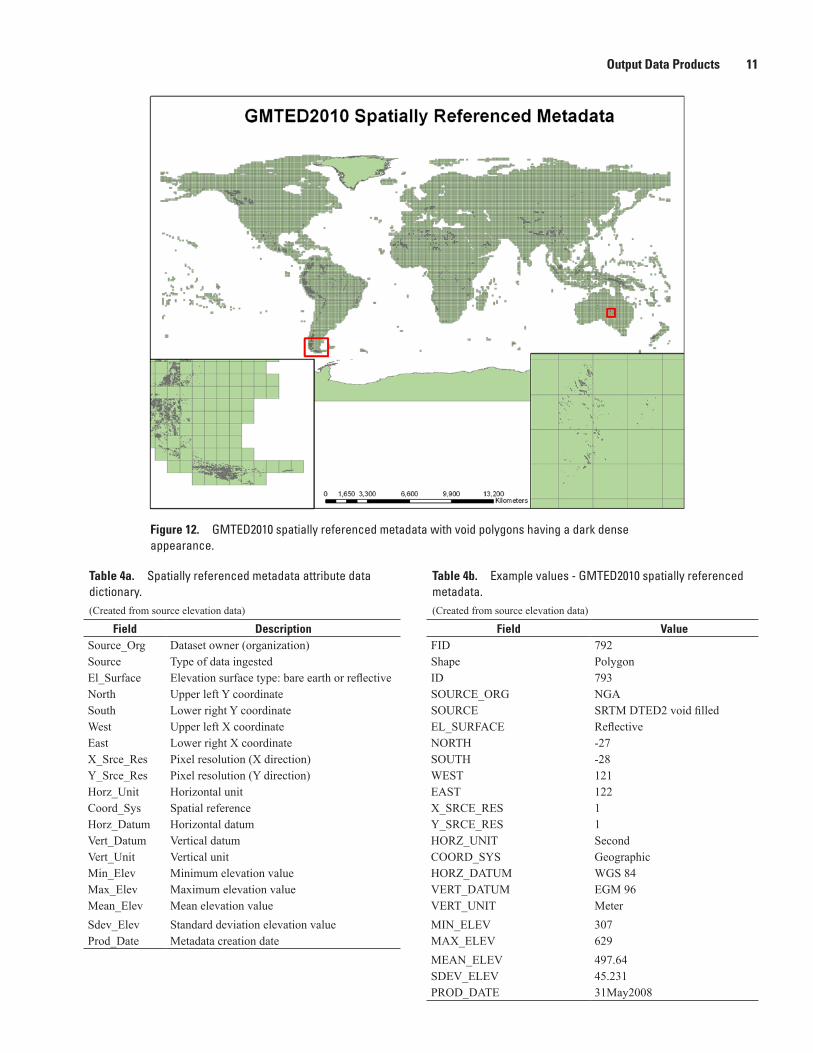
Figure 12. GMTED2010 spatially referenced metadata with void polygons having a dark dense appearance.
Table 4a. Spatially referenced metadata attribute data dictionary.(Created from source elevation data)
Field DescriptionSource_Org Dataset owner (organization)Source Type of data ingestedEl_Surface Elevation surface type: bare earth or reflective North Upper left Y coordinateSouth Lower right Y coordinateWest Upper left X coordinateEast Lower right X coordinateX_Srce_Res Pixel resolution (X direction)Y_Srce_Res Pixel resolution (Y direction)Horz_Unit Horizontal unitCoord_Sys Spatial referenceHorz_Datum Horizontal datumVert_Datum Vertical datum Vert_Unit Vertical unit Min_Elev Minimum elevation valueMax_Elev Maximum elevation valueMean_Elev Mean elevation valueSdev_Elev Standard deviation elevation valueProd_Date Metadata creation date
Table 4b. Example values - GMTED2010 spatially referenced metadata.(Created from source elevation data)
Field ValueFID 792Shape PolygonID 793SOURCE_ORG NGASOURCE SRTM DTED2 void filledEL_SURFACE ReflectiveNORTH -27SOUTH -28WEST 121EAST 122X_SRCE_RES 1Y_SRCE_RES 1HORZ_UNIT SecondCOORD_SYS GeographicHORZ_DATUM WGS 84VERT_DATUM EGM 96VERT_UNIT MeterMIN_ELEV 307MAX_ELEV 629MEAN_ELEV 497.64SDEV_ELEV 45.231PROD_DATE 31May2008

12 Global Multi-resolution Terrain Elevation Data 2010 (GMTED2010)
GTOPO30 product to contrast the differences in elevation and topographic detail (fig. 11). The difference map in the upper right corner of figure 11 represents the GMTED2010 30-arc-second mean product minus GTOPO30 and displays positive differences (GMTED2010 elevation is higher) in red and negative differences (GMTED2010 elevation is lower) in blue. In this example, the GMTED2010 30-arc-second mean product is on average 18 meters lower than GTOPO30. The new GMTED2010 mean elevation product displays more pronounced topographic detail in all areas, but especially in the regions with flats and ridges.
Because the input data used for GMTED2010 come from multiple sources, spatially referenced metadata have been generated to accompany the output GMTED2010 elevation datasets (fig. 12). The spatially referenced metadata are con-tained within a geospatial polygon dataset that contains foot-prints of each of the source dataset input areas. The attributes of the source footprint polygons describe the characteristics of each input dataset used to generate the suite of GMTED2010 products (tables 4a and 4b).
Data Formats
Generalized Elevation Products – Seamless Global Coverage (GRID)
Global raster data are provided in the ESRI ArcGrid for-mat. The grid defines geographic space as an array of equally sized square grid cells (pixels) arranged in rows and columns. Each grid cell stores a numeric value that represents a geo-graphic attribute (such as elevation or surface slope) for that unit of space. Each grid cell is referenced by its x,y coordinate location. Many commercially available and freeware software packages can read the ArcGrid format. Detail about file names and sizes is provided in appendix 1. North of 84 degrees the void value is assigned to “NoData.”
Generalized Elevation Products – Tile-Based (GeoTIFF Image Format)
All tiled raster data are provided in the GeoTIFF image format. GeoTIFF is an open source metadata standard which allows georeferencing information to be embedded within a TIFF raster image file. The additional information includes map projection, coordinate system, ellipsoid, datums, and everything else necessary to establish the exact spatial refer-ence for the file. The GeoTIFF format is fully compliant with TIFF version 6.0, so software that does not read or interpret the specialized metadata will still be able to open a GeoTIFF image file. North of 84 degrees the void value is assigned to -32768.
Spatially Referenced Metadata (ESRI Vector Shapefile Format)
The spatially referenced metadata are provided in the ESRI Shapefile format. The ESRI Shapefile is a vector data format developed and regulated by ESRI as an open specifica-tion for data interoperability among ESRI and other software products. A “shapefile” commonly refers to a collection of files with “.shp,” “.shx,” “.dbf,” and other extensions with a common prefix name. The actual vector data are stored in the file with the “.shp” extension; however, this file alone is incomplete for distribution because the other supporting files are required.
Accuracy Assessment
Raster-Based Assessment
A raster-based comparison was conducted between GMTED2010 and GTOPO30. The calculated minimum, maxi-mum, mean difference, and standard deviation for the 30-arc-second systematic subsample and mean products compared to GTOPO30 are presented in table 5. The mean difference for both GMTED2010 30-arc-second products indicates about a 4.3-meter bias compared to GTOPO30. One likely reason for the positive bias is that the elevation of SRTM areas with foliage represents vegetation canopy elevations. The stan-dard deviation of the differences is approximately 91 meters between GTOPO30 and the GMTED2010 30-arc-second products, indicating considerable variation in the elevation differences between the datasets. The error associated with the elevation differences could also be attributed to the different-source data used in each elevation model.
Table 5. GMTED2010 global accuracy assessment: raster-based comparison: GMTED2010 30-arc-second products minus GTOPO30 (meters).[GMTED2010, global multi-resolution terrain elevation data 2010; GTOPO30, Global 30-arc-second elevation dataset]
Minimum MaximumMean
differenceStandard deviation
GMTED2010 30-arc-second systematic subsample mi-nus GTOPO30
-4,118 3,314 4.394 91.440
GMTED2010 30-arc-second mean minus GTOPO30
-4,130 3,311 4.381 90.124

Accuracy Assessment 13
Absolute Vertical Accuracy Assessment
The absolute vertical accuracy of the GMTED2010 prod-ucts was measured by spatial comparison with a control point dataset from the NGA. The control dataset contains nearly 1.6 million coordinate points (latitude/longitude) photogram-metrically derived from optical stereo imagery. The vertical accuracy of the control points is better than 10 meters at 90 percent confidence, or approximately 6-meter root mean square error (RMSE). Using the GMTED2010 systematic subsample 30-arc-second product as a base starting point, all control points that were located within water or along the land/water interface and that had an elevation value of zero meters were removed. There were 64,200 control points with a value of zero meters from GMTED2010 that were also located within the land/water interface. Using all non-zero control points, the standard deviation of the differences was calculated from the systematic subsample product, and a standard deviation threshold of 3 was applied to the differences (table 6). This resulted in a final set of control points with outliers removed. The purpose of the threshold is to remove outliers that are likely present in the reference control point dataset.
Using the thresholded control points, elevation values were extracted from the product layers (breakline emphasis, systematic subsample, mean, and median) at the 30-, 15-, and 7.5-arc-second resolutions. The Extract Values to Points tool in ArcGIS was used to extract the elevation value at each control point location. During the extract process, an interpola-tion option within the tool was applied. This option allows the value of the DEM at the control point location to be calcu-lated from the adjacent pixels with valid values using bilinear interpolation. The statistical package “R” was then used to compute the aggregate validation statistics. (“R” is a language and environment for statistical computing and graphics that provides a wide variety of statistical and graphical techniques and is highly extensible.) The first step was to import the con-trol point shapefile containing the extracted elevation values. Following the import, the elevation difference between the GMTED2010 product layers (breakline emphasis, systematic subsample, mean, and median) and the NGA control points was computed. The minimum, maximum, mean, and standard deviation along with the RMSE values were then calculated. The statistics were aggregated and the overall vertical accu-racy for each product layer was calculated along with a further breakdown based on the input source type.
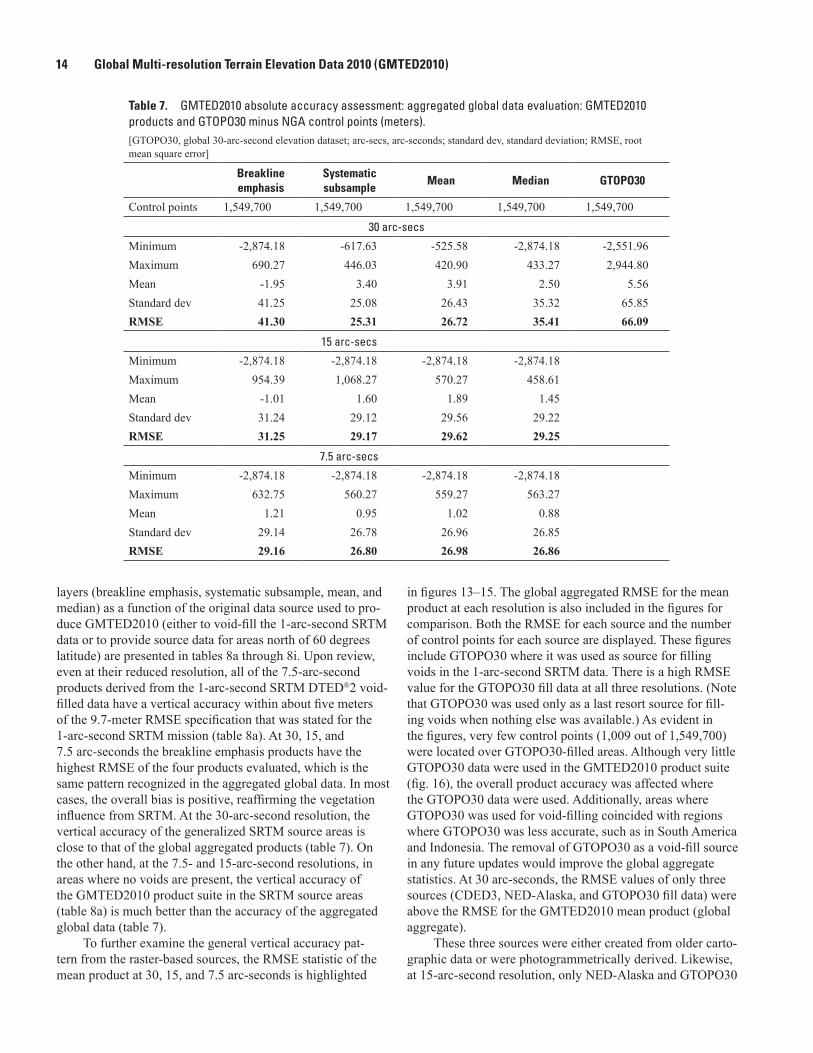
The minimum error, maximum error, mean error, stan-dard deviation of errors, and RMSE for the GMTED2010 product layers (breakline emphasis, systematic subsample, mean, and median) derived from a comparison with more than 1.5 million global control points are presented in table 7. Because GMTED2010 contains 21 different raster elevation products at three spatial resolutions, there will not be one accuracy assessment number associated with the entire product suite. Instead, four of the individual products (break-line emphasis, systematic subsample, mean, and median) will have an accuracy assessment number. The other three GMTED2010 products (minimum, maximum, and standard deviation) were not evaluated against the reference control points because these products were not generated with aggre-gation methods that select representative elevation values, but with methods that describe the spread of the elevation values.
The systematic subsample product proved to have the lowest RMSE at the 30-arc-second, 15-arc-second, and 7.5-arc-second resolutions, probably because the systematic subsample generalization is selecting actual discrete values from input source data. Taking the full-resolution SRTM DTED®2 as an example, 900 1-arc-second elevation values were used to calculate the value for the single corresponding elevation at the 30-arc-second resolution. As expected, the breakline emphasis product had the highest RMSE values at all three resolutions because the breakline algorithm explic-itly selects elevation values away from the mean by using the minimum, maximum, and median values from the input source data. The mean error in all product layers indicates a small positive bias with the exception that the breakline emphasis product is negative at the 30- and 15-arc-second resolutions. The breakline emphasis method likely gives preference to lower elevations to enforce stream drainage patterns. The 7.5-arc-second products as a group had the lowest RMSE values, which is expected because of their resolution, but their overall accuracy numbers were relatively close to those of the 15-arc-second and two of the 30-arc-second products. The accuracy results of GTOPO30 when compared to the control points are listed in table 7. All of the evaluated GMTED2010 product layers surpassed the absolute vertical accuracy of GTOPO30.
GMTED2010 was constructed from 11 different raster-based sources. The control points spatially cover all the continents, with the exception of Antarctica and where the Australian GEODATA 9-second DEM was used as a void-fill source. Accuracy assessments for the GMTED2010 product
Table 6. Removal of outliers beyond three standard deviations from the mean difference between NGA control point dataset and the GMTED2010 systematic subsample product.
Total non-zero
control point
Standard deviation of difference
3 Standard deviation threshold
Total outlier points
Percent of outlier
points
Total final control
points
Systematic subsample 30-arc-second resolution
1,592,053 60.9365 182.8095 42,353 2.66 1,549,700
14 Global Multi-resolution Terrain Elevation Data 2010 (GMTED2010)
layers (breakline emphasis, systematic subsample, mean, and median) as a function of the original data source used to pro-duce GMTED2010 (either to void-fill the 1-arc-second SRTM data or to provide source data for areas north of 60 degrees latitude) are presented in tables 8a through 8i. Upon review, even at their reduced resolution, all of the 7.5-arc-second products derived from the 1-arc-second SRTM DTED®2 void-filled data have a vertical accuracy within about five meters of the 9.7-meter RMSE specification that was stated for the 1-arc-second SRTM mission (table 8a). At 30, 15, and 7.5 arc-seconds the breakline emphasis products have the highest RMSE of the four products evaluated, which is the same pattern recognized in the aggregated global data. In most cases, the overall bias is positive, reaffirming the vegetation influence from SRTM. At the 30-arc-second resolution, the vertical accuracy of the generalized SRTM source areas is close to that of the global aggregated products (table 7). On the other hand, at the 7.5- and 15-arc-second resolutions, in areas where no voids are present, the vertical accuracy of the GMTED2010 product suite in the SRTM source areas (table 8a) is much better than the accuracy of the aggregated global data (table 7).
To further examine the general vertical accuracy pat-tern from the raster-based sources, the RMSE statistic of the mean product at 30, 15, and 7.5 arc-seconds is highlighted
in figures 13–15. The global aggregated RMSE for the mean product at each resolution is also included in the figures for comparison. Both the RMSE for each source and the number of control points for each source are displayed. These figures include GTOPO30 where it was used as source for filling voids in the 1-arc-second SRTM data. There is a high RMSE value for the GTOPO30 fill data at all three resolutions. (Note that GTOPO30 was used only as a last resort source for fill-ing voids when nothing else was available.) As evident in the figures, very few control points (1,009 out of 1,549,700) were located over GTOPO30-filled areas. Although very little GTOPO30 data were used in the GMTED2010 product suite (fig. 16), the overall product accuracy was affected where the GTOPO30 data were used. Additionally, areas where GTOPO30 was used for void-filling coincided with regions where GTOPO30 was less accurate, such as in South America and Indonesia. The removal of GTOPO30 as a void-fill source in any future updates would improve the global aggregate statistics. At 30 arc-seconds, the RMSE values of only three sources (CDED3, NED-Alaska, and GTOPO30 fill data) were above the RMSE for the GMTED2010 mean product (global aggregate).
These three sources were either created from older carto-graphic data or were photogrammetrically derived. Likewise, at 15-arc-second resolution, only NED-Alaska and GTOPO30
Table 7. GMTED2010 absolute accuracy assessment: aggregated global data evaluation: GMTED2010 products and GTOPO30 minus NGA control points (meters).[GTOPO30, global 30-arc-second elevation dataset; arc-secs, arc-seconds; standard dev, standard deviation; RMSE, root mean square error]
Breakline emphasis
Systematic subsample
Mean Median GTOPO30
Control points 1,549,700 1,549,700 1,549,700 1,549,700 1,549,700
30 arc-secs
Minimum -2,874.18 -617.63 -525.58 -2,874.18 -2,551.96Maximum 690.27 446.03 420.90 433.27 2,944.80Mean -1.95 3.40 3.91 2.50 5.56Standard dev 41.25 25.08 26.43 35.32 65.85RMSE 41.30 25.31 26.72 35.41 66.09
15 arc-secs
Minimum -2,874.18 -2,874.18 -2,874.18 -2,874.18Maximum 954.39 1,068.27 570.27 458.61Mean -1.01 1.60 1.89 1.45Standard dev 31.24 29.12 29.56 29.22RMSE 31.25 29.17 29.62 29.25
7.5 arc-secs
Minimum -2,874.18 -2,874.18 -2,874.18 -2,874.18Maximum 632.75 560.27 559.27 563.27Mean 1.21 0.95 1.02 0.88Standard dev 29.14 26.78 26.96 26.85RMSE 29.16 26.80 26.98 26.86
Accuracy Assessment 15
Table 8b. GMTED2010 absolute accuracy assessment by source: CDED1: GMTED2010 products minus NGA control points (meters).[arc-secs, arc-seconds; standard dev, standard deviation; RMSE, root mean square error]
Breakline emphasis
Systematic subsample
Mean Median
Control points 13,799 13,799 13,799 13,79930 arc-secs
Minimum -328.31 -179.85 -241.66 -233.66Maximum 437.23 176.35 159.46 157.46Mean -2.62 0.56 0.51 0.06Standard dev 21.57 16.70 17.87 17.07RMSE 21.73 16.71 17.88 17.07
15 arc-secsMinimum -165.63 -142.10 -141.66 -140.10Maximum 182.54 104.05 100.46 100.05Mean -1.42 0.39 0.36 0.21Standard dev 11.09 9.68 10.35 9.88RMSE 11.18 9.68 10.36 9.89
7.5 arc-secsMinimum -157.37 -73.37 -70.10 -72.37Maximum 124.11 106.35 63.30 68.30Mean -0.17 0.97 0.57 0.55Standard dev 7.92 6.95 6.67 6.49RMSE 7.92 7.01 6.69 6.52
Table 8a. GMTED2010 absolute accuracy assessment by source: SRTM DTED®2: GMTED2010 products minus NGA control points (meters).[arc-secs, arc-seconds; standard dev, standard deviation; RMSE, root mean square error]
Breakline emphasis
Systematic subsample
Mean Median
Control points 1,427,975 1,427,975 1,427,975 1,427,97530 arc-secs
Minimum -595.21 -617.63 -525.58 -508.63Maximum 690.27 446.03 414.70 433.27Mean -1.83 3.51 4.01 3.00Standard dev 33.09 25.06 26.12 24.96RMSE 33.14 25.30 26.43 25.14
15 arc-secsMinimum -586.79 -955.58 -741.58 -960.58Maximum 954.39 1,068.27 570.27 458.61Mean -0.65 2.06 2.37 1.90Standard dev 19.09 15.06 15.91 15.25RMSE 19.10 15.20 16.09 15.37
7.5 arc-secsMinimum -765.58 -1,225.58 -1,156.58 -1,225.58Maximum 631.79 560.27 559.27 563.27Mean 1.65 1.37 1.45 1.30Standard dev 15.27 9.74 10.26 9.94RMSE 15.36 9.83 10.36 10.02
16 Global Multi-resolution Terrain Elevation Data 2010 (GMTED2010)
Table 8c. GMTED2010 absolute accuracy assessment by source: CDED3: GMTED2010 products minus NGA control points (meters).[arc-secs, arc-seconds; standard dev, standard deviation; RMSE, root mean square error]
Breakline emphasis
Systematic subsample
Mean Median
Control points 10,863 10,863 10,863 10,86330 arc-secs
Minimum -411.31 -185.15 -402.31 -412.31Maximum 421.45 181.56 284.16 280.16Mean -3.87 0.43 0.11 -0.79Standard dev 34.88 30.11 32.67 31.24RMSE 35.09 30.11 32.66 31.25
15 arc-secsMinimum -218.43 -213.42 -267.31 -225.52Maximum 182.59 169.28 165.28 169.28Mean -3.36 -0.32 -0.37 -0.51Standard dev 23.52 22.35 23.22 22.73RMSE 23.76 22.35 23.22 22.74
7.5 arc-secsMinimum -835.53 -222.52 -216.52 -217.52Maximum 632.75 197.94 195.57 196.57Mean -0.23 0.29 -0.18 -0.25Standard dev 39.59 21.14 20.80 20.72RMSE 39.59 21.15 20.80 20.72
Table 8d. GMTED2010 absolute accuracy assessment by source: DTED®1: GMTED2010 products minus NGA control points (meters).[arc-secs, arc-seconds; standard dev, standard deviation; RMSE, root mean square error]
Breakline emphasis
Systematic subsample
Mean Median
Control points 100,371 100,371 100,371 100,37130 arc-secs
Minimum -425.80 -281.24 -256.34 -281.24Maximum 433.80 267.35 247.74 250.35Mean 1.33 1.87 2.17 1.39Standard dev 27.17 23.34 23.61 22.96RMSE 27.21 23.41 23.71 23.00
15 arc-secsMinimum -281.24 -281.24 -281.24 -281.24Maximum 266.94 266.94 240.94 264.94Mean -0.07 1.15 1.29 1.11Standard dev 18.40 17.27 17.55 17.33RMSE 18.40 17.30 17.60 17.37
7.5 arc-secsMinimum -281.24 -281.24 -281.24 -281.24Maximum 372.94 375.94 354.94 372.94Mean 1.12 0.94 0.94 0.93Standard dev 15.80 15.53 15.61 15.55RMSE 15.84 15.55 15.64 15.57

Accuracy Assessment 17
Table 8e. GMTED2010 absolute accuracy assessment by source: GTOPO30 fill data: GMTED2010 products minus NGA control points (meters).[arc-secs, arc-seconds; standard dev, standard deviation; RMSE, root mean square error]
Breakline emphasis
Systematic subsample
Mean Median
Control points 1,009 1,009 1,009 1,00930 arc-secs
Minimum -575.79 -617.63 -525.58 -508.63Maximum 463.96 391.45 414.70 416.70Mean -6.88 -0.10 2.97 1.34Standard dev 103.64 93.39 97.47 96.23RMSE 103.82 93.34 97.47 96.20
15 arc-secsMinimum -586.79 -955.58 -741.58 -960.58Maximum 438.23 473.61 381.45 458.61Mean -3.58 0.48 1.17 -0.38Standard dev 87.07 96.35 89.78 95.67RMSE 87.10 96.30 89.74 95.63
7.5 arc-secsMinimum -765.58 -1,225.58 -1,156.58 -1,225.58Maximum 514.61 489.61 445.61 486.61Mean 4.30 0.90 0.93 0.91Standard dev 89.36 102.58 97.49 101.51RMSE 89.42 102.53 97.44 101.46
Table 8f. GMTED2010 absolute accuracy assessment by source: NED: GMTED2010 products minus NGA control points (meters).[arc-secs, arc-seconds; standard dev, standard deviation; RMSE, root mean square error]
Breakline emphasis
Systematic subsample
Mean Median
Control points 286 286 286 28630 arc-secs
Minimum -31.65 -34.65 -30.65 -31.65Maximum 16.78 9.46 9.78 10.78Mean -4.49 -4.31 -4.30 -4.29Standard dev 7.02 6.77 6.66 6.74RMSE 8.32 8.02 7.92 7.98
15 arc-secsMinimum -30.65 -29.62 -30.65 -31.65Maximum 9.46 8.46 8.46 8.46Mean -4.10 -4.12 -4.18 -4.15Standard dev 6.88 6.72 6.71 6.79RMSE 8.00 7.87 7.90 7.95
7.5 arc-secsMinimum -37.65 -33.65 -32.65 -33.65Maximum 12.78 8.46 8.46 8.46Mean -4.07 -4.17 -4.14 -4.13Standard dev 7.01 6.82 6.81 6.83RMSE 8.09 7.99 7.96 7.97

18 Global Multi-resolution Terrain Elevation Data 2010 (GMTED2010)
Table 8g. GMTED2010 absolute accuracy assessment by source: NED-Alaska: GMTED2010 products minus NGA control points (meters).[arc-secs, arc-seconds; standard dev, standard deviation; RMSE, root mean square error]
Breakline emphasis
Systematic subsample
Mean Median
Control points 13,485 13,485 13,485 13,48530 arc-secs
Minimum -473.03 -182.03 -407.03 -433.31Maximum 564.00 182.91 420.90 387.90Mean 8.84 4.75 8.15 6.53Standard dev 61.13 31.18 54.99 54.03RMSE 61.76 31.54 55.58 54.42
15 arc-secsMinimum -260.33 -261.63 -267.31 -269.63Maximum 248.00 233.90 228.04 232.04Mean 2.12 4.29 4.50 4.15Standard dev 30.81 30.77 31.24 30.83RMSE 30.88 31.06 31.56 31.11
7.5 arc-secsMinimum -164.63 -164.63 -163.63 -164.63Maximum 234.10 155.46 155.46 155.46Mean 2.73 3.21 3.14 3.05Standard dev 18.77 18.75 18.93 18.69RMSE 18.97 19.03 19.18 18.94
Table 8h. GMTED2010 absolute accuracy assessment by source: 15-arc-second SPOT5 Reference3D: GMTED2010 products minus NGA control points (meters).[arc-secs, arc-seconds; standard dev, standard deviation; RMSE, root mean square error]
Breakline emphasis
Systematic subsample
Mean Median
Control points 2,574 2,574 2,574 2,57430 arc-secs
Minimum -419.30 -196.09 -238.09 -238.09Maximum 255.91 169.76 221.40 229.40Mean 2.96 1.87 1.75 1.28Standard dev 31.19 22.32 23.85 23.81RMSE 31.33 22.39 23.91 23.84
15 arc-secsMinimum -196.24 -183.77 -183.77 -180.77Maximum 225.99 234.40 204.40 233.40Mean 3.86 2.15 2.11 1.98Standard dev 21.69 17.17 17.41 17.66RMSE 22.03 17.30 17.53 17.77
7.5 arc-secsMinimum -156.24 -132.14 -131.14 -133.14Maximum 210.54 230.40 186.40 228.40Mean 4.11 1.46 1.33 1.42Standard dev 18.40 18.31 17.83 18.18RMSE 18.85 18.36 17.87 18.23
Accuracy Assessment 19
Figure 13. GMTED2010 mean product: 30-arc-second error statistics by source (points in red are the number of control points used for each source).
7.92
17.88 23.91 23.7126.43 26.72 32.66
55.58
97.47
0150,000300,000450,000600,000750,000900,0001,050,0001,200,0001,350,0001,500,0001,650,000
0102030405060708090
100110
NAT
ION
AL G
EOSP
ATIA
L-IN
TELL
IGEN
CEAG
ENCY
CON
TROL
POI
NT
COUN
T BY
SOU
RCEGMTED2010 versus NGA control points
ROOT
MEA
N S
QUAR
E ER
ROR
(RM
SE),
IN M
ETER
S
Figure 14. GMTED2010 mean product: 15-arc-second error statistics by source (points in red are the number of control points used for each source).
7.95 10.3616.09 17.53 17.60 23.22
29.62 31.56
89.74
0150,000300,000450,000600,000750,000900,0001,050,0001,200,0001,350,0001,500,0001,650,000
0102030405060708090
100110
GMTED2010 versus NGA control points
NAT
ION
AL G
EOSP
ATIA
L-IN
TELL
IGEN
CEAG
ENCY
CON
TROL
POI
NT
COUN
T BY
SOU
RCE
ROOT
MEA
N S
QUAR
E ER
ROR
(RM
SE),
IN M
ETER
S
Table 8i. GMTED2010 absolute accuracy assessment by source: Greenland: GMTED2010 products minus NGA control points (meters).[arc-secs, arc-seconds; standard dev, standard devia-tion; RMSE, root mean square error]
Systematic subsample
Control points 80730 arc-secs
Minimum -182.66Maximum 182.22Mean 14.13Standard dev 74.56RMSE 75.85
20 Global Multi-resolution Terrain Elevation Data 2010 (GMTED2010)
Figure 15. GMTED2010 mean product: 7.5-arc-second error statistics by source (points in red are the number of control points used for each source).
6.69 7.97 10.36
15.64 17.87 19.18 20.8026.98
97.44
0150,000300,000450,000600,000750,000900,0001,050,0001,200,0001,350,0001,500,0001,650,000
0102030405060708090
100110
NAT
ION
AL G
EOSP
ATIA
L-IN
TELL
IGEN
CEAG
ENCY
CON
TROL
POI
NT
COUN
T BY
SOU
RCE
ROOT
MEA
N S
QUAR
E ER
ROR
(RM
SE),
IN M
ETER
S
GMTED2010 versus NGA control points
Figure 16. GMTED2010: percent land area by source.
Figure 17. GMTED2010: global aggregated product accuracy.
69.92
13.808.71
2.26 2.24 1.79 1.01 0.16 0.09 0.01 0.00040
10
20
30
40
50
60
70
80
PERC
ENT
ARE
A
GMTED2010 Percent land area by source
41.30
25.31
35.41
66.09
31.25 29.17 29.62 29.2529.16
0
10
20
30
40
50
60
70
Breaklineemphasis
Systematicsubsample
Mean Median GTOPO30
GMTED2010 versus NGA control points
30 arc-seconds
15 arc-seconds
7.5 arc-seconds
ROOT
MEA
N S
QUAR
E ER
ROR,
(RM
SE),
IN M
ETER
S
26.80 26.72 26.98 26.86
Summary 21
fill data were above the overall mean product RMSE. The effect of using GTOPO30 is quite noticeable in the 7.5-arc-second mean product; if GTOPO30 were removed in these locations, the overall product RMSE would be closer to 21 meters instead of its current mark of 27 meters. Even accu-rate data at the 30-arc-second resolution would have a higher RMSE when represented at the 7.5-arc-second resolution because the control points are likely to be more distant from the original source location. Another recognizable pattern is that the four primary raster-based sources (CDED1, CDED3, DTED®1, and NED-Alaska) that were used to populate land areas north of 60 degrees all had vertical accuracy estimates close to or under the overall mean product RMSE, except for CDED3 at the 30-arc-second resolution and NED-Alaska at the 15- and 30-arc-second resolutions.
Finally, sources such as NED and CDED1 that are con-structed from large-scale cartographic and remotely sensed imagery inputs have the lowest RMSE values in all three reso-lutions. NED, a bare-earth DEM source, and CDED1, mostly a bare-earth DEM, provide a good fit relationship with the absolute control points. Overall, the global aggregated vertical accuracy of GMTED2010 can be summarized in terms of the resolution and RMSE of the products (table 7). At 30 arc-sec-onds, the RMSE range is between 25 and 42 meters; at 15 arc-seconds, the RMSE range is between 29 and 32 meters; and at 7.5 arc-seconds, the RMSE range is between 26 and 30 meters (fig. 17). These vertical accuracy results are an improvement over the existing global 30-arc-second digital elevation model GTOPO30, with a vertical accuracy against the same refer-ence control points of 66 meters RMSE. If absolute vertical accuracy is considered as a primary dataset characteristic, the 15-arc-second resolution may have the most value in the GMTED2010 product suite. Its vertical accuracy is relatively close to that of the 7.5-arc-second resolution products, but the 15-arc-second products have only one quarter of the data volume. In addition to the improvement in vertical accuracy over GTOPO30, the overall strengths of GMTED2010 include more currency and an increased level of detail within the 30-, 15-, and 7.5-arc-second spatial resolutions.
Limitations and CaveatsDepending on the input data source, some artifacts are
apparent in the generalized elevation products. For example, some areas derived from non-SRTM DTED®1, especially in Eurasia, exhibit a striping artifact, most likely because of the production method of the DTED®. The artifact is evident in the full resolution data, but remains noticeable even in the generalized elevation product versions. Another pattern seen in some areas derived from DTED® and CDED is a blocky appearance, which is a reflection of the 1-degree tiling struc-ture of the full resolution DTED® and CDED. Any area that was void-filled with GTOPO30 may be problematic because of the relatively poorer quality of the GTOPO30 source data.
The accompanying spatially referenced metadata can be used to quickly identify those areas. Fortunately, the land area void-filled with GTOPO30 is very small and represents only 0.09 percent of the global land surface.
The absolute minimum and maximum elevations for certain continents may not match published numbers. For example, in South America and North America the maximum values are higher than recorded actual land values because of slight anomalies that were introduced during the filling of the SRTM data voids with the best available input source data. The best available fill source data in South America was GTOPO30, while the 3-arc-second CDED data was the best for certain areas in North America.
Multiple algorithms and functions within ArcGIS were used to process and generalize the full resolution source data into the reduced resolution elevation products. Output data coordinates of the generalized products appear to vary slightly between the various ArcGIS algorithms and functions. For example, the nearest neighbor resampling function was used to create the systematic subsample product, and its coordinates are slightly different from those products created using the aggregate function. All generalized products have the same number of rows and columns but some truncating or rounding in the coordinate precision may be observed. Any such differ-ences in coordinates are only seen in the digits far to the right of the decimal point in the floating point numeric format of the coordinates. These small discrepancies in the floating point format geographic coordinates (decimal degrees) translate to distances of much less than one meter, which are insignificant at the spatial resolution of GMTED2010 products.
As with all digital geospatial products, users of GMTED2010 must be aware of certain characteristics of the dataset (such as resolution, accuracy, methods of production and any resulting artifacts) in order to better judge its suitabil-ity for a specific application. A characteristic of GMTED2010 that renders it unsuitable for one application may have no rel-evance as a limiting factor for its use in a different application.
SummaryGMTED2010 provides a new level of detail in global
topographic data. Previously, the best available global DEM was GTOPO30 with a horizontal grid spacing of 30 arc-seconds. The GMTED2010 product suite contains seven new raster elevation products for each of the 30-, 15-, and 7.5-arc-second spatial resolutions and incorporates the cur-rent best available global elevation data. The new elevation products have been produced using the following aggregation methods: minimum elevation, maximum elevation, mean elevation, median elevation, standard deviation of elevation, systematic subsample, and breakline emphasis. Metadata have also been produced to identify the source and attributes of all the input elevation data used to derive the output products. Many of these products will be suitable for various regional

22 Global Multi-resolution Terrain Elevation Data 2010 (GMTED2010)
and continental applications, such as climate modeling, continental-scale land cover mapping, extraction of drainage features for hydrologic modeling, and geometric and radiomet-ric correction of medium and coarse resolution satellite image data. The global aggregated vertical accuracy of GMTED2010 can be summarized in terms of the resolution and RMSE of the products with respect to a global set of control points (esti-mated global accuracy of 6 m RMSE) provided by NGA. At 30 arc-seconds, the GMTED2010 RMSE range is between 25 and 42 meters; at 15 arc-seconds, the RMSE range is between 29 and 32 meters; and at 7.5 arc-seconds, the RMSE range is between 26 and 30 meters. GMTED2010 is a major improvement in consistency and vertical accuracy over GTOPO30, which has a 66 m RMSE globally compared to the same NGA control points. In areas where new sources of higher resolution data were available, the GMTED2010 products are substantially better than the aggregated global statistics; however, large areas still exist, particularly above 60 degrees North latitude, that lack good elevation data. As new data become available, especially in areas that have poor coverage in the current model, it is hoped that new versions of GMTED2010 might be generated and thus gradually improve the global model.
References Cited
Australian Government, 2006, Geoscience Australia, GEO-DATA 9 Second Digital Elevation Model (DEM-9S) Version 3 available online at http://www.ga.gov.au/meta/ANZCW0703011541.html. (Accessed May 6, 2011.)
Australian Government, 2011, Geoscience Australia home page at http://www.ga.gov.au/. (Accessed May 6, 2011.)
Bamber, J.L., Ekholm, S., and Krabill, W.B., 2001, A new, high-resolution digital elevation model of Greenland fully validated with airborne laser altimeter data: Journal of Geo-physical Research: Solid Earth, v. 106, no. B4, p. 6,733–6,745.
Bamber, J.L., Gomez-Dans, J.L., and Griggs, J.A., 2008, A new 1 km digital elevation model of the Antarctic derived from combined satellite radar and laser data – Part 1: Data and methods: The Cryosphere Discuss., v. 2, p. 811–841.
Bouillon, A., Bernard, M., Gigord, P., Orsoni, A., Rudowski, V., and Baudoin, A., 2006, SPOT 5 HRS geometric perfor-mances—using block adjustment as a key issue to improve quality of DEM generation: ISPRS Journal of Photogram-metry and Remote Sensing, v. 60, no. 3, p. 134–146.
Danielson, J.J., and Gesch, D.B., 2008, An enhanced global elevation model generalized from multiple higher resolution source datasets: International Archives of the Photogram-metry, Remote Sensing and Spatial Information Sciences, v. XXXVII, Part B4, Beijing, p. 1,857–1,864.
ESRI, Mosaic Methods: ArcGIS Resource Center at http://resources.esri.com/help/9.3/arcgisengine/com_cpp/gp_toolref/data_management_tools/mosaic_methods.htm. (Accessed May 6, 2011.)
Farr, T.G., Rosen, P.A., Caro, E., Crippen, R., Duren, R., Hensley, S., Kobrick, M., Paller, M., Rodriguez, E., Roth, L., Seal, D., Shaffer, S., Shimada, J., Umland, J., Werner, M., Oskin, M., Burbank, D., and Alsdorf, D., 2007, The Shuttle Radar Topography Mission: Reviews of Geophysics, v. 45, RG2004, doi:10.1029/2005RG000183.
GeoBase, 2011, Canadian Digital Elevation Data at http://www.geobase.ca/geobase/en/data/cded/index.html. (Accessed May 6, 2011.)
Gesch, D.B., 1994, Topographic data requirements for EOS global change research: U.S. Geological Survey Open-File Report 94–626, 60 p.
Gesch, D.B., 1999, Chapter 31 – The effects of DEM general-ization methods on derived hydrologic features, in Lowell, Kim, and Jaton, Annick, eds., Spatial Accuracy Assess-ment—Land Information Uncertainty in Natural Resources: Chelsea, Mich., Ann Arbor Press, p. 255–262.
Gesch, D.B., 2007, The National Elevation Dataset, in Maune, D., ed., Digital Elevation Model Technologies and Applica-tions: The DEM Users Manual (2d ed.): Bethesda, Md., American Society for Photogrammetry and Remote Sens-ing, p. 99–118.
Gesch, D.B., and Larson, K.S., 1998, Techniques for devel-opment of global 1-kilometer digital elevation models, in Proceedings, Pecora Thirteen, Human Interactions with the Environment—Perspectives from Space, Sioux Falls, South Dakota, August 20–22, 1996 (CD-ROM), American Society of Photogrammetry and Remote Sensing, Bethesda, Md., p. 568–572.
Gesch, D.B., Verdin, K.L., and Greenlee, S.K., 1999, New Land Surface Digital Elevation Model Covers the Earth: Eos, Transactions, American Geophysical Union, v. 80, no. 6, p. 69–70.
Government of Canada, Natural Resources Canada, Centre for Topographic Information, 2007, Canadian Digital Elevation Data, Level 1 product specifications, Edition 3.0: GeoBase, 48 p., available online at http://www.geobase.ca/doc/specs/pdf/GeoBase_product_specs_CDED1_3_0.pdf.
Grohman, G., Kroenung, G., and Strebeck, J. 2006, Filling SRTM Voids—The Delta Surface Fill Method: Photogram-metric Engineering & Remote Sensing, v. 72, no. 3, p. 213–216.
Institut Geographique National, 2011, Institut Geographique National home page at http://www.ign.fr/. (Accessed May 6, 2011.)
References Cited 23
Jenson, S.K., and Domingue, J.O., 1988, Extracting Topo-graphic Structure from Digital Elevation Data for Geo-graphic Information System Analysis: Photogrammetric Engineering & Remote Sensing, v. 54, p. 1,593–1,600.
Lehner, B., Verdin, K., and Jarvis, A., 2008, New Global Hydrography Derived From Spaceborne Elevation Data: Eos, Transactions, American Geophysical Union, v. 89, no. 10, p. 93–94.
NASA Jet Propulsion Laboratory, 2009, Shuttle Radar Topog-raphy Mission home page at http://www2.jpl.nasa.gov/srtm/. (Accessed May 6, 2011.)
National Geospatial-Intelligence Agency (NGA), 2010. http://earth-info.nga.mil/GandG/wgs84/gravitymod/ (last refer-enced Jan. 11, 2011).
National Snow and Ice Data Center, 2011, National Snow and Ice Data Center home page at http://nsidc.org/. (Accessed May 6, 2011.)
Slater, J.A., Garvey, G., Johnston, C., Haase, J., Heady, B., Kroenung, G., and Little, J., 2006, The SRTM Data “Fin-ishing” Process and Products: Photogrammetric Engineer-ing & Remote Sensing, v. 72, no. 3, p. 237–247.
Spot Image, 2008, Astrium GEO-Information Services home page at http://www.spot.com/?countryCode=US&languageCode=. (Accessed May 6, 2011.)
Spot Image, 2005, Reference3D product description, Ver-sion 5.2: Spot Image, 17 p., available online at http://www.spot.com/automne_modules_files/standard/public/p453_e66fdc8d9baeb629a19beb53be67339dReference3D-Product_descriptionv5-2.pdf.
U.S. Geological Survey, 2006, National Elevation Dataset home page at http://ned.usgs.gov/. (Accessed May 6, 2011.)
U.S. Geological Survey, 2011, U.S. Geological Survey home page at http://www.usgs.gov/. (Accessed May 6, 2011.)
Verdin, K.L., and Greenlee, S.K., 1996, Development of continental scale digital elevation models and extraction of hydrographic features, in Proceedings, Third International Conference/Workshop on Integrating GIS and Environ-mental Modeling: Santa Fe, N. Mex., January 21–26, 1996, National Center for Geographic Information and Analysis, Santa Barbara, Calif.
Zwally, H.J., Schutz, B.E., Bentley, C.R., Bufton, J., Her-ring, T., Minster, J.F., Spinhirne, J., and Thomas, R., 2007, GLAS/ ICESat L2 Antarctic and Greenland Ice Sheet Altim-etry Data V428, September 25, 2003–November 27, 2006, National Snow and Ice Data Center, Digital Media, Boulder, Colo.


Appendix
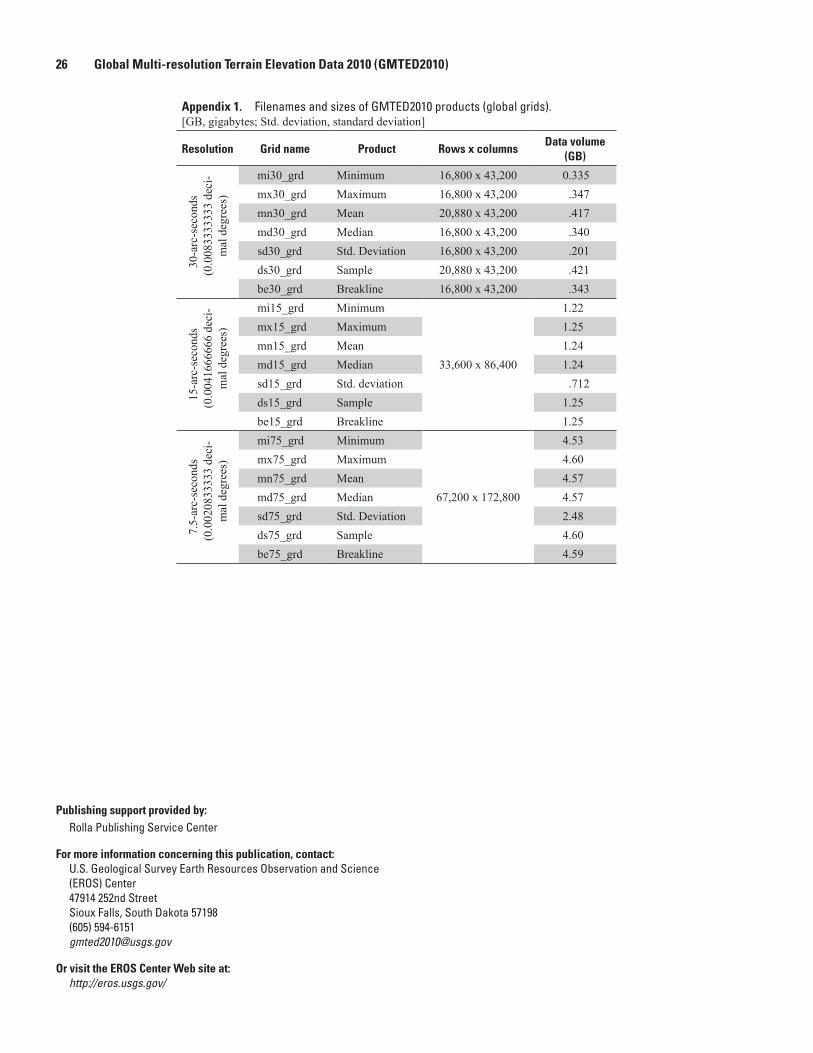
26 Global Multi-resolution Terrain Elevation Data 2010 (GMTED2010)
Appendix 1. Filenames and sizes of GMTED2010 products (global grids).[GB, gigabytes; Std. deviation, standard deviation]
Resolution Grid name Product Rows x columnsData volume
(GB)
30-a
rc-s
econ
ds
(0.0
0833
3333
3 de
ci-
mal
deg
rees
)
mi30_grd Minimum 16,800 x 43,200 0.335 mx30_grd Maximum 16,800 x 43,200 .347mn30_grd Mean 20,880 x 43,200 .417md30_grd Median 16,800 x 43,200 .340sd30_grd Std. Deviation 16,800 x 43,200 .201ds30_grd Sample 20,880 x 43,200 .421be30_grd Breakline 16,800 x 43,200 .343
15-a
rc-s
econ
ds
(0.0
0416
6666
6 de
ci-
mal
deg
rees
)
mi15_grd Minimum
33,600 x 86,400
1.22mx15_grd Maximum 1.25mn15_grd Mean 1.24md15_grd Median 1.24sd15_grd Std. deviation .712ds15_grd Sample 1.25be15_grd Breakline 1.25
7.5-
arc-
seco
nds
(0.0
0208
3333
3 de
ci-
mal
deg
rees
)
mi75_grd Minimum
67,200 x 172,800
4.53mx75_grd Maximum 4.60mn75_grd Mean 4.57md75_grd Median 4.57sd75_grd Std. Deviation 2.48ds75_grd Sample 4.60be75_grd Breakline 4.59
Publishing support provided by: Rolla Publishing Service Center
For more information concerning this publication, contact: U.S. Geological Survey Earth Resources Observation and Science (EROS) Center 47914 252nd Street Sioux Falls, South Dakota 57198 (605) 594-6151
Or visit the EROS Center Web site at: http://eros.usgs.gov/

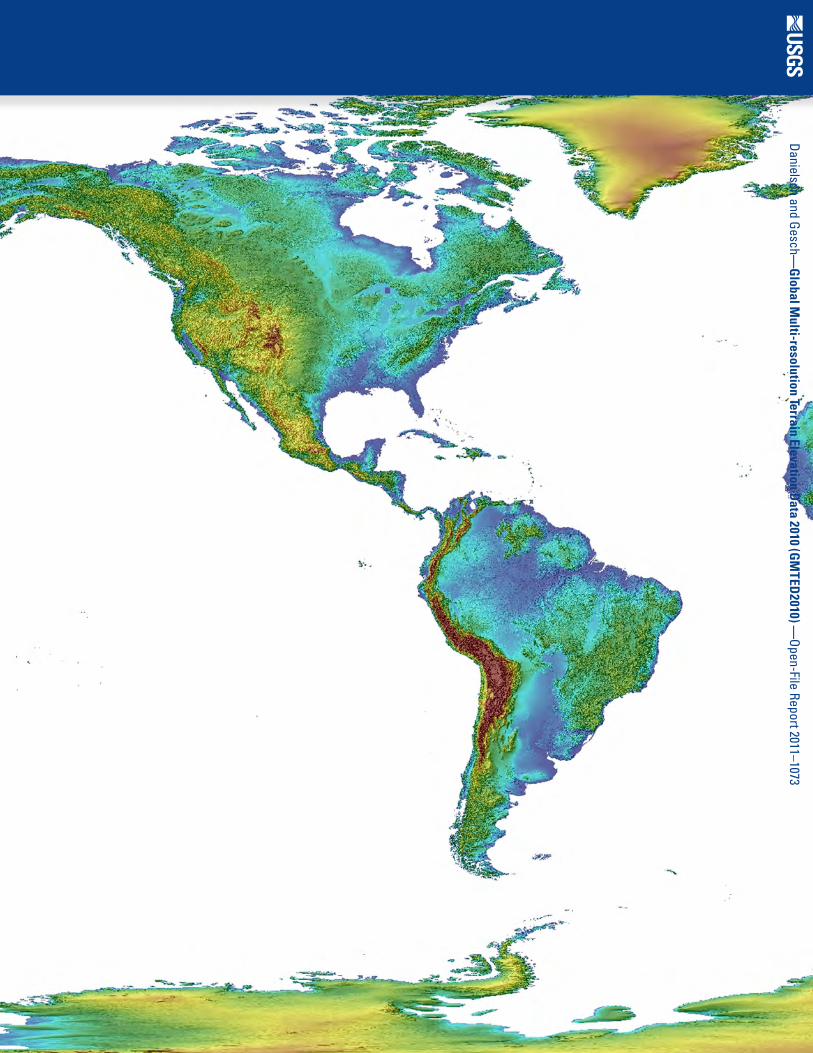
Danielson and Gesch—Global M
ulti-resolution Terrain Elevation Data 2010 (G
MTED
2010) —Open-File Report 2011–1073
Related Documents


