INDUSTRIAL MARKETS Global Mining Reporting Survey 2006 ENERGY & NATURAL RESOURCES

Welcome message from author
This document is posted to help you gain knowledge. Please leave a comment to let me know what you think about it! Share it to your friends and learn new things together.
Transcript
INDUSTRIAL MARKETS
Global MiningReporting Survey
2006
ENERGY & NATURAL RESOURCES

This publication contains specific extracts from the publicly available information available through theAnnual Reports of companies that we have desk-top surveyed. All extracts are referenced in relationto the public document and the date of the specific Annual Report.

The network of key centers means that we haveimmediate access to the latest industry knowledge,skills and resources, allowing us to deliver qualityservice to our clients regardless of geographicalborders. The network develops current and forwardlooking industry understanding through globalexperience, knowledge sharing, industry training andsharing of resources.
KPMG is a global network of professional firmsproviding audit, tax and advisory services. We operatein 144 countries and have more than 104,000professionals working in member firms around theworld. The independent member firms of the KPMGnetwork are affiliated with KPMG International, a Swiss cooperative. KPMG International provides noclient services.
KPMG member firms serve the market leaders withinthe mining industry, providing audit or other services tomany of the clients included in this survey.
We supplement our tailored services with acomprehensive range of thought leadership materialswhich provide a useful reference guide to operativesworking in the industry.
Through its member firms,KPMG has invested extensivelyin developing a high qualitymining industry team led by an established network ofCenters of Excellence for themining industry.
KPMG’sGlobal Energyand NaturalResourcesPractice
global min ing report ing sur vey 2006 | 1
Source: Rio Tinto Iron Ore
KPMG International is delighted to present the results of itsGlobal Mining Reporting Survey 2006, the third triennial survey of its kind.
Foreword
2 | g loba l min ing report ing sur vey 2006
As a nation, Australia has enjoyed spectacular successin the mining industry in recent years and KPMG'sAustralian member firm was delighted to have theopportunity to host the survey team from around theworld and to project manage the research and thoughtleadership process this year.
Since the last survey, change has continued for theindustry at a furious pace and in every part of theworld. As this publication goes to print, there are nosigns that the boom times currently being enjoyed bythe industry in many regions will end in the near future.
The company make up of the survey has also changed.Some of the companies we covered in the 2003 surveyhave disappeared, some are in negotiations as we go toprint and the survey list has been refreshed with theaim of capturing the current global sector leaders. Newadditions to our the list reflect the increasingimportance to the industry of some of the world'sfastest growing economies: Brazil, Russia, India, Chileand China.
The 2003 KPMG Mining Reporting Survey said thefollowing about the period between 2003 and 2006;
“An opportunity exists for mining companies to take abigger picture view, treating new corporate governancerequirements and the move to IFRS as another elementof the opportunity to optimize organizationalperformance rewards”.
The adoption of International Financial ReportingStandards (IFRS) by many countries around the world,including Australia, United Kingdom and many othercountries in the European Union has resulted in theneed for a large number of companies to replace theirexisting accounting policies with new policies that arecompliant with IFRS.
Of the 44 companies covered by this survey, 11 havetransitioned to IFRS in the current reporting period, anda further 12 will need to transition when Canada movesto the IFRS framework in 2011. Further, the proliferationof new guidance, issued under the IFRS framework inthe last two years, has caused accounting policychanges to comply with new IFRS guidance in a further9 of our 44 companies surveyed.
The widespread introduction of IFRS has meant thatthere has been progress towards the much promisedconvergence of accounting practices for the industry.This time, the survey is based largely on just threereporting frameworks: U.S. GAAP, Canadian GAAP andIFRS, and given the amount of change, much of ourcommentary is around the judgments being applied inthe adoption of IFRS.
Using this survey
The members of KPMG's Global Mining practice will bediscussing the results of this survey with our firms'clients into 2007 and we encourage your review ofwhat your peers in the industry are reporting.
Obviously, care must be taken in applying theobservations outlined in this document in a fastchanging environment. While we hope this surveyprovides a useful guide to you, we would encourageyou to consult your local KPMG firms' professional forguidance that is tailored to your circumstances.
Alison Kitchen - Audit Partner
Chairman KPMG's Energy & Natural Resources Practice in Australia
Lee Hodgkinson- Audit Partner
Global Mining Segment Leader

The 2005 adoption of IFRS has reduced the variety ofnational GAAP choices, but this has not removeddiversity of application. Nor has it resolved thequestion of how to recognize, measure, and reportchanges in mineral reserves and resources. The IASB isacutely aware of the need for improvements in this area.
Progress is being made towards convergence of thetechnical definitions of reserves and resources throughconsultation among industry representative bodies ofmining and petroleum engineers and geologists. Thiswill provide the basis for both operational andinvestment decisions, as well as for financial reporting.
Towards the end of 2007, the IASB expects to publish aresearch paper of its preliminary views on how thesedefinitions can be used to improve financial reporting.The research will address changes to both accountingand disclosure.
The need to align internal and external reporting isrecognized by all participants in capital markets. But isthe view of business “through the eyes ofmanagement” the best way to achieve this?
Greater rigor in accounting for financial instrumentsshould have lead to improved disclosures in thefinancial statements of the management of commodityprice, exchange rate and interest rate risk. But manycompanies have chosen to report on only part of these risks.
Normal sales contracts embodying such risks oftenqualify for an exemption from derivatives accountingrequirements. This can result in accounting anomalies,particularly in companies that have an active riskmanagement program, as a result of the artificialboundary created between operating and treasuryactivities.
Adjusted earnings disclosures focus on gains andlosses on non-hedge derivatives, but little informationis presented about the impact of hedging on currentand future years' earnings.
This survey is helpful in gaining an understanding ofhow some of the global leaders in mining haveaddressed difficult financial reporting issues.
Indeed the industry seems to have solved these issueswithout resorting to the interpretative process of IFRIC.
But investors are seeking answers to other questions,particularly about sensitivity to changing economics.For example, if metal prices fall by 20 percent, whatimpact will that have on the reserves and resources,and the life of the mine? At what price level will amine's assets suffer an impairment, and when will itcease to cover its cash operating costs?
The industry has long been a front runner withvoluntary disclosures. Development and use of marketbased pricing information would enhance investor andregulator perceptions of the reliability of estimates.Now is the time to imprint the hallmark of value basedinformation in investor communications.
g loba l min ing report ing sur vey 2006 | 3
The publication of this third KPMG survey underscoressignificant changes in financial reporting by the world's major mining companies.
Robert P. Garnett
IASB Board Member andIFRIC Chair
Source: Rio Tinto Iron Ore
4 | g loba l min ing report ing sur vey 2006
1 Key findings 6
2 Results - financial reporting 10
2.1 Critical accounting estimates and judgments 11
2.2 Business combinations 13
2.3 Exploration and evaluation expenditures 15
2.4 Development costs 19
2.5 Mining and processing ore 22
2.6 Product sales 29
2.7 Mine closure and rehabilitation 32
2.8 Impairment 34
2.9 Accounting for joint venture arrangements 36
2.10 Financial instruments 39
2.11 Functional and reporting currencies 46
2.12 Tax 48
2.13 Segment reporting 50
2.14 Transition to IFRS 60
3 Results – non financial reporting 64
3.1 Corporate governance and reporting 65
3.2 Board of directors and committee structure 67
3.3 CEO/CFO certification 69
3.4 Remuneration reporting 70
3.5 Sarbanes-Oxley 72
3.6 Reserves 74
3.7 Other non-financial disclosures in the annual report 76
4 Results – corporate social responsibility reporting 80
4.1 CSR/sustainability sections in annual reports 82
4.2 Separate CSR/sustainability reports 84
4.3 Key issues 87
4.4 Emerging standards and guidelines 87
5 Future accounting developments 88
6 History of the KPMG Global Mining Reporting Survey 92
7 Companies surveyed 94
8 Abbreviations 96
9 Contributors 98
10 Contacts 100
Contents
global min ing report ing sur vey 2006 | 5
1. Key findings
6 | g loba l min ing report ing sur vey 2006
globa l min ing report ing sur vey 2006 | 7
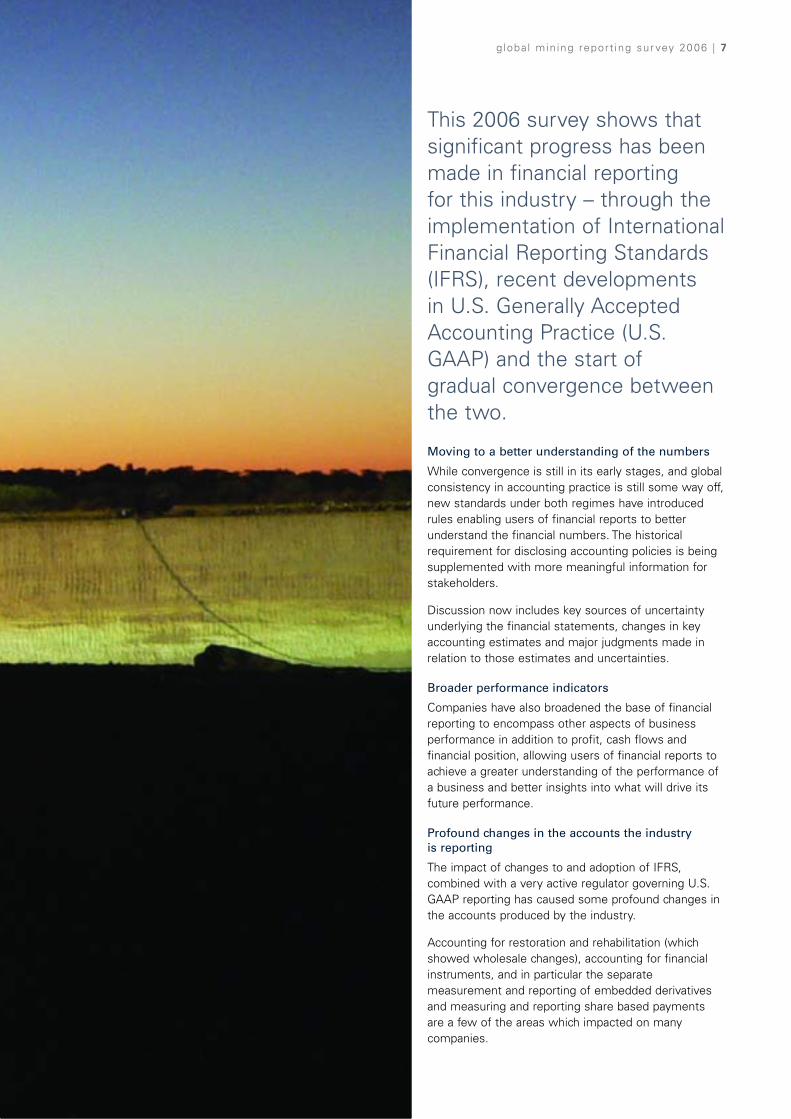
Moving to a better understanding of the numbers
While convergence is still in its early stages, and globalconsistency in accounting practice is still some way off,new standards under both regimes have introducedrules enabling users of financial reports to betterunderstand the financial numbers. The historicalrequirement for disclosing accounting policies is beingsupplemented with more meaningful information forstakeholders.
Discussion now includes key sources of uncertaintyunderlying the financial statements, changes in keyaccounting estimates and major judgments made inrelation to those estimates and uncertainties.
Broader performance indicators
Companies have also broadened the base of financialreporting to encompass other aspects of businessperformance in addition to profit, cash flows andfinancial position, allowing users of financial reports toachieve a greater understanding of the performance ofa business and better insights into what will drive itsfuture performance.
Profound changes in the accounts the industry is reporting
The impact of changes to and adoption of IFRS,combined with a very active regulator governing U.S.GAAP reporting has caused some profound changes inthe accounts produced by the industry.
Accounting for restoration and rehabilitation (whichshowed wholesale changes), accounting for financialinstruments, and in particular the separatemeasurement and reporting of embedded derivativesand measuring and reporting share based paymentsare a few of the areas which impacted on manycompanies.
This 2006 survey shows thatsignificant progress has beenmade in financial reporting for this industry – through theimplementation of InternationalFinancial Reporting Standards(IFRS), recent developments in U.S. Generally AcceptedAccounting Practice (U.S.GAAP) and the start ofgradual convergence betweenthe two.

8 | g loba l min ing report ing sur vey 2006
Segment reporting more aligned
Segment reporting is now more aligned withmanagement's view of the business and itsperformance. Progress has been achieved where thestandards have encouraged the reporting of sensitivityanalyses in relation to given financial numbers.
Qualitative versus quantitative
While there is a requirement to provide qualitative, andin some cases quantitative information in support ofthese segment disclosures, reporting in the miningindustry to date in these areas has been inconsistent inbreadth and depth. As a generalization, the move toprovide quantitative information in support of keyestimates, uncertainties and judgments in areas suchas commodity prices, exchange rates and discountrates is only just beginning.
Voluntary reporting enhancements
Voluntary reporting enhancements have also beenapparent over the last three years. Greater rigor isbecoming apparent in reporting on reserves andresources, even if there is, at this stage, no globalunderlying framework which could drive consistency,nor a requirement to 'reconcile' information in reservesand resources statements to the relevant elements ofthe financial statements.
CSR reporting more prevalent
Corporate social responsibility reporting in its variousforms has become more prevalent, and the GlobalReporting Initiative (GRI) is providing a base frameworkfor such reporting. This survey reflects that trend butwhat is uncertain is whether the GRI is generallyaccepted by the mining industry, and if itspronouncements are consistent with today's andtomorrow's financial reporting framework as IFRS andU.S. GAAP converge.
Disclosure of business objectives and strategies
Only limited progress has been achieved in introducingrequirements that provide greater context for reports onpast performance by disclosing business objectives andstrategies. For instance, where cash flow hedgeaccounting is asserted, there is a requirement todiscuss hedge accounting strategies. However, thereare few other requirements to report on businessobjectives and strategies. This survey shows thatvoluntary basis reporting is inconsistent.
In the near future, requirements will be in place to provideinformation about capital management objectives andstrategies. Paragraph 124 of IAS 1, Presentation ofFinancial Statements, has been expanded to introducenew disclosures about capital for annual reporting periodsending on or after January 1, 2007.
Business Performance models
This survey indicates that little progress seems to havebeen made on a voluntary basis or in introducingstandards which would enable users to understand andmodel the more dynamic elements of businessperformance - in areas such as the drivers of businessmodels and business risks, their link to individualbusiness objectives and strategies, and the dynamiclinkages between each of these areas.
IASB standard in the wings
The 2003 KPMG Mining Reporting Survey said the following…
“It is essential that the International AccountingStandard's Board's project on the extractiveindustries is accelerated so that a standard for theextractive industries can be quickly put in place,or other standards can be adjusted, to meet theunique circumstances of the industries”.
That standard has not yet been produced, and it is notcurrently high on the IASB's agenda. KPMG firmsbelieve that it should be.
The deliverable need not be a comprehensive financialreporting standard for the extractive industries. It mayprovide standards on particular activities critical to theindustries, for example reserves and resources, orwhere there have possibly been unintendedconsequences in the industries so far (financialderivatives and cash flow hedge accounting).
This survey points to some areas where attention maybe warranted. An international financial reportingstandard for the extractive industries can help toaccelerate further progress, fill in gaps, removeunintended consequences and increase consistency.
globa l min ing report ing sur vey 2006 | 9

10 | g loba l min ing report ing sur vey 2006
2. Results – financial reporting
globa l min ing report ing sur vey 2006 | 11
2.1 Critical accounting estimates and judgmentsGiven the heavy reliance on estimates and judgment infinancial reporting, disclosure of the critical accountingestimates and judgments aid the reader of the financialstatements to understand where the financial reportingrisks lie. This is particularly relevant for the miningindustry given inherent risk areas with accountingimplications such as assessing mineral reserves andresources, exploration and evaluation, restorationand rehabilitation obligations, and fluctuation incommodity prices.
Such areas require management to make subjectiveand complex judgments in applying the entity’saccounting policies. They are therefore an area wheretransparent disclosure is important.
In December 2001, the Securities and ExchangeCommission (SEC) released FR-60 and indicated thatcompanies should provide more discussion inManagement Discussion and Analysis about theircritical accounting policies. Under an appropriateheading, SEC filers are encouraged to disclose theirmost difficult and judgmental estimates, the mostimportant and pervasive accounting policies they use,and the areas most sensitive to material change fromexternal factors. They are also encouraged to provide asensitivity analysis to facilitate an investor’sunderstanding of the impact on the bottom line.
For companies in other jurisdictions, such as those whoapply IFRS, disclosures of this nature are relatively new.IAS 1 paragraph 20 provides examples of types ofdisclosures to be made, being:
• the nature of the assumption or other estimationuncertainty
• the sensitivity of carrying amounts to the methods,assumptions and estimates underlying theircalculations, including the reasons for the sensitivity
• the expected resolution of an uncertainty and therange of reasonably possible outcomes within thenext financial year in respect of the carryingamounts of the assets and liabilities affected
• an explanation of changes made to pastassumptions concerning those assets and liabilities,if the uncertainty remains unresolved.
With many first-time IFRS adopters and SEC filersincluded in this survey this has become a new area offocus in KPMG’s 2006 mining survey.
Nature of critical accounting estimates and judgments
Of the mining companies surveyed, 80 percent includecritical accounting estimate and judgment disclosureswith respect to mine closure and rehabilitation. Othercommon disclosures were those relating to impairmentof assets, deferred taxation relating to mining assetsand liabilities, the useful economic lives of property,plant and equipment and reserve estimation.
Only 9 percent of companies surveyed made nodisclosure of critical accounting estimates andjudgments.
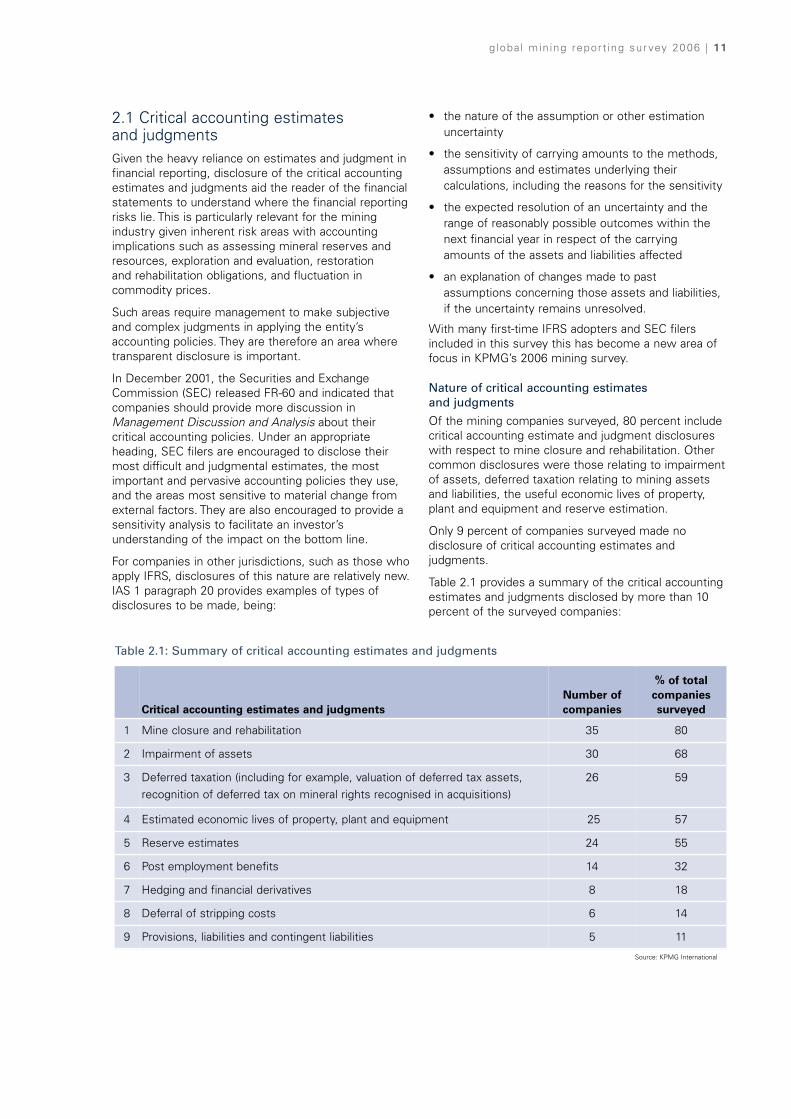
Table 2.1 provides a summary of the critical accountingestimates and judgments disclosed by more than 10percent of the surveyed companies:
Table 2.1: Summary of critical accounting estimates and judgments
Critical accounting estimates and judgmentsNumber ofcompanies
% of totalcompaniessurveyed
1 Mine closure and rehabilitation 35 80
2 Impairment of assets 30 68
3 Deferred taxation (including for example, valuation of deferred tax assets,recognition of deferred tax on mineral rights recognised in acquisitions)
26 59
4 Estimated economic lives of property, plant and equipment 25 57
5 Reserve estimates 24 55
6 Post employment benefits 14 32
7 Hedging and financial derivatives 8 18
8 Deferral of stripping costs 6 14
9 Provisions, liabilities and contingent liabilities 5 11
Source: KPMG International
12 | g loba l min ing report ing sur vey 2006
The level of detail provided in relation to criticalaccounting estimates and judgments varied between thecompanies surveyed. Some companies limiteddisclosures to general narrative, while others includedsensitivity analysis.
Example disclosure of accounting policies withrespect to critical accounting estimates and judgmentsare as follows:
Example 2.1: Lihir Gold LimitedCritical accounting estimates and judgments
The preparation of financial statements in accordance withInternational Financial Reporting Standards requiresmanagement to make estimates and assumptionsconcerning the future that affect the amounts reported inthe financial statements and accompanying notes.Estimates and judgments are continually evaluated and arebased on historical experience and other factors, includingexpectations of future events that are believed to bereasonable under the circumstances.
The most significant estimates and assumptions that havea significant risk of causing a material adjustment to thecarrying amounts of assets and liabilities within the nextfinancial year relate to the recoverability of long-livedassets and non-current ore stockpiles, the provision forrestoration and rehabilitation obligations and therecoverability of deferred tax assets. The resultingaccounting estimates will, by definition, seldom equal therelated actual results. Management believes theassumptions that they have adopted are reasonable andsupportable.
Key estimates and assumptions made in the preparation ofthese financial statements are described below:
Recoverability of long-lived assets
As set out in note 1(x) certain assumptions are required tobe made in order to assess the recoverability of long-livedassets. Key assumptions include the future price of gold,future cash flows, an estimated discount rate andestimates of ore reserves. A 10% increase or decrease tothe long term gold price used of $US425 may impact thecarrying value of long lived assets should there not be anexpected similar decrease in the costs of inputs to theprocess, either through a reduction in input prices ormanagement corrective action. An increase in the discountrate to 8% may have a similar affect on the carrying valueof long lived assets. In addition, cash flows are projectedover the life of the mine, which is based on proved andprobable ore reserves. Estimates of ore reserves inthemselves are dependent on various assumptions. Inaddition to those described above, including gold cut-offgrades. Changes in these estimates could materiallyimpact on ore reserves and could therefore affectestimates of future cash flows used in the assessment ofrecoverable amount, estimates of the life of mine anddepreciation and amortisationSource: Lihir Gold Limited 2005 Annual Report
Example 2.2: Inmet Mining CorporationReclamation costs
Our closed mines, operations and joint ventures aresubject to environment laws and regulations in Canada andthe other countries we operate in, including those of theUnited States, Turkey, Papua New Guinea, Finland andSpain.
The environmental and regulatory review is a long,complex and uncertain process. This can increase the timeit takes to reclaim a closed mine, which makes it difficult toestimate reclamation costs. We also can not predict theimpact on our financial position of environmental laws andregulations that may be enacted in the future.
We estimated a reclamation liability of $65 million atDecember 31, 2005. $30 million of this related to closedmines and $35 million related to operating mines. This wasbased on:
• our estimate of the costs and the time it will take torehabilitate the property
• a discount rate to estimate the fair value of the liability.
Sensitivity analysis
A 10 percent change in our estimate of reclamation costswould affect our earnings by approximately $3 million, all ofwhich relates to closed mines.Source: Inmet Mining Corporation 2005 Annual Report
KPMG comment
This is an area of relatively new disclosures infinancial statements. We anticipate that furtherrefinement and enhancement of the detail,particularly around the quantification of sensitivityanalysis will emerge in the next few years.

globa l min ing report ing sur vey 2006 | 13
2.2 Business combinations2.2.1 Industry rationalization
Since the 2003 survey, the mining industry has experienced continuing consolidation, with the main drivercontinuing to be a strategy of company acquisition as a means of replenishing and expanding reserves.
In contrast to the 2003 survey, when relatively low metal prices provided companies with the opportunity toacquire reserves at a discount to historical valuations, current metal prices are trading at record levels, significantlyincreasing the cost of acquisitions. The increase in metal prices has led to increased capital availability, which acts as acontinual driver of mergers and acquisitions in the sector. In this current environment, companies are demonstrating awillingness to enter into transactions that focus on securing reserves and paying premiums to do so.
The extent of merger and acquisition activity in the mining industry is evident from the fact that 20 of the 44companies surveyed acquired reserves through corporate activity during the years presented in their most recentfinancial statements. In addition, in comparing the list of companies surveyed in 2006 and 2003, it is noteworthythat seven companies from the 2003 survey no longer exist.
In contrast to the previous survey, where it was found that large companies were acquiring junior and medium-sized companies to grow, the current survey has shown that large companies are also acquiring other largecompanies. Placer Dome Inc. has been acquired by Barrick Gold Corporation, the acquisition of FalconbridgeLimited by Xstrata plc was completed during the survey and as this survey goes to print a transaction betweenCVRD and Inco Limited is underway.
The breakdown of those companies surveyed that acquired reserves through corporate activity is as follows:
Table 2.2: Company Acquisitions
Businesscombinations
SouthAfrica Canada
UnitedKingdom Australia
UnitedStates BRICs Total
2006 Survey – 9 3 2 4 2 20
2003 Survey 4 6 1 2 3 2 18
2.2.2 Accounting for business combinations
The purchase consideration for business combinations is typically allocated based on the fair value of assetsacquired and actual and contingent liabilities assumed, with the excess of purchase price over the fair value of netassets acquired being allocated to goodwill. For mining companies, historical practice has been to allocate anyexcess purchase consideration to mineral rights rather than goodwill, and to argue that the premium paid over andabove other assets generally related to exploration potential.
The analysis of the 20 companies that disclosed an acquisition highlighted differences in the way in which theexcess purchase price on acquisition has been allocated. This is illustrated in the table below:
For those companies where the allocation of the excess purchase consideration was not disclosed, it is not clearwhether there was an excess over existing book values which may have been allocated to mineral rights.
The survey also found that in certain recent acquisitions, the initial disclosure of any excess purchase considerationhas been characterized as ‘unallocated purchase price’. This suggests that companies are utilizing the full period oftime available to finalize their purchase accounting allocation, possibly indicating the time required and complexityassociated with the separate valuation of mineral rights.
Source: KPMG International
Source: KPMG International
Table 2.3: Allocation of excess purchase price
SouthAfrica Canada
UnitedKingdom Australia
UnitedStates BRICs Total
Goodwill – 5 2 1 – 1 9
Mineral rights – 1 1 1 – – 3
No excess/not
disclosed
– 3 – – 4 1 8
Total – 9 3 2 4 2 20
14 | g loba l min ing report ing sur vey 2006
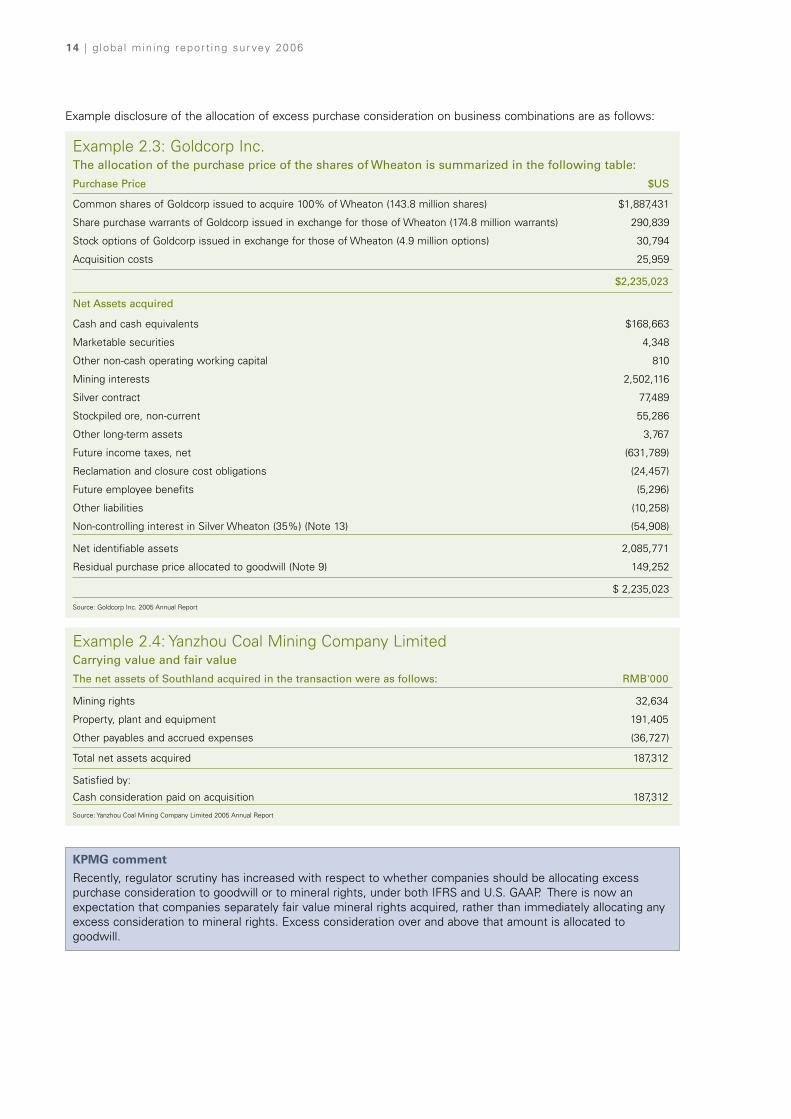
Example disclosure of the allocation of excess purchase consideration on business combinations are as follows:
Example 2.3: Goldcorp Inc.The allocation of the purchase price of the shares of Wheaton is summarized in the following table:
Purchase Price $US
Common shares of Goldcorp issued to acquire 100% of Wheaton (143.8 million shares) $1,887,431
Share purchase warrants of Goldcorp issued in exchange for those of Wheaton (174.8 million warrants) 290,839
Stock options of Goldcorp issued in exchange for those of Wheaton (4.9 million options) 30,794
Acquisition costs 25,959
$2,235,023
Net Assets acquired
Cash and cash equivalents $168,663
Marketable securities 4,348
Other non-cash operating working capital 810
Mining interests 2,502,116
Silver contract 77,489
Stockpiled ore, non-current 55,286
Other long-term assets 3,767
Future income taxes, net (631,789)
Reclamation and closure cost obligations (24,457)
Future employee benefits (5,296)
Other liabilities (10,258)
Non-controlling interest in Silver Wheaton (35%) (Note 13) (54,908)
Net identifiable assets 2,085,771
Residual purchase price allocated to goodwill (Note 9) 149,252
$ 2,235,023
Source: Goldcorp Inc. 2005 Annual Report
Example 2.4: Yanzhou Coal Mining Company LimitedCarrying value and fair value
The net assets of Southland acquired in the transaction were as follows: RMB'000
Mining rights 32,634
Property, plant and equipment 191,405
Other payables and accrued expenses (36,727)
Total net assets acquired 187,312
Satisfied by:
Cash consideration paid on acquisition 187,312
Source: Yanzhou Coal Mining Company Limited 2005 Annual Report
KPMG comment
Recently, regulator scrutiny has increased with respect to whether companies should be allocating excesspurchase consideration to goodwill or to mineral rights, under both IFRS and U.S. GAAP. There is now anexpectation that companies separately fair value mineral rights acquired, rather than immediately allocating anyexcess consideration to mineral rights. Excess consideration over and above that amount is allocated togoodwill.

globa l min ing report ing sur vey 2006 | 15
2.3 Exploration and evaluation expenditures2.3.1 Measurement of exploration and evaluation expenditure
Exploration and evaluation expenditures are those incurred in connection with acquisition of rights to explore,investigate, examine and evaluate an area for mineralization. Exploration may be conducted before or after theacquisition of mineral rights.
The following is a summary of the various accounting treatments for exploration and evaluation expendituredisclosed by the surveyed companies:
Table 2.4: Accounting treatment of exploration and evaluation expenditure
Australia CanadaSouthAfrica
UnitedKingdom
UnitedStates BRICs Total
Expensed as incurred 1 - - 1 6 2 10
Expensed as incurred until the
ore body is deemed
commercially recoverable, at
which time all subsequent
costs are deferred
3 12 6 4 - 2 27
Capitalise until a reasonable
assessment can be made of
the existence of reserves
1 - - 2 - 2 5
Policy not disclosed - - - - 1 1 2
Total 5 12 6 7 7 7 44
Consistent with previous surveys, the majority of surveyed companies are expensing their exploration costs asincurred. The number of companies which expense exploration costs as incurred until the ore body is deemedcommercially recoverable, but capitalize from that point on has increased from 50 percent in the 2003 survey to 61percent in the current survey.
This trend suggests that companies are adopting accounting policies which are more consistent with the generalaccounting framework requirements. It also reflects the continuing trend of larger mining companies not using ‘fullcost’ accounting for exploration expenditure.
Five of the companies surveyed (including two from the BRICs category) capitalize exploration costs before anassessment can be made of the existence of reserves as compared to four in the previous survey. The researchhighlighted a decrease by Australian companies surveyed applying this type of policy, suggesting a move away from‘full cost’ accounting for exploration and evaluation. We believe this result may be skewed to the size of companiessurveyed. Had KPMG firms’ professionals surveyed junior exploration, start up or mid-sized mining companies it wouldhave been likely to expect a higher percentage adopting full cost accounting.
None of the companies surveyed specified whether costs capitalized include direct administrative and other generaloverhead costs as is allowed under IFRS.
KPMG comment
Under IFRS, an entity should adopt an accounting policy either of expensing administrative and other generaloverhead costs or of capitalizing those costs associated with finding specific mineral resources in the initialrecognition and measurement of an exploration and evaluation asset. In our view, the selected policy ofexpensing or capitalizing administrative and other general overhead costs should apply, by analogy, the guidancefor capitalizing similar costs incurred in relation either to inventories, intangible assets or property, plant andequipment.
Source: KPMG International

16 | g loba l min ing report ing sur vey 2006
KPMG comment
If an entity elects to capitalize administrative andother general overhead costs associated with findingspecific mineral resources, then in our view thefollowing costs may qualify for inclusion as anexploration and evaluation asset:
• Payroll-related costs attributable to personnelworking directly on a specific project, includingthe costs of employee benefits for suchpersonnel.
• Certain management costs if their roles arespecific to a project.
• Sign-up bonuses paid to contractors involved ina particular project.
• Legal or other professional costs specific to theproject, eg. costs in respect of obtainingcertain permits and certifications.
• The policy for administrative and other generaloverhead costs should be applied consistently.
Examples of accounting policy disclosure for themeasurement of exploration and evaluation costs are as follows:
Example 2.5: Oxiana LimitedExploration and evaluation expenditureExploration and evaluation costs related to areas of interestare carried forward to the extent that:
(i) the rights to tenure of the areas of interest arecurrent and the consolidated entity controls the areaof interest in which the expenditure has beenincurred; and
(ii) such costs are expected to be recouped throughsuccessful development and exploitation of the areaof interest, or alternatively by its sale.
Exploration and evaluation expenditure will generally becapitalised where a JORC (Joint Ore Reserves Committee)resource has been identified and probable future economicbenefits are demonstrated. Exploration and evaluationassets will be assessed annually for impairment and whereimpairment indicators exist, recoverable amounts of theseassets will be estimated based on discounted cash flowsfrom their associated cash generating units. The incomestatement will recognise expenses arising from excess ofthe carrying values of exploration and evaluation assets overthe recoverable amounts of these assets.
Expenditure capitalised under the above policy is amortisedover the life of the area of interest from the date thatcommercial production of the related mineral occurs. In theevent that an area of interest is abandoned or if the directorsconsider the expenditure to be of no value, accumulatedcosts carried forward are written off in the year in which theassessment is made. A regular review is undertaken of eacharea of interest to determine the appropriateness ofcontinuing to carry forward costs in relation to that area ofinterest.Source: Oxiana Limited 2005 Annual Report
Example 2.6:Impala Platinum Holdings LimitedExploration for and evaluation of mineral resources
The group expenses all exploration and evaluationexpenditures until the directors conclude that a futureeconomic benefit is more likely than not to be realised, ie.probable. In evaluating if expenditures meet this criterion tobe capitalised, the directors utilise several different sourcesof information depending on the level of exploration. Whilethe criteria for concluding that an expenditure should becapitalised is always probable, the information that thedirectors use to make that determination depends on thelevel of exploration.
(a) Exploration and evaluation expenditure on greenfieldssites, being those where the group does not have anymineral deposits which are already being mined ordeveloped, is expensed as incurred until a finalfeasibility study has been completed, after which theexpenditure is capitalised within development costs ifthe final feasibility study demonstrates that futureeconomic benefits are probable.
(b) Exploration and evaluation expenditure on brownfieldssites being those adjacent to mineral deposits whichare already being mined or developed, is expensed asincurred until the directors are able to demonstratethat future economic benefits are probable through thecompletion of a pre-feasibility study, after which theexpenditure is capitalised as a mine development cost.A “pre-feasibility study” consists of a comprehensivestudy of the viability of a mineral project that hasadvanced to a stage where the mining method, in thecase of underground mining, or the pit configuration, inthe case of an open pit, has been established, andwhich, if an effective method of mineral processinghas been determined, includes a financial analysisbased on reasonable assumptions of technical,engineering, operating economic factors and theevaluation of other relevant factors. The pre-feasibilitystudy, when combined with existing knowledge of themineral property that is adjacent to mineral depositsthat are already being mined or developed, allow thedirectors to conclude that it is more likely than not thatthe group will obtain future economic benefit from theexpenditures.
(c) Exploration and evaluation expenditure relating toextensions of mineral deposits which are already beingmined or developed, including expenditure on thedefinition of mineralisation of such mineral deposits, iscapitalised as a mine development cost following thecompletion of an economic evaluation equivalent to apre-feasibility study. This economic evaluation isdistinguished from a pre-feasibility study in that someof the information that would normally be determined in a pre-feasibility study is instead obtained from theexisting mine or development. This information whencombined with existing knowledge of the mineralproperty already being mined or developed allow the
globa l min ing report ing sur vey 2006 | 17
directors to conclude that more likely than not thegroup will obtain future economic benefit from theexpenditures.
Costs relating to property acquisitions are also capitalised.These costs are capitalised within development costs.Source: Impala Platinum Holdings Limited 2006 Annual Report
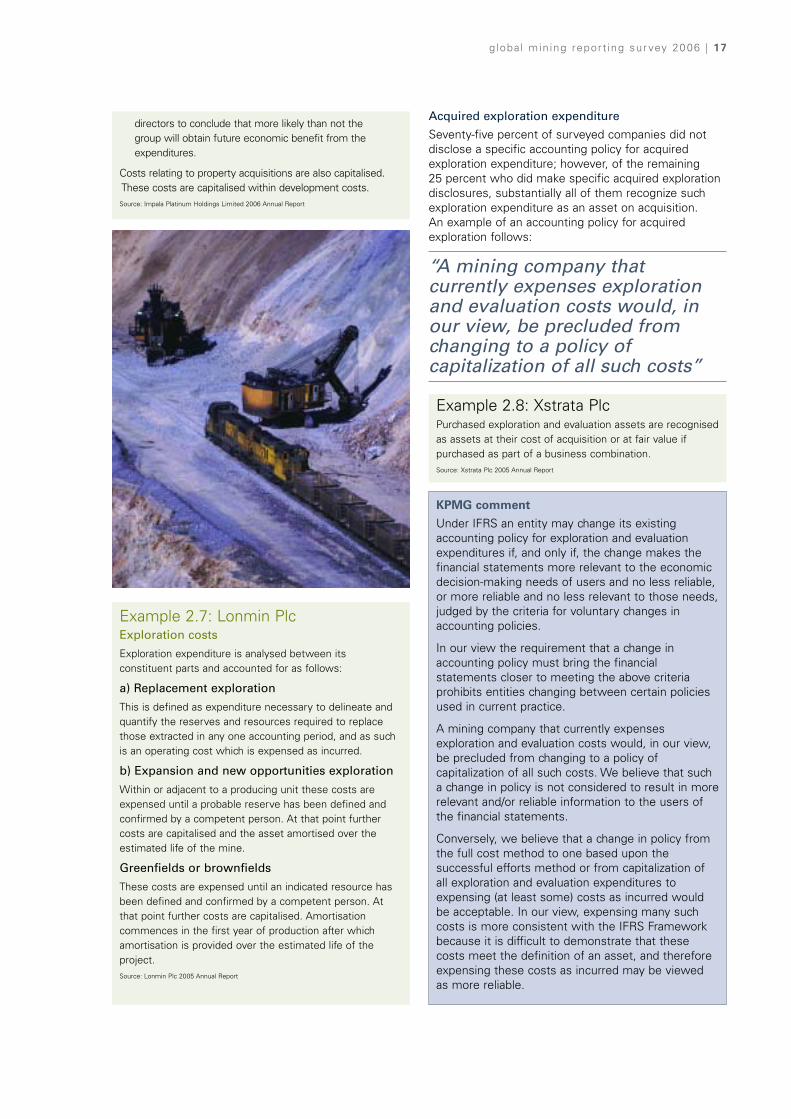
Example 2.7: Lonmin PlcExploration costs
Exploration expenditure is analysed between itsconstituent parts and accounted for as follows:
a) Replacement exploration
This is defined as expenditure necessary to delineate andquantify the reserves and resources required to replacethose extracted in any one accounting period, and as suchis an operating cost which is expensed as incurred.
b) Expansion and new opportunities exploration
Within or adjacent to a producing unit these costs areexpensed until a probable reserve has been defined andconfirmed by a competent person. At that point furthercosts are capitalised and the asset amortised over theestimated life of the mine.
Greenfields or brownfields
These costs are expensed until an indicated resource hasbeen defined and confirmed by a competent person. Atthat point further costs are capitalised. Amortisationcommences in the first year of production after whichamortisation is provided over the estimated life of theproject.Source: Lonmin Plc 2005 Annual Report
Acquired exploration expenditure
Seventy-five percent of surveyed companies did notdisclose a specific accounting policy for acquiredexploration expenditure; however, of the remaining 25 percent who did make specific acquired explorationdisclosures, substantially all of them recognize suchexploration expenditure as an asset on acquisition. An example of an accounting policy for acquiredexploration follows:
Example 2.8: Xstrata PlcPurchased exploration and evaluation assets are recognisedas assets at their cost of acquisition or at fair value ifpurchased as part of a business combination.Source: Xstrata Plc 2005 Annual Report
KPMG comment
Under IFRS an entity may change its existingaccounting policy for exploration and evaluationexpenditures if, and only if, the change makes thefinancial statements more relevant to the economicdecision-making needs of users and no less reliable,or more reliable and no less relevant to those needs,judged by the criteria for voluntary changes inaccounting policies.
In our view the requirement that a change inaccounting policy must bring the financialstatements closer to meeting the above criteriaprohibits entities changing between certain policiesused in current practice.
A mining company that currently expensesexploration and evaluation costs would, in our view,be precluded from changing to a policy ofcapitalization of all such costs. We believe that sucha change in policy is not considered to result in morerelevant and/or reliable information to the users ofthe financial statements.
Conversely, we believe that a change in policy fromthe full cost method to one based upon thesuccessful efforts method or from capitalization ofall exploration and evaluation expenditures toexpensing (at least some) costs as incurred wouldbe acceptable. In our view, expensing many suchcosts is more consistent with the IFRS Frameworkbecause it is difficult to demonstrate that thesecosts meet the definition of an asset, and thereforeexpensing these costs as incurred may be viewedas more reliable.
“A mining company thatcurrently expenses explorationand evaluation costs would, inour view, be precluded fromchanging to a policy ofcapitalization of all such costs”
18 | g loba l min ing report ing sur vey 2006
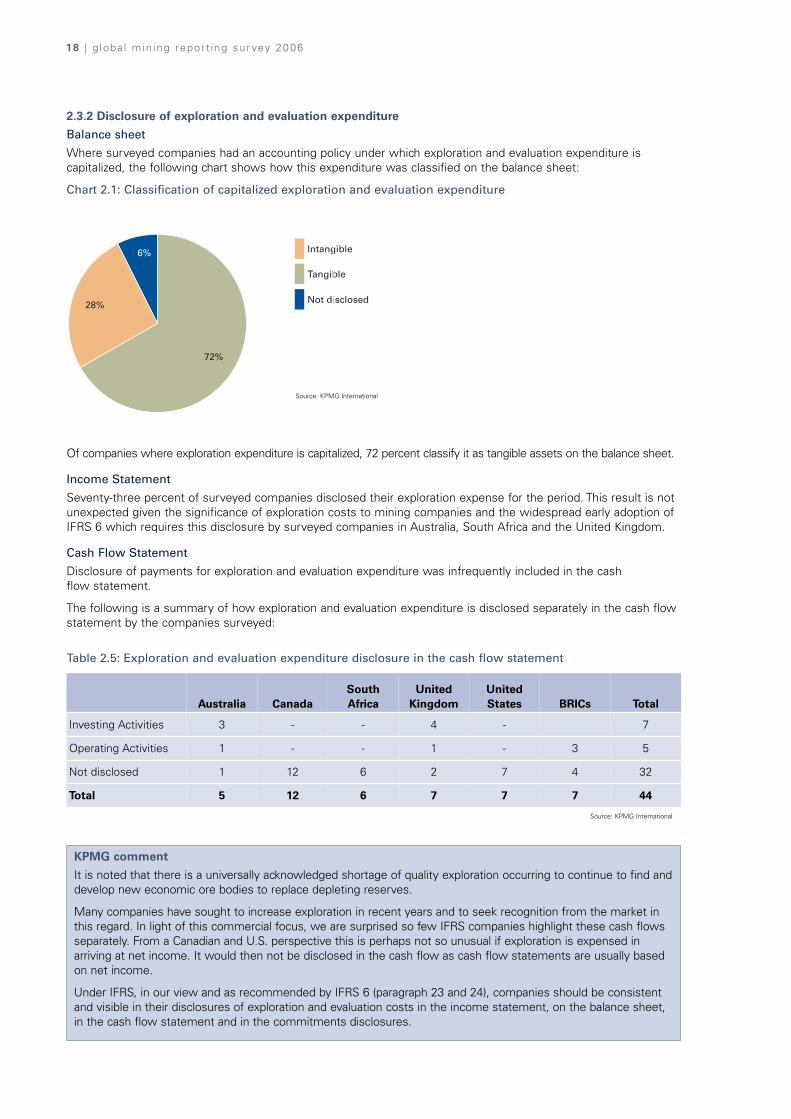
2.3.2 Disclosure of exploration and evaluation expenditure
Balance sheet
Where surveyed companies had an accounting policy under which exploration and evaluation expenditure iscapitalized, the following chart shows how this expenditure was classified on the balance sheet:
Chart 2.1: Classification of capitalized exploration and evaluation expenditure
Of companies where exploration expenditure is capitalized, 72 percent classify it as tangible assets on the balance sheet.
Income Statement
Seventy-three percent of surveyed companies disclosed their exploration expense for the period. This result is notunexpected given the significance of exploration costs to mining companies and the widespread early adoption ofIFRS 6 which requires this disclosure by surveyed companies in Australia, South Africa and the United Kingdom.
Cash Flow Statement
Disclosure of payments for exploration and evaluation expenditure was infrequently included in the cash flow statement.
The following is a summary of how exploration and evaluation expenditure is disclosed separately in the cash flowstatement by the companies surveyed:
KPMG comment
It is noted that there is a universally acknowledged shortage of quality exploration occurring to continue to find anddevelop new economic ore bodies to replace depleting reserves.
Many companies have sought to increase exploration in recent years and to seek recognition from the market inthis regard. In light of this commercial focus, we are surprised so few IFRS companies highlight these cash flowsseparately. From a Canadian and U.S. perspective this is perhaps not so unusual if exploration is expensed inarriving at net income. It would then not be disclosed in the cash flow as cash flow statements are usually basedon net income.
Under IFRS, in our view and as recommended by IFRS 6 (paragraph 23 and 24), companies should be consistentand visible in their disclosures of exploration and evaluation costs in the income statement, on the balance sheet,in the cash flow statement and in the commitments disclosures.
Table 2.5: Exploration and evaluation expenditure disclosure in the cash flow statement
Australia CanadaSouthAfrica
UnitedKingdom
UnitedStates BRICs Total
Investing Activities 3 - - 4 - 7
Operating Activities 1 - - 1 - 3 5
Not disclosed 1 12 6 2 7 4 32
Total 5 12 6 7 7 7 44
Not disclosed
Intangible
Tangible
6%
28%
72%
Not disclosed
Intangible
Tangible
6%
28%
72%
Source: KPMG International
Source: KPMG International

globa l min ing report ing sur vey 2006 | 19
2.4 Development costs2.4.1 Definition and measurement of development costs
Development involves the preparation of identified reserves for production once the technical feasibility andcommercial viability of the ore body has been established. Development costs typically include those incurred forthe design of the mine plan, obtaining the necessary permits, constructing and commissioning the facilities andpreparation of the mine and necessary infrastructure for production. The mine development phase generally beginsafter completion of a feasibility study and ends upon the commencement of commercial production.
Under IFRS, when the technical feasibility and commercial viability of extracting mineral resources aredemonstrable, an entity must firstly stop capitalizing exploration and evaluation costs for that area; secondly testrecognized exploration and evaluation assets for impairment; and thirdly cease classifying any unimpairedexploration and evaluation assets (tangible and intangible) as exploration and evaluation.
Exploration and evaluation assets may be classified either as tangible or intangible development assets. Theclassification of exploration and evaluation assets transferred to development assets is an accounting policy choicethat should be applied consistently.
Generally, when commercial and technical feasibility are demonstrable, a specific mineral reserve will have beenidentified for development. In practice, mineral reserves are classified as either property assets (i.e. tangible) orintangible assets. In our view, an entity should elect an accounting policy to classify mineral reserves either astangible or as intangible assets and apply that policy consistently. It is our preference that the mineral reserves, andby association the non-identifiable exploration and evaluation assets, be classified as tangible development assets.
Significant accounting issues include consideration of what development costs should be capitalized and thedetermination of when development ends and production begins. Furthermore, development often continues afterproduction has begun giving rise to further accounting issues such as accounting for deferred stripping costs,lay-backs in open pit mines and extension of drifts with underground operations.
The following shows a summary of the accounting treatment for development costs disclosed by thecompanies surveyed:
Since the 2003 survey, disclosure of treatment of development costs has evolved, with more companies nowdefining when and what type of expenditure is capitalized.
In 2003, 38 percent of companies included a specific policy on development costs being capitalized compared to59 percent in the current survey. Although companies are better defining their development accounting policythere is substantial diversity in practice and disclosure.
Table 2.6: Accounting treatment of development costs
Australia CanadaSouthAfrica
UnitedKingdom
UnitedStates BRICs Total
Development costs arecapitalized
3 - 1 4 3 3 14
Development costs incurredto maintain currentproduction are expensed,while development orebodies and development inadvance of production arecapitalized
1 12 4 2 4 3 26
Policy not disclosed 1 - 1 1 - 1 4
Total 5 12 6 7 7 7 44
Source: KPMG International
20 | g loba l min ing report ing sur vey 2006
2.4.2 Borrowing Costs
Long lead times between a development decision andthe start of production for new projects often results incompanies incurring significant amounts of borrowingcost without generating revenues. IAS 23 BorrowingCosts (IAS 23) gives guidance about the treatment ofthose costs under IFRS.
The current version of IAS 23 states that the preferredtreatment is to expense borrowing costs in the period inwhich they are incurred. The standard does howeverallow an alternative treatment, whereby borrowing coststhat are directly attributable to the acquisition,construction or production of an asset can be capitalized.
The exposure draft proposing changes to IAS 23 nolonger proposes to allow the currently preferred methodof expensing and instead requires capitalization ofborrowing costs.
Under U.S. GAAP there is no option to expense interestcost, unless the net effect of interest cost capitalizationis immaterial.
An issue recently addressed with the SEC is whatunderlying asset base should be used when the assethas been impaired. The SEC’s position is that U.S. GAAPrequires a company to use the ‘gross’ costs of the assetas the basis for determining the amount of interest to becapitalized, without taking into account impairmentsrecorded to that ‘gross’ cost .
Of the companies surveyed, 41 disclosed a policy ofcapitalizing interest during the construction phase. Thisresult suggests that few companies are adopting theIFRS benchmark treatment of expensing interest costsand opting for the alternative treatment consistent withthe U.S. approach. The proposed changes to the IFRSstandard will have minimal impact.
An example accounting policy disclosure with respect toborrowing costs is as follows:
Example 2.9: Vedanta Resources PlcBorrowing Costs
Borrowing costs directly relating to the financing of aqualifying capital project under construction are capitalisedand added to the project cost during construction until suchtime as the related asset is substantially ready for itsintended use ie. when it is capable of commercialproduction. Where funds are borrowed specifically to financea project, the amount capitalised represents the actualborrowing costs incurred. Where surplus funds are availablein the short term (from money borrowed specifically tofinance a project), the income generated from such shortterm investments is also capitalised and deducted from thetotal capitalised borrowing cost. Where the funds used tofinance a project form part of general borrowings, theamount capitalised is calculated using a weighted averagerate applicable to the relevant general borrowings of theGroup during the period.
All other borrowing costs are recognised in the incomestatement in the period in which they are incurred.Source: Vedanta Resources Plc 2006 Annual Report
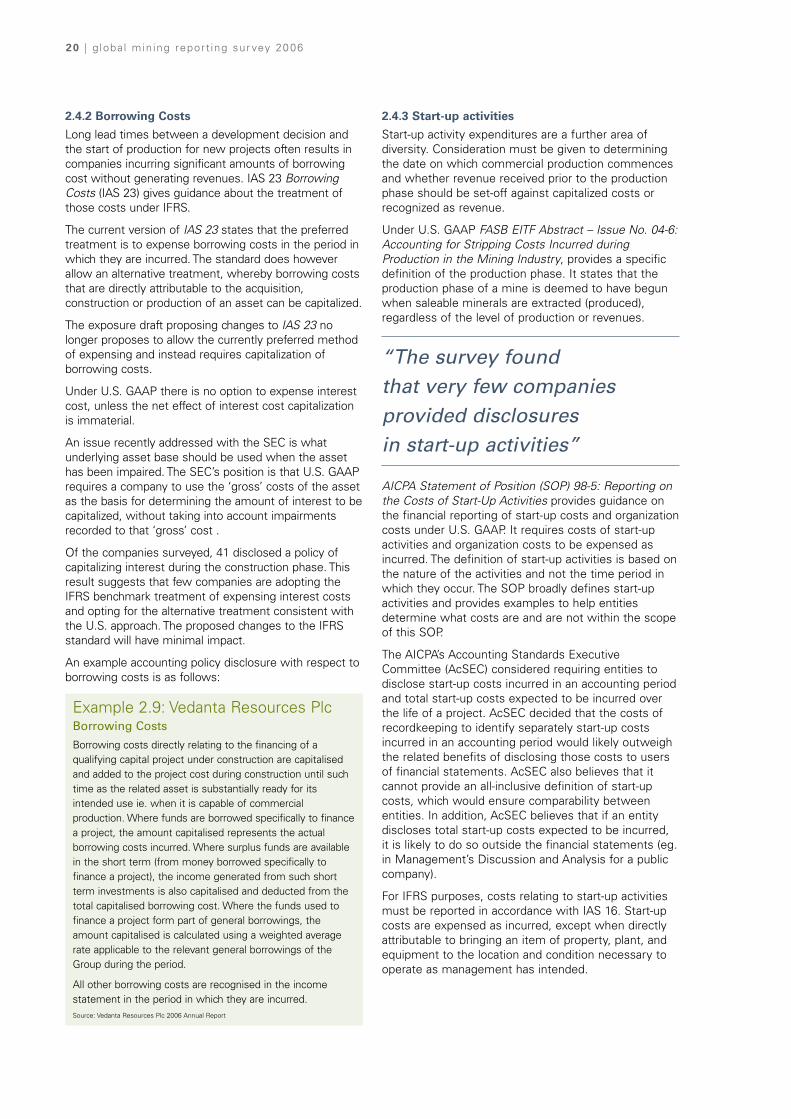
2.4.3 Start-up activities
Start-up activity expenditures are a further area ofdiversity. Consideration must be given to determiningthe date on which commercial production commencesand whether revenue received prior to the productionphase should be set-off against capitalized costs orrecognized as revenue.
Under U.S. GAAP FASB EITF Abstract – Issue No. 04-6:Accounting for Stripping Costs Incurred duringProduction in the Mining Industry, provides a specificdefinition of the production phase. It states that theproduction phase of a mine is deemed to have begunwhen saleable minerals are extracted (produced),regardless of the level of production or revenues.
AICPA Statement of Position (SOP) 98-5: Reporting onthe Costs of Start-Up Activities provides guidance onthe financial reporting of start-up costs and organizationcosts under U.S. GAAP. It requires costs of start-upactivities and organization costs to be expensed asincurred. The definition of start-up activities is based onthe nature of the activities and not the time period inwhich they occur. The SOP broadly defines start-upactivities and provides examples to help entitiesdetermine what costs are and are not within the scopeof this SOP.
The AICPA’s Accounting Standards ExecutiveCommittee (AcSEC) considered requiring entities todisclose start-up costs incurred in an accounting periodand total start-up costs expected to be incurred overthe life of a project. AcSEC decided that the costs ofrecordkeeping to identify separately start-up costsincurred in an accounting period would likely outweighthe related benefits of disclosing those costs to usersof financial statements. AcSEC also believes that itcannot provide an all-inclusive definition of start-upcosts, which would ensure comparability betweenentities. In addition, AcSEC believes that if an entitydiscloses total start-up costs expected to be incurred, it is likely to do so outside the financial statements (eg.in Management’s Discussion and Analysis for a publiccompany).
For IFRS purposes, costs relating to start-up activitiesmust be reported in accordance with IAS 16. Start-upcosts are expensed as incurred, except when directlyattributable to bringing an item of property, plant, andequipment to the location and condition necessary tooperate as management has intended.
“The survey foundthat very few companiesprovided disclosuresin start-up activities”

globa l min ing report ing sur vey 2006 | 21
The survey found that very few companies provideddisclosures in this area. Example disclosure fromsurveyed companies are as follows:
Example 2.10: Coal India Limited DevelopmentExpenses net of income of the projects/mines underDevelopment are booked to Development account andgrouped under Capital Work-in-Progress till theprojects/mines are brought to revenue account. Exceptotherwise specially stated in the project report todetermine the commercial readiness of the project to yieldproduction on a sustainable basis and completion ofrequired development activity during the period ofconstruction, projects and mines under development arebrought to revenue:
(a) From the beginning of the financial year immediatelyafter the year in which the project achieves physicalcoal output of 25% of rated capacity as per approvedproject report, or
(b) 2 years of touching of coal, or
(c) From the beginning of the financial year in which thevalue of production is more than total expenses.
Whichever event occurs first.Source: Coal India Limited 2005 Annual Report
Example 2.11: Gold Corp Inc.Commercial production is deemed to have commencedwhen management determines that the completion ofoperational commissioning of major mine and plantcomponents is completed, operating results are beingachieved consistently for a period of time and that thereare indicators that these operating results will becontinued. Mine development costs incurred to maintaincurrent production are included in operations.Source: Gold Corp Inc. 2005 Annual Report
2.4.4 Disclosure of development expenditure
It is evident from our survey findings that companiesuse different captions either on balance sheet or in thenotes, to describe their mining assets including:
Balances sheet descriptions of mineral assets
• Mineral assets • Mineral rights
• Mineral licenses • Mining interests
• Mine development • Mine properties
• Mine infrastructure • Mine plant and facilities
• Plant and equipment • Land
• Shafts • Mobile equipment
• Rehabilitation assets • Smelters and refineries
The findings showed that all companies classifieddevelopment costs as tangible. Further, of the 82percent of surveyed companies who separatelydisclosed mineral rights, 77 percent classified mineralrights as tangible.
The survey found that only 14 percent of companiesdisclosed a policy on accounting for administrationcosts relating to development.
Examples of accounting policies with respect todevelopment costs appear on the following page.

22 | g loba l min ing report ing sur vey 2006
Example 2.12: Lihir Gold LimitedDevelopment properties
A property is classified as a development property when amine plan has been prepared, proved and probablereserves have been established, and the Company hasdecided to commercially develop the property.Development expenditure is accumulated separately foreach area of interest in which economically recoverablemineral resources have been identified and are reasonablyassured.
All expenditure incurred prior to the commencement ofcommercial levels of production from each developmentproperty is carried forward to the extent to whichrecoupment out of revenue to be derived from the sale ofproduction from the relevant development property, orfrom the sale of that property, is reasonably assured.
No amortisation is provided in respect of developmentproperties until they are reclassified as “Mine Properties”,following the commencement of commercial production.For the years ended 31 December 2004 and 2005, theCompany has had no properties in the development stage.No development expenditure is currently being incurred orcapitalised.Source: Lihir Gold Limited 2005 Annual Report
Example 2.13: Meridian Gold Inc.Mineral property, plant and equipment
Mineral property, plant and equipment, includingdevelopment costs and capitalized interest associated withthe construction of certain capital assets, are recorded atcost. Start-up costs associated with new properties, net ofrevenues from pre-commercial production, are capitalizedas part of the cost of the projects.
Depreciation, depletion and amortization for financialreporting purposes is provided on the shorter of the units-of-production basis, based upon the expected tonnes to bemined or on the straight-line basis over the estimated livesof the assets. Depreciation, depletion and amortization ofmine development assets amortized on a units-of-production basis is recorded when a unit (a tonne of ore) isextracted “produced” from the mine regardless of whetherthe ore is added to the stockpiled ore inventory or sentdirectly to the mill.
Gains and losses are reflected in earnings upon sale orretirement of assets.Source: Meridian Gold Inc. 2005 Annual Report
KPMG comment
Preferred disclosure would require that, at aminimum, each caption disclosed in the balancesheet and associated notes should clearly identify thenature of the asset for the user; and the accountingpolicies should be clearly linked, such that the captioncaught on balance sheet, or in the balance sheetnotes can be linked to the depreciation/depletionmethod and the applicable rates.
2.5 Mining and processing ore2.5.1 Deferred stripping
Fifty-nine percent of surveyed companies disclosed anaccounting policy in relation to stripping costs and lay-backs in open pit mines. This represents a significantincrease since the previous survey where only 32percent of companies disclosed such a policy.
This increase may reflect the heightened awarenessarising from recent U.S. GAAP pronouncements whichprohibit the deferral of production phase stripping costsfor financial years beginning after 15 December 2005.
In accordance with EITF No. 04-6, stripping costsincurred during the production phase of a mine arevariable production costs that should be included in thecosts of the inventory produced or extracted during theperiod these costs are incurred. The EITF does notaddress stripping costs incurred during pre-production,however, it is generally accepted in practice thatstripping costs are capitalized as part of the depreciablecost of building, developing, and constructing the mine.These costs would then be amortized over theproductive life of the mine using the units of productionmethod.
In contrast, the Canadian Emerging Issues Committeehas issued the following guidance in relation todeferred stripping costs:
• Stripping costs should be accounted for according tothe benefit received by the entity;
• Capitalized stripping costs should be amortized in arational and systematic manner over the reservesthat directly benefit from the specific strippingactivity;
• Capitalized stripping costs should be classified asinvesting activities on the cash flow statement;
• The accounting policy applied should describe theamortization method and rationale supporting thereserves used in the amortization calculation.
Of the companies disclosing an accounting policy forstripping costs, 96 percent elected to defer these costswith the remainder expensing stripping costs as incurred.It is expected that this percentage will decrease in futuresurveys given the changes to U.S. GAAP.
Of those surveyed companies that disclosed anaccounting policy of deferring their stripping costswhile in production, the majority stated that theydeferred costs to the extent that actual stripping ratiosexceed average life of mine stripping ratios.

globa l min ing report ing sur vey 2006 | 23
The survey found that the balance sheet classification of deferred stripping costs varied across the companiessurveyed as follows:
Chart 2.2: Classification of deferred stripping costs
KPMG comment
The variety in classifications indicates that this is an area where further formal guidance may be worthwhile. It is recommended that capitalized deferred stripping costs be classified as tangible assets.
6%
28%
72%
Policy not disclosed
Expensed as incurred
Category not disclosed
Other non-current assets
Part of inventories
Part of property, plant and equipment
Separate current asset
Separate non-current asset
41%
11%
5%
18%
2%5%
16%2%
Examples of accounting disclosures with respect to deferred stripping costs are as follows:
Example 2.14: Kazakhmys PlcMining stripping costs $’000
CostAs at 1 January 2004 11,366Additions 5,160Disposals (830)Net exchange adjustment 1,362
As at 31 December 2004 17,058
Additions 26,486Disposals (386)Net exchange adjustment (659)
As at 31 December 2005 42,499
Depletion as at 1 January 2004 582Depletion charge 372Disposals (830)Net exchange adjustment 39
As at 31 December 2004 163
Depletion charge 920Disposals (386)Net exchange adjustment (8)
As at 31 December 2005 689
Net book value at 31 December 2005 41,810
At 31 December 2004 16,895At 31 December 2003 10,784Source: Kazakhmys Plc 2005 Annual Report
Source: KPMG International
24 | g loba l min ing report ing sur vey 2006
Example 2.15: Newmont Mining CorporationDeferred Stripping Costs
In general, mining costs are allocated to production costs, stockpiles, ore on leach pads and inventories, and are charged tocosts applicable to sales when gold or copper is sold. However, at certain open pit mines, which have diverse grades andwaste-to-ore ratios over the mine life, the company defers and amortizes certain mining costs on a units-of-production basisover the life of the mine. These mining costs, which are commonly referred to as ‘deferred stripping’ costs, are incurred inmining activities that are normally associated with the removal of waste rock. The deferred stripping accounting method isgenerally accepted in the mining industry where mining operations have diverse grades and waste-to-ore ratios; however,industry practice does vary. Deferred stripping matches the costs of production with the sale of such production at theCompany’s operations where it is employed, by assigning each ounce of gold or pound of copper with an equivalent amountof waste removal cost. If the company were to expense stripping costs as incurred, there might be greater volatility in thecompany’s period-to-period results of operations.
In March 2005, the FASB ratified Emerging Issues Task Force Issue No. 04-6 Accounting for Stripping Costs Incurred duringProduction in the Mining Industry (EITF 04-6) which addresses the accounting for stripping costs incurred during theproduction phase of a mine and refers to these costs as variable production costs that should be included as a component ofinventory to be recognized in costs applicable to sales in the same period as the revenue from the sale of inventory. As aresult, capitalization of stripping costs is appropriate only to the extent product inventory exists at the end of a reportingperiod and the carrying value is less than the net realizable value. Newmont will adopt the provisions of EITF 04-6 on January1, 2006. The most significant impact of adoption is expected to be the removal of deferred and advanced stripping costs fromthe balance sheet, net of taxes and minority interests, and reclassifying the balances as a cumulative effect adjustmentreducing beginning retained earnings by approximately $75 to $85. Adoption of EITF 04-6 will have no impact on theCompany’s cash position.Source: Newmont Mining Corporation 2005 Annual Report
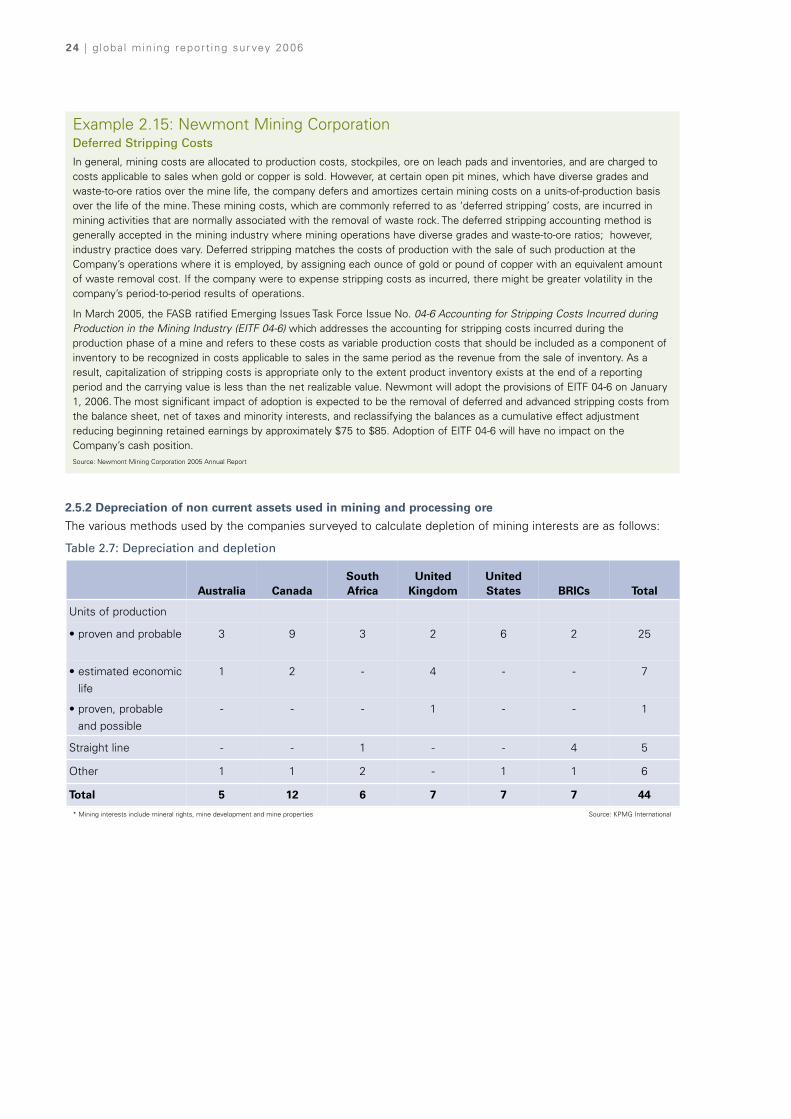
2.5.2 Depreciation of non current assets used in mining and processing ore
The various methods used by the companies surveyed to calculate depletion of mining interests are as follows:
Table 2.7: Depreciation and depletion
* Mining interests include mineral rights, mine development and mine properties
Australia CanadaSouthAfrica
UnitedKingdom
UnitedStates BRICs Total
Units of production
• proven and probable 3 9 3 2 6 2 25
• estimated economiclife
1 2 - 4 - - 7
• proven, probableand possible
- - - 1 - - 1
Straight line - - 1 - - 4 5
Other 1 1 2 - 1 1 6
Total 5 12 6 7 7 7 44
Source: KPMG International

globa l min ing report ing sur vey 2006 | 25
Three quarters of surveyed companies disclosed that they account for the depletion of their mining interests usingthe units of production method. The majority of BRICs companies surveyed continue to use the straight-linemethod of depletion.
In defining estimates of useful life of reserves for depletion purposes companies surveyed disclosed the followingcategories:
Chart 2.3: Reserves/resources included in useful lives
The majority of companies include only proven and probable reserves accounting for depletion. It should be notedhowever, that companies seldom define within the financial statements how and what code has been used tocalculate reserves for depletion purposes.
The various methods used by surveyed companies to calculate depreciation of plant and equipment related tomining assets are as follows:
In contrast to mining interests, the results of the survey show mining assets related to plant and equipment aretypically depreciated using the straight-line method as opposed to units of production.
Not disclosed
Other
Proven, probable plus a percentage of resources
Proven and probable
Proven14%
2%
73%
2%
9%
Table 2.8: Depreciation methods
Australia CanadaSouthAfrica
UnitedKingdom
UnitedStates BRICs Total
Units of production
• proven and probable 3 1 2 - 1 1 8
• estimated economic
life
1 1 - 1 - - 3
Straight line 1 8 2 6 6 5 28
Other - 2 2 - - 1 5
Total 5 12 6 7 7 7 44
Source: KPMG International
Source: KPMG International

26 | g loba l min ing report ing sur vey 2006
Examples of accounting policies with respect toproperty, plant and equipment are as follows:
Example 2.16: BHP Billiton LimitedDepreciation of property, plant and equipment
The carrying amounts of property, plant and equipment(including initial and any subsequent capital expenditure)are depreciated to their estimated residual value over theestimated useful lives of the specific assets concerned, orthe estimated life of the associated mine or mineral lease,if shorter. Estimates of residual values and useful lives arereassessed annually and any change in estimate is takeninto account in the determination of remaining depreciationcharges. The major categories of property, plant andequipment are depreciated on a unit of production and/orstraight-line basis using estimated lives as follows:
Buildings25 to 50 years
Land Not depreciated
Plant, machinery and equipment4 to 30 years
Mineral rightsBased on the estimated life of reserves on a unit ofproduction basis
Exploration, evaluation and development expenditureon mineral assets and other mining assetsOver the life of the proved and probable reserves on a unitof production basis.
Petroleum interestsOver the life of the proved developed oil and gas reserveson a unit of production basis
Leasehold buildingOver the life of the lease up to a maximum of 50 years
Vehicles3 to 5 years straight-line
Capitalized leased assetsUp to 50 years or life of lease, whichever is shorterSource: BHP Billiton Limited 2006 Annual Report
Example 2.17: Inco LimitedProperty, plant and equipment
Property, plant and equipment are stated at cost. Suchcost, in the case of mines, mineral rights and undevelopedproperties represents related acquisition and developmentexpenditures. Costs are capitalized for an undevelopedproperty when it is probable that such costs will berecovered from the exploitation of the property. Financingcosts, including interest, are capitalized when they arisefrom indebtedness incurred to finance the development,construction or expansion of significant mineral propertiesand facilities. Certain currency translation gains and losseshave been capitalized in respect of Voisey Bay’s mineralproperties in the development phase. Capitalization of suchgains and losses ceases when the development phase ofthe mineral property is substantially complete and ready foruse. Development costs are charged as an expense in theperiod incurred unless we believe a development projectmeets generally accepted criteria for deferral andamortization.
Depreciation and depletion
Property, plant and equipment is generally depreciated on astraight line basis over the following estimate economic lives:
Mine and mobile equipment - 3 to 10 years
Processing facilities and smelter equipment - 15 to 20 years
Refinery equipment - 5 to 20 years
Power generation facilities and equipment - 10 to 40 years
Furniture and fixture - 10 years
Port facilities and transportation equipment - 14 years
The estimated economic life is assessed on an annual basis,taking into account the state of the equipment, technologicalchanges and the related facilities or the estimated proven andprobable ore/mineral reserves where the equipment islocated. Some equipment has an estimated economic life inexcess of 20 years, and is being amortized on a 5 percentdeclining balance basis. When an assessment is made thatthe remaining life of that equipment is less than 20 years, thedepreciation method is switched to straight line. Depreciationstarts when an asset is ready for use or, in the case of a newmining operation, when an asset achieves commercialproduction.
Depletion of deferred mine development costs, includingcosts of acquired mineral rights, is calculated on a units-of-production basis over the estimated proven and probableore/mineral reserves which relate to the particular category ofdevelopment, either life of mine plan or area-specific. Nofuture development costs are taken into account incalculating the depletion charge.
Ongoing mine development costs that provide access to orefor less than two year’s production are expensed as incurred.Source: Inco Limited 2005 Annual Report
“The survey shows miningassets related to plant andequipment are typicallydepreciated using the straight-line method as opposed tounits of production”
globa l min ing report ing sur vey 2006 | 27
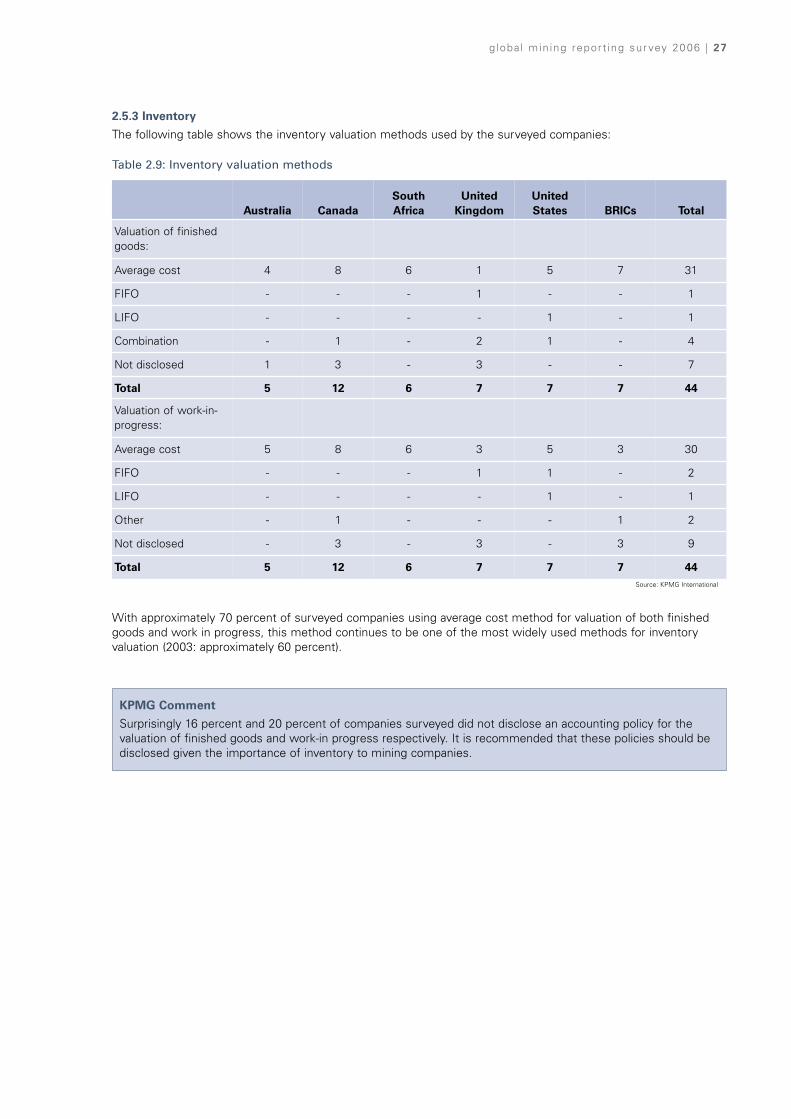
2.5.3 Inventory
The following table shows the inventory valuation methods used by the surveyed companies:
With approximately 70 percent of surveyed companies using average cost method for valuation of both finishedgoods and work in progress, this method continues to be one of the most widely used methods for inventoryvaluation (2003: approximately 60 percent).
KPMG Comment
Surprisingly 16 percent and 20 percent of companies surveyed did not disclose an accounting policy for thevaluation of finished goods and work-in progress respectively. It is recommended that these policies should bedisclosed given the importance of inventory to mining companies.
Table 2.9: Inventory valuation methods
Australia CanadaSouthAfrica
UnitedKingdom
UnitedStates BRICs Total
Valuation of finishedgoods:
Average cost 4 8 6 1 5 7 31
FIFO - - - 1 - - 1
LIFO - - - - 1 - 1
Combination - 1 - 2 1 - 4
Not disclosed 1 3 - 3 - - 7
Total 5 12 6 7 7 7 44
Valuation of work-in-progress:
Average cost 5 8 6 3 5 3 30
FIFO - - - 1 1 - 2
LIFO - - - - 1 - 1
Other - 1 - - - 1 2
Not disclosed - 3 - 3 - 3 9
Total 5 12 6 7 7 7 44Source: KPMG International
28 | g loba l min ing report ing sur vey 2006
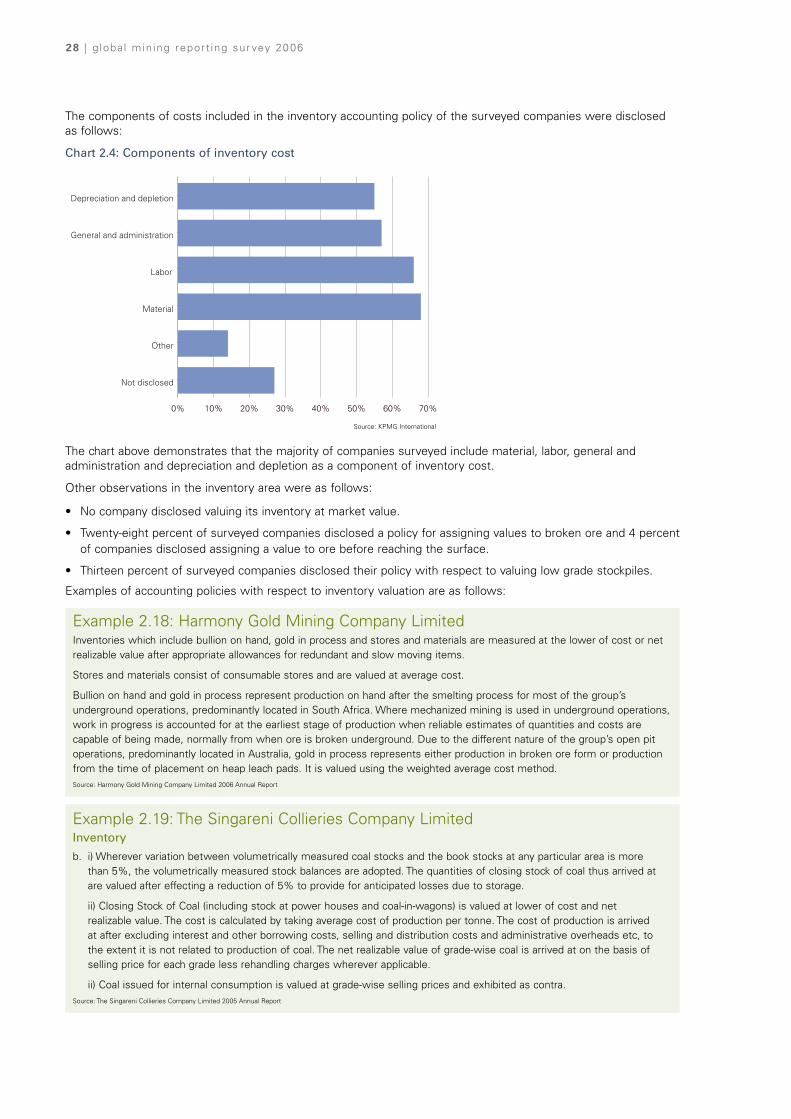
The components of costs included in the inventory accounting policy of the surveyed companies were disclosedas follows:
Chart 2.4: Components of inventory cost
The chart above demonstrates that the majority of companies surveyed include material, labor, general andadministration and depreciation and depletion as a component of inventory cost.
Other observations in the inventory area were as follows:
• No company disclosed valuing its inventory at market value.
• Twenty-eight percent of surveyed companies disclosed a policy for assigning values to broken ore and 4 percentof companies disclosed assigning a value to ore before reaching the surface.
• Thirteen percent of surveyed companies disclosed their policy with respect to valuing low grade stockpiles.
Examples of accounting policies with respect to inventory valuation are as follows:
Example 2.18: Harmony Gold Mining Company LimitedInventories which include bullion on hand, gold in process and stores and materials are measured at the lower of cost or netrealizable value after appropriate allowances for redundant and slow moving items.
Stores and materials consist of consumable stores and are valued at average cost.
Bullion on hand and gold in process represent production on hand after the smelting process for most of the group’sunderground operations, predominantly located in South Africa. Where mechanized mining is used in underground operations,work in progress is accounted for at the earliest stage of production when reliable estimates of quantities and costs arecapable of being made, normally from when ore is broken underground. Due to the different nature of the group’s open pitoperations, predominantly located in Australia, gold in process represents either production in broken ore form or productionfrom the time of placement on heap leach pads. It is valued using the weighted average cost method.Source: Harmony Gold Mining Company Limited 2006 Annual Report
Example 2.19: The Singareni Collieries Company LimitedInventory
b. i) Wherever variation between volumetrically measured coal stocks and the book stocks at any particular area is morethan 5%, the volumetrically measured stock balances are adopted. The quantities of closing stock of coal thus arrived atare valued after effecting a reduction of 5% to provide for anticipated losses due to storage.
ii) Closing Stock of Coal (including stock at power houses and coal-in-wagons) is valued at lower of cost and netrealizable value. The cost is calculated by taking average cost of production per tonne. The cost of production is arrivedat after excluding interest and other borrowing costs, selling and distribution costs and administrative overheads etc, tothe extent it is not related to production of coal. The net realizable value of grade-wise coal is arrived at on the basis ofselling price for each grade less rehandling charges wherever applicable.
ii) Coal issued for internal consumption is valued at grade-wise selling prices and exhibited as contra.Source: The Singareni Collieries Company Limited 2005 Annual Report
0% 10% 20% 30% 40% 50% 60% 70%
Material
Labor
General and administration
Depreciation and depletion
Not disclosed
Other
Source: KPMG International

globa l min ing report ing sur vey 2006 | 29
2.6 Product salesSelling the product (including establishing the terms of sale, managing the logistics of delivery and receivingpayment) is a process that differs significantly across the mining industry, typically depending on the commodity sold.
Companies can sell their products directly to customers or for further processing to smelting or refiningcompanies who in turn sell to the end users. The large diversified mining companies however, often smelt or refineproduct arising from their existing mining activities. In addition, these facilities can be used to toll third partymaterial along with their own.
2.6.1 Revenue recognition
Of the 44 companies surveyed, 42 explicitly included a revenue accounting policy disclosing the timing of revenuerecognition. This is consistent with the previous survey. However, the accounting policies have become even moreconsistent with all 42 companies disclosing that revenue is recognized at time of delivery, shipment or transfer ofownership/transfer of risk and reward. This reflects the continuing convergence of accounting standards.
An example accounting policy with respect to revenue recognition is as follows:
Example 2.20: Teck ComincoRevenue Recognition
Sales are recognized and revenues are recorded when title transfers and the rights and obligations of ownership pass to thecustomer. The majority of the company's metal concentrates are sold under pricing arrangements where final prices aredetermined by quoted market prices in a period subsequent to the date of sale. In these circumstances, revenues are recordedat the times of sale based on forward prices for the expected date of the final settlement. Subsequent variations in the price arerecognized in revenue as settlement adjustments each period end and in the period when the price is finalized.Source: Teck Cominco 2005 Annual Report
2.6.2 Sale of by-products
Forty-three percent of surveyed companies disclosed how they record by-product credits. Of those, 13 disclosedthat they recognize by-product credits as revenue, while the remaining six recognize them as a reduction of cost of sales. In the 2003 survey, 10 companies disclosed that they recognized by-product credits as revenue while sixcompanies recognized the amounts as a reduction of cost of sales.
2.6.3 Other sales disclosures
The survey found that other disclosures made by companies with respect to revenue were generally focused onvolume rather than revenue. Certain companies have provided a particularly useful discussion of sales on adisaggregated basis as follows:
• Sixty-eight percent of surveyed companies discussed sale of product by type
• Forty-three percent of surveyed companies discussed sale of product by mine
• Fifty-two percent of surveyed companies included a discussion of sales contracts.
Table 2.10: Treatment of by-products
SouthAfrica Canada
UnitedKingdom Australia
UnitedStates BRICs Total
Revenue 2 1 5 1 4 0 13
Reduction of cost
of sales
1 2 0 0 2 1 6
Not disclosed 3 9 2 4 1 6 25
Total 6 12 7 5 7 7 44
Source: KPMG International

30 | g loba l min ing report ing sur vey 2006
Source: Rio Tinto Iron Ore

globa l min ing report ing sur vey 2006 | 31
Example 2.21: Falconbridge LimitedSales volumes and realized pricesMetal sales
Falconbridge’s beneficial
(tonnes) Interest (%) 2005 2,3 2004 2,3
Copper
CCR 100 298,286 293,174
Collahuasi 37.3 26,137 25,330
Kidd Creek 84.9 84,827 82,188
Lomas Bayas 84.9 63,746 60,190
Nikkelverk 84.9 59,470 51,057
Total 532,466 511,939
Falconbridge share 497,104 422,027
Nickel
Nikkelverk 84.9 85,374 71,374
Falconbridge share 72,483 42,039
Ferronickel
Falcondo 72.4 26,289 28,936
Falconbridge share 19,033 14,526
Zinc
Kidd Creek 84.9 116,071 119,535
Noranda Income Fund 25 271,824 274,793
Total 387,895 394,328
Falconbridge share 166,500 139,104
Lead
Brunswick 100 73,730 83,194
Falconbridge share 73,730 83,194
Aluminum
Noranda Aluminum
Primary operations 100 247,771 248,977
Falconbridge share 247,771 248,977
Fabricated aluminum
Norandal Rolling Mill 100 177,910 173,853
Falconbridge share 177,910 173,853
Cobalt
Nikkelverk 84.9 3,836 3,648
Falconbridge share 3,257 2,149
Gold (000 ounces)
CCR 100 775 967
Falconbridge share 775 967
Silver (000 ounces)
CCR 100 32,786 36,467
Falconbridge share 32,786 36,467
Concentrate sales
Falconbridge’s beneficial
(tonnes) Interest (%) 2005 2,3 2004 2,3
Copper
Antamina 33.75 91,567 80,905
Collahuasi 37.3 119,212 167,261
Horne 100 56,385 27,091
Total 267,164 275,257
Falconbridge share 249,163 206,513
Zinc
Antamina 33.75 40,699 51,951
Bell Allard 100 - 70,371
Brunswick 100 219,417 222,141
Kidd Creek 84.9 42,020 15,724
Total 302,136 360,187
Falconbridge share 295,791 353,724
Bauxite
St. Ann 50 928,735 21,320
Falconbridge share 928,735 21,320
Alumina
Gramercy 50 355,221 80,625
Falconbridge share 355,221 80,625
Molybdenum
Antamina 33.75 2,468 613
Collahuasi 37.3 251 -
Total 2,719 613
Falconbridge share 2,681 613
Silver (000 ounces)
Antamina 33.75 1,633 2,334
Falconbridge share 1,633 2,334
Average Realised Prices
(US$ per pound, except as noted) 2005 2,3 2004 2,3
Copper 1.71 1.30
Nickel 6.85 6.40
Ferronickel 6.74 6.37
Zinc 0.70 0.52
Aluminum 0.91 0.84
Lead 0.50 0.43
Cobalt 14.97 22.48
Molybdenum 31.09 16.21
Gold (US$ per ounce) 444.08 402.17
Silver (US$ per ounce) 7.32 6.51
Exchange Rate (equivalent of Ccn $1.00) 0.83 0.77
Source: Falconbridge Limited 2005 Annual Report
1. All production figures are shown on a 100% basis, with the exception of Collahuasi, whichrepresents Falconbridge's 44% joint venture interest, Antamina which representsFalconbridge's 33.75% joint venture interest, St Ann, which represents Falconbridge's 50%joint venture interest, Gramercy, which represents Falconbridge's 50% joint venture interestand Louvicourt, which represents Novicourt's 45% joint venture interest.
2. Noroanda Inc. amalgamated with Falconbridge Limited (“the former Falconbridge”) on June30, 2005 and was renamed Falconbridge Limited (“the amalgamated Company”). After June30, 2005 the amalgamated Company owned 100% beneficial interest in the operations of theformer Falconbridge and the 2005 annual weighted average beneficial interest in the formerFalconbridge held by the amalgamated Company was 84.9% (2004 - 58.9%).
3. Falconbridge Limited sold the CEZ refinery to the Noranda Income Fund in May 2002. Theaverage beneficial interest was 25% in 2005 and in 2004.
The following is an example sales disclosure:
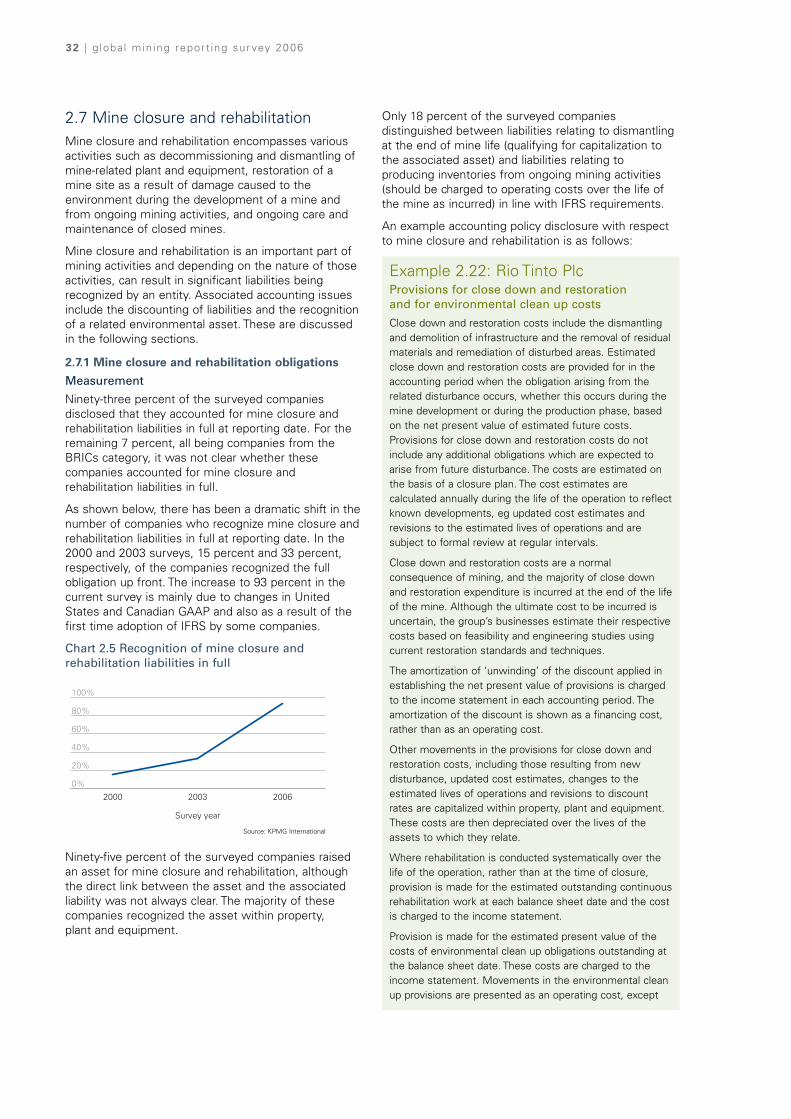
2.7 Mine closure and rehabilitationMine closure and rehabilitation encompasses variousactivities such as decommissioning and dismantling ofmine-related plant and equipment, restoration of amine site as a result of damage caused to theenvironment during the development of a mine andfrom ongoing mining activities, and ongoing care andmaintenance of closed mines.
Mine closure and rehabilitation is an important part ofmining activities and depending on the nature of thoseactivities, can result in significant liabilities beingrecognized by an entity. Associated accounting issuesinclude the discounting of liabilities and the recognitionof a related environmental asset. These are discussedin the following sections.
2.7.1 Mine closure and rehabilitation obligations
Measurement
Ninety-three percent of the surveyed companiesdisclosed that they accounted for mine closure andrehabilitation liabilities in full at reporting date. For theremaining 7 percent, all being companies from theBRICs category, it was not clear whether thesecompanies accounted for mine closure andrehabilitation liabilities in full.
As shown below, there has been a dramatic shift in thenumber of companies who recognize mine closure andrehabilitation liabilities in full at reporting date. In the2000 and 2003 surveys, 15 percent and 33 percent,respectively, of the companies recognized the fullobligation up front. The increase to 93 percent in thecurrent survey is mainly due to changes in UnitedStates and Canadian GAAP and also as a result of thefirst time adoption of IFRS by some companies.
Chart 2.5 Recognition of mine closure andrehabilitation liabilities in full
Ninety-five percent of the surveyed companies raisedan asset for mine closure and rehabilitation, althoughthe direct link between the asset and the associatedliability was not always clear. The majority of thesecompanies recognized the asset within property, plant and equipment.
Only 18 percent of the surveyed companiesdistinguished between liabilities relating to dismantlingat the end of mine life (qualifying for capitalization tothe associated asset) and liabilities relating toproducing inventories from ongoing mining activities(should be charged to operating costs over the life ofthe mine as incurred) in line with IFRS requirements.
An example accounting policy disclosure with respectto mine closure and rehabilitation is as follows:
Example 2.22: Rio Tinto PlcProvisions for close down and restoration and for environmental clean up costs
Close down and restoration costs include the dismantlingand demolition of infrastructure and the removal of residualmaterials and remediation of disturbed areas. Estimatedclose down and restoration costs are provided for in theaccounting period when the obligation arising from therelated disturbance occurs, whether this occurs during themine development or during the production phase, basedon the net present value of estimated future costs.Provisions for close down and restoration costs do notinclude any additional obligations which are expected toarise from future disturbance. The costs are estimated onthe basis of a closure plan. The cost estimates arecalculated annually during the life of the operation to reflectknown developments, eg updated cost estimates andrevisions to the estimated lives of operations and aresubject to formal review at regular intervals.
Close down and restoration costs are a normalconsequence of mining, and the majority of close downand restoration expenditure is incurred at the end of the lifeof the mine. Although the ultimate cost to be incurred isuncertain, the group’s businesses estimate their respectivecosts based on feasibility and engineering studies usingcurrent restoration standards and techniques.
The amortization of ‘unwinding’ of the discount applied inestablishing the net present value of provisions is chargedto the income statement in each accounting period. Theamortization of the discount is shown as a financing cost,rather than as an operating cost.
Other movements in the provisions for close down andrestoration costs, including those resulting from newdisturbance, updated cost estimates, changes to theestimated lives of operations and revisions to discountrates are capitalized within property, plant and equipment.These costs are then depreciated over the lives of theassets to which they relate.
Where rehabilitation is conducted systematically over thelife of the operation, rather than at the time of closure,provision is made for the estimated outstanding continuousrehabilitation work at each balance sheet date and the costis charged to the income statement.
Provision is made for the estimated present value of thecosts of environmental clean up obligations outstanding atthe balance sheet date. These costs are charged to theincome statement. Movements in the environmental cleanup provisions are presented as an operating cost, except
32 | g loba l min ing report ing sur vey 2006
0%
20%
40%
60%
80%
100%
200620032000
Survey year
Source: KPMG International
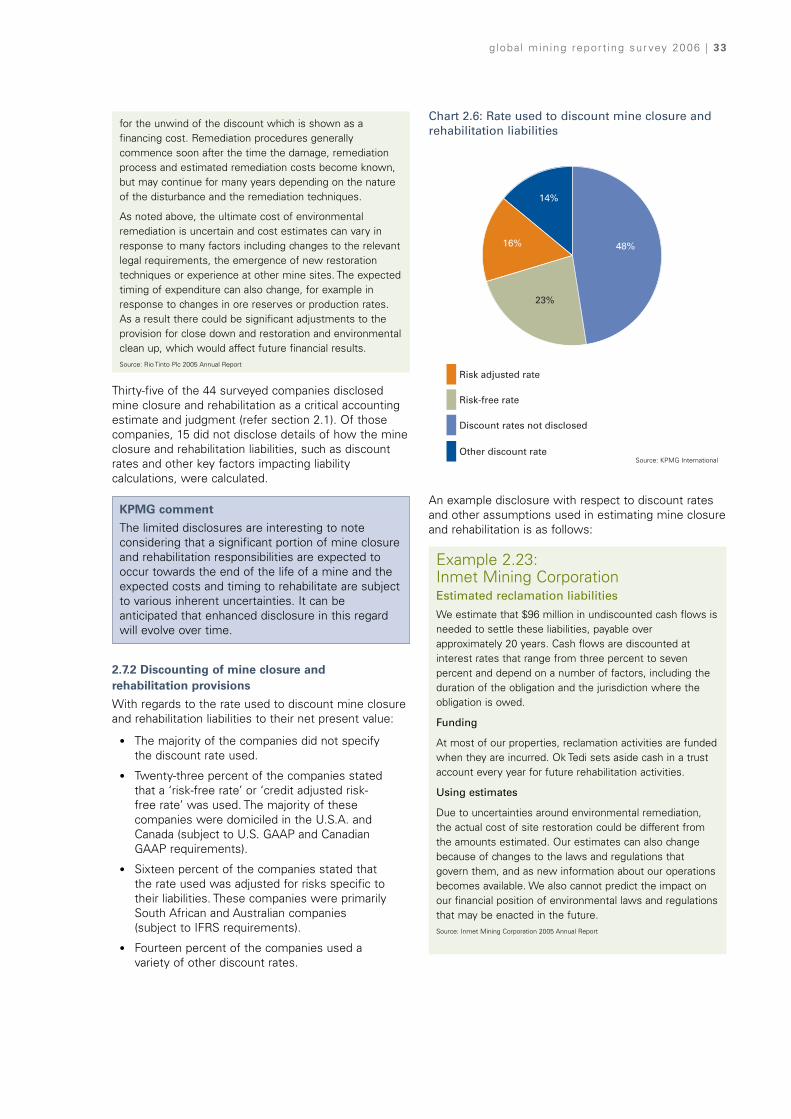
for the unwind of the discount which is shown as afinancing cost. Remediation procedures generallycommence soon after the time the damage, remediationprocess and estimated remediation costs become known,but may continue for many years depending on the natureof the disturbance and the remediation techniques.
As noted above, the ultimate cost of environmentalremediation is uncertain and cost estimates can vary inresponse to many factors including changes to the relevantlegal requirements, the emergence of new restorationtechniques or experience at other mine sites. The expectedtiming of expenditure can also change, for example inresponse to changes in ore reserves or production rates.As a result there could be significant adjustments to theprovision for close down and restoration and environmentalclean up, which would affect future financial results.Source: Rio Tinto Plc 2005 Annual Report
Thirty-five of the 44 surveyed companies disclosedmine closure and rehabilitation as a critical accountingestimate and judgment (refer section 2.1). Of thosecompanies, 15 did not disclose details of how the mineclosure and rehabilitation liabilities, such as discountrates and other key factors impacting liabilitycalculations, were calculated.
KPMG comment
The limited disclosures are interesting to noteconsidering that a significant portion of mine closureand rehabilitation responsibilities are expected tooccur towards the end of the life of a mine and theexpected costs and timing to rehabilitate are subjectto various inherent uncertainties. It can beanticipated that enhanced disclosure in this regardwill evolve over time.
2.7.2 Discounting of mine closure and rehabilitation provisions
With regards to the rate used to discount mine closureand rehabilitation liabilities to their net present value:
• The majority of the companies did not specifythe discount rate used.
• Twenty-three percent of the companies statedthat a ‘risk-free rate’ or ‘credit adjusted risk-free rate’ was used. The majority of thesecompanies were domiciled in the U.S.A. andCanada (subject to U.S. GAAP and CanadianGAAP requirements).
• Sixteen percent of the companies stated thatthe rate used was adjusted for risks specific totheir liabilities. These companies were primarilySouth African and Australian companies(subject to IFRS requirements).
• Fourteen percent of the companies used avariety of other discount rates.
Chart 2.6: Rate used to discount mine closure andrehabilitation liabilities
An example disclosure with respect to discount ratesand other assumptions used in estimating mine closureand rehabilitation is as follows:
Example 2.23: Inmet Mining CorporationEstimated reclamation liabilities
We estimate that $96 million in undiscounted cash flows isneeded to settle these liabilities, payable overapproximately 20 years. Cash flows are discounted atinterest rates that range from three percent to sevenpercent and depend on a number of factors, including theduration of the obligation and the jurisdiction where theobligation is owed.
Funding
At most of our properties, reclamation activities are fundedwhen they are incurred. Ok Tedi sets aside cash in a trustaccount every year for future rehabilitation activities.
Using estimates
Due to uncertainties around environmental remediation,the actual cost of site restoration could be different fromthe amounts estimated. Our estimates can also changebecause of changes to the laws and regulations thatgovern them, and as new information about our operationsbecomes available. We also cannot predict the impact onour financial position of environmental laws and regulationsthat may be enacted in the future.Source: Inmet Mining Corporation 2005 Annual Report
g loba l min ing report ing sur vey 2006 | 33
Other discount rate
Risk adjusted rate
Risk-free rate
Discount rates not disclosed16%
14%
48%
23%
Other discount rate
Risk adjusted rate
Risk-free rate
Discount rates not disclosed16%
14%
48%
23%
Source: KPMG International
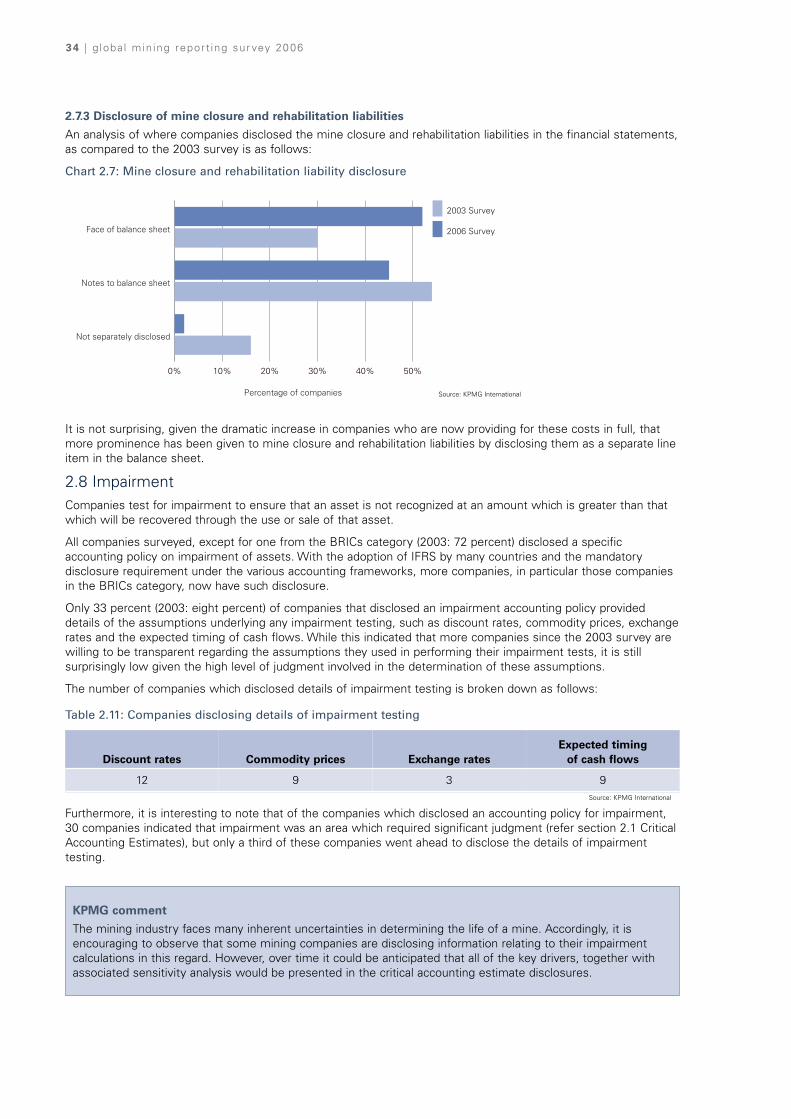
34 | g loba l min ing report ing sur vey 2006
2.7.3 Disclosure of mine closure and rehabilitation liabilities
An analysis of where companies disclosed the mine closure and rehabilitation liabilities in the financial statements,as compared to the 2003 survey is as follows:
Chart 2.7: Mine closure and rehabilitation liability disclosure
It is not surprising, given the dramatic increase in companies who are now providing for these costs in full, thatmore prominence has been given to mine closure and rehabilitation liabilities by disclosing them as a separate lineitem in the balance sheet.
2.8 ImpairmentCompanies test for impairment to ensure that an asset is not recognized at an amount which is greater than thatwhich will be recovered through the use or sale of that asset.
All companies surveyed, except for one from the BRICs category (2003: 72 percent) disclosed a specificaccounting policy on impairment of assets. With the adoption of IFRS by many countries and the mandatorydisclosure requirement under the various accounting frameworks, more companies, in particular those companiesin the BRICs category, now have such disclosure.
Only 33 percent (2003: eight percent) of companies that disclosed an impairment accounting policy provideddetails of the assumptions underlying any impairment testing, such as discount rates, commodity prices, exchangerates and the expected timing of cash flows. While this indicated that more companies since the 2003 survey arewilling to be transparent regarding the assumptions they used in performing their impairment tests, it is stillsurprisingly low given the high level of judgment involved in the determination of these assumptions.
The number of companies which disclosed details of impairment testing is broken down as follows:
Furthermore, it is interesting to note that of the companies which disclosed an accounting policy for impairment,30 companies indicated that impairment was an area which required significant judgment (refer section 2.1 CriticalAccounting Estimates), but only a third of these companies went ahead to disclose the details of impairmenttesting.
KPMG comment
The mining industry faces many inherent uncertainties in determining the life of a mine. Accordingly, it isencouraging to observe that some mining companies are disclosing information relating to their impairmentcalculations in this regard. However, over time it could be anticipated that all of the key drivers, together withassociated sensitivity analysis would be presented in the critical accounting estimate disclosures.
Table 2.11: Companies disclosing details of impairment testing
Discount rates Commodity prices Exchange ratesExpected timing
of cash flows
12 9 3 9
0% 10% 20% 30% 40% 50%
2003 Survey
2006 Survey
Not separately disclosed
Notes to balance sheet
Face of balance sheet
Percentage of companies Source: KPMG International
Source: KPMG International
globa l min ing report ing sur vey 2006 | 35
Example 2.24: AngloGold Ashanti LimitedImpairment of assets
Intangible assets that have an indefinite useful life and separately recognized goodwill are not subject to amortization and aretested annually for impairment and whenever events or changes in circumstances indicate that the carrying amount may notbe recoverable. Assets that are subject to amortization are tested for impairment whenever events or changes incircumstance indicate that the carrying amount may not be recoverable.
An impairment loss is recognized for the amount by which the asset’s carrying amount exceeds its recoverable amount. Therecoverable amount is the higher of an asset’s fair value, less costs to sell and value in use. For the purposes of assessingimpairment, assets are grouped at the lowest levels for which there are separately identifiable cash flows (cash-generating units).
Impairment calculation assumptions include life of mine plans based on prospective reserves and resources, management’sestimate of the future gold price based on current market price trends, foreign exchange rates, and a pre-tax discount rateadjusted for country and project risk. It is therefore reasonably possible that changes could occur which may affect therecoverability of tangible and intangible assets.Source: AngloGold Ashanti Limited 2005 Annual Report
Example 2.25: BHP Billiton LimitedImpairment of non-current assets
Formal impairment tests are carried out annually for goodwill, indefinite life intangible assets and intangible assets not yet availablefor use. Formal impairment tests for all other assets are performed when there is an indication of impairment. At each reportingdate, an assessment is made to determine whether there are any indications of impairment. The BHP Billiton Group conductsannually an internal review of asset values which is used as a source of information to assess for any indications of impairment.External factors, such as changes in expected future processes, costs and other market factors are also monitored to assess forindications of impairment. If any indication of impairment exists an estimate of the asset’s recoverable amount is calculated. Therecoverable amount is determined as the higher of the fair value less costs to sell for the asset and the asset’s value in use.
If the carrying amount of the asset exceeds its recoverable amount, the asset is impaired and an impairment loss is charged to theincome statement so as to reduce the carrying amount in the balance sheet to its recoverable amount.
Fair value is determined as the amount that would be obtained from the sale of the asset in an arm’s length transaction betweenknowledgeable and willing parties. Direct costs of selling the asset are deducted. Fair value for mineral assets is generallydetermined as the present value of the estimated future cashflows expected to arise from the continued use of the asset,including any expansion prospects, and its eventual disposal, using assumptions that a market participant could take into account.These cashflows are discounted by an appropriate discount rate to arrive at a net present value (NPV) of the asset.
Value in use is determined as the present value of the estimated future cashflows expected to arise from the continued use of theasset in its present form and its eventual disposal. Value in use is determined by applying assumptions specific to the group’scontinued use and cannot take into account future development. These assumptions are different to those used in calculating fairvalue and consequently the value in use calculation is likely to give a different result (usually lower) to a fair value calculation.
In testing for indications of impairment and performing impairment calculations, assets are considered as collective groups andreferred to as cash generating units. Cash generating units are the smallest identifiable group of assets, liabilities and associatedgoodwill that generate cash inflows that are largely independent of the cash inflows from other assets or groups of assets.
The impairment assessments are based on a range of estimates and assumptions, including:
Estimates/assumptions Basis
Future production Proved and probable reserves, resource estimates and, in certain cases, expansion projects
Commodity prices Forward market and contract prices, and longer-term price protocol estimates
Exchange rates Current (forward) market exchange rates
Discount rates Cost of capital risk adjusted for the resource concernedSource: BHP Billiton Limited 2006 Annual Report
Of the companies which disclosed an impairment accounting policy, ten specifically defined what they regarded asa group of assets that generate cash inflows independently for use in an impairment calculation.
Example accounting policies with respect to impairment are as follows:
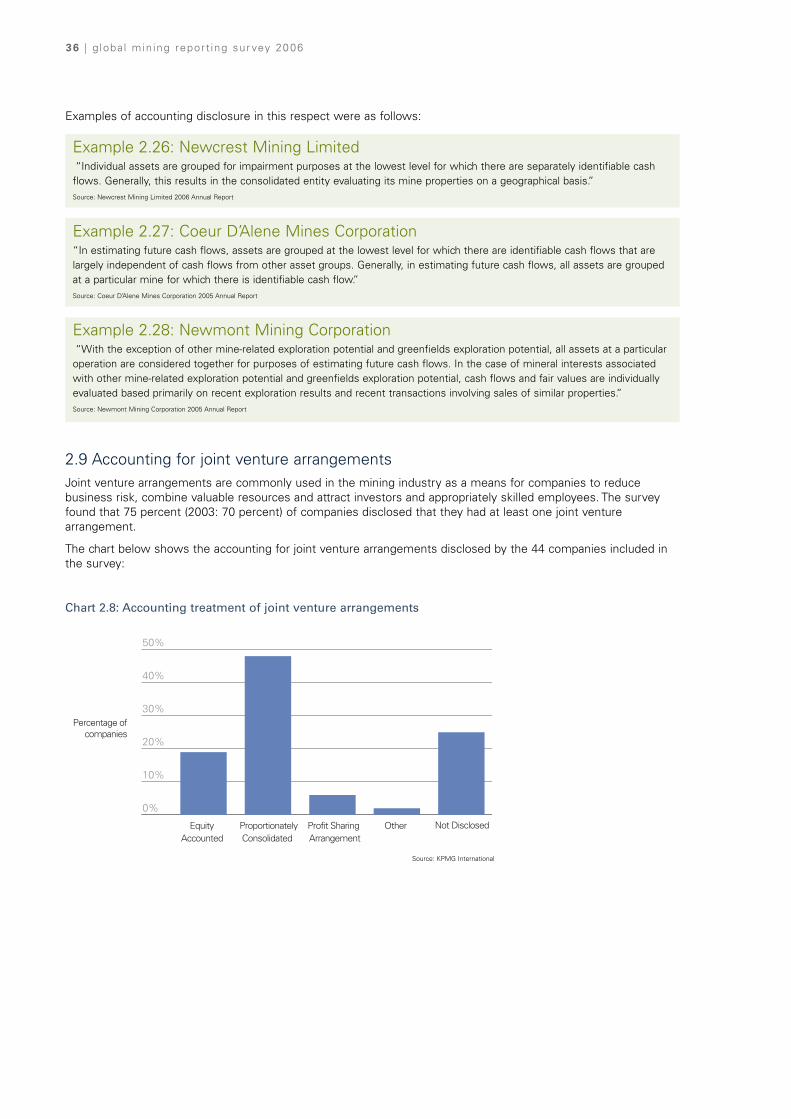
36 | g loba l min ing report ing sur vey 2006
Example 2.26: Newcrest Mining Limited“Individual assets are grouped for impairment purposes at the lowest level for which there are separately identifiable cashflows. Generally, this results in the consolidated entity evaluating its mine properties on a geographical basis.”Source: Newcrest Mining Limited 2006 Annual Report
Example 2.27: Coeur D’Alene Mines Corporation“In estimating future cash flows, assets are grouped at the lowest level for which there are identifiable cash flows that arelargely independent of cash flows from other asset groups. Generally, in estimating future cash flows, all assets are groupedat a particular mine for which there is identifiable cash flow.”Source: Coeur D’Alene Mines Corporation 2005 Annual Report
Example 2.28: Newmont Mining Corporation“With the exception of other mine-related exploration potential and greenfields exploration potential, all assets at a particularoperation are considered together for purposes of estimating future cash flows. In the case of mineral interests associatedwith other mine-related exploration potential and greenfields exploration potential, cash flows and fair values are individuallyevaluated based primarily on recent exploration results and recent transactions involving sales of similar properties.”Source: Newmont Mining Corporation 2005 Annual Report
2.9 Accounting for joint venture arrangementsJoint venture arrangements are commonly used in the mining industry as a means for companies to reducebusiness risk, combine valuable resources and attract investors and appropriately skilled employees. The surveyfound that 75 percent (2003: 70 percent) of companies disclosed that they had at least one joint venturearrangement.
The chart below shows the accounting for joint venture arrangements disclosed by the 44 companies included inthe survey:
Chart 2.8: Accounting treatment of joint venture arrangements
0%
10%
20%
30%
40%
50%
Not DisclosedOtherProfit Sharing Arrangement
Proportionately Consolidated
Percentage of companies
Equity Accounted
Examples of accounting disclosure in this respect were as follows:
Source: KPMG International

globa l min ing report ing sur vey 2006 | 37
On a country by country basis this can be broken down as follows:
Note: Four companies disclosed more than one type of joint venture arrangement in their accounts.
Table 2.12: Accounting treatment of joint venture arrangements by country
Australia CanadaSouthAfrica
UnitedKingdom
UnitedStates BRICs Total
Equity Accounted 3 1 –- 2 1 2 9
Proportionately
Consolidated
2 10 5 3 3 – 23
Profit Sharing
Arrangement
– – 1 – 2 – 3
Other – 1 – – – – 1
None or Not
Disclosed
1 1 1 3 1 5 12
Total 6 13 7 8 7 7 48
The survey found a large portion of companies applyproportionate consolidation particularly in Canada andSouth Africa, while the United Kingdom and Australiashowed a mix between equity accounting andproportionate consolidation.
For many companies, established industry practice pre-IFRS was often to recognize these joint arrangementsby proportionate consolidation, such that eachparticipant account for income from sales of their shareof the product and their proportionate share ofexpense, assets and liabilities.
While this practice is still common for some types ofarrangements, to continue to account in this mannerunder IFRS, it must be demonstrated that genuine jointcontrol exists. Joint control is unanimous consent of alljoint venture parties with respect to strategic financialand operating decisions. In addition Australianequivalents to IFRS (AIFRS) remove the proportionateconsolidation alternative for jointly controlled entitiesand mandate equity accounting.
For many companies transitioning to IFRS and AIFRSthis has caused a change in accounting as theunanimous consent test is not met in allcircumstances, particularly when ownership interest is not ‘50/50’. Depending on the terms of theagreement, the changes have led to consolidation,where control rather than joint control exists; or more commonly to equity accounting for those whoown less than 50 percent.
If a company’s major asset is an active interest in ajoint venture, then the requirement to equity accountrather than proportionately consolidate will have apervasive impact on the financial statements: allunderlying assets and liabilities are replaced by one line‘investment in associates’ in the balance sheet andrevenue, costs and tax expense are replaced by oneline in the income statement ‘share of profits fromassociates’, which is reported after tax.
As a consequence, there seems to be a growing trendfor companies to disclose additional ‘non-GAAP’measures to focus on the results which they previouslyreported on directly. This is covered in greater detail insection 2.14.
Source: KPMG International
Source: Rio Tinto Iron Ore
“The survey found a largeportion of companies stillapply proportionateconsolidation”

38 | g loba l min ing report ing sur vey 2006
Examples of accounting policies with respect to accounting for joint venture arrangements are as follows:
Example 2.29: Xstrata PlcInterests in joint ventures
A joint venture is a contractual arrangement whereby two or more parties undertake an economic activity that is subject tojoint control. The financial statements of the joint ventures are prepared for the same reporting period as the company, usingconsistent accounting policies. Adjustments are made to bring into line any dissimilar accounting policies that may exist.
Jointly controlled operations
A jointly controlled operation involves the use of assets and other resources of the group and other venturers rather than theestablishment of a corporation, partnership or other entity.
The group accounts for the assets it controls and the liabilities it incurs, the expenses it incurs and the share of income that itearns from the sale of goods or services by the joint venture.
Jointly controlled assets
A jointly controlled asset involves joint control and offers joint ownership by the group and other venturers of assetscontributed to or acquired for the purpose of the joint venture, without the formation of a corporation, partnership orother entity.
The group accounts for its share of the jointly controlled assets, any liabilities it has incurred, its share of any liabilities jointlyincurred with other ventures, income from the sale or use of its share of the joint venture’s output, together with its share ofthe expenses incurred by the joint venture and any expenses it incurs in relation to its interest in the joint venture.
Jointly controlled entities
A jointly controlled entity involves the establishment of a corporation, partnership or other legal entity in which the group hasan interest along with other venturers.
The group recognizes its interest in jointly controlled entities using the proportionate method of consolidation whereby thegroup’s share of each of the assets, liabilities, income and expenses of the joint venture are combined with the similar items,line by line, in its consolidated financial statements.
When the group contributes or sells assets to a joint venture, any portion of gain or loss from the transaction is recognizedbased on the substance of the transaction. When the group has transferred the risk and rewards of ownership to the jointventure, the group will generally only recognize the portion of the gain or loss attributable to the other ventures, unless theloss is reflective of an impairment, in which case the loss is recognized in full. When the group purchases assets from thejoint venture, it does not recognize its share of the profits of the joint venture from the transaction until it resells the assets toan independent party. Losses are accounted for in a similar manner unless they represent an impairment loss, in which casethey are recognized immediately.
Joint ventures are accounted for in the manner outlined above, until the date on which the group ceases to have joint controlover the joint venture.Source: Xstrata Plc 2005 Annual Report
Example 2.30: Anglo Platinum Limited Joint ventures
The group’s interest in jointly controlled entities is accounted for through proportionate consolidation. Under this method thegroup includes its share of the joint venture, individual income and expenses, assets and liabilities in the relevant componentsof its financial statements on a line-by-line basis.
Where a group company undertakes its activities under joint venture arrangement directly, the group’s share of jointly controlledassets and any liabilities incurred jointly with other venturers is recognized in the financial statements of the relevant companyand classified according to their nature. Liabilities and expenses incurred directly in respect of interests in jointly controlled assetsare accounted for on an accrual basis. Income from the sale or use of the group’s share of the output of jointly controlled assetsis recognized when the revenue recognition criteria detailed in the accounting policy note 9 are met.Source: Anglo Platinum Limited 2005 Annual Report
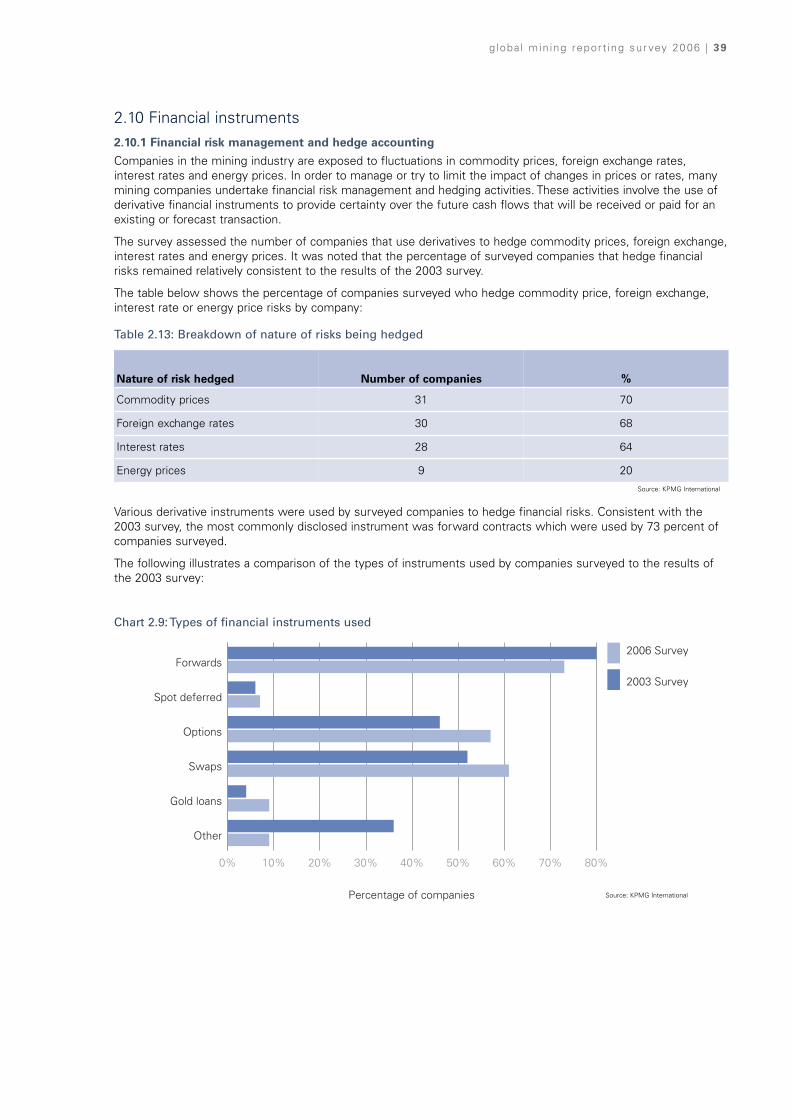
globa l min ing report ing sur vey 2006 | 39
2.10 Financial instruments2.10.1 Financial risk management and hedge accounting
Companies in the mining industry are exposed to fluctuations in commodity prices, foreign exchange rates,interest rates and energy prices. In order to manage or try to limit the impact of changes in prices or rates, manymining companies undertake financial risk management and hedging activities. These activities involve the use ofderivative financial instruments to provide certainty over the future cash flows that will be received or paid for anexisting or forecast transaction.
The survey assessed the number of companies that use derivatives to hedge commodity prices, foreign exchange,interest rates and energy prices. It was noted that the percentage of surveyed companies that hedge financialrisks remained relatively consistent to the results of the 2003 survey.
The table below shows the percentage of companies surveyed who hedge commodity price, foreign exchange,interest rate or energy price risks by company:
Table 2.13: Breakdown of nature of risks being hedged
Nature of risk hedged Number of companies %
Commodity prices 31 70
Foreign exchange rates 30 68
Interest rates 28 64
Energy prices 9 20
0% 10% 20% 30% 40% 50% 60% 70% 80%
2006 Survey
2003 Survey
Other
Gold loans
Swaps
Options
Spot deferred
Forwards
Percentage of companies
Various derivative instruments were used by surveyed companies to hedge financial risks. Consistent with the2003 survey, the most commonly disclosed instrument was forward contracts which were used by 73 percent ofcompanies surveyed.
The following illustrates a comparison of the types of instruments used by companies surveyed to the results ofthe 2003 survey:
Chart 2.9: Types of financial instruments used
Source: KPMG International
Source: KPMG International
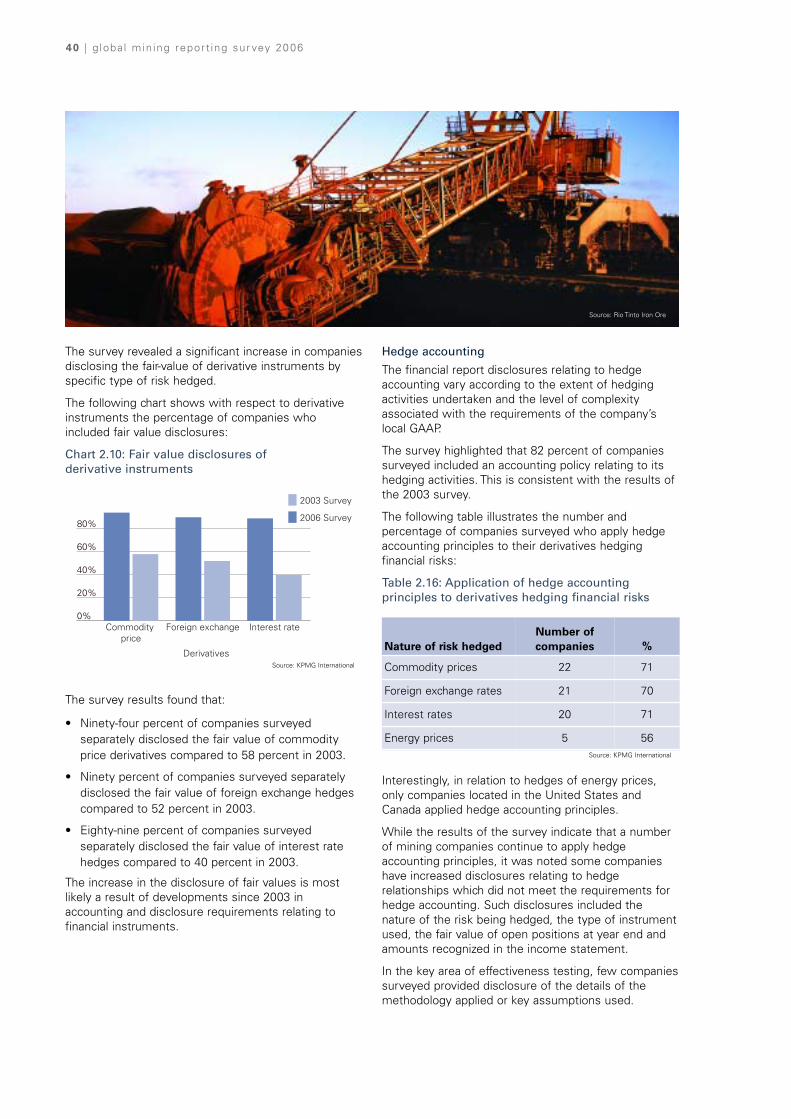
40 | g loba l min ing report ing sur vey 2006
The survey revealed a significant increase in companiesdisclosing the fair-value of derivative instruments byspecific type of risk hedged.
The following chart shows with respect to derivativeinstruments the percentage of companies whoincluded fair value disclosures:
Chart 2.10: Fair value disclosures of derivative instruments
The survey results found that:
• Ninety-four percent of companies surveyedseparately disclosed the fair value of commodityprice derivatives compared to 58 percent in 2003.
• Ninety percent of companies surveyed separatelydisclosed the fair value of foreign exchange hedgescompared to 52 percent in 2003.
• Eighty-nine percent of companies surveyedseparately disclosed the fair value of interest ratehedges compared to 40 percent in 2003.
The increase in the disclosure of fair values is mostlikely a result of developments since 2003 inaccounting and disclosure requirements relating tofinancial instruments.
Hedge accounting
The financial report disclosures relating to hedgeaccounting vary according to the extent of hedgingactivities undertaken and the level of complexityassociated with the requirements of the company’slocal GAAP.
The survey highlighted that 82 percent of companiessurveyed included an accounting policy relating to itshedging activities. This is consistent with the results ofthe 2003 survey.
The following table illustrates the number andpercentage of companies surveyed who apply hedgeaccounting principles to their derivatives hedgingfinancial risks:
Table 2.16: Application of hedge accountingprinciples to derivatives hedging financial risks
Interestingly, in relation to hedges of energy prices,only companies located in the United States andCanada applied hedge accounting principles.
While the results of the survey indicate that a numberof mining companies continue to apply hedgeaccounting principles, it was noted some companieshave increased disclosures relating to hedgerelationships which did not meet the requirements forhedge accounting. Such disclosures included thenature of the risk being hedged, the type of instrumentused, the fair value of open positions at year end andamounts recognized in the income statement.
In the key area of effectiveness testing, few companiessurveyed provided disclosure of the details of themethodology applied or key assumptions used.
0%
20%
40%
60%
80%
2003 Survey
2006 Survey
Interest rateForeign exchangeCommodityprice
DerivativesNature of risk hedged
Number ofcompanies %
Commodity prices 22 71
Foreign exchange rates 21 70
Interest rates 20 71
Energy prices 5 56
Source: KPMG International
Source: KPMG International
Source: Rio Tinto Iron Ore
globa l min ing report ing sur vey 2006 | 41
Example 2.31: Barrick Gold CorporationUse of derivative instruments (derivatives) in risk management
In the normal course of business, our assets, liabilities andforecasted transactions are impacted by various marketrisks including:
Under our risk management policy we seek to mitigate theimpact of these market risks to control costs and enable usto plan our business with greater certainty. The time-frameand manner in which we manage these risks varies foreach item based upon our assessment of the risk andavailable alternatives for mitigating risk. For these particularrisks, we believe that derivatives are an effective means ofmanaging risk.
Accounting policy for derivatives
We record derivatives on the balance sheet at fair valueexcept for gold and silver sales contracts, which areexcluded from the scope of FAS 133, because theobligations will be met by physical delivery of our gold andsilver production and they meet the other requirements setout in paragraph 10(b) of FAS 133. In addition, our pastsales practices, productive capacity and delivery intentionsare consistent with the definition of a normal salescontract. Accordingly, we have elected to designate ourgold and silver sales contracts as ‘normal sales contracts’with the result that the principles of FAS 133 are notapplied to them. Instead we apply revenue recognitionaccounting principles as described in note 5.
On the date we enter into a derivative that is accounted forunder FAS 133, we designate it as either a hedginginstrument or a non-hedge derivative . A hedginginstrument is designated in either:
• a fair value hedge relationship with a recognized asset orliability or
• a cash flow hedge relationship with either a forecastedtransaction or the variable future cash flows arising froma recognized asset or liability.
At the inception of a hedge, we formally document allrelationships between hedging instruments and hedgeditems, including the related risk-management strategy. Thisdocumentation includes linking all hedging instruments toeither specific assets and liabilities, specific forecastedtransactions or variable future cash flows. It also includesthe method of assessing retrospective and prospectivehedge effectiveness. In cases where we use regressionanalysis to assess prospective effectiveness, we considerregression outputs for the coefficient of determination (r-squared), the slope coefficient and the t-statistic to assesswhether a hedge is expected to be highly effective. Eachperiod, using a dollar offset approach, we retrospectivelyassess whether hedging instruments have been highlyeffective in offsetting changes in the fair value of hedgeditems and we measure the amount of any hedgeineffectiveness. We also assess each period whetherhedging instruments are expected to be highly effective inthe future. If a hedging instrument is not expected to behighly effective, we stop hedge accounting prospectively.In this case accumulated gains or losses remain in OCIuntil the hedged item affects earnings. We also stop hedgeaccounting prospectively if:
• a derivative is settled;
• it is no longer highly probable that a forecasted transaction will occur or
• we de-designate a hedging relationship.
If we conclude that it is probable that a forecastedtransaction will not occur in the originally specified timeframe, or within a further two month period, gains andlosses accumulated in OCI are immediately transferred toearnings. In all situations when hedge accounting stops, aderivative is classified as a non-hedge derivativeprospectively. Cash flows from derivative transactions areincluded under operating activities, except for derivativesdesignated as a cash flow hedge of forecasted capitalexpenditures, which are included under investing activities.
Changes in the fair value of derivatives each period arerecorded as follows:
• Fair value hedges: recorded in earnings as well as changesin fair value of the hedged item.
• Cash flow hedges: recorded in OCI until earnings areaffected by the hedged item, except for any hedgeineffectiveness which is recorded in earnings immediately.
• Non-hedge derivatives: recorded in earnings.
Summary of Derivatives at December 31, 20051.
Item Impacted by
Cost of sales
Consumption of diesel fueland propane
Local currency denominatedexpenditures
Prices of diesel fuel and propane
Currency exchange rates – US dollar versus A$, C$, and ARS
Administration costs in local currency
Currency exchange rates – US dollar versus A$ and C$
Capital expenditures in local currencies
Currency exchange rates– US dollar versus A$,C$, ARS and Euro
Interest earned on cash US dollar interest rates
Fair value of fixed-rate debt US dollar interest rates
An example of disclosure relating to derivative financial instruments and hedging is as follows:

42 | g loba l min ing report ing sur vey 2006
Disclosure of financial risk management activities
The survey revealed that:
• Sixty-eight percent of the companies surveyed disclosed information about their risk management objectivesand strategies.
• Thirty-two percent of companies disclosed information relating to responsibility for financial risk managementsuch as the use of board committees and existence of Board approved limits on the use of derivatives tomanage financial risks.
Example 2.31: Barrick Gold Corporation (continued)
Notional amount Accounting Fair value by term to classification by (US$
maturity notional amount millions)
Within 2 to Total Cash flow Fair value Non-1 Year 5 years hedge hedge hedge
US dollar interest rate contracts
Receive-fixed swaps (millions) $ – $ 975 $ 975 $ 425 $ 500 $ 50 $ (21)
Pay-fixed swaps (millions) $ – $ 125 $ 125 – – 125 $ (13)
Net notional position $ – $ 850 $ 850 $ 425 $ 500 $ (75) $ (34)
Currency contracts
C$:US$ contracts (C$millions) C$ 297 C$ 491 C$ 788 C$ 788 C$ – C$ – 2 $68
A$:US$ contracts (A$millions) A$ 537 A$ 1,676 A$ 2,213 A$ 2,212 A$ – A$ 1 61
ARS:US$ contracts (ARS millions) 36 – 36 36 – – (1)
Commodity contracts
WT! contracts (thousands of barrels) 476 1,417 1,893 1,502 – 391 $40
MOPS contracts (thousands of barrels) 121 – 121 121 – – (1)
Propane contracts (millions of gallons) 17 – 17 17 – – 4
1. Excludes gold sales contracts (see note 5), gold lease rate swaps (see note 5) and Celtic Resources share purchasewarrants (see note 11).
2. $62 million of non-hedge currency contracts were economically closed out by entering into offsetting positions, albeit withdiffering counterparties.Source: Barrick Gold Corporation 2005 Annual Report

globa l min ing report ing sur vey 2006 | 43
An example disclosure of financial risk management activities is as follows:
Example 2.32: AngloGold Ashanti LimitedFinancial risk management activities
In the normal course of its operations, the group is exposed to gold price, currency, interest rate, liquidity and credit risks. In orderto manage these risks, the group may enter into transactions which make use of both on-and off-balance sheet derivatives. Thegroup does not acquire, hold or issue derivatives for trading purposes. The group has developed a comprehensive riskmanagement process to facilitate, control and monitor these risks. The board has approved and monitors this risk managementprocess, inclusive of documented treasury policies, counterpart limits, controlling and reporting structures.
Controlling risk in the group
The Executive Committee and the Treasury Committee are responsible for risk management activities within the group. TheTreasury Committee, chaired by the independent chairman of the AngloGold Ashanti Audit and Corporate Governance Committee,comprising executives members and treasury executives, reviews and recommends to the Executive Committee all treasurycounterparts, limits, instruments and hedge strategies. The treasurer is responsible for managing investment, gold price, currency,liquidity and credit risk. Within the treasury function, there is an independent risk function, which monitors adherence to treasuryrisk management policy and counterpart limits and provides regular and detailed management reports.
The financial risk management objectives of the group are defined as follows:
• Safeguarding the group core earnings stream from its major assets through the effective control and management of goldprice risk, foreign exchange risk and interest rate risk.
• Effective and efficient usage of credit facilities in both the short and long term through the adoption of reliable liquiditymanagement planning and procedures.
• Ensuring that investment and hedging transactions are undertaken with creditworthy counterparts.
• Ensuring that all contracts and agreements related to risk management activities are co-ordinated, consistent throughoutthe group and comply where necessary with all relevant regulatory and statutory requirements.
Source: AngloGold Ashanti Limited 2005 Annual Report
2.10.2 ‘Own use’ or normal purchase and sale exemption
Contracts entered into by participants in the mining industry may possess characteristics which meet the definitionof a derivative. In jurisdictions which use IFRS or U.S. GAAP, such contracts must be accounted for at fair valueunless they satisfy conditions for the ‘own-use’ or ‘normal purchase and sale’ exemption.
Only five of the 44 companies surveyed disclosed information relating to the application of the own-use or normalpurchase and sale exemption. Disclosures in this regard by Barrick are included at example 2.31. In addition, AngloAmerican Plc included the following in the notes to its financial statements:
Example 2.33: Anglo American plcNormal purchase and normal sale contracts
Commodity based contracts that meet the requirements of IAS 39 in that they are settled through physical delivery of thegroup’s production, or are used within the production process, are classified as normal purchase and normal sale contracts. Inaccordance with IAS 39 these contracts are not marked to market when they are settled through physical delivery.
At year end 6.6 million ounces of gold were sold forward under normal sale contracts that mature over periods up toDecember 2015. The mark to market value of these contracts at this date was $1,281 million and is based on contracted goldprices of between $310/oz and $403/oz. This value at 31 December 2005 was based on a gold price of $517/oz, exchangerates of $/ZAR 6.305 and AUD/$0.734 and the prevailing market interest rates and volatilities at that date.
As at 9 February 2006, the marked to market value of AngloGold Ashanti’s total hedge book, including normal purchase andnormal sale contracts, was a negative $2.425 billion (negative ZAR14.99 billion), based on a gold price of $557.75/oz andexchange rates of $/ZAR6.18 and AUD/$0.7398 and the prevailing market interest rates and volatilities at the time.Source: Anglo American plc 2005 Annual Report
44 | g loba l min ing report ing sur vey 2006
2.10.3 Embedded derivatives
Mining companies enter into numerous arrangements for the sale of product or supply of materials or servicesand in certain circumstances, the terms of these arrangements may contain embedded derivatives.
The survey revealed that 28 percent of mining companies surveyed included an accounting policy in their financialstatements in relation to embedded derivatives. It was found 10 of the companies surveyed also includedinformation in the notes to the financial statements in relation to the nature of contracts containing embeddedderivatives.
BHP Billiton disclosed information on contracts containing embedded derivatives as follows:
Example 2.34: BHP Billiton LimitedEmbedded derivatives
The following table provides information about the principal embedded derivatives contracts:
Commodity Price Swaps Volume Maturity date Exposure price
Electricity purchase arrangement 240,000 MWh 31 Dec 2024 Aluminium
Electricity purchase arrangement 843,000 MWh 30 Jun 2020 Aluminium
Gas sale 150.67 Pj 31 Dec 2013 Electricity
Commodity Price Options Volume Maturity date Exposure price
Finance lease of plant and equipment 39.5 Mmboe 30 Dec 2018 Crude oil
Copper concentrate sales 90,591,421 Pounds 31 Dec 2006 Copper
Lead purchase and sale 67,000 DMT 1 Jan 2007 Lead
Zinc purchase and sale 6,000 DMT 2 Jan 2007 ZincSource: BHP Billiton Limited 2006 Annual Report
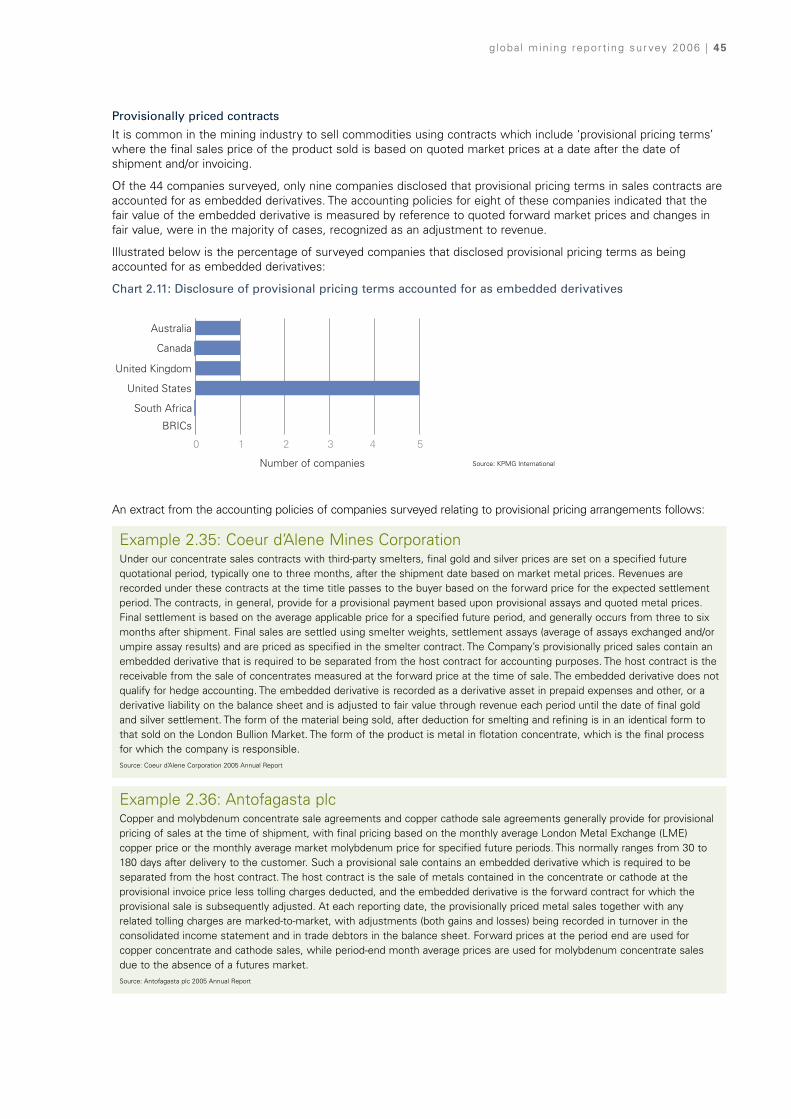
globa l min ing report ing sur vey 2006 | 45
Provisionally priced contracts
It is common in the mining industry to sell commodities using contracts which include ‘provisional pricing terms’where the final sales price of the product sold is based on quoted market prices at a date after the date ofshipment and/or invoicing.
Of the 44 companies surveyed, only nine companies disclosed that provisional pricing terms in sales contracts areaccounted for as embedded derivatives. The accounting policies for eight of these companies indicated that thefair value of the embedded derivative is measured by reference to quoted forward market prices and changes infair value, were in the majority of cases, recognized as an adjustment to revenue.
Illustrated below is the percentage of surveyed companies that disclosed provisional pricing terms as beingaccounted for as embedded derivatives:
Chart 2.11: Disclosure of provisional pricing terms accounted for as embedded derivatives
An extract from the accounting policies of companies surveyed relating to provisional pricing arrangements follows:
Example 2.35: Coeur d’Alene Mines CorporationUnder our concentrate sales contracts with third-party smelters, final gold and silver prices are set on a specified futurequotational period, typically one to three months, after the shipment date based on market metal prices. Revenues arerecorded under these contracts at the time title passes to the buyer based on the forward price for the expected settlementperiod. The contracts, in general, provide for a provisional payment based upon provisional assays and quoted metal prices.Final settlement is based on the average applicable price for a specified future period, and generally occurs from three to sixmonths after shipment. Final sales are settled using smelter weights, settlement assays (average of assays exchanged and/orumpire assay results) and are priced as specified in the smelter contract. The Company’s provisionally priced sales contain anembedded derivative that is required to be separated from the host contract for accounting purposes. The host contract is thereceivable from the sale of concentrates measured at the forward price at the time of sale. The embedded derivative does notqualify for hedge accounting. The embedded derivative is recorded as a derivative asset in prepaid expenses and other, or aderivative liability on the balance sheet and is adjusted to fair value through revenue each period until the date of final goldand silver settlement. The form of the material being sold, after deduction for smelting and refining is in an identical form tothat sold on the London Bullion Market. The form of the product is metal in flotation concentrate, which is the final processfor which the company is responsible.Source: Coeur d’Alene Corporation 2005 Annual Report
Example 2.36: Antofagasta plcCopper and molybdenum concentrate sale agreements and copper cathode sale agreements generally provide for provisionalpricing of sales at the time of shipment, with final pricing based on the monthly average London Metal Exchange (LME)copper price or the monthly average market molybdenum price for specified future periods. This normally ranges from 30 to180 days after delivery to the customer. Such a provisional sale contains an embedded derivative which is required to beseparated from the host contract. The host contract is the sale of metals contained in the concentrate or cathode at theprovisional invoice price less tolling charges deducted, and the embedded derivative is the forward contract for which theprovisional sale is subsequently adjusted. At each reporting date, the provisionally priced metal sales together with anyrelated tolling charges are marked-to-market, with adjustments (both gains and losses) being recorded in turnover in theconsolidated income statement and in trade debtors in the balance sheet. Forward prices at the period end are used forcopper concentrate and cathode sales, while period-end month average prices are used for molybdenum concentrate salesdue to the absence of a futures market.Source: Antofagasta plc 2005 Annual Report
0 1 2 3 4 5
South Africa
BRICs
United States
United Kingdom
Canada
Australia
Number of companies Source: KPMG International
2.11 Functional and reporting currenciesIFRS has brought ‘regime change’ in foreign currencyaccounting for those previously reporting under non-U.S. national GAAP.
Foreign currency accounting was about translatingforeign currency transactions and balances into acompany’s home currency, and translating financialstatements of foreign operations according to whetherthey were self-sustaining or integrated. Under IFRS,foreign currency accounting is about identifying thefunctional currency for each entity (which may not bethe entity’s home currency), translating transactionsand balances into that currency, and then choosing apresentation currency for the financial statements.
Different entities within a multi-national group oftenhave different functional currencies. Management mustdetermine the functional currency of each entity basedon the requirements of IAS 21 The effects of changesin foreign exchange rates.
An entity does not have a free choice of functionalcurrency. Rather, it is a question of fact based on theunderlying transactions, events and conditions. Oncedetermined, the functional currency is not changedunless there is a change in those underlyingtransactions, events and conditions of the entity.
Each group entity translates its results and financialposition into the presentation currency of the reportingentity. As a result, the ‘group’ does not have afunctional currency. The presentation currency,however, can be in a currency that is different to thefunctional currency.
For entities that have a functional currency different tothe presentation currency, the closing balance sheetsand income statements are translated into thepresentation currency at balance sheet date, with anycurrency related fluctuations recorded in a foreigncurrency translation reserve in equity. There is no profitimpact on these entities.
IAS 21 includes some primary indicators that must begiven priority in determining an entity’s functionalcurrency, and also some secondary indicators.
The primary indicators are:
(a) The currency:
(i) that mainly influences sales prices for goods and services (this will often be the currency in which sales prices for its goods and services are denominated and settled)
(ii) of the country whose competitive forces and regulations mainly determine the sales price of its goods and services.
(b) The currency that mainly influences labor, material and other costs of providing goods or services (this will often be the currency in which such costs are denominated and settled).
If these primary indicators do not provide an obviousanswer then management needs to turn to thesecondary indicators, as follows:
(a) The currency in which funds from financing activities (i.e. issuing debt and equity instruments) are generated.
(b) The currency in which receipts from operating activities are usually retained.
Example secondary indicators - denominationcurrency of:
• issued capital
• debts
• dividends to shareholders
• large cash balances (eg built and retained from receipts from operations)
• loans to and from subsidiaries.
Management must exercise judgment in determiningthe functional currency that most faithfully representsthe economic effects of the underlying transactions,events and conditions. Decisions will often be based ona balance of circumstances and indicators. They mayalso have regard to business objectives, performancedrivers and risks underlying the financial indicatorsreferred to above. The nature of the judgments involvedwill often be disclosed under IFRS.
Accordingly, the identification of functional currency isnew and presents challenges. Some mining companieshave identified currencies other than their homecurrency as their functional currency, usually U.S.dollars, at least for some entities in a group. This trend relates mainly to global mining companies andmining companies with significant offshore operations,and less to companies operating only within theirnational borders.
The need to look at secondary factors will usually begreatest when revenues are denominated in U.S.dollars, but most costs are incurred in the company’shome currency. Commodity selling prices are dictatedby movements in global supply and demand. It may bedifficult to identify the country whose competitiveforces and regulations mainly determine the sellingprices. The standard notes that the currency whichmainly influences sales prices will often be thecurrency in which sales prices are denominated andsettled. As an industry practice, selling prices areusually denominated and settled in U.S. dollar andmany mining companies have viewed this as a primaryfactor guiding their functional currency determinations.
Functional currency determination has brought with itchanges in non-reporting areas. BHP Billiton, whichpredominantly has U.S. dollar functional currencyentities, declares and determines dividends in U.S.dollars, even though it pays them in Australian dollarsand Pounds Sterling based on the exchange rate twodays prior to dividend declaration.
46 | g loba l min ing report ing sur vey 2006
globa l min ing report ing sur vey 2006 | 47
There are no significant differences between IFRS and U.S. GAAP in the determination of functional currencyrelating to the mining industry.
The survey indicated that 41 out of 44 companies surveyed, or 93 percent, disclosed their functional currencies inthe financial statements. It was noted that several surveyed companies had more than one functional currency asthey have foreign operations in which the primary economic environment that the foreign operations conducteconomic activities is different from that of the parent company. U.S. dollar was the most common with 30 of the44 surveyed companies disclosing this as one of their functional currencies.
This was particularly apparent in Canada, the United Kingdom, Australia and the United States, whereas in SouthAfrica and other surveyed countries use of the local currency as the functional currency was more prevalent.
In respect of the presentation currency, 66 percent of the companies surveyed used the U.S. dollar, whichdemonstrated that a high proportion of companies in countries other than the United States used it as theirreporting currency. This probably was due to the fact that these companies have their primary and secondarylistings in the United States.
The following table illustrates the use of functional and reporting currencies by country:
Table 2.15: Companies functional and reporting currency
SouthAfrica Canada
UnitedKingdom Australia
UnitedStates BRICs Total
FC RC FC RC FC RC FC RC FC RC FC RC FC RC
U.S. Dollar 1 2 9 9 6 7 3 2 7 7 1 2 27 29
South African Rand 5 4 5 4
Canadian Dollar 1 3 1 3
Euro 1 1 2 0
Australian Dollar 2 3 2 3
Reminbi 2 2 2 2
Indian Rupee 2 0 2
Brazilian Real 1 1 0
Chilean Pesos 1 1 0
Russian Rouble 1 0 1
Not disclosed 1 2 3 0
Total 6 6 12 12 7 7 5 5 7 7 7 7 44 44
FC = Functional CurrencyRC = Reporting Currency
Source: KPMG International

A further observation is that 36 out of 41 companiesthat disclosed both functional and reporting currencieshad one of the functional currencies the same as itsreporting currency.
An example of functional and reporting currencydisclosure is as follows:
Example 2.37: Rio Tinto PlcCurrency translation
The functional currency for each entity in the group, and forjointly controlled entities and associates, is determined asthe currency of the primary economic environment inwhich it operates. For most entities, this is the localcurrency of the country in which it operates. Transactionsdenominated in currencies other than the functionalcurrency of the entity are translated at the exchange rateruling at the date of the transaction. Monetary assets andliabilities denominated in foreign currencies areretranslated at year end exchange rates.
The US dollar is the currency in which the group’s Financialstatements are presented, as it most reliably reflects theglobal business performance of the Group as a whole.
On consolidation, income statement items are translatedinto US dollars at average rates of exchange. Balance sheetitems are translated into US dollars at year end exchangerates. Exchange differences on the translation of the netassets of entities with functional currencies other than theUS dollar, and any offsetting exchange differences on netdebt hedging those net assets, are dealt with throughequity.
Exchange gains and losses which arise on balancesbetween group entities are taken to equity where thatbalance is, in substance, part of the group’s net investmentin the subsidiary and the balance is denominated in thefunctional currency of one party to the loan.
The group finances its operations primarily in US dollarsand a substantial part of the group’s US dollar debt islocated in subsidiaries having functional currencies otherthan the US dollar. Except as noted above, exchange gainsand losses relating to such US dollar debt are charged orcredited to the Group’s income statement in the year inwhich they arise. This means that the impact of financing inUS dollars on the group’s income statement is dependenton the functional currency of the particular subsidiarywhere the debt is located.
Except as noted above, or in Note (p) below relating toderivative contracts, all exchange differences are chargedor credited to the income statement in the year in whichthey arise.Source: Rio Tinto Plc 2005 Annual Report
2.12 TaxThe survey showed that the tax disclosures in generalinclude the same information for many jurisdictions.However two areas were identified where specificdisclosures were made by individual companies inrelation to issues that have been identified under IFRS.
2.12.1 Tax base
IAS 12 Income taxes (IAS 12) measures deferred taxbased on the difference between the book carryingamount and tax base of assets and liabilities. Whendetermining the tax base of assets and liabilities, acompany must reflect the tax consequences that willfollow from the manner in which the book carryingamount of the asset or liability will be recovered orsettled.
U.S. GAAP literature, FAS 109 Income taxes is largelyconsistent with IFRS in its approach to determiningdeferred tax balances with the exception that FAS 109does not consider intended use when determining thetax base.
In situations where no deductions for corporate incometax are allowed as an asset is used, but wheredeductions for capital gains tax can be claimed upondisposal, the issue needs careful analysis to determinewhether the capital gains tax cost base is to be takeninto account.
An example of this is mineral rights in Australia. Whileno tax base exists for income tax purposes, a tax baseis available for capital gains tax. This capital gains taxbase is not only deductible on sale of the asset, butalso on expiry or abandonment of the mineral right.
There are alternative views as to how and when thecapital gains tax base should be treated in thesecircumstances. One view is that if the company canaccess the capital gains tax base, at some point in thefuture this should be taken into account in reducing oreliminating any ‘day one’ temporary differencebetween the accounting and tax bases. Subsequently,a deferred tax asset would arise as the mineral rightsare amortized, for which the probability of recoupmentwould need to be assessed.
An alternative view is that assessing the capital gainstax base at some remote future date should not be akey determinant for the non-recognition on and fromday one of the deferred tax liability associated with thenon-deductibility of mineral rights for income taxpurposes.
The survey findings can only give limited insight as towhether companies have considered the use of capitalgains tax bases in situations where these will beavailable to the company for reasons other than thesale or abandonment of the underlying asset.
48 | g loba l min ing report ing sur vey 2006
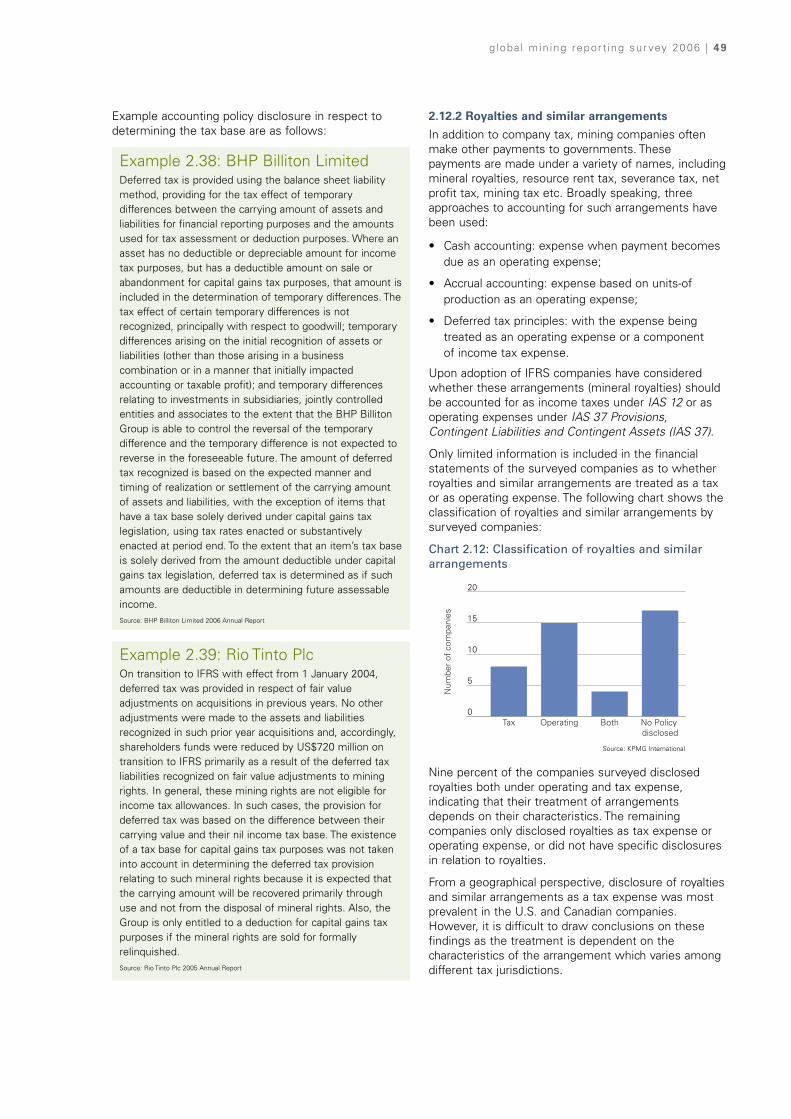
Example accounting policy disclosure in respect todetermining the tax base are as follows:
Example 2.38: BHP Billiton LimitedDeferred tax is provided using the balance sheet liabilitymethod, providing for the tax effect of temporarydifferences between the carrying amount of assets andliabilities for financial reporting purposes and the amountsused for tax assessment or deduction purposes. Where anasset has no deductible or depreciable amount for incometax purposes, but has a deductible amount on sale orabandonment for capital gains tax purposes, that amount isincluded in the determination of temporary differences. Thetax effect of certain temporary differences is notrecognized, principally with respect to goodwill; temporarydifferences arising on the initial recognition of assets orliabilities (other than those arising in a businesscombination or in a manner that initially impactedaccounting or taxable profit); and temporary differencesrelating to investments in subsidiaries, jointly controlledentities and associates to the extent that the BHP BillitonGroup is able to control the reversal of the temporarydifference and the temporary difference is not expected toreverse in the foreseeable future. The amount of deferredtax recognized is based on the expected manner andtiming of realization or settlement of the carrying amountof assets and liabilities, with the exception of items thathave a tax base solely derived under capital gains taxlegislation, using tax rates enacted or substantivelyenacted at period end. To the extent that an item’s tax baseis solely derived from the amount deductible under capitalgains tax legislation, deferred tax is determined as if suchamounts are deductible in determining future assessableincome.Source: BHP Billiton Limited 2006 Annual Report
Example 2.39: Rio Tinto PlcOn transition to IFRS with effect from 1 January 2004,deferred tax was provided in respect of fair valueadjustments on acquisitions in previous years. No otheradjustments were made to the assets and liabilitiesrecognized in such prior year acquisitions and, accordingly,shareholders funds were reduced by US$720 million ontransition to IFRS primarily as a result of the deferred taxliabilities recognized on fair value adjustments to miningrights. In general, these mining rights are not eligible forincome tax allowances. In such cases, the provision fordeferred tax was based on the difference between theircarrying value and their nil income tax base. The existenceof a tax base for capital gains tax purposes was not takeninto account in determining the deferred tax provisionrelating to such mineral rights because it is expected thatthe carrying amount will be recovered primarily throughuse and not from the disposal of mineral rights. Also, theGroup is only entitled to a deduction for capital gains taxpurposes if the mineral rights are sold for formallyrelinquished.Source: Rio Tinto Plc 2005 Annual Report
2.12.2 Royalties and similar arrangements
In addition to company tax, mining companies oftenmake other payments to governments. Thesepayments are made under a variety of names, includingmineral royalties, resource rent tax, severance tax, netprofit tax, mining tax etc. Broadly speaking, threeapproaches to accounting for such arrangements havebeen used:
• Cash accounting: expense when payment becomesdue as an operating expense;
• Accrual accounting: expense based on units-ofproduction as an operating expense;
• Deferred tax principles: with the expense beingtreated as an operating expense or a component of income tax expense.
Upon adoption of IFRS companies have consideredwhether these arrangements (mineral royalties) shouldbe accounted for as income taxes under IAS 12 or asoperating expenses under IAS 37 Provisions,Contingent Liabilities and Contingent Assets (IAS 37).
Only limited information is included in the financialstatements of the surveyed companies as to whetherroyalties and similar arrangements are treated as a taxor as operating expense. The following chart shows theclassification of royalties and similar arrangements bysurveyed companies:
Chart 2.12: Classification of royalties and similararrangements
Nine percent of the companies surveyed disclosedroyalties both under operating and tax expense,indicating that their treatment of arrangementsdepends on their characteristics. The remainingcompanies only disclosed royalties as tax expense oroperating expense, or did not have specific disclosuresin relation to royalties.
From a geographical perspective, disclosure of royaltiesand similar arrangements as a tax expense was mostprevalent in the U.S. and Canadian companies.However, it is difficult to draw conclusions on thesefindings as the treatment is dependent on thecharacteristics of the arrangement which varies amongdifferent tax jurisdictions.
g loba l min ing report ing sur vey 2006 | 49
0
5
10
15
20
No Policy disclosed
BothOperatingTax
Num
ber
of c
ompa
nies
Source: KPMG International

Examples of accounting policies with respect totreatment of royalties and similar arrangements are asfollows:
Example 2.40: Newmont Mining CorporationIncome and Mining Taxes
The company accounts for income taxes using the liabilitymethod, recognizing certain temporary differencesbetween the financial reporting basis of the company’sliabilities and assets and the related income tax basis forsuch liabilities and assets. This method generates either anet deferred income tax liability or asset for the company,as measured by the statutory tax rates in effect. Thecompany derives its deferred income tax charge or benefitby recording the change in either the net deferred incometax liability or asset balance for the year. Mining taxesrepresent Canadian provincial taxes levied on miningoperations and are classified as income taxes, as suchtaxes are based on a percentage of mining profits.
Source: Newmont Mining Corporation 2005 Annual Report
Example 2.41: BHP Billiton LimitedRoyalties and resource rent taxes are treated as taxationarrangements when they have the characteristics of a tax.This is considered to be the case when they are imposedunder Government authority and the amount payable iscalculated by reference to revenue derived (net of anyallowable deductions) after adjustment for itemscomprising temporary differences. For such arrangements,current and deferred tax is provided on the same basis asdescribed above for other forms of taxation. Obligationsarising from royalty arrangements that do not satisfy thesecriteria are recognized as current provisions and included inexpenses.Source: BHP Billiton Limited 2006 Annual Report
BHP Billiton showed the most extensive disclosures inthis area , with a split of tax expense on the face of theincome statement as shown in the following extract oftheir consolidated income statement:
Example 2.42: BHP Billiton Limited2006 2005
Profit before taxation 14,166 8,940
Income tax expense (3,207) (1,876)
Royalty related taxation (net of income tax benefit) (425) (436)
Total taxation expense (3,632) (2,312)
Profit after taxation 10,534 6,628Source: BHP Billiton Limited 2006 Annual Report
2.13 Segment reportingSegment disclosure is a critical area within the financialstatements as it provides the reader with a moredetailed understanding of the diversification andperformance of the various business operations. Thisinformation has been included in this survey for thefirst time given the increasing pressure from analystsand stakeholders to obtain increased transparency ofreporting. Analysts and stakeholders requestinformation from investor relations teams to analyzethe performance of each commodity segment. They arealso increasingly focusing on geographical location andother formerly not disclosed information such as minespecific results.
The companies surveyed have different GAAP andstatutory reporting requirements. It is clear from thesurvey that there is an emerging trend for the segmentnote to be formatted in the prescribed fashion and thenexpanded to provide additional information so that theextra information being requested by analysts andother stakeholders is being provided to all users.
Given the significant movements in commodity pricesover the past 12 months, the segment note is allowinganalysts to review the underlying results of eachsegment in diversified companies. It is anticipated thatover the coming years, in order to satisfy analysts andstakeholder requests as well as regulator requests fortransparency, the segment note is likely to becomeincreasingly important and more detailed.
This section deals with information disclosed by miningcompanies in respect of their segment disclosure.
50 | g loba l min ing report ing sur vey 2006
Source: Rio Tinto Iron Ore
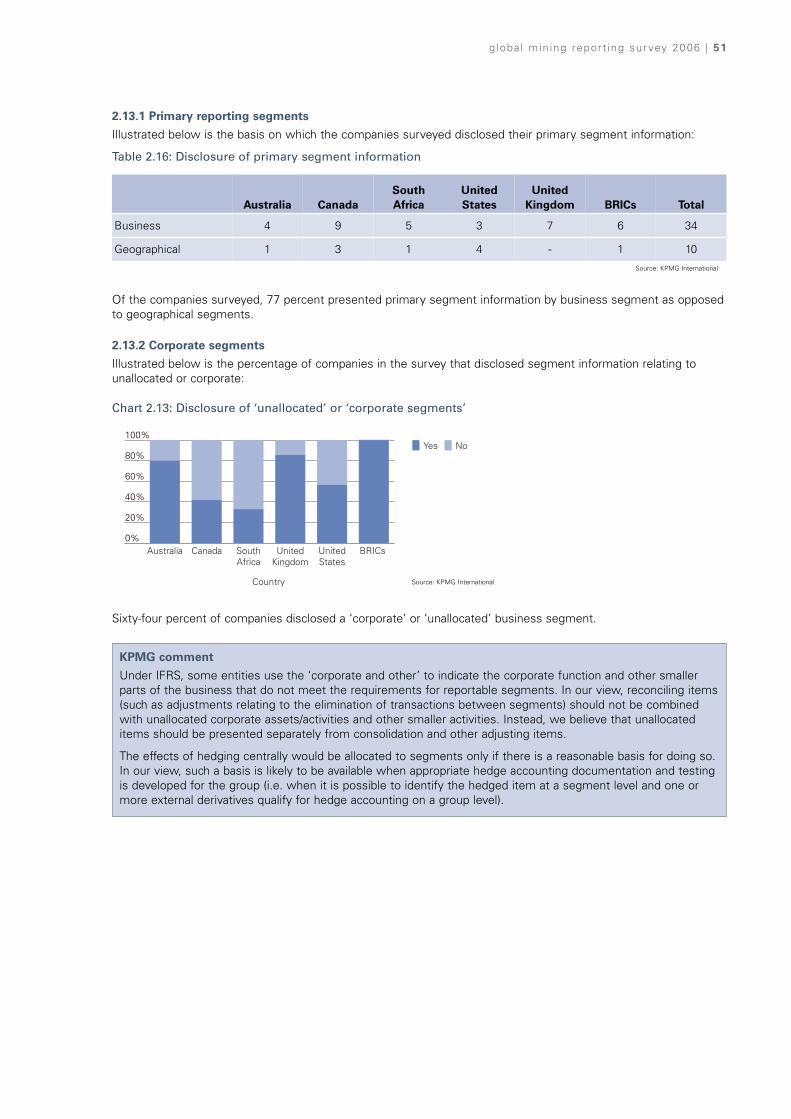
globa l min ing report ing sur vey 2006 | 51
2.13.1 Primary reporting segments
Illustrated below is the basis on which the companies surveyed disclosed their primary segment information:
Table 2.16: Disclosure of primary segment information
Of the companies surveyed, 77 percent presented primary segment information by business segment as opposedto geographical segments.
2.13.2 Corporate segments
Illustrated below is the percentage of companies in the survey that disclosed segment information relating tounallocated or corporate:
Chart 2.13: Disclosure of ‘unallocated’ or ‘corporate segments’
Sixty-four percent of companies disclosed a ‘corporate’ or ‘unallocated’ business segment.
KPMG comment
Under IFRS, some entities use the ‘corporate and other’ to indicate the corporate function and other smallerparts of the business that do not meet the requirements for reportable segments. In our view, reconciling items(such as adjustments relating to the elimination of transactions between segments) should not be combinedwith unallocated corporate assets/activities and other smaller activities. Instead, we believe that unallocateditems should be presented separately from consolidation and other adjusting items.
The effects of hedging centrally would be allocated to segments only if there is a reasonable basis for doing so.In our view, such a basis is likely to be available when appropriate hedge accounting documentation and testingis developed for the group (i.e. when it is possible to identify the hedged item at a segment level and one ormore external derivatives qualify for hedge accounting on a group level).
Australia CanadaSouthAfrica
UnitedStates
UnitedKingdom BRICs Total
Business 4 9 5 3 7 6 34
Geographical 1 3 1 4 - 1 10
0%
20%
40%
60%
80%
100%NoYes
BRICsUnitedStates
UnitedKingdom
SouthAfrica
CanadaAustralia
Country
Source: KPMG International
Source: KPMG International
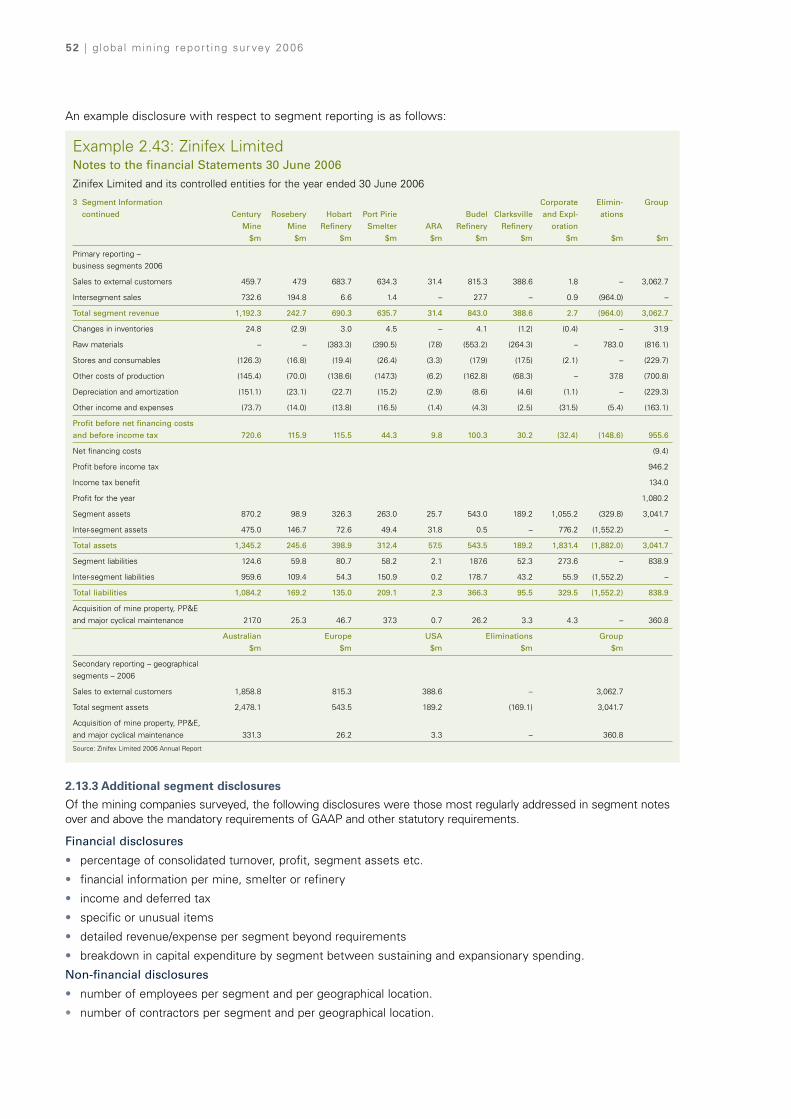
52 | g loba l min ing report ing sur vey 2006
An example disclosure with respect to segment reporting is as follows:
Example 2.43: Zinifex LimitedNotes to the financial Statements 30 June 2006
Zinifex Limited and its controlled entities for the year ended 30 June 2006
3 Segment Information Corporate Elimin- Group
continued Century Rosebery Hobart Port Pirie Budel Clarksville and Expl- ations
Mine Mine Refinery Smelter ARA Refinery Refinery oration
$m $m $m $m $m $m $m $m $m $m
Primary reporting – business segments 2006
Sales to external customers 459.7 47.9 683.7 634.3 31.4 815.3 388.6 1.8 – 3,062.7
Intersegment sales 732.6 194.8 6.6 1.4 – 27.7 – 0.9 (964.0) –
Total segment revenue 1,192.3 242.7 690.3 635.7 31.4 843.0 388.6 2.7 (964.0) 3,062.7
Changes in inventories 24.8 (2.9) 3.0 4.5 – 4.1 (1.2) (0.4) – 31.9
Raw materials – – (383.3) (390.5) (7.8) (553.2) (264.3) – 783.0 (816.1)
Stores and consumables (126.3) (16.8) (19.4) (26.4) (3.3) (17.9) (17.5) (2.1) – (229.7)
Other costs of production (145.4) (70.0) (138.6) (147.3) (6.2) (162.8) (68.3) – 37.8 (700.8)
Depreciation and amortization (151.1) (23.1) (22.7) (15.2) (2.9) (8.6) (4.6) (1.1) – (229.3)
Other income and expenses (73.7) (14.0) (13.8) (16.5) (1.4) (4.3) (2.5) (31.5) (5.4) (163.1)
Profit before net financing costs
and before income tax 720.6 115.9 115.5 44.3 9.8 100.3 30.2 (32.4) (148.6) 955.6
Net financing costs (9.4)
Profit before income tax 946.2
Income tax benefit 134.0
Profit for the year 1,080.2
Segment assets 870.2 98.9 326.3 263.0 25.7 543.0 189.2 1,055.2 (329.8) 3,041.7
Inter-segment assets 475.0 146.7 72.6 49.4 31.8 0.5 – 776.2 (1,552.2) –
Total assets 1,345.2 245.6 398.9 312.4 57.5 543.5 189.2 1,831.4 (1,882.0) 3,041.7
Segment liabilities 124.6 59.8 80.7 58.2 2.1 187.6 52.3 273.6 – 838.9
Inter-segment liabilities 959.6 109.4 54.3 150.9 0.2 178.7 43.2 55.9 (1,552.2) –
Total liabilities 1,084.2 169.2 135.0 209.1 2.3 366.3 95.5 329.5 (1,552.2) 838.9
Acquisition of mine property, PP&E and major cyclical maintenance 217.0 25.3 46.7 37.3 0.7 26.2 3.3 4.3 – 360.8
Australian Europe USA Eliminations Group
$m $m $m $m $m
Secondary reporting – geographical segments – 2006
Sales to external customers 1,858.8 815.3 388.6 – 3,062.7
Total segment assets 2,478.1 543.5 189.2 (169.1) 3,041.7
Acquisition of mine property, PP&E, and major cyclical maintenance 331.3 26.2 3.3 – 360.8
Source: Zinifex Limited 2006 Annual Report
2.13.3 Additional segment disclosures
Of the mining companies surveyed, the following disclosures were those most regularly addressed in segment notesover and above the mandatory requirements of GAAP and other statutory requirements.
Financial disclosures
• percentage of consolidated turnover, profit, segment assets etc.
• financial information per mine, smelter or refinery
• income and deferred tax
• specific or unusual items
• detailed revenue/expense per segment beyond requirements
• breakdown in capital expenditure by segment between sustaining and expansionary spending.
Non-financial disclosures
• number of employees per segment and per geographical location.
• number of contractors per segment and per geographical location.

globa l min ing report ing sur vey 2006 | 53
KPMG comment
Our professionals’ discussions with analysts indicated that additional information provided by companies withrespect to segment disclosures is valuable in assisting them understand what drives the business. The surveyresults highlighted that many companies were addressing these needs through alternative disclosures allowedunder GAAP such as separate identification of non-cash items and cash cost information. Key segment disclosuresthat appeal to analysts and which they would like to see increased information on are shown in the following table:
Table 2.17: Key analyst requests for segment disclosures
2.13.4 Expense classification
The format of income statements are generally prescribed by the relevant GAAP. While formats are varied, manycompanies disclosed some form of disaggregation of expenses on the face of the income statement.Furthermore, 95 percent of companies disclosed disaggregated expenses either on the face of the incomestatement, in the notes to the accounts or in both. Generally presentation of expenses could be classified into twotypes, those disaggregated by nature (e.g. where costs were broken down by type) and those disaggregated byfunction (e.g. where cost of sales were presented).
The following table shows the type of disaggregation of expenses presented by surveyed companies:
Table 2.18: Income statement presentation of expenses
The survey results identified that 50 percent of companies showed disaggregation of expenses by function whileonly 10 percent showed disaggregation by nature. Many of the remaining surveyed companies showed some formof disaggregation of expenses which often had characteristics of both nature and function. Five percent ofcompanies did not show a full disaggregation of expenses by type.
Mine-by-Mine Details
• Further information for analysis to enable accurate
assessment of contribution to the group result.
Non-Recurring and/or Significant Items
• Clear indication of which segment these relate to and the
impact on cashflows.
Cashflows
• Cashflow details for both segments and mines to
enable accurate forecasting.
Tax
• Desire for visibility around the tax regimes and effective
rates for the segments.
Commodity Sensitivity
• Increased disclosure on the impact of commodity
prices on segment results for modelling purposes.
Year on Year Consistency
• Consistency between the classifications and disclosure
within the segment to allow for easy analysis and
investigation into forecasting accuracy.
Breakdown of Expenses
• Detailed analysis by segment and mine of expenses
for the period.
Getting it into the financials
• Transfer of financial information from outside of the
financial statements (i.e. in the front half) into an easily
analysed format in the segment note.
SouthAfrica Canada
UnitedKingdom Australia
UnitedStates BRICs Total
By Nature – – – 1 – 3 4
By Function 4 7 5 1 2 3 22
Other or no
disaggregation
2 5 2 3 5 1 18
Total 6 12 7 5 7 7 44
Source: KPMG International
Source: KPMG International
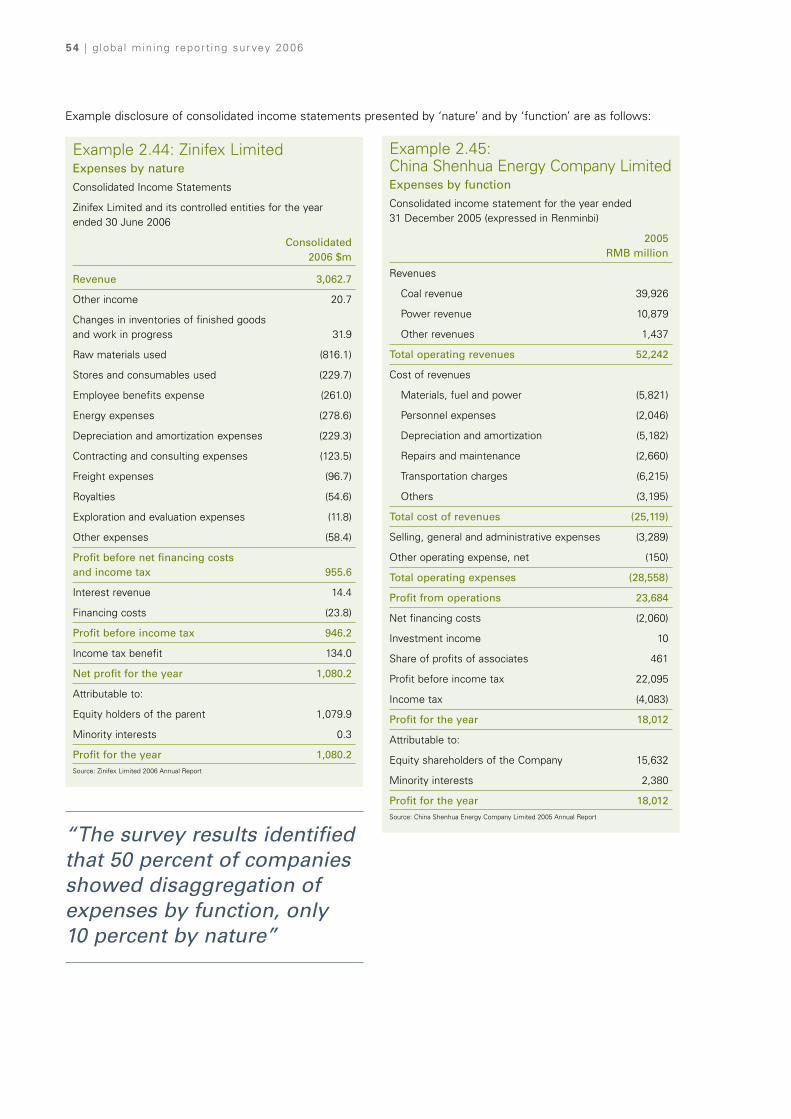
54 | g loba l min ing report ing sur vey 2006
Example disclosure of consolidated income statements presented by ‘nature’ and by ‘function’ are as follows:
Example 2.44: Zinifex LimitedExpenses by nature
Consolidated Income Statements
Zinifex Limited and its controlled entities for the yearended 30 June 2006
Consolidated 2006 $m
Revenue 3,062.7
Other income 20.7
Changes in inventories of finished goods and work in progress 31.9
Raw materials used (816.1)
Stores and consumables used (229.7)
Employee benefits expense (261.0)
Energy expenses (278.6)
Depreciation and amortization expenses (229.3)
Contracting and consulting expenses (123.5)
Freight expenses (96.7)
Royalties (54.6)
Exploration and evaluation expenses (11.8)
Other expenses (58.4)
Profit before net financing costs and income tax 955.6
Interest revenue 14.4
Financing costs (23.8)
Profit before income tax 946.2
Income tax benefit 134.0
Net profit for the year 1,080.2
Attributable to:
Equity holders of the parent 1,079.9
Minority interests 0.3
Profit for the year 1,080.2Source: Zinifex Limited 2006 Annual Report
Example 2.45: China Shenhua Energy Company LimitedExpenses by function
Consolidated income statement for the year ended 31 December 2005 (expressed in Renminbi)
2005RMB million
Revenues
Coal revenue 39,926
Power revenue 10,879
Other revenues 1,437
Total operating revenues 52,242
Cost of revenues
Materials, fuel and power (5,821)
Personnel expenses (2,046)
Depreciation and amortization (5,182)
Repairs and maintenance (2,660)
Transportation charges (6,215)
Others (3,195)
Total cost of revenues (25,119)
Selling, general and administrative expenses (3,289)
Other operating expense, net (150)
Total operating expenses (28,558)
Profit from operations 23,684
Net financing costs (2,060)
Investment income 10
Share of profits of associates 461
Profit before income tax 22,095
Income tax (4,083)
Profit for the year 18,012
Attributable to:
Equity shareholders of the Company 15,632
Minority interests 2,380
Profit for the year 18,012Source: China Shenhua Energy Company Limited 2005 Annual Report
“The survey results identifiedthat 50 percent of companiesshowed disaggregation ofexpenses by function, only 10 percent by nature”
globa l min ing report ing sur vey 2006 | 55
KPMG comment
Under IFRS, individually material items are classified in accordance with their nature or function, consistent withthe classification of items that are not individually material. In our view, the nature of an item does not changemerely because it is individually material. We believe that consistent presentation by classification requiresindividually material items to be presented within, or adjacent to, the remaining aggregated amounts of thesame nature or function.
Note: disclosure is sufficient for many items that individually are material. In our view, it is preferable forseparate presentation to be made on the face of the income statement only when necessary for anunderstanding of the entity’s financial performance. In such cases the notes to the financial statements shoulddisclose an additional explanation of the nature of the amount presented.
In our view, it is preferable to include a subtotal of all items classified as having the same nature or function.
We believe that presentation of the effect of a particular event or circumstances as a single amount on the faceof the income statement that overrides the requirement to classify expenses either by nature or function, canbe justified only in very rare cases.
This aggregation of disclosures so that undue importance is not given to individually material or exceptionalitems, appears to be a particular focus of the regulators in a number of reporting jurisdictions at present.However, interestingly discussions with analysts who follow some of the companies covered by the surveyindicated that more detailed and disaggregated information in this area is desirable to assist them inunderstanding underlying earnings. This is discussed further below.
2.13.5 Non GAAP measures
Any measure of disclosure that is presented on the basis of methodologies other than in accordance withgenerally accepted accounting principles is considered Non-GAAP. Accounting standards generally prohibit Non-GAAP measures on the face of the income statement.
As accounting standards are prescriptive in their definition of terms allowed within the financial statements thesurvey found that many companies were using the Financial Management Discussion and Analysis, press releasesand other documents to disseminate this information to stakeholders.
For US filers the SEC has issued specific conditions for use of Non-GAAP Financial Measures. According toRegulation G and amendments to Item 10 of Regulation S-B, Securities Exchange Act of 1934, Forms 8-K and 20-F,public companies that disclose Non-GAAP financial measures must include, in that disclosure or release, thefollowing:
• A presentation, with equal or greater prominence, of the most directly comparable GAAP financial measure tothe Non-GAAP financial measure.
• A reconciliation between the GAAP financial measure to the Non-GAAP financial measure.
• A statement disclosing the reasons why the registrant’s management believes that presentation of the Non-GAAP financial measure provides useful information to investors.
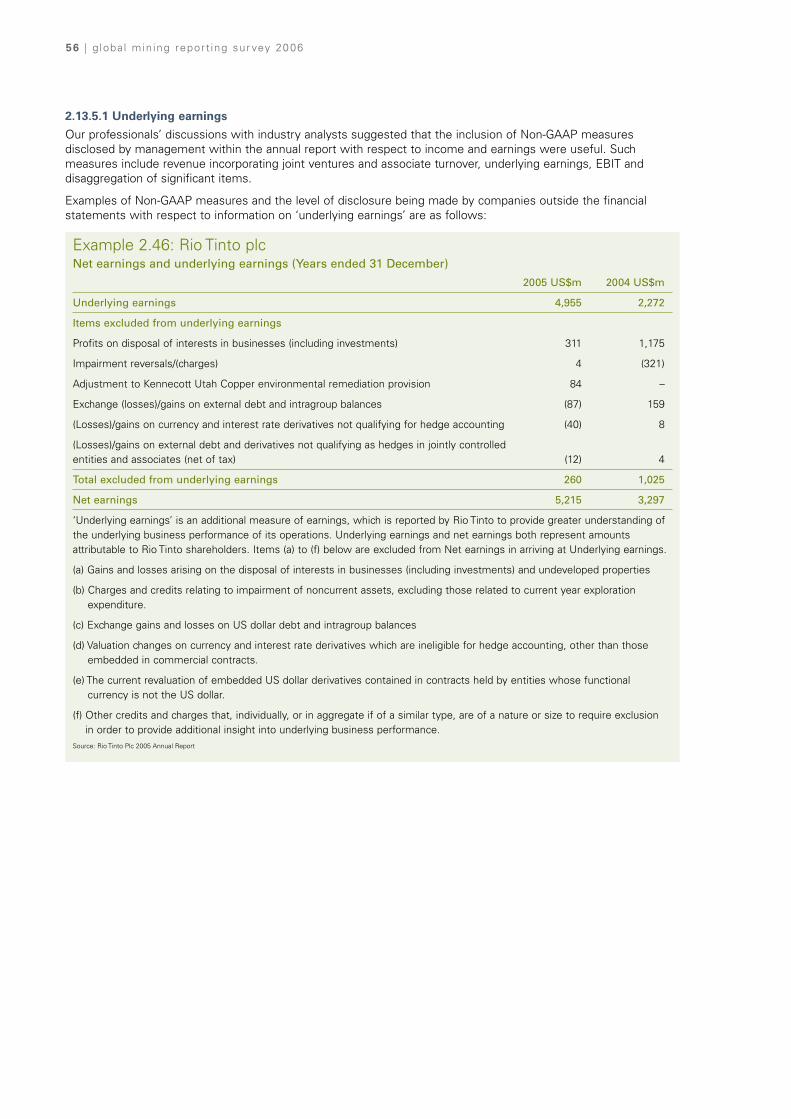
56 | g loba l min ing report ing sur vey 2006
2.13.5.1 Underlying earnings
Our professionals’ discussions with industry analysts suggested that the inclusion of Non-GAAP measuresdisclosed by management within the annual report with respect to income and earnings were useful. Suchmeasures include revenue incorporating joint ventures and associate turnover, underlying earnings, EBIT anddisaggregation of significant items.
Examples of Non-GAAP measures and the level of disclosure being made by companies outside the financialstatements with respect to information on ‘underlying earnings’ are as follows:
Example 2.46: Rio Tinto plcNet earnings and underlying earnings (Years ended 31 December)
2005 US$m 2004 US$m
Underlying earnings 4,955 2,272
Items excluded from underlying earnings
Profits on disposal of interests in businesses (including investments) 311 1,175
Impairment reversals/(charges) 4 (321)
Adjustment to Kennecott Utah Copper environmental remediation provision 84 –
Exchange (losses)/gains on external debt and intragroup balances (87) 159
(Losses)/gains on currency and interest rate derivatives not qualifying for hedge accounting (40) 8
(Losses)/gains on external debt and derivatives not qualifying as hedges in jointly controlled entities and associates (net of tax) (12) 4
Total excluded from underlying earnings 260 1,025
Net earnings 5,215 3,297
‘Underlying earnings’ is an additional measure of earnings, which is reported by Rio Tinto to provide greater understanding ofthe underlying business performance of its operations. Underlying earnings and net earnings both represent amountsattributable to Rio Tinto shareholders. Items (a) to (f) below are excluded from Net earnings in arriving at Underlying earnings.
(a) Gains and losses arising on the disposal of interests in businesses (including investments) and undeveloped properties
(b) Charges and credits relating to impairment of noncurrent assets, excluding those related to current year explorationexpenditure.
(c) Exchange gains and losses on US dollar debt and intragroup balances
(d) Valuation changes on currency and interest rate derivatives which are ineligible for hedge accounting, other than thoseembedded in commercial contracts.
(e) The current revaluation of embedded US dollar derivatives contained in contracts held by entities whose functionalcurrency is not the US dollar.
(f) Other credits and charges that, individually, or in aggregate if of a similar type, are of a nature or size to require exclusion in order to provide additional insight into underlying business performance.
Source: Rio Tinto Plc 2005 Annual Report
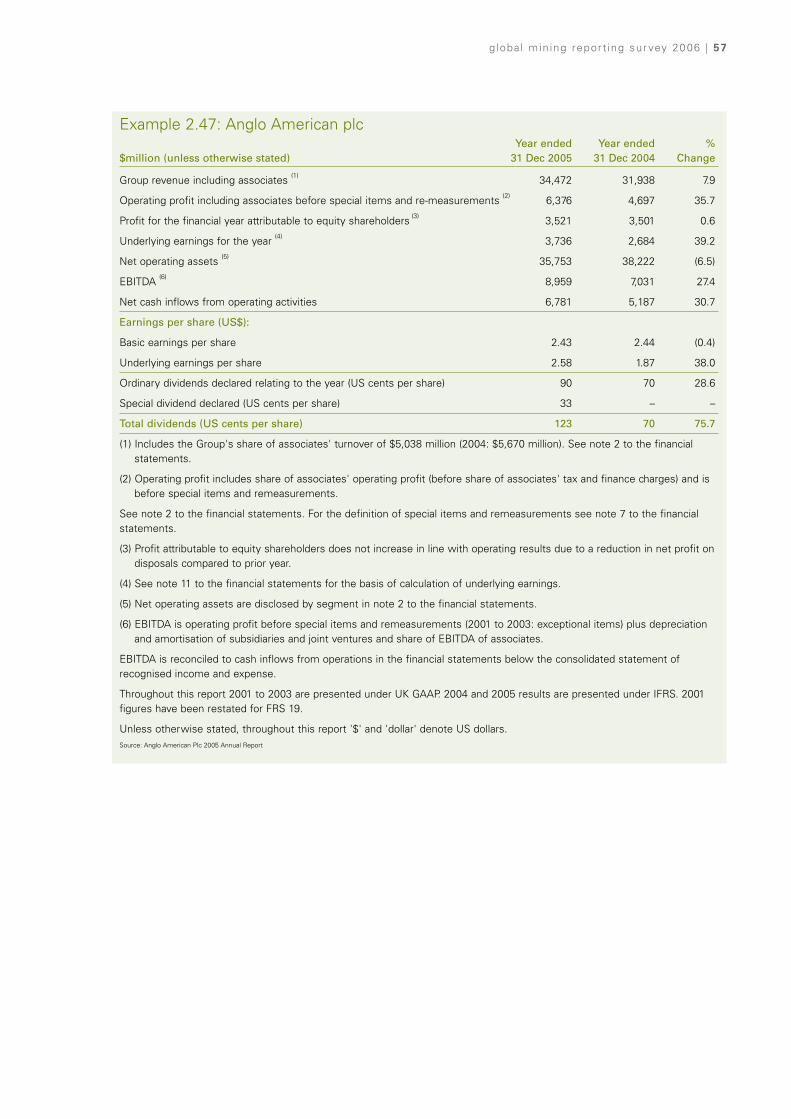
globa l min ing report ing sur vey 2006 | 57
Example 2.47: Anglo American plcYear ended Year ended %
$million (unless otherwise stated) 31 Dec 2005 31 Dec 2004 Change
Group revenue including associates (1) 34,472 31,938 7.9
Operating profit including associates before special items and re-measurements (2) 6,376 4,697 35.7
Profit for the financial year attributable to equity shareholders (3) 3,521 3,501 0.6
Underlying earnings for the year (4) 3,736 2,684 39.2
Net operating assets (5) 35,753 38,222 (6.5)
EBITDA (6) 8,959 7,031 27.4
Net cash inflows from operating activities 6,781 5,187 30.7
Earnings per share (US$):
Basic earnings per share 2.43 2.44 (0.4)
Underlying earnings per share 2.58 1.87 38.0
Ordinary dividends declared relating to the year (US cents per share) 90 70 28.6
Special dividend declared (US cents per share) 33 – –
Total dividends (US cents per share) 123 70 75.7
(1) Includes the Group's share of associates' turnover of $5,038 million (2004: $5,670 million). See note 2 to the financialstatements.
(2) Operating profit includes share of associates' operating profit (before share of associates' tax and finance charges) and isbefore special items and remeasurements.
See note 2 to the financial statements. For the definition of special items and remeasurements see note 7 to the financialstatements.
(3) Profit attributable to equity shareholders does not increase in line with operating results due to a reduction in net profit ondisposals compared to prior year.
(4) See note 11 to the financial statements for the basis of calculation of underlying earnings.
(5) Net operating assets are disclosed by segment in note 2 to the financial statements.
(6) EBITDA is operating profit before special items and remeasurements (2001 to 2003: exceptional items) plus depreciationand amortisation of subsidiaries and joint ventures and share of EBITDA of associates.
EBITDA is reconciled to cash inflows from operations in the financial statements below the consolidated statement ofrecognised income and expense.
Throughout this report 2001 to 2003 are presented under UK GAAP. 2004 and 2005 results are presented under IFRS. 2001figures have been restated for FRS 19.
Unless otherwise stated, throughout this report '$' and 'dollar' denote US dollars.Source: Anglo American Plc 2005 Annual Report
58 | g loba l min ing report ing sur vey 2006
2.13.5.2 Cash production costs
Cash production cost is an important measure of cost control and efficiency among commodity producers.Accordingly, 64 percent of companies surveyed disclosed cash production costs. Of those companies, 75 percentprovided an explanation of cash production costs.
While The Gold Institute has recommended a format for cash production costs which is followed by some regions,cash production costs are not defined by any GAAP. It was therefore encouraging to note that many companiesreconciled this Non-GAAP measure to GAAP expenses.
The following table illustrates the number of companies who disclosed cash production cost in the annual report:
Table 2.19: Companies disclosing cash production cost
The country analysis of cash production costs demonstrated that this disclosure was prevalent particularly inCanada, the United States, South Africa, and many BRICs countries, but to a lesser extent in other countriesincluding Australia and the United Kingdom.
In addition, while the level of disclosure made by companies varied it was found that companies disclosed cashproduction costs by mine, by product or in some instances by both mine and product.
SouthAfrica Canada
UnitedKingdom Australia
UnitedStates BRICs Total
By mine 3 6 1 1 - 1 12
By product - 3 2 1 1 3 10
By mine and product 1 - - - 4 1 6
Not disclosed 2 3 4 3 2 2 16
6 12 7 5 7 7 44
Source: KPMG International

globa l min ing report ing sur vey 2006 | 59
An example of disclosure with respect to cash costs of production is as follows:
Example 2.48: GlamisGold LimitedCost of production
The company’s total cash cost of production includes mining, processing, direct mine overhead costs and royalties, butexcludes selling, general and administrative costs at the corporate level. Total production costs include depreciation anddepletion and amortization of site closure and reclamation accruals but exclude future income tax effects. There is a differencebetween cost of sales and cost of production relating to the difference in the cost of the ounces sold out of inventory duringthe year, as well as revenues from silver which are treated as a by-product credit for calculation of the per-ounce cost ofproduction. In 2005 the company produced 434,010 ounces of gold and sold 443,192 ounces out of inventory. The number ofgold ounces produced in 2004 was 234,433 ounces compared to the number of ounces of gold actually sold of 227,700.
The table below reconciles total cash costs per ounce of production and total costs per ounce of production based on theGold Institute production cost standard to cost per ounce sold per the financial statements:
Reconciliation of Gold Institute cash cost per ounce with cost of goods sold (in millions of United States dollars, except for per-ounce amounts) 2005 2004 2003
Total ounces sold 443,192 227,701 228,219
Total ounces produced 434,010 234,433 230,294
Total cost of sales per the financial statements $87.7 $43.9 $41.6
Adjustments for revenue recognition (difference in cost of ounces sold out of inventory) $(1.1) $1.0 $0.7
Adjustment for silver by-product credit $(2.1) – –
Total cash cost of production per Gold Institute Production Cost Standard $84.5 $44.9 $42.3
Total cash cost per ounce of gold sold $198 $193 $182
Total cash cost per ounce of gold produced per Gold Institute Production Cost Standard $195 $192 $184
Depreciation, depletion and amortization per the financial statements $51.1 $20.8 $17.7
Net adjustments for cost of ounces produced but not sold, non-production-related depreciation and future income tax effects $(5.0) $(1.0) $(0.0)
Total cost of production per Gold Institute Production Cost Standard $130.6 $64.7 $60.0
Total cost of production per ounce of gold produced per Gold Institute Production Cost Standard $301 $276 $271
Cash costs of production should not be considered as an alternative to operating profit or net profit attributable toshareholders, or as an alternative to other Canadian or U.S. generally accepted accounting principle measures and may not becomparable to other similarly titled measures of other companies. However, the company believes that cash costs ofproduction per ounce of gold, by mine, is a useful indicator to investors and management of a mine’s performance as itprovides: (i) a measure of the mine’s cash margin per ounce, by comparison of the cash operating costs per ounce by mine tothe price of gold; (ii) the trend in costs as the mine matures; and (iii) an internal benchmark of performance to allow forcomparison against other mines.Source: GlamisGold Limited 2005 Annual Report
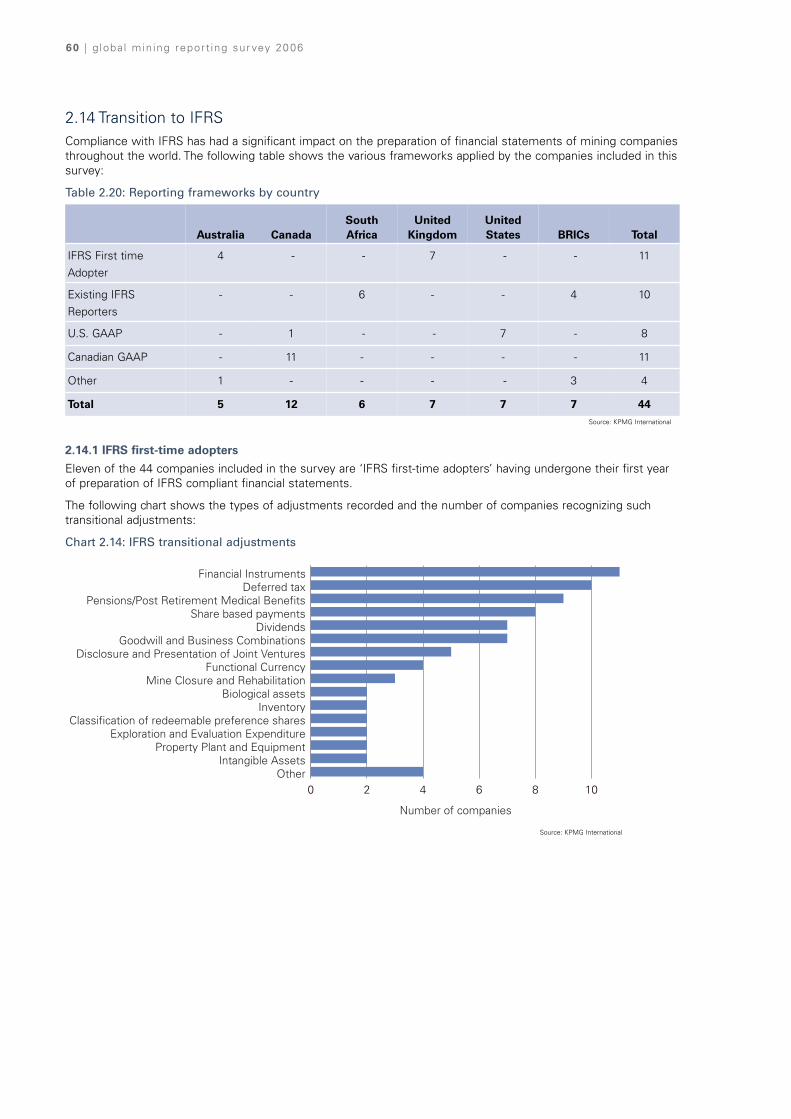
60 | g loba l min ing report ing sur vey 2006
0 2 4 6 8 10Other
Intangible AssetsProperty Plant and Equipment
Exploration and Evaluation ExpenditureClassification of redeemable preference shares
InventoryBiological assets
Mine Closure and RehabilitationFunctional Currency
Disclosure and Presentation of Joint VenturesGoodwill and Business Combinations
DividendsShare based payments
Pensions/Post Retirement Medical BenefitsDeferred tax
Financial Instruments
Number of companies
2.14 Transition to IFRSCompliance with IFRS has had a significant impact on the preparation of financial statements of mining companiesthroughout the world. The following table shows the various frameworks applied by the companies included in thissurvey:
Table 2.20: Reporting frameworks by country
2.14.1 IFRS first-time adopters
Eleven of the 44 companies included in the survey are ‘IFRS first-time adopters’ having undergone their first yearof preparation of IFRS compliant financial statements.
The following chart shows the types of adjustments recorded and the number of companies recognizing suchtransitional adjustments:
Chart 2.14: IFRS transitional adjustments
Australia CanadaSouthAfrica
UnitedKingdom
UnitedStates BRICs Total
IFRS First time
Adopter
4 - - 7 - - 11
Existing IFRS
Reporters
- - 6 - - 4 10
U.S. GAAP - 1 - - 7 - 8
Canadian GAAP - 11 - - - - 11
Other 1 - - - - 3 4
Total 5 12 6 7 7 7 44Source: KPMG International
Source: KPMG International

globa l min ing report ing sur vey 2006 | 61
Of the 11 first-time adopters, all disclosed an adjustment in connection with financial instruments incorporatingadjustments relating to hedge accounting, fair value measurement and embedded derivatives.
More than half the companies surveyed also had adjustments in respect of deferred tax, pensions and postretirement medical benefits, share-based payments, dividends and goodwill and business combinations.
Our survey identified that the impact of adopting IFRS on net profit after tax and total equity in the year oftransition was varied. For almost half of the first-time adopters the impact of transition adjustments on net profitafter tax was greater than 10 percent, while around one third of companies recorded a net profit impact of lessthan one percent.
The following charts demonstrate the impact on both net profit after tax and total equity for first-time adopters intheir year of transition:
Chart 2.15: Impact of IFRS on net
profit for first time adopters
Chart 2.16: Impact of IFRS on net
equity for first time adopters
Num
ber
of c
ompa
nies
Num
ber
of c
ompa
nies
% Impact on net profit % Impact on net equity
0
1
2
3
4
5
> 105 – 102 – 51 or <
0
1
2
3
4
5
> 105 – 102 – 51 or <
Num
ber
of c
ompa
nies
Num
ber
of c
ompa
nies
% Impact on net profit % Impact on net equity
0
1
2
3
4
5
> 105 – 102 – 51 or <
0
1
2
3
4
5
> 105 – 102 – 51 or <
Source: KPMG InternationalSource: KPMG International

62 | g loba l min ing report ing sur vey 2006

globa l min ing report ing sur vey 2006 | 63
2.14.2 Existing IFRS Reporters
Ten of the 44 companies surveyed were regarded as ‘existing IFRS reporters’ i.e. companies that adopted IFRS ina previous period and did not present IFRS financial statements for the first time. These companies representedcountries such as South Africa, China, Russia and Papua New Guinea.
Existing IFRS reporters were not able to adopt IFRS 1 First-time Adoption of International Financial ReportingStandards. Accordingly, they did not have the benefit of applying the transitional provisions which were available tothe IFRS first-time adopters.
Despite this, 90 percent of the existing IFRS reporters reported changes in accounting policies as a result of therecent IFRS amendments. In terms of IAS 8 Accounting Policies, Changes in Accounting Estimates and Errors, acompany is required to change an accounting policy if such a change is required by an IFRS standard. Thesignificant number of recent amendments to IFRS has resulted in the high number of accounting policy changesreported by existing IFRS reporters.
The changes in accounting policies reported, resulted in adjustments to the comparative results (including retainedearnings), given that comparative financial information must be restated as if the new policy had always beenin place.
The following chart shows the types of adjustments recorded and the number of companies recording suchchanges:
Chart 2.17: Changes in IFRS accounting policies
As evident from the above chart, the greatest concentration of changes in accounting policies related to share-based payments and goodwill or ‘negative’ goodwill arising on business combinations. Although no companieselected to apply IFRS 3 Business Combinations to business combinations which occurred prior to March 31, 2004,many of the business combination adjustments related to negative goodwill at March 31, 2004, which wasrequired to be reversed to retained earnings.
Various other adjustments were spread over a wide variety of accounting topics. While the magnitude of theadjustments varied, some significant adjustments relating to share-based payments were noted.
Furthermore, where existing IFRS reporters made adjustments to their retained earnings, it is encouraging to notethat companies are differentiating between adjustments that arose as a result of a change in accounting policy,and adjustments that arose as a result of a prior period error.
0 1 2 3 4 5 6
Intangible assets
Mine closure and rehabilitation
Functional currency
Disclosure and presentation of joint ventures
Pensions/post retirement medical benefits
Property plant andequipment
Financial instruments
Goodwill and business combinations
Share-based payments
Number of companies
Source: KPMG International

64 | g loba l min ing report ing sur vey 2006
3. Results –non financial reporting

3.1 Corporate governance and reporting Corporate governance is defined and regulateddifferently around the world, however, generallyorganizations of every size, industry, and country agreeon its ultimate goals – to help leaders maintainsustainable organizations that are accountable toshareholders, capable of returning value to them, andworthy of marketplace trust.
In the 2003 survey it was evident that the high profilecorporate collapses over preceding years had promptedinvestor and regulator calls to tighten corporategovernance regimes. In the three years since there hasbeen a significant focus on the implementation,adherence to and reporting of corporate governancepractices across organizations internationally.
This has been particularly evident in the United Stateswith the introduction of the Sarbanes-Oxley Act of2002 and the requirement under section 404 forauditors to opine on the effectiveness of a company’sinternal controls over financial reporting, in addition tothe financial statements.
In the ensuing period other governance reportingrequirements have been adopted or amended in theU.K. (Combined Code), Australia (Australian StockExchange Corporate Governance Council Principles ofGood Corporate Governance and Best PracticeRecommendations), the European Union’s EighthCompany Law Directive and the Netherlands(Tabaksblat Principles of Good Corporate Governanceand Best Practice Recommendations) among others,accompanied by a plethora of amendments to laws andregulations and voluntary best practice guidelinesincluding the revised OECD Principles of CorporateGovernance.
KPMG firms have also seen a rise in interest ingovernance performance from key participants in thecapital markets.
Many institutions such as the large mutual and pensionfunds have issued their own guidance on thegovernance principles that they expect to be adheredto in the companies in which they invest. Some ofthese institutions have since stepped back from activesurveillance using their own criteria, given the greaterreporting transparency in governance practices throughthe widespread adoption of legislated and principles-based guidelines and directives (‘codes’).
They nevertheless continue to see corporategovernance as a key input into their analysis ofcompany performance.
g loba l min ing report ing sur vey 2006 | 65
66 | g loba l min ing report ing sur vey 2006
3.1.1 Corporate governance guidelines and directives
In considering the corporate governance practices of the companies surveyed, the following codes were disclosedas being used by companies:
Table 3.1: Codes used in considering corporate governance practices
• Combined Code (United Kingdom)
• Turnbull Report (United Kingdom)
• King II (South Africa)
• ASX Corporate Governance Guide (Australia)
• Toronto Stock Exchange Guidelines (Canada)
• NYSE rules (United States)
• Hong Kong listing rules (Hong Kong)
• Sarbanes-Oxley (United States)
Many of the surveyed companies have secondary stock exchange listings and as a consequence the survey resultsfound that a number of companies referred to two or more corporate governance codes.
KPMG comment
One of the challenges going forward for ‘global’ mining organizations is to reconcile the governancerequirements across jurisdictions where there may be differences in the form or substance of the principlesapplied (e.g. director independence and materiality requirements that differ somewhat between codes or thelevel of maturity of governance practices between traditional mining centers and BRICs countries). Culturaldifferences may also impact the relative performance of seemingly similar corporate governance practices (e.g.appropriate whistle-blowing procedures can pose difficulties if employees throughout a global group havedifferent expectations as to what is right and wrong).
While geographic and cultural differences are a challenge for boards, corporate governance reform is aninternational phenomenon with many common areas of focus.
Unlike the movement to converge IFRS and U.S. GAAP, companies are unlikely to see a uniform, globallyaccepted governance model because the issues are not the same and the chemistries within boardrooms canvary widely. However, organizations can have key principles that can be applied worldwide in a way thatengenders investor confidence and trust in capital markets.
Reporting should evolve to provide the investor with a clear picture of how governance performance is beingachieved across jurisdictions and identify areas where international ‘harmonization’ does not yet exist.

globa l min ing report ing sur vey 2006 | 67
3.2 Board of directors and committee structureIn ensuring the effective implementation and adherence to the various corporate governance codes there has beenan increased focus by companies surveyed on establishing committees to support the board of directors’ workloadin meeting its corporate governance responsibilities. The survey results identified five committees as being themost common across the surveyed companies in managing governance practices, and are disclosed below:
Chart 3.1: Percentage of companies within board committee
The survey results highlighted that in North America all United States companies and the majority of Canadiancompanies surveyed have separate Corporate Governance committees which is a direct consequence of Sarbanes-Oxley legislation.
Of the surveyed companies Corporate Social Responsibility (CSR)/Sustainability committees were most prevalentin countries such as South Africa, the United Kingdom, Australia and Canada. This may be a function of greaterfocus by regulators and the organizations themselves on the board’s responsibilities to stakeholders other thanshareholders’ and the importance of CSR-type risks to this industry.
0% 20% 40% 60% 80% 100%
Audit and Finance
Remuneration
Nomination
CSR/Sustainability
Corporate Governance
South Africa
Canada
Unied Kingdom
Australia
United States
BRICs
Percentage of companiesSource: KPMG International
Source: Rio Tinto Iron Ore
Note: For some surveyed companies
while they had committees that
addressed each of the above areas,
they did not necessarily have five
separate committees.
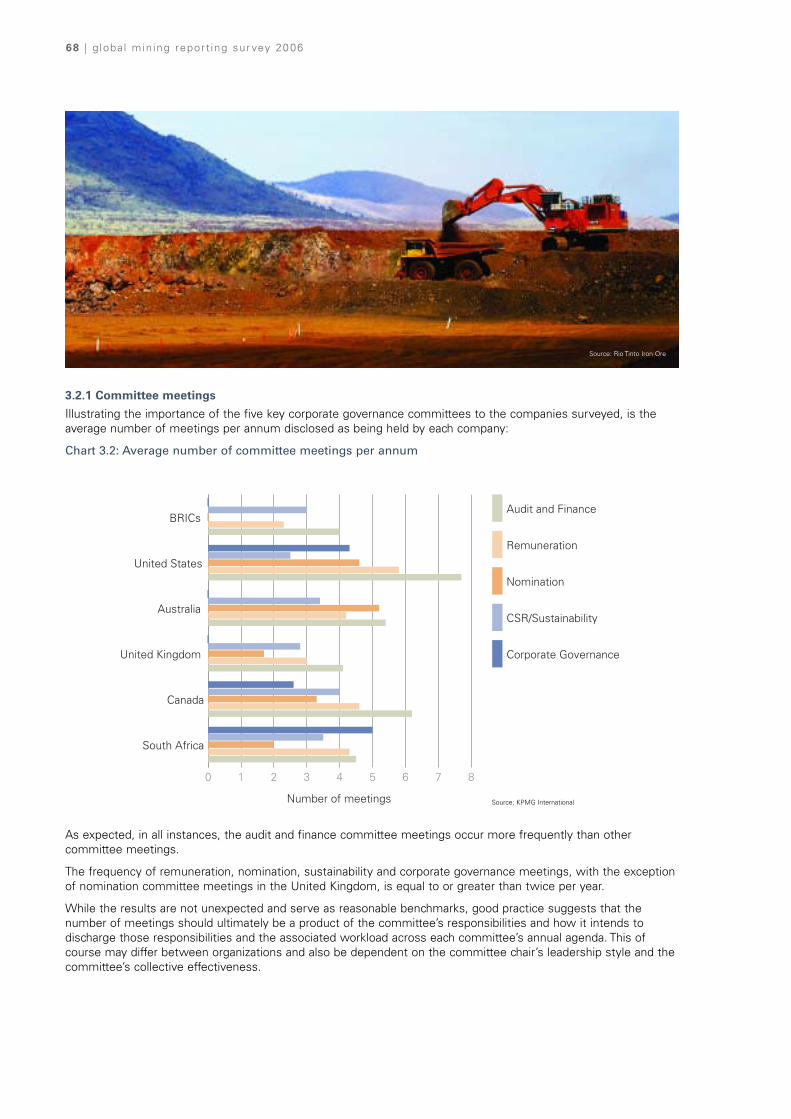
68 | g loba l min ing report ing sur vey 2006
3.2.1 Committee meetings
Illustrating the importance of the five key corporate governance committees to the companies surveyed, is theaverage number of meetings per annum disclosed as being held by each company:
Chart 3.2: Average number of committee meetings per annum
As expected, in all instances, the audit and finance committee meetings occur more frequently than othercommittee meetings.
The frequency of remuneration, nomination, sustainability and corporate governance meetings, with the exceptionof nomination committee meetings in the United Kingdom, is equal to or greater than twice per year.
While the results are not unexpected and serve as reasonable benchmarks, good practice suggests that thenumber of meetings should ultimately be a product of the committee’s responsibilities and how it intends todischarge those responsibilities and the associated workload across each committee’s annual agenda. This ofcourse may differ between organizations and also be dependent on the committee chair’s leadership style and thecommittee’s collective effectiveness.
0 1 2 3 4 5 6 7 8
Audit and Finance
Remuneration
Nomination
CSR/Sustainability
Corporate Governance
South Africa
Canada
United Kingdom
Australia
United States
BRICs
Number of meetings Source: KPMG International
Source: Rio Tinto Iron Ore

globa l min ing report ing sur vey 2006 | 69
3.2.2 Committee roles and objectives
The survey indicated that 98 percent of companies publicly disclosed information relating to the roles andobjectives of key committees. This is to be expected given that South African, Australian and United Kingdomcompanies are required to disclose this information in their annual reports. SEC listed companies are also requiredto disclose the roles and objectives of corporate governance related committees in their SEC filings.
For companies surveyed KPMG professionals investigated whether areas of business risk such as reserveestimates, sustainability reporting, asset custody and adherence to governance principles were specifically signed-off by the delegated committee. While it was evident that the majority of companies disclose the roles andobjectives of key committees, it was noted that disclosure of the formal sign-off process from the committees tothe board of directors was generally not detailed.
While U.S. audit committees report, and sign-off, as part of their organization’s proxy statement that the boardinclude the audited financial report in the annual report, board committees do not typically sign-off or attestexternally on specific matters under its review. Committees usually do not make major decisions by themselves,rather, they tend to make recommendations to the Board for decision (e.g. the audit committee can recommendthat the board approve the financial statements).
The board cannot divest itself of responsibilities for oversight of matters such as business risks, including issueslike reserve estimates, sustainability reporting, asset custody, etc, to a committee.
Committee sign-off is a vexed topic as there are associated concerns of differential liability (e.g. if a sign-off infersthat the audit committee has a higher level of duty of care to the shareholders).
Whether committee sign-off is likely to increase is uncertain, but what may be achievable and less confrontationalin the short to medium term is greater clarity in reporting on the performance of the committees in achieving theirobjectives (e.g. examples of where the audit committee has fostered better cooperation between the internal andexternal auditor to round out gaps in the assurance process). Such disclosure, supported by reporting on theprocess undertaken for a committee performance review, can provide investors and others with greaterconfidence that the committee is discharging its responsibilities accordingly.
3.3 CEO/CFO certificationAn increasingly important aspect of several corporate governance frameworks is the requirement for CEO andCFO certification on particular aspects of financial and non-financial reporting.
Of the companies surveyed, the following percentages show where the CEO/CFO of the organization signs-off oneither the financial statements or internal controls:
Chart 3.3: CEO/CFO sign off certification
0% 20% 40% 60% 80% 100%
Internal Controls
Financial Statements
South Africa
Canada
United Kingdom
Percentage of companies
Australia
United States
BRICs
Source: KPMG International

70 | g loba l min ing report ing sur vey 2006
With regard to internal controls sign-off by CEOs andCFOs the survey results showed strong adherence bycompanies to legislative and principle-basedrequirements in the countries in which they report.
Many boards will now be positioning CEO/CFOcertification in the context of the other assurances thatthey receive on the key risks their organization faces.These could include regular monitoring on theeffectiveness of internal controls, compliancecertification, internal audit, external audit, otherassurance providers (e.g. environmental reportingcertification, Occupational Health and Safetycertification, compliance program certification, actuariesadvice on options valuation, remuneration advice onexecutive compensation, etc).
Once a board has this picture, it is able to identify gapsin the assurances it receives and take active steps inbridging those gaps through either extended auditplanning, further management attestation or rectifyingdeficiencies in the control environment. Some leadingboards (through their audit committees) are beginningto report on their assurance structures and relatedaccountabilities.
3.4 Remuneration reportingAs the mining industry continues to face significantchallenges, companies are continuing to design morevaried and complex compensation structures toremunerate senior executives and employees. Thesearrangements are designed to attract and retain keyexecutives and to demonstrate a clear relationshipbetween performance and remuneration.
Executive remuneration is increasingly linked to theachievement of goals. An example disclosure withrespect to executive remuneration policy is as follows:
Example 3.1: IAMGOLD CorporationCompensation policy and objectives
The corporation’s executive compensation program isdesigned to align the interests of executive officers withthe short and long-term interests of the shareholders.Executive compensation is based on a combination ofindividual and corporate performance.
Executive compensation is comprised of annual salary,annual performance bonuses and long-term incentives inthe form of stock options and restricted share units whichare granted pursuant to the share incentive plan. Levels ofcompensation are established and maintained with theintent of attracting and retaining qualified and experiencedexecutives.
The compensation committee considers the performanceof the corporation in determining executive compensation.Corporate performance factors receive approximately equalweighting with individual performance objectives.Corporate performance factors include financial objectivesfor earnings and relative share prices and operationalobjectives for production levels, production costs andannual replacement of reserves and resources.Source: IAMGOLD Corporation 2005 Annual Report
Ninety-one percent of companies surveyed disclosedlinking executive and/or management remuneration tothe achievement of goals, compared to 81 percent inthe 2003 survey. Of the 44 companies surveyed about90 percent disclosed a split between short-term andlong-term incentives. In addition, 86 percent ofcompanies disclosed some form of share-basedpayment arrangement with employees.
The following chart shows the types of instrumentsbeing offered by companies as part of their share-based payment arrangements:

globa l min ing report ing sur vey 2006 | 71
Chart 3.4: Share-based payment arrangements
The results highlighted that around two thirds of the companies surveyed offered share options to employees as ameans of compensation and over half of companies granted shares.
Where companies offered share-based payment arrangements, most companies disclosed a service requirement,while only 30 percent of companies disclosed a performance/market condition.
The types of performance/market vesting conditions attached to share-based payments varied. The following chartshows the types of performance/market conditions disclosed by companies in respect of their share-basedpayment grants:
Chart 3.5: Performance/market vesting conditions attached to share-based payments
Performance measures linked to company share price were the most common conditions disclosed bycompanies. Total Shareholder Return (TSR), representing the increase in share price plus dividends reinvested,was the most prevalent. Nearly 80 percent of those companies that disclosed a performance/market conditionselected a TSR hurdle.
Profit measures such as net profit or earnings before interest and taxation (EBIT) were also used as were healthand safety measures (including community and social measures).
In response to the more complex remuneration arrangements being offered by companies and the needs ofstakeholders, accounting disclosure and reporting requirements have become more onerous. With the SEChaving recently issued new rules requiring a compensation discussion and analysis for US filers, this trend isexpected to continue.
0 5 10 15 20 25 30
None granted or not disclosed
Other
Share appreciation rights
Shares
Share options
Number of companies
Number of companies
0 2 4 6 8 10
Other
Return on investment
Health and Safety measures
Profit Measure
Earnings per share
Total shareholder return
Source: KPMG International
Source: KPMG International

72 | g loba l min ing report ing sur vey 2006
“The high cost of complying with section 4 of theSarbanes-Oxley Act of 2002 was one of the most notable statistics derived from the survey”
3.5 Sarbanes-OxleySection 404 of the Sarbanes-Oxley Act of 2002 (S-O 404), for those companies to which it applies, requiresmanagement to maintain effective internal controls over financial reporting and file a written assessment of theeffectiveness of those internal controls.
Of the 44 surveyed companies, only eight were required to comply with S-O 404 for the year ended 31 December2005. Another eight will be required to comply with S-O 404 in 2006 or 2007.
As a group, the eight companies did not analyze or make significant disclosures about S-O 404 in their annualreports. Many of the companies simply mentioned the costs relating to complying with S-O 404 in Management’sDiscussion and Analysis (MD&A) while explaining the change in certain expenses.
The high cost of complying was one of the most notable statistics derived from the survey. Aside from theincreased costs relative to additional staff and outsourcing of S-O management, the surveyed companies disclosedaverage external audit fees up by 141 percent in the year of adoption. In the second year, six of eight companiesreported decreases in their audit fees with an average decrease of 18 percent.
Of the eight companies that were required to comply with S-O 404, seven reported their internal controls overfinancial reporting were effective. The company that reported ineffective controls included an outline of thesignificant changes that the company had or is in the process of implementing in response to the materialweaknesses. Refer to the extract below, which details the company’s disclosure in their financial statements:
Example 3.2: Stillwater Mining CompanyIn the preliminary financial statements, these deficiencies resulted in material accounting errors, misclassifications, andinsufficient disclosures to the company’s consolidated financial statements as of and for the year ended December 31, 2005and contributed to the development of other material weaknesses described below.
• Inadequate financial statement preparation and review procedures. The company’s policies and procedures relating tothe financial reporting process did not ensure that accurate and reliable annual consolidated financial statements wereprepared and reviewed in a timely manner. Specifically, the company had insufficient review and supervision within theaccounting and finance departments and preparation and review procedures for footnote disclosures accompanying thecompany’s financial statements. These deficiencies resulted in material accounting errors, misclassifications andinsufficient disclosures in the company’s preliminary consolidated financial statements as of and for the year endedDecember 31, 2005.
Because of the material weaknesses described above, management concluded that, as of December 31, 2005, thecompany’s internal control over financial reporting was not effective.
Changes in Internal Control Over Financial Reporting
There have not been any changes, other than those discussed in the following paragraph, in the company’s internal controlover financial reporting (as such term is defined in Rules 31(a)-15(f) and 15d-15(f) under the Exchange Act) during the fourthquarter of 2005 that have materially affected, or are reasonably likely to materially affect, the company’s internal control overfinancial reporting.
During the fourth quarter of 2005, in response to recommendations from the company’s internal auditor and in order toaddress certain deficiencies in internal controls over financial reporting and strengthen management’s ability to monitorcertain asset and liability accounts, the company modified several of its account reconciliation processes. The deficienciesaddressed by these changes were distinct from those identified during year end testing that remained unremedied atDecember 31, 2005.Source: Stillwater Mining Company 2005 Annual Report
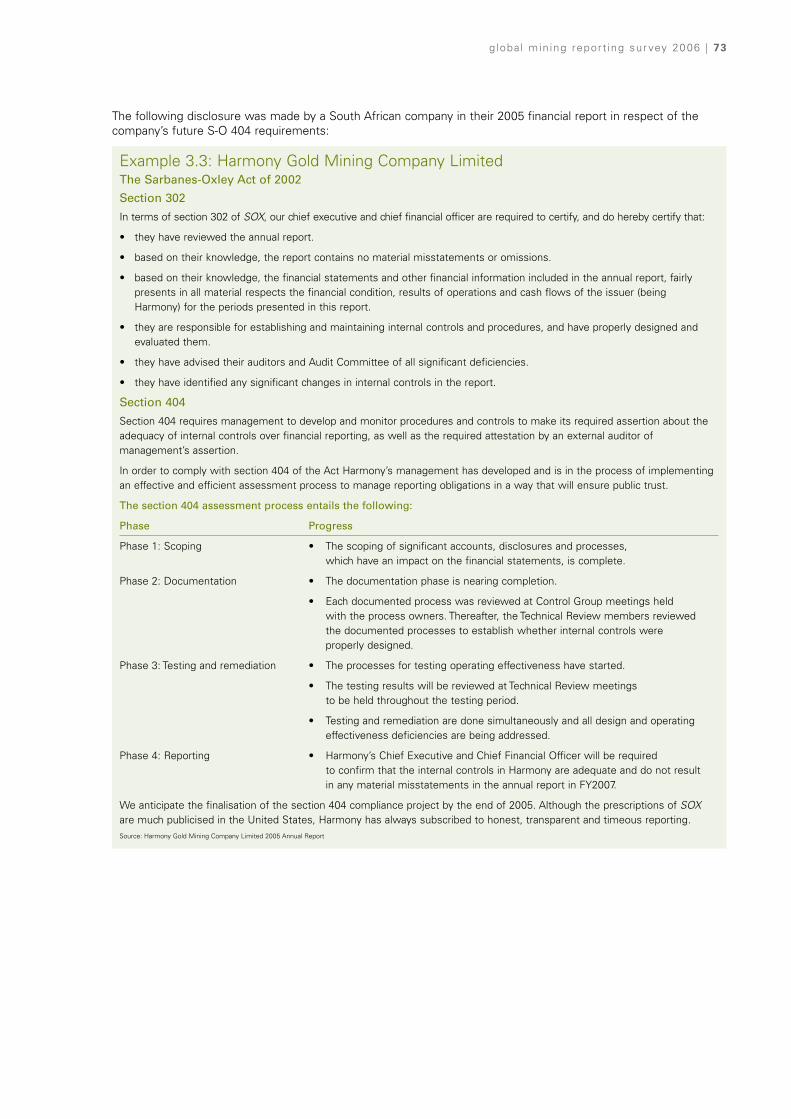
globa l min ing report ing sur vey 2006 | 73
The following disclosure was made by a South African company in their 2005 financial report in respect of thecompany’s future S-O 404 requirements:
Example 3.3: Harmony Gold Mining Company LimitedThe Sarbanes-Oxley Act of 2002
Section 302
In terms of section 302 of SOX, our chief executive and chief financial officer are required to certify, and do hereby certify that:
• they have reviewed the annual report.
• based on their knowledge, the report contains no material misstatements or omissions.
• based on their knowledge, the financial statements and other financial information included in the annual report, fairlypresents in all material respects the financial condition, results of operations and cash flows of the issuer (beingHarmony) for the periods presented in this report.
• they are responsible for establishing and maintaining internal controls and procedures, and have properly designed andevaluated them.
• they have advised their auditors and Audit Committee of all significant deficiencies.
• they have identified any significant changes in internal controls in the report.
Section 404
Section 404 requires management to develop and monitor procedures and controls to make its required assertion about theadequacy of internal controls over financial reporting, as well as the required attestation by an external auditor ofmanagement’s assertion.
In order to comply with section 404 of the Act Harmony’s management has developed and is in the process of implementingan effective and efficient assessment process to manage reporting obligations in a way that will ensure public trust.
The section 404 assessment process entails the following:
Phase Progress
Phase 1: Scoping • The scoping of significant accounts, disclosures and processes, which have an impact on the financial statements, is complete.
Phase 2: Documentation • The documentation phase is nearing completion.
• Each documented process was reviewed at Control Group meetings held with the process owners. Thereafter, the Technical Review members reviewed the documented processes to establish whether internal controls were properly designed.
Phase 3: Testing and remediation • The processes for testing operating effectiveness have started.
• The testing results will be reviewed at Technical Review meetings to be held throughout the testing period.
• Testing and remediation are done simultaneously and all design and operating effectiveness deficiencies are being addressed.
Phase 4: Reporting • Harmony’s Chief Executive and Chief Financial Officer will be required to confirm that the internal controls in Harmony are adequate and do not result in any material misstatements in the annual report in FY2007.
We anticipate the finalisation of the section 404 compliance project by the end of 2005. Although the prescriptions of SOXare much publicised in the United States, Harmony has always subscribed to honest, transparent and timeous reporting.Source: Harmony Gold Mining Company Limited 2005 Annual Report

74 | g loba l min ing report ing sur vey 2006
3.6 ReservesReserve and resource information is generally disclosed as part of a company’s annual report, but outside thefinancial statements. The survey indicated that 91 percent (2003: 78 percent) of companies disclosed reserve andresource data in their annual reports. However, it was noted that companies present the information in a variety ofways, as follows:
Table 3.2: Disclosure of reserve and resource information
The table indicates that companies in all parts of the world are generally disclosing reserve information. It shouldbe noted that three of the companies that did not include reserve information in the annual report did provide adetailed reserve statement as a separate report on their web sites.
The information included in the reserve statement generally disclosed the extent of proven and probable reservesand measured, indicated and inferred resources, and the grade and ownership interest where properties were not100 percent owned.
3.6.1 Reserve information
The information included within the reserve statements was varied, reflecting the requirements of the variouscodes and the various reporting jurisdictions of the companies surveyed. The codes disclosed in the reservestatements were evenly distributed between those of the Australasian Joint Ore Reserves Committee (JORC),the South African Mineral Resource Committee (SAMREC), SEC Industry Guide 7 for the US, and the CanadianInstitute of Mining, Metallurgy and Petroleum (CIM) definitions required under Canadian National Instrument 43-101. The areas that were consistently disclosed were:
• Fifty-two percent (2003: 40 percent) disclosed prices used to calculate reserves.
• Ninety-three percent (2003: 44 percent) disclosed the code used to calculate reserves.
• Twenty percent (2003: 10 percent) provided a sensitivity analysis of reserves to commodity price movements.
• Sixty-one percent (2003: 46 percent) explained the changes or movements in reserves, of which 52 percentprovided a year-over-year reconciliation to explain the change.
The level of information required to be provided in reserve statements is broadly consistent across the variouscodes, primarily driven by the main reserve reporting organizations, which form the Committee for MineralReserves International Reporting Standards (CRIRSCO), to provide an internationally consistent approach toreporting mineral assets.
While this initiative did encourage convergence between the main codes, nevertheless, some differences stillremain, such as when mineralization can be classified as reserves. This can result in a requirement for additionaldisclosure by those companies that report in more than one jurisdiction, and can impact financial reporting throughuse of different reserves data for calculating depreciation.
However, it should also be noted that there is acceptance of reserve codes by other jurisdictions.
SouthAfrica Canada
UnitedKingdom Australia
UnitedStates BRICs Total
By geographical
mineralization only
3 4 1 2 – 5 15
By commodity only 1 – 1 – – – 2
Both by geographical
mineralization and
commodity
2 8 3 3 7 – 23
Not disclosed – – 2 – – 2 4
Total 6 12 7 5 7 7 44
Source: KPMG International
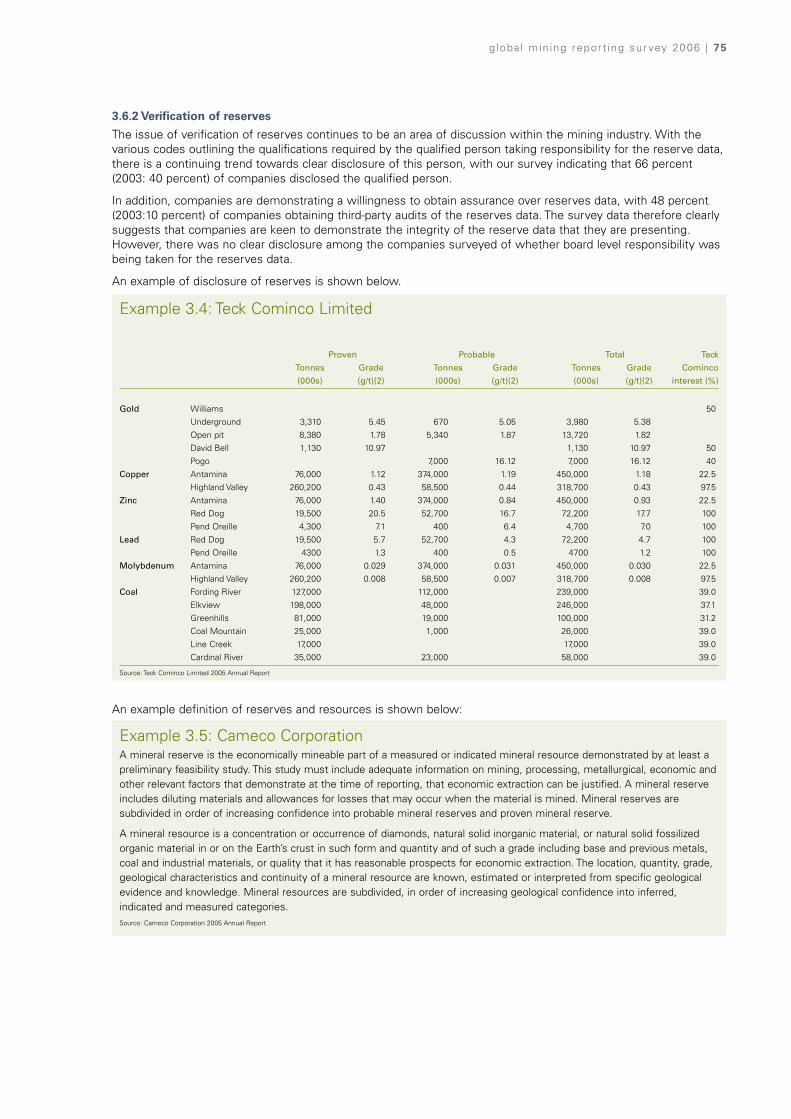
globa l min ing report ing sur vey 2006 | 75
3.6.2 Verification of reserves
The issue of verification of reserves continues to be an area of discussion within the mining industry. With thevarious codes outlining the qualifications required by the qualified person taking responsibility for the reserve data,there is a continuing trend towards clear disclosure of this person, with our survey indicating that 66 percent(2003: 40 percent) of companies disclosed the qualified person.
In addition, companies are demonstrating a willingness to obtain assurance over reserves data, with 48 percent(2003:10 percent) of companies obtaining third-party audits of the reserves data. The survey data therefore clearlysuggests that companies are keen to demonstrate the integrity of the reserve data that they are presenting.However, there was no clear disclosure among the companies surveyed of whether board level responsibility wasbeing taken for the reserves data.
An example of disclosure of reserves is shown below.
An example definition of reserves and resources is shown below:
Example 3.5: Cameco CorporationA mineral reserve is the economically mineable part of a measured or indicated mineral resource demonstrated by at least apreliminary feasibility study. This study must include adequate information on mining, processing, metallurgical, economic andother relevant factors that demonstrate at the time of reporting, that economic extraction can be justified. A mineral reserveincludes diluting materials and allowances for losses that may occur when the material is mined. Mineral reserves aresubdivided in order of increasing confidence into probable mineral reserves and proven mineral reserve.
A mineral resource is a concentration or occurrence of diamonds, natural solid inorganic material, or natural solid fossilizedorganic material in or on the Earth’s crust in such form and quantity and of such a grade including base and previous metals,coal and industrial materials, or quality that it has reasonable prospects for economic extraction. The location, quantity, grade,geological characteristics and continuity of a mineral resource are known, estimated or interpreted from specific geologicalevidence and knowledge. Mineral resources are subdivided, in order of increasing geological confidence into inferred,indicated and measured categories.Source: Cameco Corporation 2005 Annual Report
Example 3.4: Teck Cominco Limited
Proven Probable Total Teck
Tonnes Grade Tonnes Grade Tonnes Grade Cominco
(000s) (g/t)(2) (000s) (g/t)(2) (000s) (g/t)(2) interest (%)
Gold Williams 50
Underground 3,310 5.45 670 5.05 3,980 5.38
Open pit 8,380 1.78 5,340 1.87 13,720 1.82
David Bell 1,130 10.97 1,130 10.97 50
Pogo 7,000 16.12 7,000 16.12 40
Copper Antamina 76,000 1.12 374,000 1.19 450,000 1.18 22.5
Highland Valley 260,200 0.43 58,500 0.44 318,700 0.43 97.5
Zinc Antamina 76,000 1.40 374,000 0.84 450,000 0.93 22.5
Red Dog 19,500 20.5 52,700 16.7 72,200 17.7 100
Pend Oreille 4,300 7.1 400 6.4 4,700 7.0 100
Lead Red Dog 19,500 5.7 52,700 4.3 72,200 4.7 100
Pend Oreille 4300 1.3 400 0.5 4700 1.2 100
Molybdenum Antamina 76,000 0.029 374,000 0.031 450,000 0.030 22.5
Highland Valley 260,200 0.008 58,500 0.007 318,700 0.008 97.5
Coal Fording River 127,000 112,000 239,000 39.0
Elkview 198,000 48,000 246,000 37.1
Greenhills 81,000 19,000 100,000 31.2
Coal Mountain 25,000 1,000 26,000 39.0
Line Creek 17,000 17,000 39.0
Cardinal River 35,000 23,000 58,000 39.0
Source: Teck Cominco Limited 2005 Annual Report
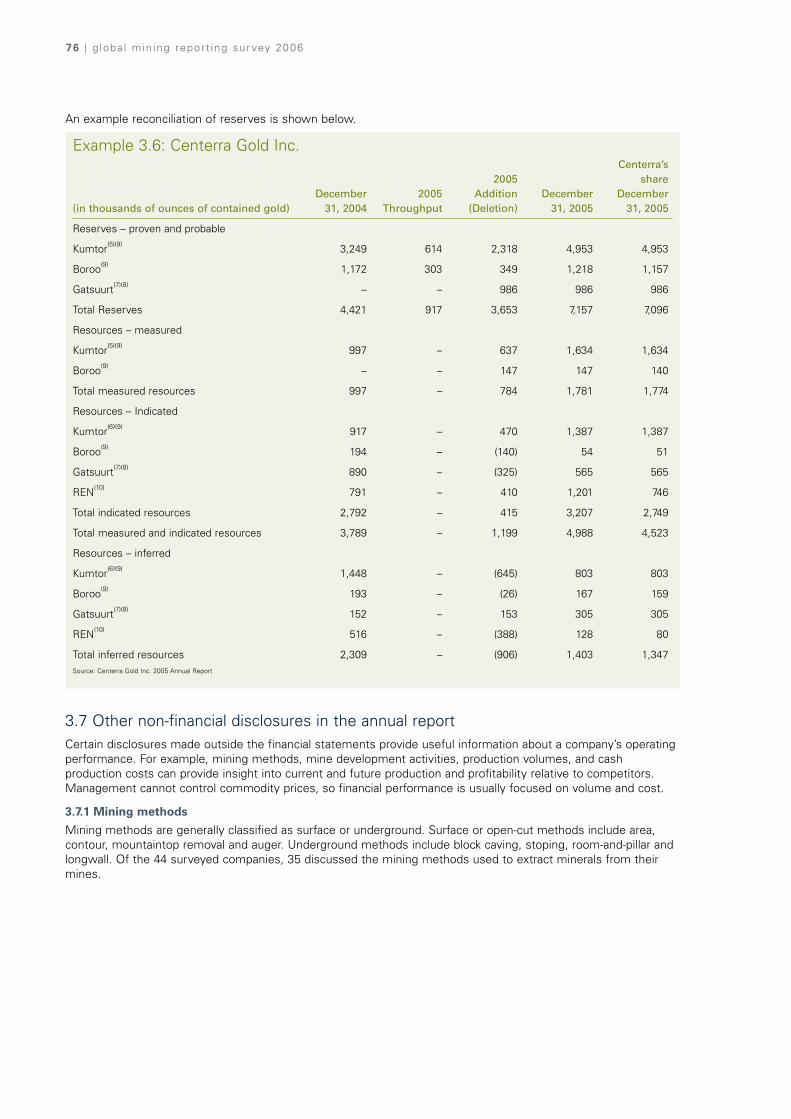
76 | g loba l min ing report ing sur vey 2006
3.7 Other non-financial disclosures in the annual reportCertain disclosures made outside the financial statements provide useful information about a company’s operatingperformance. For example, mining methods, mine development activities, production volumes, and cashproduction costs can provide insight into current and future production and profitability relative to competitors.Management cannot control commodity prices, so financial performance is usually focused on volume and cost.
3.7.1 Mining methods
Mining methods are generally classified as surface or underground. Surface or open-cut methods include area,contour, mountaintop removal and auger. Underground methods include block caving, stoping, room-and-pillar andlongwall. Of the 44 surveyed companies, 35 discussed the mining methods used to extract minerals from theirmines.
An example reconciliation of reserves is shown below.
Example 3.6: Centerra Gold Inc.Centerra’s
2005 shareDecember 2005 Addition December December
(in thousands of ounces of contained gold) 31, 2004 Throughput (Deletion) 31, 2005 31, 2005
Reserves – proven and probable
Kumtor(5)(9) 3,249 614 2,318 4,953 4,953
Boroo(9) 1,172 303 349 1,218 1,157
Gatsuurt(7)(8) – – 986 986 986
Total Reserves 4,421 917 3,653 7,157 7,096
Resources – measured
Kumtor(5)(9) 997 – 637 1,634 1,634
Boroo(9) – – 147 147 140
Total measured resources 997 – 784 1,781 1,774
Resources – Indicated
Kumtor(6X9) 917 – 470 1,387 1,387
Boroo(9) 194 – (140) 54 51
Gatsuurt(7)(8) 890 – (325) 565 565
REN(10) 791 – 410 1,201 746
Total indicated resources 2,792 – 415 3,207 2,749
Total measured and indicated resources 3,789 – 1,199 4,988 4,523
Resources – inferred
Kumtor(6X9) 1,448 – (645) 803 803
Boroo(9) 193 – (26) 167 159
Gatsuurt(7)(8) 152 – 153 305 305
REN(10) 516 – (388) 128 80
Total inferred resources 2,309 – (906) 1,403 1,347Source: Centerra Gold Inc. 2005 Annual Report

globa l min ing report ing sur vey 2006 | 77
These discussions often included a detailed description of the company’s operations, including technologicaldevelopments. An example disclosure has been included below:
Example 3.7: AngloGold Ashanti LimitedThe process of producing gold
The process of producing gold can be divided into six main phases:
• finding the orebody.
• creating access to the orebody.
• removing the ore by mining or breaking the orebody.
• transporting the broken material from the mining face to the plants for treatment.
• processing.
• refining.
This basic process applies to both underground and surface operations.
Creating access to the orebody
There are two types of mining which take place to access the orebody:
• underground – a vertical or decline shaft (designed to transport people and/or materials) is first sunk deep into the ground,after which horizontal development takes place at various levels of the main shaft or decline. This allows for further on-reefdevelopment of specific mining areas where the orebody has been identified.
• open-pit – where the top layers of topsoil or rock are removed in a process called ’stripping‘ to uncover the reef.
Removing the ore by mining or breaking the orebody
• in underground mining, holes are drilled into the orebody, filled with explosives and then blasted. The blasted ‘stropes’ or’faces‘ are then cleaned and the ore released is now ready to be transported out of the mine.
• in open-pit mining, drilling and blasting may also be necessary to release the gold bearing rock. Excavators then load thematerial onto the ore transport system.
Source: AngloGold Ashanti Limited 2005 Annual Report
Source: Rio Tinto Iron Ore

78 | g loba l min ing report ing sur vey 2006
3.7.2 Development activities
Approximately 90 percent of the companies surveyed discussed development activities. This information oftenprovides visibility into what will be produced, when production will commence, and potential production volumes.
An example disclosure with respect to the discussion of development activities is as follows:
Example 3.8: Coeur D’Alene Mines CorporationBolivia – The San Bartolome Project
Cœur acquired 100% of the equity in Empressa Minera Manquiri S.A. (‘Manquiri’) from Asarco on September 9, 1999.Manquiri’s principal asset is the mining rights to the San Bartolome project, a silver property located near the city of Potosi,Bolivia, on the flanks of the Cerro Rico Mountain. The San Bartolome project consists of several distinct silver bearing graveldeposits, which are locally referred to as pallaco or sucu deposits. These deposits lend themselves to simple, free diggingsurface mining techniques and can be extracted without drilling and blasting. The deposits were formed as a result of erosionof the silicified silver-rich upper part of the Cerro Rico volcanic dome complex.
We completed a preliminary feasibility study in 2000, which concluded that an open pit mine was potentially capable ofproducing approximately 6 million ounces of silver annually. In 2003, SRK, an independent consulting firm, was retained toreview the reserve/resource estimate to include additional sampling data to incorporate additional resources acquired with thePlahipo property, which lies to the east of Cerro Rico. During 2003, we retained Flour Daniel Wright to prepare an updatedfeasibility study which was completed at the end of the third quarter of 2004. The study provides for the use of a cyanidemilling flow sheet with a wet preconcentration screen circuit which will result in the production of a dore that may be treatedby a number of refiners under a tolling agreement which results in the return of refined silver to the company that is readilymarketed by metal banks and brokers to the ultimate customer. Based upon the results of the updated feasibility study, weestimate the capital cost of the project to be approximately $135 million. In the second quarter of 2004, we obtained alloperating permits. In the fourth quarter of 2004, we commenced construction activities at the project. An updated projectreview has confirmed the capital cost estimate for the project.Source: Coeur D’Alene Mines Corporation 2005 Annual Report
Example 3.9: Southern Copper Corporation2005
Nominal 2005 CapacityFacility Name Location Process Capacity (1) Production Utilization
PERUVIAN OPEN PIT UNIT
Mining operations
Cuajone Open-pit Mine Cuajone (Peru) Copper ore milling 87.0 ktpd 81.0 ktpd 93.1%and recovery, copper – Milling
and molybdenum concentrate production
Toquepala Open-pit Mine Toquepala (Peru) Copper ore milling 60.0 ktpd 59.5 ktpd 99.1%and recovery, copper – Millingand molybdenum
concentrate production
Toquepala SX –EW Plant Toquepala (Peru) Leaching, solvent 56.0 ktpy 36.5 ktpy 65.2%extraction and electro – Refinedcathode winning
Processing operations
Ilo Copper smelter Ilo (Peru) Copper smelting, 1,131.5 ktpy – 1,206.3 ktpy 106.6%blister production Concentrate feed
Ilo Copper Refinery Ilo (Peru) Copper refining 280 kpty – 285.2 ktpy 101.9%Refined cathodes
Ilo Acid Plant Ilo (Peru) Sulfuric Acid 300 ktpy 369.7 ktpy 123.2%– Sulfuric acid
Ilo Precious Metals Refinery Ilo (Peru) Slime recovery & processing, 365 tpy 311.4 tpy 85.3%Source: Southern Copper Corporation, 2005 Annual Report gold & silver refining
3.7.3 Production volumes
Production volumes are one of the most widely discussed operating measures disclosed by mining companies. All of the surveyed companies reported production volumes and 93 percent and 64 percent reported production by mine and product, respectively. An example disclosure has been included below:
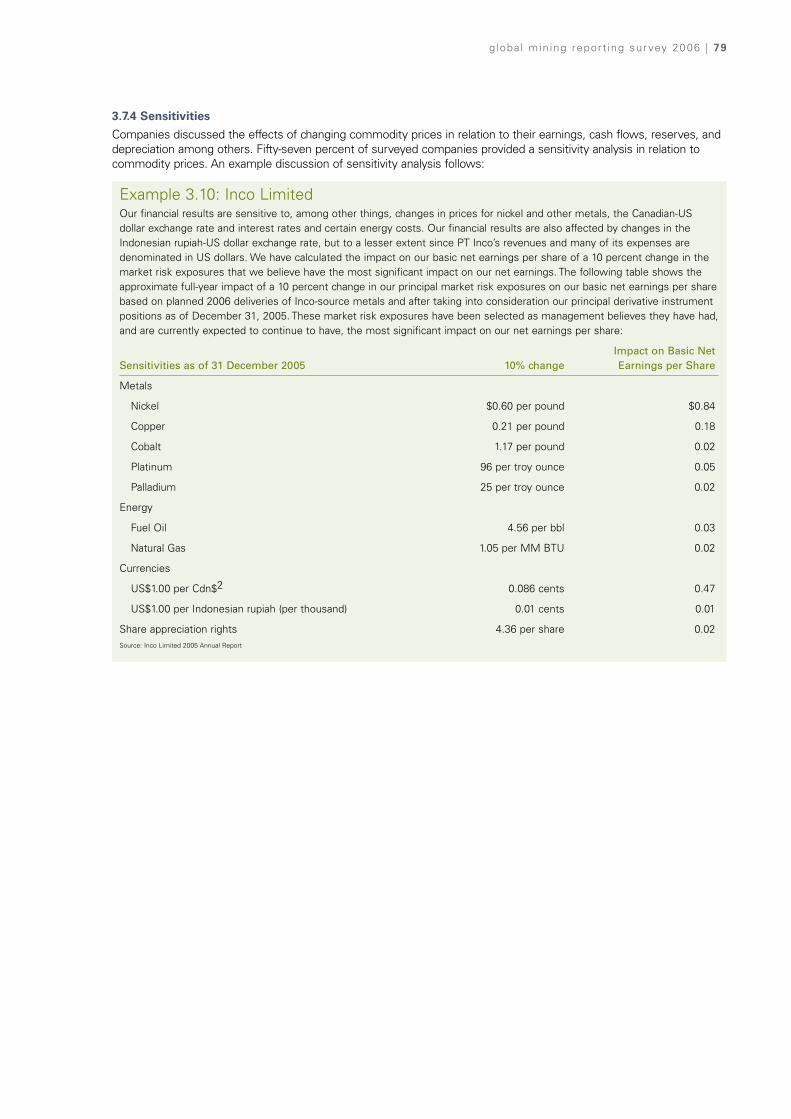
globa l min ing report ing sur vey 2006 | 79
3.7.4 Sensitivities
Companies discussed the effects of changing commodity prices in relation to their earnings, cash flows, reserves, anddepreciation among others. Fifty-seven percent of surveyed companies provided a sensitivity analysis in relation tocommodity prices. An example discussion of sensitivity analysis follows:
Example 3.10: Inco LimitedOur financial results are sensitive to, among other things, changes in prices for nickel and other metals, the Canadian-USdollar exchange rate and interest rates and certain energy costs. Our financial results are also affected by changes in theIndonesian rupiah-US dollar exchange rate, but to a lesser extent since PT Inco’s revenues and many of its expenses aredenominated in US dollars. We have calculated the impact on our basic net earnings per share of a 10 percent change in themarket risk exposures that we believe have the most significant impact on our net earnings. The following table shows theapproximate full-year impact of a 10 percent change in our principal market risk exposures on our basic net earnings per sharebased on planned 2006 deliveries of Inco-source metals and after taking into consideration our principal derivative instrumentpositions as of December 31, 2005. These market risk exposures have been selected as management believes they have had,and are currently expected to continue to have, the most significant impact on our net earnings per share:
Impact on Basic Net Sensitivities as of 31 December 2005 10% change Earnings per Share
Metals
Nickel $0.60 per pound $0.84
Copper 0.21 per pound 0.18
Cobalt 1.17 per pound 0.02
Platinum 96 per troy ounce 0.05
Palladium 25 per troy ounce 0.02
Energy
Fuel Oil 4.56 per bbl 0.03
Natural Gas 1.05 per MM BTU 0.02
Currencies
US$1.00 per Cdn$2 0.086 cents 0.47
US$1.00 per Indonesian rupiah (per thousand) 0.01 cents 0.01
Share appreciation rights 4.36 per share 0.02Source: Inco Limited 2005 Annual Report

80 | g loba l min ing report ing sur vey 2006
4. Results – corporate socialresponsibility reporting

globa l min ing report ing sur vey 2006 | 81
Mining continues to be the focus of attention for itssustainability performance from a broad range ofstakeholders, including shareholders, employees, non-governmental organizations (NGOs), financialinstitutions, and both local and internationalcommunities.
These stakeholders influence the performance ofmining companies by impacting on license to operate,productivity, reputation, capital and operationalexpenditure, and access to capital. Mining companiestherefore increasingly view sustainability as a real andpressing business issue.
The International Council on Mining and Metals(ICMM), which consists of 14 of the largest mining andmetal companies and 24 national mining and globalcommodities associations, continues to provideleadership towards achieving continuous improvementsin sustainable development performance in the mining,minerals and metals industry.
A key objective of the ICMM is improved industryperformance. Central to improved performance isICMM’s sustainable development framework. Itconsists of 10 principles, which were approved by theCouncil in May 2003. They identify the values and thepolicy directions that will help ensure that signatoriescontinually improve the sustainability of theiroperations.
Further to the adoption of the 10 principles, in 2004ICMM developed public reporting indicators whichwere devised in partnership with the Global ReportingInitiative (GRI) for reporting performance against the 10principles.
The outcome of this was the Mining and Metals SectorSupplement to the GRI, which was released inFebruary 2005 and comprises relevant indicators thatallow companies to track performance against theprinciples and GRI guidelines. In addition, during 2006,Council approved ICMM’s Assurance Procedure, whichprovides guidance on third party assurance overimplementation of the 10 principles and of thecommitment to report ‘in accordance with’ the GRIreporting framework.
Ninety-one percent of mining companies surveyedinclude information on their sustainability performancein their annual report and 100 percent had informationaddressing sustainability on their web sites.
There is also an increase in the number of companieswho publish this information in a separate sustainabilityor corporate responsibility report. These separate non-financial reports, which were published by 28 of thecompanies surveyed, were considered as part of thesurvey to assess the coverage of a range of issues.
The reporting of performance is moving away fromdisclosure of quantitative data only, to the reporting ofrelevant information that is material to a company’s keystakeholders and decision-makers.
Corporate social responsibility reporting in industrializedcountries has now become a regular practice by manycompanies, particularly those in the mining industry.

82 | g loba l min ing report ing sur vey 2006
4.1 CSR/sustainability sections in annual reports The information presented in annual reports relating toenvironmental provisions, decommissioning andrehabilitation costs, and capital expenditure is analyzedin Section 2. This section addresses whethercompanies have included additional non-financialinformation, which is not legally required in theirannual reports.
4.1.1 Reporting of issues
Of the companies included in the survey, a highproportion continue to provide varying levels ofsustainability information within the annual report, with91 percent (2003: 92 percent) providing thisinformation. Some reports provided only basicinformation (acknowledgement of the impact of thecompany’s operations and the need to address that)while others provided much more detail (performancedata and achievement against sustainability targets).
Of the companies that included sustainabilitydisclosures in their annual reports, the level of detailincluded in reports varies, as follows:
Table 4.1: Level of sustainability disclosure
Of note from the data presented above is the fact that60 percent of companies presenting sustainabilityinformation did so in a detailed manner, indicating apositive shift towards presentation of this informationin the annual report. While some companies onlyshowed basic disclosures in their annual reports, manycompanies prepared separate sustainability reports asdiscussed in section 4.2 below.
Detailed Basic
South Africa 50% 50%
Canada 25% 42%
United Kingdom 57% 43%
Australia 100% 0%
United States 86% 14%
BRICs 43% 57%
Total 60% 40%
Source: KPMG International

globa l min ing report ing sur vey 2006 | 83
The high rate of detailed reporting in Australia could be partly due to the introduction by the Minerals Council ofAustralia of the Enduring Value Framework for Sustainable Development. This requires that members report ontheir sustainability performance and that they obtain independent assurance on this information.
The areas of sustainability reporting covered were also diverse, as shown in the following chart:
Chart 4.1: Focus of sustainability reports
The chart indicates that the key issues addressed remain consistent with the previous survey, with more than 80percent of companies providing information including discussion of environmental, social and community, andhealth and safety issues.
4.12 Top-management commitment to sustainability
The credibility of sustainability reporting by a company is increased if senior management shows a commitment tothe company’s sustainability efforts. One of the most effective ways to demonstrate this is to ensure that the CEOstatement, or equivalent, mentions the importance of sustainability issues. Of the companies surveyed, 73percent (2003: 38 percent) included sustainability content in the CEO’s statement, suggesting an increased focusby top-level management on the importance of sustainability to their companies.
The following table shows a geographical analysis of companies that included a reference to sustainability in theCEO’s statement:
Table 4.2: CEO-sustainability statement by country
Another way of assessing management commitment to sustainability is whether the board of directors includes asustainability representative, who would chair the appropriate committee of the board of directors that oversees acompany’s sustainability efforts. The survey revealed that 75 percent (2003: 50 percent) of companies did so.Examples of board level committees addressing sustainability include environmental, health and safety,employment equity, and public policy committees.
0 5 10 15 20
Number of companies
25 30 35 40
Security
Supply Chain
Economic
Product Stewardship
Ethics and Integrity
Health and Safety
Social and Community
Environmental
South Africa CanadaUnited
Kingdom Australia United States BRICs
2006 100% 58% 86% 100% 57% 57%
2003 71% 23% 49% 83% 43% 8%
Source: KPMG International
Source: KPMG International

84 | g loba l min ing report ing sur vey 2006
These results indicate that companies are more firmly embedding discussion of sustainability into their annualreports. However, it should be noted that the strength of a company’s sustainability reporting should beconsidered in conjunction with other non-financial sustainability reports.
4.2 Separate CSR/sustainability reportsOf the companies surveyed, 59 percent (2003: 44 percent) published a separate sustainability-related reportcovering the company’s operations. The increase is an indication of increased efforts made by companies to satisfystakeholder requests for accountability and reporting of sustainable mining practices.
Finally, a company’s commitment to sustainability can be gauged by the linking of sustainability goals to the overallbusiness goals of the company. The survey indicated that 48 percent (2003: 30 percent) of companies described alink between these goals within their annual report. An example of the manner in which company sustainabilitytargets are presented in an annual report is shown below.
Example 4.1: Inmet Mining Corporation2005 Targets Results 2006 Targets
Reduce total injury frequency In 2005, our total injury frequency Reduce total injury frequency and disabling injury frequency rate was down 13 percent year- and disabling injury frequency by 10 percent. over-year, but our disabling injury by 10 percent.
frequency rate was up 25 percent, mainly due to a significant increase in our lost time injury frequency, particularly injuries involving contractors.
We’ve established a company-wide safety task force to respond to the situation and improve our performance (page 120).
Reduce the number of In 2005, we had 22 reportable Reduce the number of reportable environmental environmental incidents, 22 percent reportable environmental incidents by 5 percent. more than in 2004. This was mainly incidents by 5 percent.
due to an increase in reportable petroleum and tailings spills at Troilus. When evaluating spills on a production basis, our performance was similar to 2004.
Troilus will continue to implement its tailings Operations, Maintenance and Surveillance Manual to improve performance and avoid future incidents.
Develop and implement formal Formal community engagement and Develop and implement formal community engagement and dialogue has evolved slowly over that community engagement and dialogue plans. past few years. We now have the shared dialogue plans at Cayeli,
understanding and commitment we need Pyhasalmi, Troilus and throughout our organization to make good Las Cruces.progress developing and implementing plans in 2006.
Formal plans have been developed at our closed properties in Canada, and dialogue started at two locations in 2005.
Source: Inmet Mining Corporation 2005 Annual Report
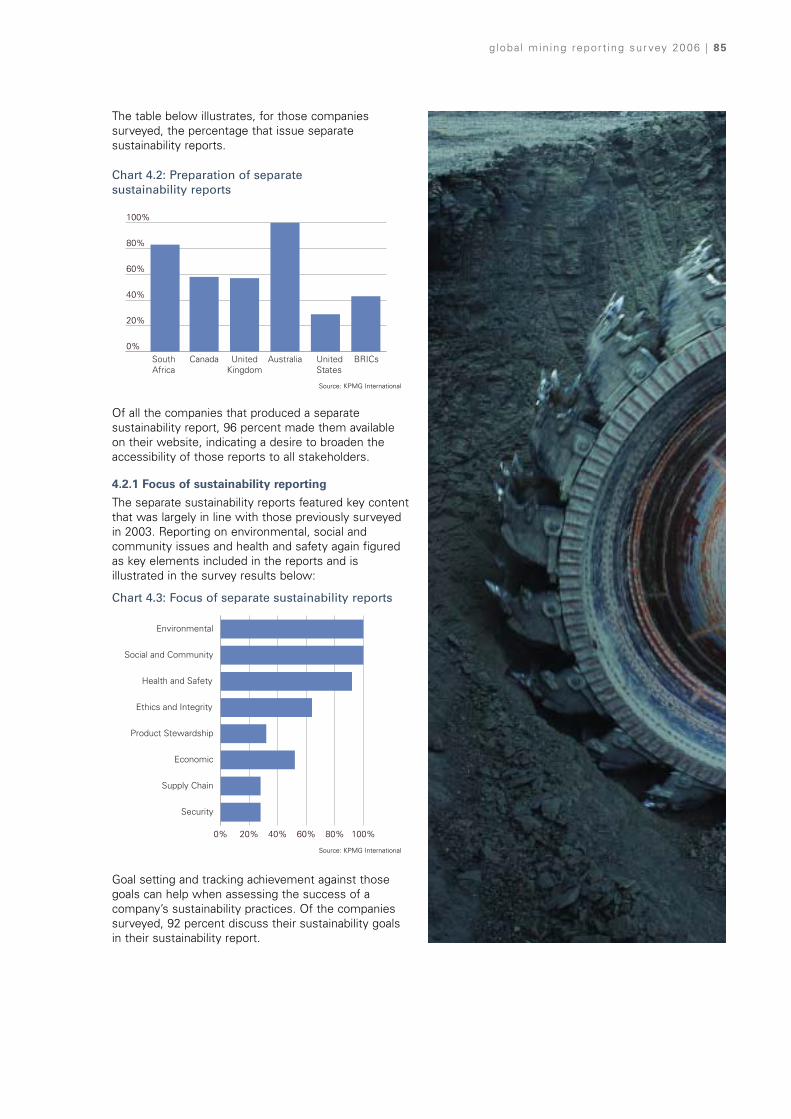
globa l min ing report ing sur vey 2006 | 85
The table below illustrates, for those companiessurveyed, the percentage that issue separatesustainability reports.
Chart 4.2: Preparation of separate sustainability reports
Of all the companies that produced a separatesustainability report, 96 percent made them availableon their website, indicating a desire to broaden theaccessibility of those reports to all stakeholders.
4.2.1 Focus of sustainability reporting
The separate sustainability reports featured key contentthat was largely in line with those previously surveyedin 2003. Reporting on environmental, social andcommunity issues and health and safety again figuredas key elements included in the reports and isillustrated in the survey results below:
Chart 4.3: Focus of separate sustainability reports
Goal setting and tracking achievement against thosegoals can help when assessing the success of acompany’s sustainability practices. Of the companiessurveyed, 92 percent discuss their sustainability goalsin their sustainability report.
0%
20%
40%
60%
80%
100%
BRICsUnitedStates
AustraliaUnitedKingdom
CanadaSouthAfrica
0% 20% 40% 60% 80% 100%
Security
Supply Chain
Economic
Product Stewardship
Ethics and Integrity
Health and Safety
Social and Community
Environmental
Source: KPMG International
Source: KPMG International
Source: Rio Tinto Iron Ore
86 | g loba l min ing report ing sur vey 2006

globa l min ing report ing sur vey 2006 | 87
4.2.2 Report assurance
In an effort to improve the reliability and transparencyof published sustainability reports, the survey identifiedthat of the 25 separate sustainability reports produced,52 percent (2003: 27 percent) were independentlyverified. Assurance on the sustainability reports wasprovided either by one of the major auditing firms (54percent) or by a specialist firm (46 percent).
4.2.3 Business principles and references to other standards
The existence of a set of business principles or code ofconduct is a tool for linking business performance andsustainability. Eighty-four percent (2003: 59 percent) ofthe sustainability reports included information oncompanies business principles, or code of conduct.
Of these, 96 percent (2003: 50 percent) of companiesreferred to external codes, examples of which includeISO 14001, the guidelines of the GRI, theJohannesburg Stock Exchange Reporting Index, andICMM Sustainable Development Principles.
The significant increase in references to external codesamong those companies surveyed is a strong indicationof the willingness of mining companies to apply arecognized framework to their sustainabilityassessment approach.
4.3 Key issues There are a number of key sustainability issuesspecifically affecting mining companies and thecountries in which they operate. With the increase insustainability reporting KPMG firms have also seen acontinued focus on reporting the following issues:
• Climate change and greenhouse gas emission
Climate change is widely acknowledged as asignificant environmental issue globally. Regulatoryframeworks and emissions trading schemes arebeing developed in response, such as the KyotoProtocol and the EU Trading Scheme which cameinto force in 2005. Of the companies surveyed, 100percent of Australian, United Kingdom and SouthAfrican disclosed information on the subject ofclimate change or greenhouse gas emissions. Incontrast, less than 50 percent of Canadian, UnitedStates and the BRICs companies surveyed disclosedinformation on this topic.
• Stakeholder engagement and dialogue
Landowners, neighbors, community leaders,regulatory authorities, governments, communities,shareholders, employees and contractors were allnoted as stakeholders with whom the surveyedcompanies engage. Consistent with the increase insustainability reporting by companies surveyed is anincrease to 55 percent (2003: 41 percent) ofcompanies that disclosed their approach toengagement and dialogue with their stakeholders.
• Business benefits of sustainable developmentand sustainability reporting
Of the companies surveyed, 43 percent havedisclosed information that links their sustainability-related practices to overall business benefits. Thisis expected to be increasingly discussed insustainability reports where companies seek tobalance the demands of stakeholders interested inbusiness performance to that of stakeholdersinterested in environmental and sustainableperformance.
• Mine closure
The impact of mine closures was discussed by 61percent of all companies surveyed with 100 percentof Australian companies highlighting this as a keyarea in their sustainability reporting.
• HIV/AIDS
This was reported as a key stakeholder issue by 100percent of South African companies and 71 percentof United Kingdom companies. Geographicdifferences in the nature of the companies’operations resulted in lower surveyed results forCanada, Australia, the United States and the BRICscountries.
4.4 Emerging standards and guidelines A significant step in the evolution of sustainabilityreporting occurred in October 2006, with thepublication of the third edition of the GRI’sSustainability Reporting Guidelines, referred to as theGRI G3.
The GRI G3 builds on previous versions of theguidelines and is the outcome of three years ofcollaboration, research and development withstakeholders to create an improved framework fordisclosing sustainability information.
Progress has also been made on assurance onsustainability reports, with two standards that havegained increasing acceptance for providing assurance.
• The International Standard on AssuranceEngagements ISAE3000 was published inDecember 2003 by the International Auditing andAssurance Standards Board (IAASB) of theInternational Federation of Accountants (IFAC). The AA1000 standard was published in March 2003by the Institute of Social and Ethical Accountability(AccountAbility) in the UK.
A comparison of the two standards was published inmid 2005 by KPMG and AccountAbility (AssuranceStandards Briefing: AA1000 Assurance Standard andISAE3000, KPMG & AccountAbility, 2005), andconcluded that the two standards are technicallycomplementary and can be applied together to provideassurance on sustainability reporting.

88 | g loba l min ing report ing sur vey 2006
5. Future accountingdevelopments
Source: Rio Tinto Iron Ore

IASB Extractive Activities Project
The IASB has asked a group of national standardsetters (Australia, Canada, Norway and South Africa) toundertake a comprehensive research project, the firststep towards the development of an acceptableapproach to resolving accounting issues that are uniqueto upstream extractive activities. It focuses on thefinancial reporting issues associated with reserves/resources and includes an advisory panel ofgeographically diverse analysts, individuals fromentities engaged in extractive activities, auditors,securities regulators and other users of financialreports.
Education sessions for extractive activities have beenheld by the IASB to generate a greater appreciation ofthe similarities and differences between minerals andoil and gas reserves/resources.
Comparisons between the major minerals and oil & gasindustry definitions of reserves and resources resultedin similarities, but also differences in specificity,methodologies, language and the scope of thedefinitions. An industry working group comprisingmembers of the CRIRSCO and the Society ofPetroleum Engineers Oil and Gas Reserves Committeeis undertaking a detailed review of their respectivereserve and resource definitions to identify thepotential for greater convergence and alternativeapproaches that may promote a commonunderstanding of definitions. This working group hasmade significant strides in converging industrydefinitions and discussions continue.
The advisory panel has been assisting the team toidentify attributes that reserves/resources mustpossess to be consistent with the IASB Framework'sdefinition and recognition criteria for an asset and toresearch the measurement of reserves/resources.
The team has considered initial arguments for andagainst the use of fair value as the measurementobjective for the balance sheet recognition of areserve/resource asset and for disclosures. The aimwas to gauge whether the project should continueconsidering the possible application of fair valuemodels to reserve/resource assets or focus onhistorical cost models going forward. An assessmentof the suitability of fair valuing reserves/resources wasdiscussed with the IASB in October 2006.
At this meeting, the IASB acknowledged the difficultiesin estimating fair value of reserve and resource assets.However, the IASB agreed with the project team thathistorical cost does not provide the most relevantinformation for these assets. Therefore, the IASB askedthe project team to further research current valueapproaches as potential measurement bases.
At the conclusion of the research phase, the team aimsto publish a discussion paper incorporating the IASB'spreliminary views on financial reporting ofreserves/resources.
United Nations Framework Classification for Fossil Energy and Mineral Resources
The UN Economic Commission for Europe (UNECE)has developed the United Nations FrameworkClassification for Fossil Energy and Mineral Resourcesand has convened a group of experts includingrepresentatives of both the Combined ReservesInternational Reporting Committee (CRISCO) and theSociety of Petroleum Engineers (SPE).
The group of experts' work includes the harmonizationof reserves and resources definitions between themining and the oil and gas industries under theFramework Classification.
The IASB's research project on accounting forextractive industries is currently considering accountingfor and disclosure of reserves and resources and so islinked into the UNECE's program. It is clear to us thatthe convergence of reserves and resources definitionswill be one of the critical inputs to the researchproject's work.
KPMG Comment
With the positive convergence work between oil andgas and mining definitions, we believe that the bestoutcome for the IASB will be to adopt the industrydefinitions for reserves and resources in a futureaccounting standard at a sufficiently detailed level.
The use of a definition for financial reporting that is notconsistent with those used for other purposes bycompanies in the industries would be far from optimal.
Firstly this would create a risk of artificiality and maytempt companies to 'flex' the definition to (in theirview) better reflect commercial reality – somethingthat may well have been the case for some oilcompanies reporting under the SEC reserves reporting regime.
Secondly this would require companies to maintaintwo sets of reserves and resources data which wouldabsorb much valuable management time for little, ifany, benefit.
Convergence of IFRS and U.S. GAAP
On February 27, 2006 the IASB and the FASB published a joint Memorandum of Understanding (MOU) thatreaffirms the Boards' goal of developing a commoninternational accounting framework.
The MOU does not represent a change to theprinciples and objectives described in the NorwalkAgreement published in October 2002, or the Boards'convergence work program.
There are several recent and future international accountingdevelopments that are set to impact mining companies.
globa l min ing report ing sur vey 2006 | 89

90 | g loba l min ing report ing sur vey 2006
Project description Overview
Borrowing costs This is an IASB project aimed at removing the main difference between IAS 23 Borrowing Costs and SFAS 34 Capitalization of Interest Cost.
The IASB issued an exposure draft in May 2006 proposing to eliminate the option currently available in IAS 23 to expense borrowing costs associated with the acquisition, construction or production of a ‘qualifying asset’.
A final IFRS is expected in the first half of 2007.
Joint ventures This is an IASB project aimed at removing differences between IAS 31 Joint Ventures and U.S. GAAP. This project is likely to result in the removal of the option to use proportional consolidation to account for interests in joint venture entities currently available in IAS 31. Presumably, such interests would need to be accounted for using the equity method.
An ED is expected in 2007, and a final IASB standard is scheduled for 2008.
Income taxes This is a joint IASB/FASB project aimed at reducing the differences between IAS 12 Income Taxesand SFAS 109 Accounting for Income Taxes.
Both IAS 12 and SFAS 109 are based on the balance sheet liability approach to accounting for deferred taxes. However, differences arise because both standards have exceptions to their basic principles. The objective of this project is not to reconsider the underlying approach, but rather to eliminate exceptions to the basic principles.
Convergence issues being considered by the Boards include the definition of tax base, exemptions from the initial recognition of deferred tax assets and liabilities, the measurement of deferred taxes, accounting for uncertainties in income taxes, the allocation of income taxes to profit and loss or equity, and special deductions.
An ED is expected early in 2007 and a final standard is scheduled for 2008.
Impairment This is a joint IASB/FASB project aimed at reducing differences in identifying and measuring impairment of assets between IFRS and U.S. GAAP. The project is currently in the staff research phase.
Segment reporting This is an IASB project to align IAS 14 Segment Reporting with SFAS 131 Disclosure about Segments of an Enterprise and Related Information.
The IASB has issued ED 8 Operating Segments proposing adoption of the U.S. management approach to the identification of segments and reporting of segment information.
A final IASB standard is expected in late 2006.
Emissions trading This is an IASB project to improve IAS 20 Accounting for Government Grantsschemes and and Disclosure of Government Assistance.government grants
The IASB also decided to add emission trading to its agenda. Accounting for emission rights issued at less than full value will be considered as part of the amendments to IAS 20.
Work on this topic has been deferred until related projects, including liabilities are advanced further.
Business combinations This is a joint IASB/FASB project aimed at developing a single standard for business combinations that can be used for both domestic and cross-border financial reporting.
Under the proposals, the total amount to be recognized by the acquirer would be the full fair value of the business over which it obtains control even if the combination is achieved in stages or if the acquirer owns less than 100 percent of the equity interest of the acquiree at the date of acquisition. Consequently, if the acquirer owns less than 100 percent of the equity interests in the acquiree, then goodwill attributable to the non-controlling (minority) interest would be recognized.
The Boards anticipate a final standard will be available in the second half of 2007.
Table 5.3 IFRS and U.S. GAAP convergence projects impacting the mining sector
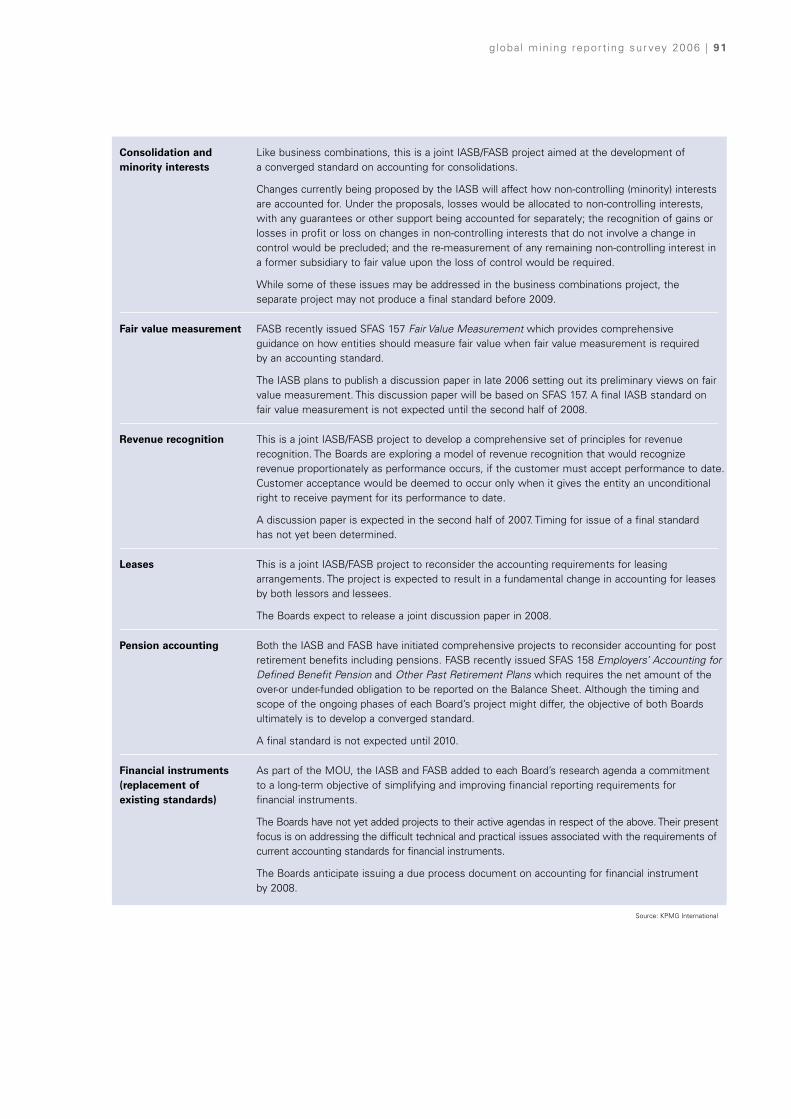
globa l min ing report ing sur vey 2006 | 91
Consolidation and Like business combinations, this is a joint IASB/FASB project aimed at the development of minority interests a converged standard on accounting for consolidations.
Changes currently being proposed by the IASB will affect how non-controlling (minority) interestsare accounted for. Under the proposals, losses would be allocated to non-controlling interests, with any guarantees or other support being accounted for separately; the recognition of gains or losses in profit or loss on changes in non-controlling interests that do not involve a change in control would be precluded; and the re-measurement of any remaining non-controlling interest ina former subsidiary to fair value upon the loss of control would be required.
While some of these issues may be addressed in the business combinations project, the separate project may not produce a final standard before 2009.
Fair value measurement FASB recently issued SFAS 157 Fair Value Measurement which provides comprehensive guidance on how entities should measure fair value when fair value measurement is required by an accounting standard.
The IASB plans to publish a discussion paper in late 2006 setting out its preliminary views on fairvalue measurement. This discussion paper will be based on SFAS 157. A final IASB standard on fair value measurement is not expected until the second half of 2008.
Revenue recognition This is a joint IASB/FASB project to develop a comprehensive set of principles for revenue recognition. The Boards are exploring a model of revenue recognition that would recognize revenue proportionately as performance occurs, if the customer must accept performance to date.Customer acceptance would be deemed to occur only when it gives the entity an unconditional right to receive payment for its performance to date.
A discussion paper is expected in the second half of 2007. Timing for issue of a final standard has not yet been determined.
Leases This is a joint IASB/FASB project to reconsider the accounting requirements for leasing arrangements. The project is expected to result in a fundamental change in accounting for leases by both lessors and lessees.
The Boards expect to release a joint discussion paper in 2008.
Pension accounting Both the IASB and FASB have initiated comprehensive projects to reconsider accounting for post retirement benefits including pensions. FASB recently issued SFAS 158 Employers’ Accounting for Defined Benefit Pension and Other Past Retirement Plans which requires the net amount of the over-or under-funded obligation to be reported on the Balance Sheet. Although the timing and scope of the ongoing phases of each Board’s project might differ, the objective of both Boards ultimately is to develop a converged standard.
A final standard is not expected until 2010.
Financial instruments As part of the MOU, the IASB and FASB added to each Board’s research agenda a commitment(replacement of to a long-term objective of simplifying and improving financial reporting requirements forexisting standards) financial instruments.
The Boards have not yet added projects to their active agendas in respect of the above. Their present focus is on addressing the difficult technical and practical issues associated with the requirements of current accounting standards for financial instruments.
The Boards anticipate issuing a due process document on accounting for financial instrument by 2008.
Source: KPMG International
92 | g loba l min ing report ing sur vey 2006
6. History of theKPMG Global MiningReporting Survey
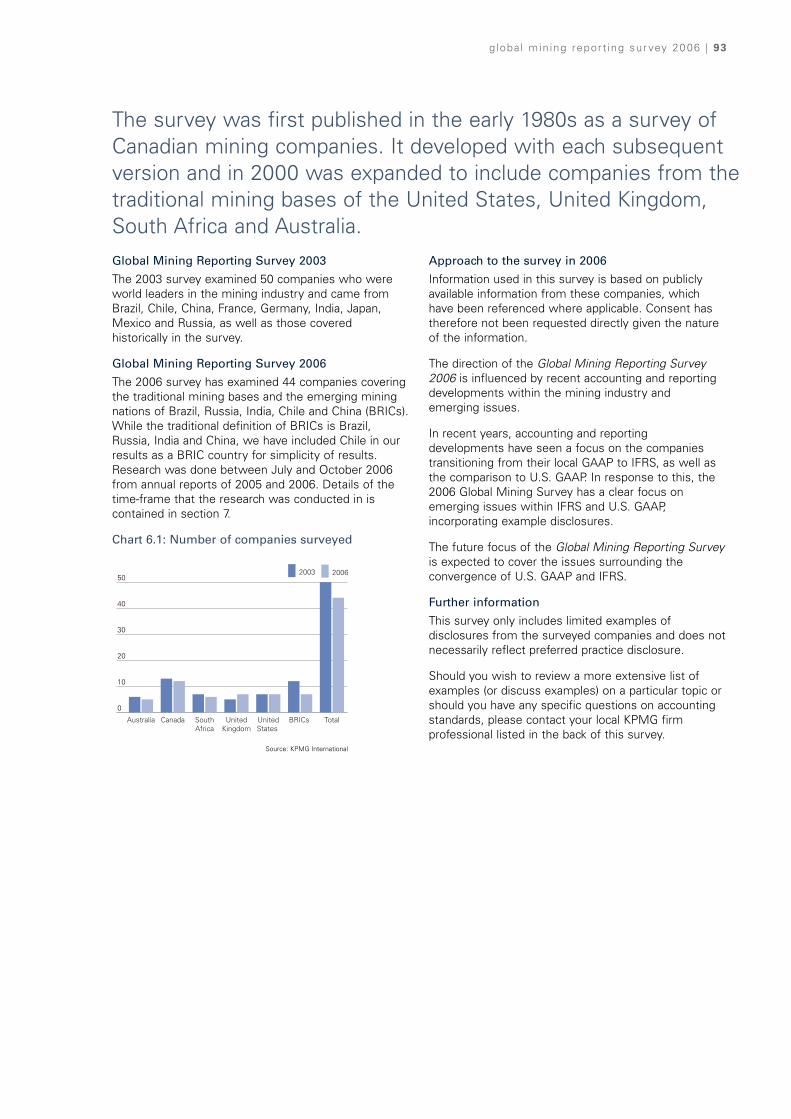
globa l min ing report ing sur vey 2006 | 93
Global Mining Reporting Survey 2003
The 2003 survey examined 50 companies who wereworld leaders in the mining industry and came fromBrazil, Chile, China, France, Germany, India, Japan,Mexico and Russia, as well as those coveredhistorically in the survey.
Global Mining Reporting Survey 2006
The 2006 survey has examined 44 companies coveringthe traditional mining bases and the emerging miningnations of Brazil, Russia, India, Chile and China (BRICs).While the traditional definition of BRICs is Brazil,Russia, India and China, we have included Chile in ourresults as a BRIC country for simplicity of results.Research was done between July and October 2006from annual reports of 2005 and 2006. Details of thetime-frame that the research was conducted in iscontained in section 7.
Chart 6.1: Number of companies surveyed
Approach to the survey in 2006
Information used in this survey is based on publiclyavailable information from these companies, whichhave been referenced where applicable. Consent hastherefore not been requested directly given the natureof the information.
The direction of the Global Mining Reporting Survey2006 is influenced by recent accounting and reportingdevelopments within the mining industry and emerging issues.
In recent years, accounting and reportingdevelopments have seen a focus on the companiestransitioning from their local GAAP to IFRS, as well asthe comparison to U.S. GAAP. In response to this, the2006 Global Mining Survey has a clear focus onemerging issues within IFRS and U.S. GAAP,incorporating example disclosures.
The future focus of the Global Mining Reporting Surveyis expected to cover the issues surrounding theconvergence of U.S. GAAP and IFRS.
Further information
This survey only includes limited examples ofdisclosures from the surveyed companies and does notnecessarily reflect preferred practice disclosure.
Should you wish to review a more extensive list ofexamples (or discuss examples) on a particular topic orshould you have any specific questions on accountingstandards, please contact your local KPMG firmprofessional listed in the back of this survey.
0
10
20
30
40
5020062003
TotalBRICsUnitedStates
UnitedKingdom
SouthAfrica
CanadaAustralia
The survey was first published in the early 1980s as a survey ofCanadian mining companies. It developed with each subsequentversion and in 2000 was expanded to include companies from thetraditional mining bases of the United States, United Kingdom,South Africa and Australia.
Source: KPMG International

94 | g loba l min ing report ing sur vey 2006
7. Companies surveyed
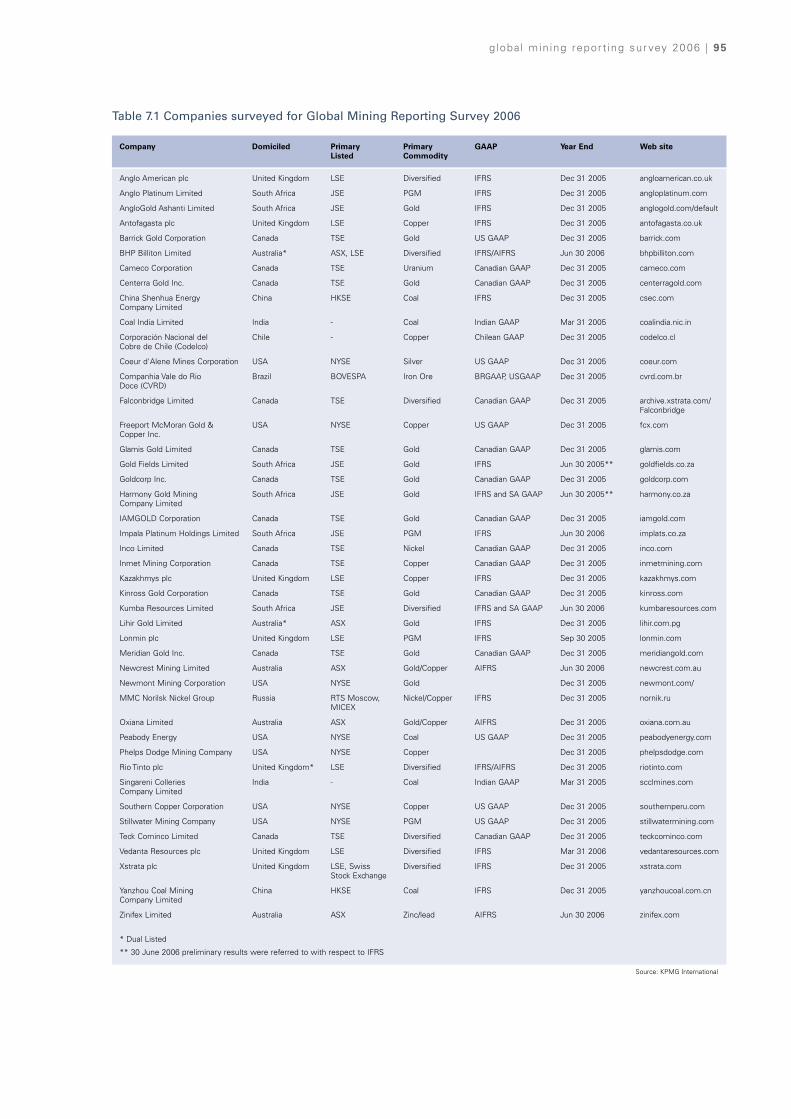
globa l min ing report ing sur vey 2006 | 95
Company Domiciled Primary Primary GAAP Year End Web siteListed Commodity
Anglo American plc United Kingdom LSE Diversified IFRS Dec 31 2005 angloamerican.co.uk
Anglo Platinum Limited South Africa JSE PGM IFRS Dec 31 2005 angloplatinum.com
AngloGold Ashanti Limited South Africa JSE Gold IFRS Dec 31 2005 anglogold.com/default
Antofagasta plc United Kingdom LSE Copper IFRS Dec 31 2005 antofagasta.co.uk
Barrick Gold Corporation Canada TSE Gold US GAAP Dec 31 2005 barrick.com
BHP Billiton Limited Australia* ASX, LSE Diversified IFRS/AIFRS Jun 30 2006 bhpbilliton.com
Cameco Corporation Canada TSE Uranium Canadian GAAP Dec 31 2005 cameco.com
Centerra Gold Inc. Canada TSE Gold Canadian GAAP Dec 31 2005 centerragold.com
China Shenhua Energy China HKSE Coal IFRS Dec 31 2005 csec.comCompany Limited
Coal India Limited India - Coal Indian GAAP Mar 31 2005 coalindia.nic.in
Corporación Nacional del Chile - Copper Chilean GAAP Dec 31 2005 codelco.clCobre de Chile (Codelco)
Coeur d'Alene Mines Corporation USA NYSE Silver US GAAP Dec 31 2005 coeur.com
Companhia Vale do Rio Brazil BOVESPA Iron Ore BRGAAP, USGAAP Dec 31 2005 cvrd.com.brDoce (CVRD)
Falconbridge Limited Canada TSE Diversified Canadian GAAP Dec 31 2005 archive.xstrata.com/Falconbridge
Freeport McMoran Gold & USA NYSE Copper US GAAP Dec 31 2005 fcx.comCopper Inc.
Glamis Gold Limited Canada TSE Gold Canadian GAAP Dec 31 2005 glamis.com
Gold Fields Limited South Africa JSE Gold IFRS Jun 30 2005** goldfields.co.za
Goldcorp Inc. Canada TSE Gold Canadian GAAP Dec 31 2005 goldcorp.com
Harmony Gold Mining South Africa JSE Gold IFRS and SA GAAP Jun 30 2005** harmony.co.zaCompany Limited
IAMGOLD Corporation Canada TSE Gold Canadian GAAP Dec 31 2005 iamgold.com
Impala Platinum Holdings Limited South Africa JSE PGM IFRS Jun 30 2006 implats.co.za
Inco Limited Canada TSE Nickel Canadian GAAP Dec 31 2005 inco.com
Inmet Mining Corporation Canada TSE Copper Canadian GAAP Dec 31 2005 inmetmining.com
Kazakhmys plc United Kingdom LSE Copper IFRS Dec 31 2005 kazakhmys.com
Kinross Gold Corporation Canada TSE Gold Canadian GAAP Dec 31 2005 kinross.com
Kumba Resources Limited South Africa JSE Diversified IFRS and SA GAAP Jun 30 2006 kumbaresources.com
Lihir Gold Limited Australia* ASX Gold IFRS Dec 31 2005 lihir.com.pg
Lonmin plc United Kingdom LSE PGM IFRS Sep 30 2005 lonmin.com
Meridian Gold Inc. Canada TSE Gold Canadian GAAP Dec 31 2005 meridiangold.com
Newcrest Mining Limited Australia ASX Gold/Copper AIFRS Jun 30 2006 newcrest.com.au
Newmont Mining Corporation USA NYSE Gold Dec 31 2005 newmont.com/
MMC Norilsk Nickel Group Russia RTS Moscow, Nickel/Copper IFRS Dec 31 2005 nornik.ruMICEX
Oxiana Limited Australia ASX Gold/Copper AIFRS Dec 31 2005 oxiana.com.au
Peabody Energy USA NYSE Coal US GAAP Dec 31 2005 peabodyenergy.com
Phelps Dodge Mining Company USA NYSE Copper Dec 31 2005 phelpsdodge.com
Rio Tinto plc United Kingdom* LSE Diversified IFRS/AIFRS Dec 31 2005 riotinto.com
Singareni Colleries India - Coal Indian GAAP Mar 31 2005 scclmines.comCompany Limited
Southern Copper Corporation USA NYSE Copper US GAAP Dec 31 2005 southernperu.com
Stillwater Mining Company USA NYSE PGM US GAAP Dec 31 2005 stillwatermining.com
Teck Cominco Limited Canada TSE Diversified Canadian GAAP Dec 31 2005 teckcominco.com
Vedanta Resources plc United Kingdom LSE Diversified IFRS Mar 31 2006 vedantaresources.com
Xstrata plc United Kingdom LSE, Swiss Diversified IFRS Dec 31 2005 xstrata.comStock Exchange
Yanzhou Coal Mining China HKSE Coal IFRS Dec 31 2005 yanzhoucoal.com.cnCompany Limited
Zinifex Limited Australia ASX Zinc/lead AIFRS Jun 30 2006 zinifex.com
* Dual Listed
** 30 June 2006 preliminary results were referred to with respect to IFRS
Table 7.1 Companies surveyed for Global Mining Reporting Survey 2006
Source: KPMG International

96 | g loba l min ing report ing sur vey 2006
8. Abbreviations
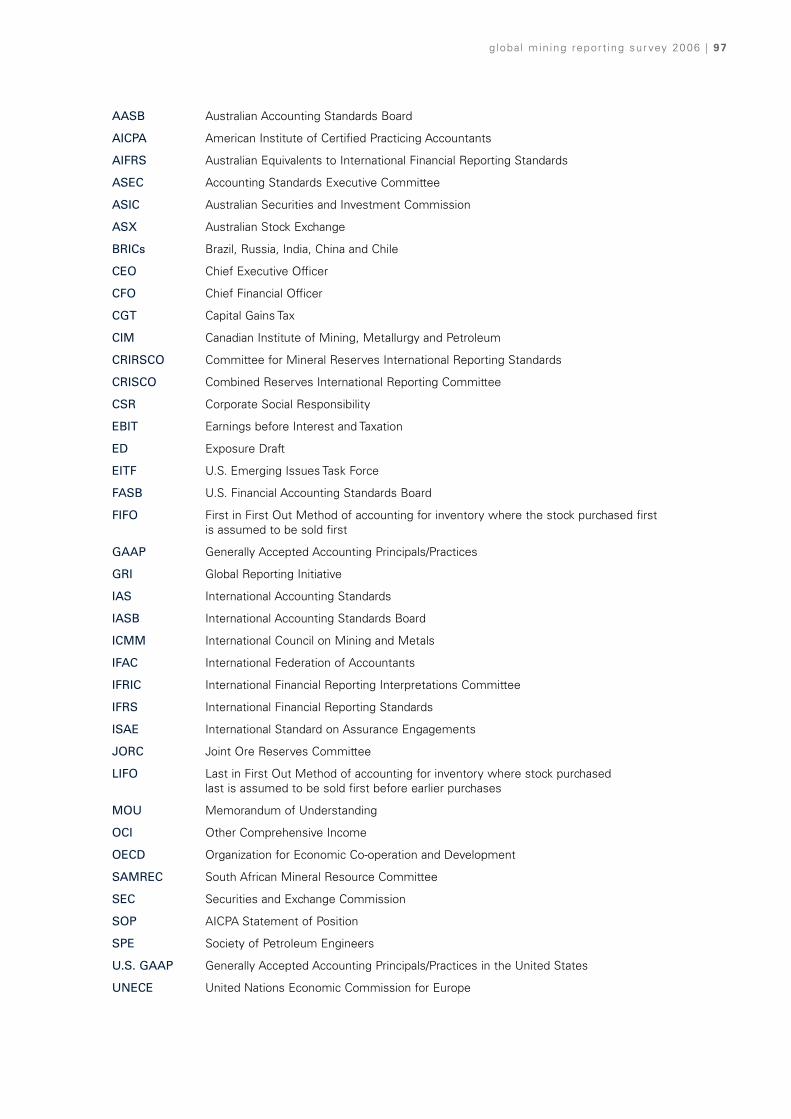
globa l min ing report ing sur vey 2006 | 97
AASB Australian Accounting Standards Board
AICPA American Institute of Certified Practicing Accountants
AIFRS Australian Equivalents to International Financial Reporting Standards
ASEC Accounting Standards Executive Committee
ASIC Australian Securities and Investment Commission
ASX Australian Stock Exchange
BRICs Brazil, Russia, India, China and Chile
CEO Chief Executive Officer
CFO Chief Financial Officer
CGT Capital Gains Tax
CIM Canadian Institute of Mining, Metallurgy and Petroleum
CRIRSCO Committee for Mineral Reserves International Reporting Standards
CRISCO Combined Reserves International Reporting Committee
CSR Corporate Social Responsibility
EBIT Earnings before Interest and Taxation
ED Exposure Draft
EITF U.S. Emerging Issues Task Force
FASB U.S. Financial Accounting Standards Board
FIFO First in First Out Method of accounting for inventory where the stock purchased first is assumed to be sold first
GAAP Generally Accepted Accounting Principals/Practices
GRI Global Reporting Initiative
IAS International Accounting Standards
IASB International Accounting Standards Board
ICMM International Council on Mining and Metals
IFAC International Federation of Accountants
IFRIC International Financial Reporting Interpretations Committee
IFRS International Financial Reporting Standards
ISAE International Standard on Assurance Engagements
JORC Joint Ore Reserves Committee
LIFO Last in First Out Method of accounting for inventory where stock purchased last is assumed to be sold first before earlier purchases
MOU Memorandum of Understanding
OCI Other Comprehensive Income
OECD Organization for Economic Co-operation and Development
SAMREC South African Mineral Resource Committee
SEC Securities and Exchange Commission
SOP AICPA Statement of Position
SPE Society of Petroleum Engineers
U.S. GAAP Generally Accepted Accounting Principals/Practices in the United States
UNECE United Nations Economic Commission for Europe

98 | g loba l min ing report ing sur vey 2006
9. Contributors
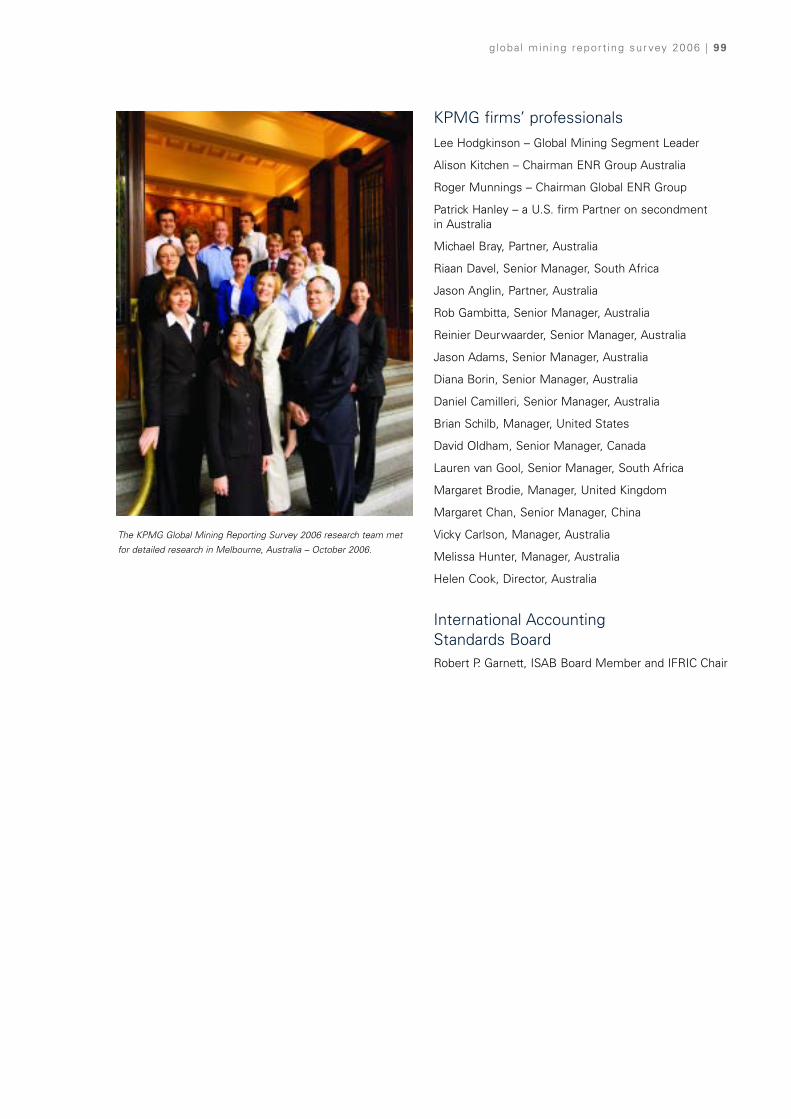
globa l min ing report ing sur vey 2006 | 99
KPMG firms’ professionalsLee Hodgkinson – Global Mining Segment Leader
Alison Kitchen – Chairman ENR Group Australia
Roger Munnings – Chairman Global ENR Group
Patrick Hanley – a U.S. firm Partner on secondment in Australia
Michael Bray, Partner, Australia
Riaan Davel, Senior Manager, South Africa
Jason Anglin, Partner, Australia
Rob Gambitta, Senior Manager, Australia
Reinier Deurwaarder, Senior Manager, Australia
Jason Adams, Senior Manager, Australia
Diana Borin, Senior Manager, Australia
Daniel Camilleri, Senior Manager, Australia
Brian Schilb, Manager, United States
David Oldham, Senior Manager, Canada
Lauren van Gool, Senior Manager, South Africa
Margaret Brodie, Manager, United Kingdom
Margaret Chan, Senior Manager, China
Vicky Carlson, Manager, Australia
Melissa Hunter, Manager, Australia
Helen Cook, Director, Australia
International Accounting Standards BoardRobert P. Garnett, ISAB Board Member and IFRIC Chair
The KPMG Global Mining Reporting Survey 2006 research team met
for detailed research in Melbourne, Australia – October 2006.

100 | g loba l min ing report ing sur vey 2006
10. Contacts

Leadership teamGlobal Chair
Energy & Natural Resources
Roger Munnings+74 95 937 [email protected]
Australian Chair
Energy & Natural Resources
Alison Kitchen+61 3 9288 [email protected]
Global Mining
Segment Leader
Lee Hodgkinson+1 416 777 [email protected]
KPMG member firms’Australia
Alison Kitchen+61 3 9288 [email protected]
Canada
Lee Hodgkinson+1 416 777 [email protected]
Chile
Graham Hogg+56 2 [email protected]
China
Melvin Guen+86 10 8508 [email protected]
India
Arvind Mahajan+91 22 3983 [email protected]
Russia
Roger Munnings+74 95 937 [email protected]
South Africa
Ian Kramer +27 11 647 [email protected]
United Kingdom
Jimmy Daboo+44 20 7311 [email protected]
United States, Denver
Sheri Pearce +1 303 295 [email protected]
United States, Phoenix
Samuel Fogleman+ 1 602 250 [email protected]
globa l min ing report ing sur vey 2006 | 101
For further information about KPMG’s Mining Centres of Excellence please contact:

kpmg.com
© 2006 KPMG International. KPMGInternational is a Swiss cooperative. Memberfirms of the KPMG network of independentfirms are affiliated with KPMG International.KPMG International provides no clientservices. No member firm has any authority to obligate or bind KPMG International or anyother member firm vis-à-vis third parties, nor does KPMG International have any suchauthority to obligate or bind any member firm. All rights reserved. Printed in the United Kingdom.
KPMG and the KPMG logo are registeredtrademarks of KPMG International, a Swisscooperative.
December 2006. VIC10400ENR.
The information contained herein is of a general nature and is not intended to address thecircumstances of any particular individual or entity. Although we endeavour to provide accurate andtimely information, there can be no guarantee that such information is accurate as of the date it isreceived or that it will continue to be accurate in the future. No one should act on such informationwithout appropriate professional advice after a thorough examination of the particular situation.
Related Documents