Global Management and Technology Consulting Dimensional Modelling 102 Author Nick Draper, John Campbell Presented To BearingPoint Internal Revised Date September 2008

Global Management and Technology Consulting Dimensional Modelling 102 AuthorNick Draper, John Campbell Presented ToBearingPoint Internal Revised DateSeptember.
Dec 26, 2015
Welcome message from author
This document is posted to help you gain knowledge. Please leave a comment to let me know what you think about it! Share it to your friends and learn new things together.
Transcript

Global Management and Technology Consulting
Dimensional Modelling 102
Author Nick Draper, John CampbellPresented To BearingPoint InternalRevised Date September 2008

© 2008 BearingPoint, Inc. INFORMATION MANAGEMENTInternal
Authors
This presentation was prepared by:
John Campbell, Technical ArchitectBearingPoint120 Collins StreetMelbourne AustraliaTel: +61 3 8665 9537E-mail: [email protected]
Nicholas Draper, ConsultantBearingPoint120 Collins StreetMelbourne AustraliaTel: +61 3 8665 9694E-mail: [email protected]
This document is protected under the copyright laws of the United States and other countries. This documentcontains information that is proprietary and confidential to BearingPoint, Inc., its subsidiaries, or its alliance partners, which shall not be
disclosed outside or duplicated, used, or disclosed in whole or in part for any purpose other than to evaluate BearingPoint, Inc. Any use or disclosure in whole or in part of this information without the express written permission of BearingPoint, Inc. is prohibited.
© 2005 BearingPoint, Inc. All rights reserved.

© 2008 BearingPoint, Inc. INFORMATION MANAGEMENTInternal
DIMENSIONAL MODELLING 102- CONTEXT

© 2008 BearingPoint, Inc. INFORMATION MANAGEMENTInternal
Dimensional ModellingDM 102
MetaData 101
ETL 101SQL 101
ERwin DM 202
Tool Focused – ‘How’Solution Focused
Technique Focused – ‘What’
Reference and Master Data
Data ModellingDM 101
Data Quality
Data Investigation
Relational Data Modeling
Metadata Management
CUSTOMER
CUSTOMER NUMBER
CUSTOMER NAME
CUSTOMER CITY
CUSTOMER POST
CUSTOMER ST
CUSTOMER ADDR
CUSTOMER PHONE
CUSTOMER FAX
DataCorrection
Data Standardisation
Data Matching
DataEnrichment
Information Management
Network OperationsETL SecurityMiddleware/ESB
PlatformsProcess Automation
Methodology (MIKE2)
MIKE2
InformationGovernance
Data WarehousingDW 101
Information Management Solution Packs (see imCollab) ‘Why’
Meta Data InformationGovernance
Data Warehousing
Information Management Course Context

© 2008 BearingPoint, Inc. INFORMATION MANAGEMENTInternal
DW Reference Architecture
ODS
SourceSystems
SS1 Extract, Cleanse, Transform
& Load
Web Client
SourceSystemReplicas
Metadata Repository
ManualData
Extract, Transform
and Load4
37
DDS
Source SystemMetadata
ETLMetadata
ODSMetadata
ETLMetadata
DataWarehouseMetadata
Data MartMetadata
ETLMetadata
Value Add10
DesktopClient
DataMartData
Mart
86
ManualDataEntry
Replicate/CopySS2
1
SourceSystem
Metadata
SourceSystem
MetadataAccess
Metadata
WebInfrastructure
9
ChangesChanges
SS1
SS2
Extract, Transform
and Load
2 5
Focus of this course

© 2008 BearingPoint, Inc. INFORMATION MANAGEMENTInternal
Why are we presenting this course ?
This course is being presented to BearingPoint’s TS technical personnel
To establish a base line as regards nomenclature and knowledge
To set expectations for how Data Models should be presented in client documents.
(In short – so we can all read and understand each others work.)
To establish a basic Dimensional Modelling Paradigm
To supply practical skills

© 2008 BearingPoint, Inc. INFORMATION MANAGEMENTInternal
Contents
Recap Models and Model Types
The Basics
Schema Types
─ Star schema
─ Snowflake schema
Components of a Dimensional Model
─ Facts
─ Dimensions
─ Relationships
─ Grain
Technique Thomsen Diagram
The Process
Slightly Advanced
• Date and Time, Time Variant
• Surrogate keys, Slowly Changing Dimensions
• Aggregate fact tables

© 2008 BearingPoint, Inc. INFORMATION MANAGEMENTInternal
MODELS AND MODEL TYPES

© 2008 BearingPoint, Inc. INFORMATION MANAGEMENTInternal
What is a Model ?
Definitions of ‘Model’ abound
“the act of representing something (usually on a smaller scale)”
Properties
They aren’t real
Their function is to aid communication, between users, technologists, machines
“All Models are wrong, some models are useful.”

© 2008 BearingPoint, Inc. INFORMATION MANAGEMENTInternal
Are there different types of ‘Data Models’ ?
Several levels of ‘Data Models’ are usually used and each has, as a focus, a different audience
These were covered in the Data Modelling course. All three types are applicable Dimensional modelling also, however, Logical and Physical are more prominent.
Business Users Technicians
ConceptualModel
Logical Model
Physical Model

© 2008 BearingPoint, Inc. INFORMATION MANAGEMENTInternal
THE BASICS
© 2008 BearingPoint, Inc. INFORMATION MANAGEMENTInternal
Dimensional Modelling Vs Normalisation
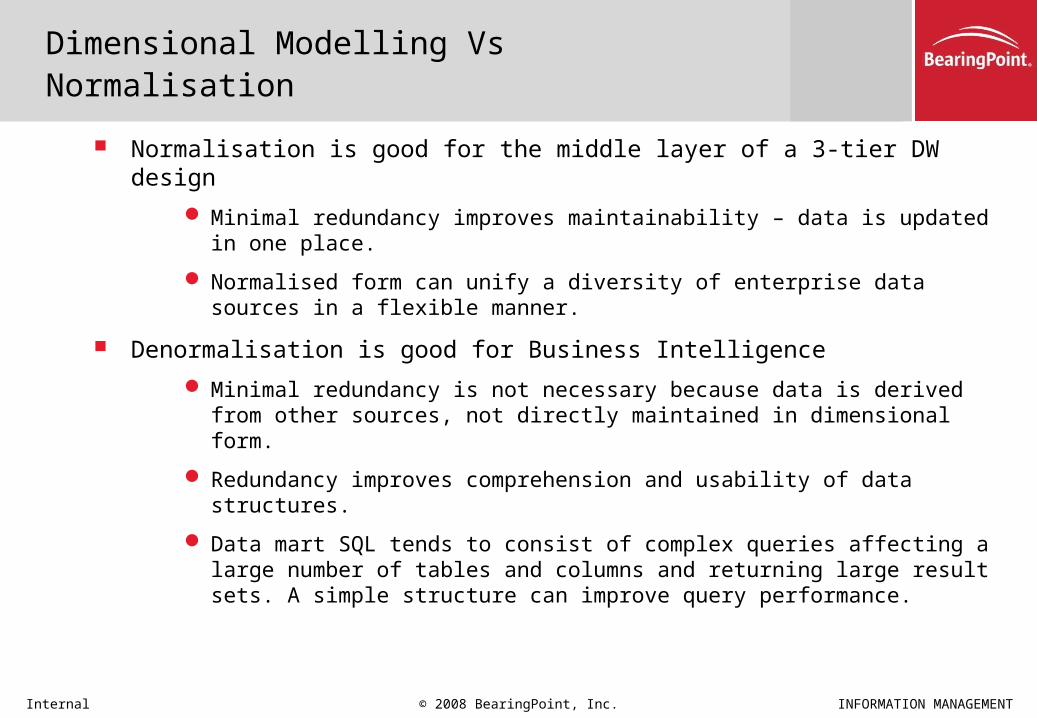
Normalisation is good for the middle layer of a 3-tier DW design
Minimal redundancy improves maintainability – data is updated in one place.
Normalised form can unify a diversity of enterprise data sources in a flexible manner.
Denormalisation is good for Business Intelligence
Minimal redundancy is not necessary because data is derived from other sources, not directly maintained in dimensional form.
Redundancy improves comprehension and usability of data structures.
Data mart SQL tends to consist of complex queries affecting a large number of tables and columns and returning large result sets. A simple structure can improve query performance.

© 2008 BearingPoint, Inc. INFORMATION MANAGEMENTInternal
Spreadsheet – Two Dimensions
Month Sales Direct Costs Indirect Costs Total Costs MarginJanuary 750 420 100 520 230February 700 500 110 610 90March 810 530 90 620 190April 820 450 130 580 240May 900 410 80 490 410June 930 630 130 760 170July 890 540 100 640 250August 740 550 110 660 80September 840 470 120 590 250October 900 520 150 670 230November 830 430 100 530 300December 900 570 90 660 240Total 10,010 6,020 1,310 7,330 2,680
The data set may be said to be arranged to have two dimensions: a row-arranged month dimension and a column-arranged measures.
Lets us start with a typical example of two-dimensional data. Anything that you track, whether it is hours per employee, costs per department, balance per customer, or complaints per store, can be arrange in a two-dimensional format.
© 2008 BearingPoint, Inc. INFORMATION MANAGEMENTInternal
Pivot Table - Three Dimensions
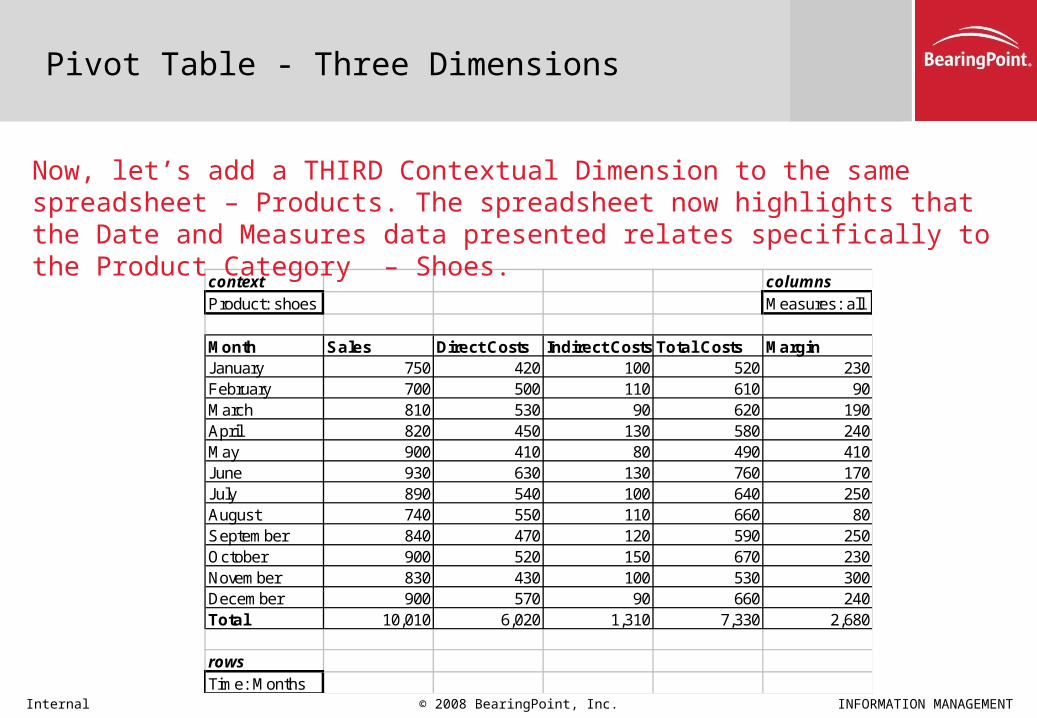
context columnsProduct: shoes Measures: all
Month Sales Direct Costs Indirect Costs Total Costs MarginJanuary 750 420 100 520 230February 700 500 110 610 90March 810 530 90 620 190April 820 450 130 580 240May 900 410 80 490 410June 930 630 130 760 170July 890 540 100 640 250August 740 550 110 660 80September 840 470 120 590 250October 900 520 150 670 230November 830 430 100 530 300December 900 570 90 660 240Total 10,010 6,020 1,310 7,330 2,680
rowsTime: Months
Now, let’s add a THIRD Contextual Dimension to the same spreadsheet – Products. The spreadsheet now highlights that the Date and Measures data presented relates specifically to the Product Category – Shoes.

© 2008 BearingPoint, Inc. INFORMATION MANAGEMENTInternal
COGNOS 8 – Analysis Studio
This kind of display can be found in many current OLAP tools.

© 2008 BearingPoint, Inc. INFORMATION MANAGEMENTInternal
SCHEMA TYPES

© 2008 BearingPoint, Inc. INFORMATION MANAGEMENTInternal
Dimensional Modelling
Based around ‘Measures’ (Fact Tables) that are constrained by ‘Dimensions’ (Dimension Tables).
Very common in Data Warehouse applications.
Can directly feed other tools such as MOLAP databases..
Tend to have a very specific focus that is easy for users to understand
Users will get confused with more than about six dimensions.
The model is easy - the ‘Fact’ is unique by ALL of the ‘Dimensions’.
Is concerned primarily with retrieval needs.
Is almost always summarised, eg using SUM or MAX and so on.
© 2008 BearingPoint, Inc. INFORMATION MANAGEMENTInternal
Star Schema
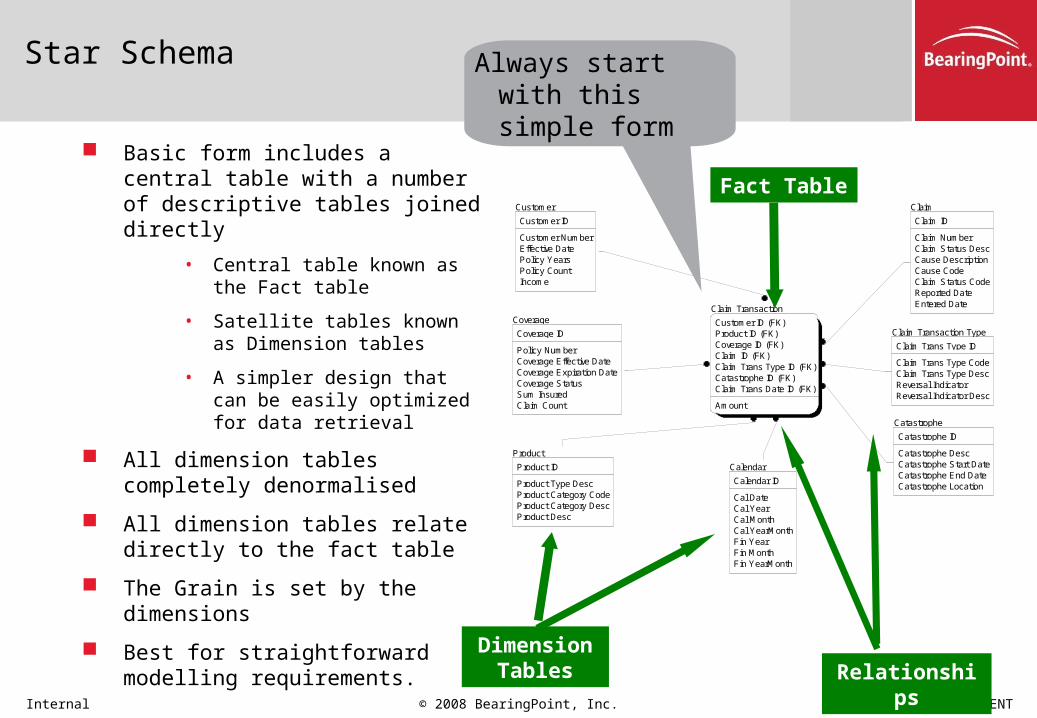
Basic form includes a central table with a number of descriptive tables joined directly
• Central table known as the Fact table
• Satellite tables known as Dimension tables
• A simpler design that can be easily optimized for data retrieval
All dimension tables completely denormalised
All dimension tables relate directly to the fact table
The Grain is set by the dimensions
Best for straightforward modelling requirements.
Claim Transaction
Customer ID (FK)Product ID (FK)Coverage ID (FK)Claim ID (FK)Claim Trans Type ID (FK)Catastrophe ID (FK)Claim Trans Date ID (FK)
Amount
Customer
Customer ID
Customer NumberEffective DatePolicy YearsPolicy CountIncome
Product
Product ID
Product Type DescProduct Category CodeProduct Category DescProduct Desc
Coverage
Coverage ID
Policy NumberCoverage Effective DateCoverage Expiration DateCoverage StatusSum InsuredClaim Count
Claim
Claim ID
Claim NumberClaim Status DescCause DescriptionCause CodeClaim Status CodeReported DateEntered Date
Claim Transaction Type
Claim Trans Type ID
Claim Trans Type CodeClaim Trans Type DescReversal IndicatorReversal Indicator Desc
Catastrophe
Catastrophe ID
Catastrophe DescCatastrophe Start DateCatastrophe End DateCatastrophe Location
Calendar
Calendar ID
Cal DateCal YearCal MonthCal YearMonthFin YearFin MonthFin YearMonth
Dimension Tables
Fact Table
Relationships
Always start with this simple form

© 2008 BearingPoint, Inc. INFORMATION MANAGEMENTInternal
Snow Flake Schema
Described as a variant option
One or more dimension tables are not completely denormalised
Some data represented in a snowflake or outrigger table
Benefits
─ Useful for complex modelling situations, such as dynamic hierarchies, or shared dimensions
Drawbacks
─ More navigation needed and it can get complicated quickly
Avoid unless requirements demand it
Claim Transaction
Customer ID (FK)Product ID (FK)Coverage ID (FK)Claim ID (FK)Claim Trans Type ID (FK)Catastrophe ID (FK)Claim Trans Date ID (FK)
Amount
Customer
Customer ID
Customer NumberEffective DatePolicy YearsPolicy CountIncome
Product
Product ID
Product Type DescProduct Category Code (FK)Product Desc
Coverage
Coverage ID
Policy NumberCoverage Effective DateCoverage Expiration DateCoverage StatusSum InsuredClaim Count
Claim
Claim ID
Claim NumberClaim Status DescCause DescriptionCause CodeClaim Status CodeReported DateEntered Date
Claim Transaction Type
Claim Trans Type ID
Claim Trans Type CodeClaim Trans Type DescReversal IndicatorReversal Indicator Desc
Catastrophe
Catastrophe ID
Catastrophe DescCatastrophe Start DateCatastrophe End DateCatastrophe Location
Calendar
Calendar ID
Cal DateCal YearCal MonthCal YearMonthFin YearFin MonthFin YearMonth
Product Category
Product Category Code
Product Category Desc

© 2008 BearingPoint, Inc. INFORMATION MANAGEMENTInternal
COMPONENTS OF A DIMENSIONAL MODEL

© 2008 BearingPoint, Inc. INFORMATION MANAGEMENTInternal
Components of a Dimensional Model
─ Fact Tables
─ Dimensional Tables
─ Relationships
─ Grain
Claim Transaction
Customer ID (FK)Product ID (FK)Coverage ID (FK)Claim ID (FK)Claim Trans Type ID (FK)Catastrophe ID (FK)Claim Trans Date ID (FK)
Amount
Customer
Customer ID
Customer NumberEffective DatePolicy YearsPolicy CountIncome
Product
Product ID
Product Type DescProduct Category CodeProduct Category DescProduct Desc
Coverage
Coverage ID
Policy NumberCoverage Effective DateCoverage Expiration DateCoverage StatusSum InsuredClaim Count
Claim
Claim ID
Claim NumberClaim Status DescCause DescriptionCause CodeClaim Status CodeReported DateEntered Date
Claim Transaction Type
Claim Trans Type ID
Claim Trans Type CodeClaim Trans Type DescReversal IndicatorReversal Indicator Desc
Catastrophe
Catastrophe ID
Catastrophe DescCatastrophe Start DateCatastrophe End DateCatastrophe Location
Calendar
Calendar ID
Cal DateCal YearCal MonthCal YearMonthFin YearFin MonthFin YearMonth
Fact Table
DimensionTables
Relationships

© 2008 BearingPoint, Inc. INFORMATION MANAGEMENTInternal
Components of a Dimensional Model - FACT Tables
Contain measures─ Usually numeric, measures quantify the business
Most useful measures are additive─ Additive measures can be meaningfully added across rows
Row population is sparse─ A row exists only where there are non-zero measures
Fact tables are not denormalised
Examples:
─ Sales
─ Counts
─ Percentage

© 2008 BearingPoint, Inc. INFORMATION MANAGEMENTInternal
Components of a Dimensional Model - DIMENSION Tables
Purpose of a Dimension – To Add Context to the Fact
Contain attributes─ Usually textual, attributes describe the business
Attributes are used for filtering and grouping
Dimension tables are typically denormalised─ Increases comprehension─ Facilitates browsing
Have unique primary keys to identify every row
Example Dimensions
─ Date
─ Product
© 2008 BearingPoint, Inc. INFORMATION MANAGEMENTInternal
Components of a Dimensional Model - RELATIONSHIPS
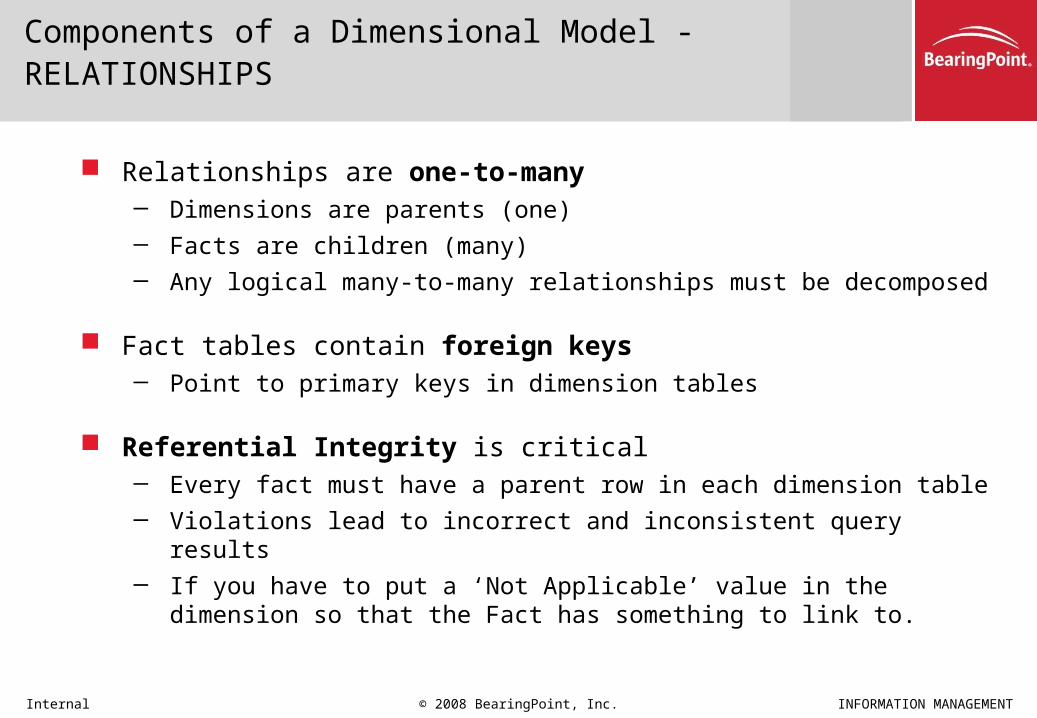
Relationships are one-to-many─ Dimensions are parents (one)─ Facts are children (many)─ Any logical many-to-many relationships must be decomposed
Fact tables contain foreign keys ─ Point to primary keys in dimension tables
Referential Integrity is critical─ Every fact must have a parent row in each dimension table─ Violations lead to incorrect and inconsistent query results─ If you have to put a ‘Not Applicable’ value in the dimension so that
the Fact has something to link to.

© 2008 BearingPoint, Inc. INFORMATION MANAGEMENTInternal
Components of a Dimensional Model - GRAIN
‘Grain’ is the fundamental atomic level of data to be represented in the fact table.
Business analysis discovers the level at which the data needs to be represented
Fact grain is determined─ Transaction is the finest grain─ Data is aggregated if transaction grain is not needed
Dimension grain is matched to fact grain
Fine grains have performance implications – hardware must be adequate to handle the load

© 2008 BearingPoint, Inc. INFORMATION MANAGEMENTInternal
Components of a Dimensional Model - RECAP
Each Fact, (A ‘Claim Transaction. Amount’) is defined by ONE Customer, ONE Claim, ONE Claim Transaction Type, ONE Catastrophe, ONE Calendar (date), ONE Product, ONE Coverage.
Other than the Claim Transaction all entities are Dimensions’
Grain here is at the transaction level – each ‘claim’. Without this we would have to, say, total the amounts across all claims for the one day.
Claim Transaction
Customer ID (FK)Product ID (FK)Coverage ID (FK)Claim ID (FK)Claim Trans Type ID (FK)Catastrophe ID (FK)Claim Trans Date ID (FK)
Amount
Customer
Customer ID
Customer NumberEffective DatePolicy YearsPolicy CountIncome
Product
Product ID
Product Type DescProduct Category CodeProduct Category DescProduct Desc
Coverage
Coverage ID
Policy NumberCoverage Effective DateCoverage Expiration DateCoverage StatusSum InsuredClaim Count
Claim
Claim ID
Claim NumberClaim Status DescCause DescriptionCause CodeClaim Status CodeReported DateEntered Date
Claim Transaction Type
Claim Trans Type ID
Claim Trans Type CodeClaim Trans Type DescReversal IndicatorReversal Indicator Desc
Catastrophe
Catastrophe ID
Catastrophe DescCatastrophe Start DateCatastrophe End DateCatastrophe Location
Calendar
Calendar ID
Cal DateCal YearCal MonthCal YearMonthFin YearFin MonthFin YearMonth

© 2008 BearingPoint, Inc. INFORMATION MANAGEMENTInternal
Components of a Dimensional Model - RECAP
With this model we can ‘drill down’ to the most granular fact level (one customer, one claim etc etc
OR by discounting one or more dimensions we can aggregate up to, say, a whole day or across all claims of a certain type
Claim Transaction
Customer ID (FK)Product ID (FK)Coverage ID (FK)Claim ID (FK)Claim Trans Type ID (FK)Catastrophe ID (FK)Claim Trans Date ID (FK)
Amount
Customer
Customer ID
Customer NumberEffective DatePolicy YearsPolicy CountIncome
Product
Product ID
Product Type DescProduct Category CodeProduct Category DescProduct Desc
Coverage
Coverage ID
Policy NumberCoverage Effective DateCoverage Expiration DateCoverage StatusSum InsuredClaim Count
Claim
Claim ID
Claim NumberClaim Status DescCause DescriptionCause CodeClaim Status CodeReported DateEntered Date
Claim Transaction Type
Claim Trans Type ID
Claim Trans Type CodeClaim Trans Type DescReversal IndicatorReversal Indicator Desc
Catastrophe
Catastrophe ID
Catastrophe DescCatastrophe Start DateCatastrophe End DateCatastrophe Location
Calendar
Calendar ID
Cal DateCal YearCal MonthCal YearMonthFin YearFin MonthFin YearMonth

© 2008 BearingPoint, Inc. INFORMATION MANAGEMENTInternal
TECHNIQUE: THOMSEN DIAGRAM
© 2008 BearingPoint, Inc. INFORMATION MANAGEMENTInternal
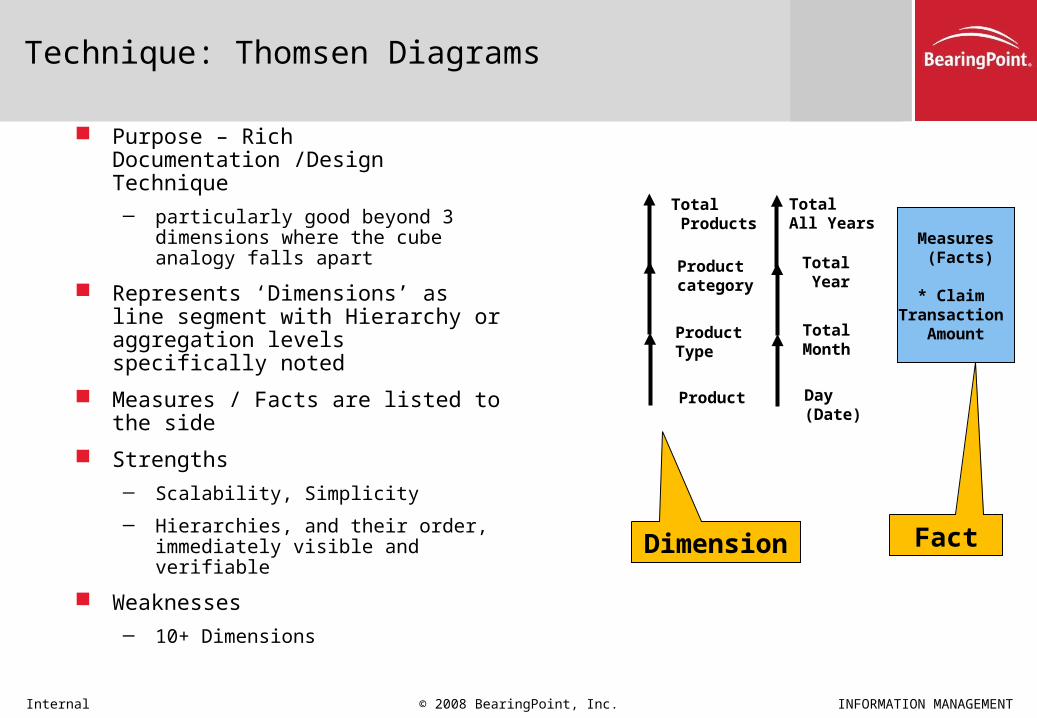
Technique: Thomsen Diagrams
Purpose – Rich Documentation /Design Technique
─ particularly good beyond 3 dimensions where the cube analogy falls apart
Represents ‘Dimensions’ as line segment with Hierarchy or aggregation levels specifically noted
Measures / Facts are listed to the side
Strengths
─ Scalability, Simplicity
─ Hierarchies, and their order, immediately visible and verifiable
Weaknesses
─ 10+ Dimensions
Dimension
Measures (Facts)
* Claim Transaction
Amount
Product
ProductType
Total Products
Total Month
Day(Date)
TotalAll Years
Total Year
Fact
Productcategory

© 2008 BearingPoint, Inc. INFORMATION MANAGEMENTInternal
PROCESS

© 2008 BearingPoint, Inc. INFORMATION MANAGEMENTInternal
Inputs to Dimensional Modelling
Requirements documents
Source data models / database schemas
Metadata / data dictionary
Existing reports / analysis models
Consultation with business users
Consultation with technical users
© 2008 BearingPoint, Inc. INFORMATION MANAGEMENTInternal
Outputs of Dimensional Modelling
Logical data model
Physical data model
Source-target mapping
Validated business rules / transformations

© 2008 BearingPoint, Inc. INFORMATION MANAGEMENTInternal
Dimensional Modelling Steps
1. Understanding the Business Problem
2. Choose the Dimensions
3. Choose the Grain of the Fact Table
4. Choose the Measured Facts
5. Choose the Dimension Attributes
6. Deriving the Physical Model from Logical
© 2008 BearingPoint, Inc. INFORMATION MANAGEMENTInternal
Modelling Steps Example
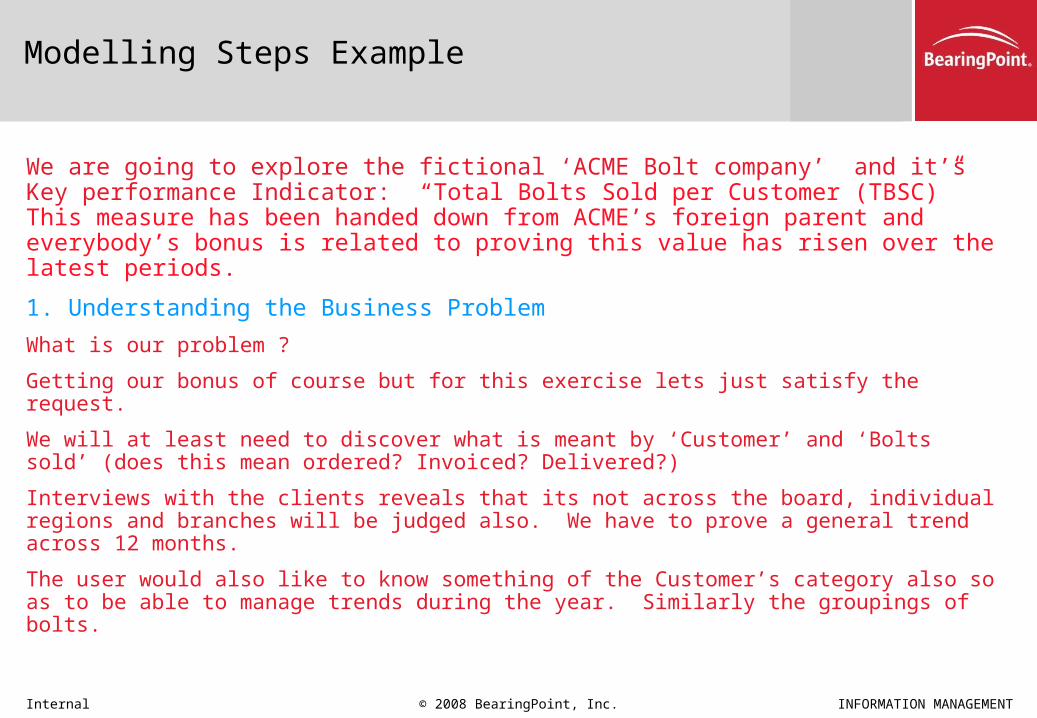
We are going to explore the fictional ‘ACME Bolt company’ and it’s Key performance Indicator: “Total Bolts Sold per Customer (TBSC)” This measure has been handed down from ACME’s foreign parent and everybody’s bonus is related to proving this value has risen over the latest periods.
1. Understanding the Business Problem
What is our problem ?
Getting our bonus of course but for this exercise lets just satisfy the request.
We will at least need to discover what is meant by ‘Customer’ and ‘Bolts sold’ (does this mean ordered? Invoiced? Delivered?)
Interviews with the clients reveals that its not across the board, individual regions and branches will be judged also. We have to prove a general trend across 12 months.
The user would also like to know something of the Customer’s category also so as to be able to manage trends during the year. Similarly the groupings of bolts.

© 2008 BearingPoint, Inc. INFORMATION MANAGEMENTInternal
Modelling Steps Example (Cont)
2. Choose the Dimensions
These are readily apparent if using the Thomsen Diagram.
If not then these will need to be deduced from the Problem definition in step one.
Draw a small data model with the measure / fact in the centre and the other concepts around this – including an entity for each aggregation level.
A Star schema would collapse (denormalise) all these levels.

© 2008 BearingPoint, Inc. INFORMATION MANAGEMENTInternal
Modelling Steps Example (Cont)
3. Choose the Grain of the Fact Table
4. Choose the Measured Facts These steps go hand in hand. In our example just one fact has been requested
– Number (count) of bolts sold. In the real world this may also include ‘profit’ but anything included has to be constrained by the exact same dimensions.
The Grain may be determined by the request in this case total bolts per day per customer per product per store
Sometimes extra detail is included eg choose ‘day’ even if only month has been asked for.
• Extra detail is more flexible for the future but costs more today to load and summarise
Sometimes the detail requested cannot be stored – whilst we aim for Transaction level some clients have hundreds of millions of low level transactions which it is just not economical to replicate and manage.
• Losing detail sacrifices flexibility but can reduce cost.

© 2008 BearingPoint, Inc. INFORMATION MANAGEMENTInternal
Modelling Steps Example (Cont)
5. Choose the Dimension Attributes
Dimension attributes describe the business. They are used to filter and group in reports and queries.
Choose to decode any codes eg don’t just take a ‘region code’ – decode it as well and take ‘Region Name’ – these will become user selectable items.
Character fields are almost always attributes.
Err on the side of including too many attributes from the source data – the performance penalty is negligible and it is simple to hide any attributes which are later found to be useless.
© 2008 BearingPoint, Inc. INFORMATION MANAGEMENTInternal
Modelling Steps Exercise
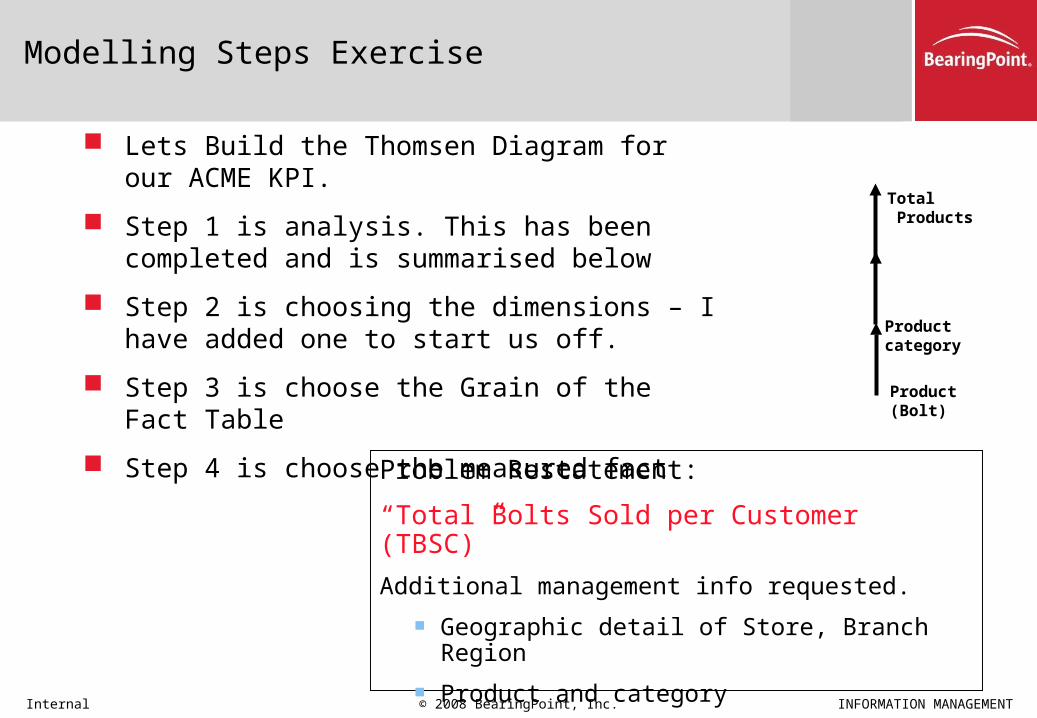
Lets Build the Thomsen Diagram for our ACME KPI.
Step 1 is analysis. This has been completed and is summarised below
Step 2 is choosing the dimensions – I have added one to start us off.
Step 3 is choose the Grain of the Fact Table
Step 4 is choose the measured fact
Product(Bolt)
Productcategory
Total Products
Problem Restatement:
“Total Bolts Sold per Customer (TBSC)”
Additional management info requested.
Geographic detail of Store, Branch Region
Product and category
Customer and the customer category hierarchy

© 2008 BearingPoint, Inc. INFORMATION MANAGEMENTInternal
Modelling Steps Exercise
─ Here is a finished version
─ As discussed it can also confirm that Branch is within Region (not the other way around)
Dimension
Measures (Facts)
* Bolts sold
Product(Bolt)Customer
Customer Sub Category
Productcategory
Total Products
Customer Category
Total AllCustomers
Store
Branch
Region
Total AllAreas
Total Month
Day(Date)
TotalAll Years
Total Year

© 2008 BearingPoint, Inc. INFORMATION MANAGEMENTInternal
Exercise Star Model
From the Thomsen Diagram we can create a data model…
groupsgroups
groups
groups
Bolts Sold Fact
Product Code (FK)Date (FK)Store Code (FK)Customer Number (FK)
Bolts Sold Quantity
Calendar
Date
MonthYearDay Name
Geography
Store Code
Store NameBranch CodeBranch NameRegion CodeRegion Name
Customer
Customer Number
Customer NameCustomer Sub Category CodeCustomer Sub Category DescriptionCustoemer Category CodeCustomer Category Description
Product
Product Code
Product DescriptionProduct Category CodeProduct Categort Description
Because this is a star schema (i.e. totally denormalised) you can see how we cannot tell whether Branch or Region is higher.
Remember the purpose of the model is communication
(p.s. I know it not the purest data model)

© 2008 BearingPoint, Inc. INFORMATION MANAGEMENTInternal
SLIGHTLY ADVANCED

© 2008 BearingPoint, Inc. INFORMATION MANAGEMENTInternal
Slightly Advanced Topics
Date and Time
Time Variant
Surrogate keys
Hierarchies
Aggregate fact tables

© 2008 BearingPoint, Inc. INFORMATION MANAGEMENTInternal
Date and Time
Don’t confuse the two!
You will meet many situations where it is stated that a dimension is ‘time’. Almost universally this is actually date.
Date and Time are ‘static’ reference dimensions and should be populated in advance – usually as part of initial build.
The DAK Data standards document has a sample schema for Calendar which includes extra data columns for ‘is last day of month’ etc. These can make later queries much easier. Sample spreadsheets to load also exist.
Do not be temped to combine into one dimension
─ At the grain of Date there would be 3650 rows to represent 10 years.
─ At the grain of Minute there are 1440 minutes in a day – so 1440 rows needed
─ Combined this would need 5,256,000 rows to represent all the minutes for 10 years.

© 2008 BearingPoint, Inc. INFORMATION MANAGEMENTInternal
Time Variant
Time Variance: “A characteristic of a data warehouse that defines the moment in time that the data or variant of the data is valid. If Order No. 123 has a value of $1,500.00 on Dec 1 and $1,700 on Dec 10, Dec 1 and Dec 10 shows us the time variance of Order No. 123.”
Many operational source systems only record one item of information and if that changes the new value is simply replaced. E.g. if you move house your doctor or movie rental company really doesn’t care where you used to live.
For big organisations this is sometimes overcome by using a separate data warehouse where each change is noted by boundary dates. I.e. a start and end date.
Adding these is not simple as it can subtly changes the overall granularity – if dates (not times) are used then only one fact value is possible per day. You now have to be extremely clear about what value is to be used. The last of the day? The maximum of the day?

© 2008 BearingPoint, Inc. INFORMATION MANAGEMENTInternal
Natural and Surrogate Keys
Natural keys are the values usually referred to by people as the identifiers of entities (customer number, claim number, etc.).
─ They are often the primary keys in source systems.
─ As a general rule they should not be used in a warehouse - but they might be in a dimensional model directly off a single source system.
─ The problem is what happens when a second data source populates the dimension? Now the jumble of numbers means nothing and in fact the same identifier could be used in different systems to refer to different things.

© 2008 BearingPoint, Inc. INFORMATION MANAGEMENTInternal
Natural and Surrogate Keys
A surrogate is something used ‘instead of’. A surrogate is an artificial, numeric, key generated from a pool of numbers inside the warehouse.
─ Use these as Primary Keys for Dimensions.
─ Will facilitate efficient Fact to Dimension joins
─ Support Slowly changing dimension (next slide)
If using surrogates then bring in the source system natural key along with another field to say which source system this value came from – i.e. put the context back.

© 2008 BearingPoint, Inc. INFORMATION MANAGEMENTInternal
Hierarchies
Hierarchies are pervasive in the vast majority of organisations.
Hierarchies are quite disorganised in the vast majority of organisations.
─ Multiple independent hierarchies often needed
Hierarchies within the dimensions are very important
─ Within the proper tool they enable “drill up/ drill down”
─ e.g. day, week, month, quarter, year
─ e.g. Product, Product Category, Total Products
Details usually need to be explicitly stored.
─ E.g. Decode all codes.
Product(Bolt)
Productcategory
Total Products

© 2008 BearingPoint, Inc. INFORMATION MANAGEMENTInternal
Hierarchies – Simple, Static Hierarchies
Simple, static hierarchies are best designed directly into the dimensions.
This is what was meant when we said we ‘de-normalised’ for a Star Schema
Easiest to use
Most efficient to query
e.g. Product, Product Category, Total Products
Example: Geography (Store, Branch, Region, [State, Country])
Product(Bolt)
Productcategory
Total Products

© 2008 BearingPoint, Inc. INFORMATION MANAGEMENTInternal
Hierarchies – Complex And/Or Dynamic Hierarchies
If hierarchies are complex, if there are multiple hierarchies on a dimension or if the hierarchy changes often, it could be messy to design the hierarchy into the dimension.
Snowflake the dimension, creating one or more outboard hierarchy tables.
Changes to hierarchies do not affect the base dimension.
Multiple hierarchies can be represented with multiple tables or with a hierarchy ID column which must be filtered on in any query.

© 2008 BearingPoint, Inc. INFORMATION MANAGEMENTInternal
Hierarchies – Example
Below is a common situation, caused where different ‘departments’ view the summarised data differently.
In this case it is Critical that it is the SAME fact with the same granularity – in this case Store.
It is just the summaries beyond ‘Store’ that differ.
Watch for the the same item being used in different contexts e.g. Region in this example is NOT the same thing.
Measures (Facts)
* Bolts sold
Store
Branch
Region
Total AllAreas
DistributionNode
Warehouse
Total AllWarehouses
Region
groups
summarises
summarises
Bolts Sold Fact
Date (FK)Product Identif ier (FK)Geography Identif ier (FK)Customer Identif ier (FK)
Bolts Sold Quantity
Geography
Geography Identif ier
Store CodeStore NameDistribution Identif ier (FK)Geography Mgt Identif ier (FK)
Distribution Hierarchy
Distribution Identif ier
Distribution Node CodeDistribution Node NameWarehouse CodeWarehouse NameDistrubution Region CodeDistrubution Region Name
Geography Managment Hierarchy
Geography Mgt Identif ier
Branch CodeBranch NameManagement Region CodeManagement Region Name

© 2008 BearingPoint, Inc. INFORMATION MANAGEMENTInternal
Aggregate Fact Tables
Fact tables are very large
Aggregates (pre-stored summaries) are the most effective way of improving data warehouse performance
An aggregate is a fact table records representing a summarisation of base level fact table records.
Can be Explicitly Designed and managed or many DBMS now have inbuilt Aggregations available.
Aggregate awareness – DBMS implicit and OLAP tool explicit
Each grain of aggregate should occupy its own fact table, and be supported by appropriate category dimension tables
─ What will that do to the number of tables? Can be an exponential blow out.
─ Complexity from end-users point of view? They can be forced to remember what summaries exist and what they are called.

© 2008 BearingPoint, Inc. INFORMATION MANAGEMENTInternal
Revised Star Model
This is our data model revised to use surrogate keys, some time variance and one split hierarchy.
groups
groups
groupsgroups
summarises
summarises
Bolts Sold Fact
Date (FK)Product Identif ier (FK)Geography Identif ier (FK)Customer Identif ier (FK)
Bolts Sold Quantity
Calendar
Date
MonthYearDay Name
Geography
Geography Identif ier
Store CodeStore NameDistribution Identif ier (FK)Geography Mgt Identif ier (FK) Customer
Customer Identif ier
Customer Number (AK1.1)Start Date (AK1.2)End DateCustomer NameCustomer Sub Category CodeCustomer Sub Category DescriptionCustoemer Category CodeCustomer Category Description
Product
Product Identif ier
Product Code (AK1.1)Start Date (AK1.2)End DateProduct DescriptionProduct Category CodeProduct Categort Description
Distribution Hierarchy
Distribution Identif ier
Distribution Node CodeDistribution Node NameWarehouse CodeWarehouse NameDistrubution Region CodeDistrubution Region Name
Geography Managment Hierarchy
Geography Mgt Identif ier
Branch CodeBranch NameManagement Region CodeManagement Region Name

© 2008 BearingPoint, Inc. INFORMATION MANAGEMENTInternal
QUESTIONS

© 2008 BearingPoint, Inc. INFORMATION MANAGEMENTInternal
Related Documents