North American Branch 40 West 20th Street New York, NY 10011-4211, USA PROOFREADING INSTRUCTIONS Tel: (212) 337-5980 Fax : (212) 337-5959 E-mail: [email protected] Dear Journal Article Contributor: Attached is a PDF file of your article scheduled to be published in: Visual Neuroscience Please follow these procedures: 1. Proofread your article carefully. This will be your final reading before publication. Check especially the spellings of names and places as well as the accuracy of dates and numbers. 2. Please answer all queries that appear on a separate page. If the query involves a reference entry, please make the corrections as complete as possible. To obtain an online link, the complete information including correct spelling of author names, titles, publisher, and city of publication, page range, and so forth are needed. 3. Figures: Review the figure reproductions on the page proofs to see if important features have been well represented. If something seems out of order, indicate this in a cover letter. Should it be necessary that new electronic copy of the figures or text will have to be provided, please include a cover letter as well, explaining the errant features and which graphics application is being used. 4. Please respond with an e-mail message, identifying the correction by page number, column, and line. Changes in the text are limited to typographical and factual errors. Rewriting or other stylistic changes are not permitted. Contributors may be charged for excessive author alterations, and publication of your article may be delayed. 5. Complete and return the attached Offprint Order Form to the address noted on the form. The printers must receive this form before the journal is printed for you to receive 25 free offprints and any additional quantity of offprints you might want to purchase. 6. Please e-mail the corrections to the proofs within 3 days of receipt. Corrections can also be sent by fax to (212) 337-5959. 7. Please note that failure to return your proofs in a timely fashion may delay publication of your article or may require publication without your corrections. Thank you for your prompt attention to these proofs. If you have any questions, please feel free to contact Steven Price at (212) 337-5980, or by e-mail: [email protected], or send a fax to (212) 337-5959. Thanks. Best Regards, Steven Price, Production Editor

Welcome message from author
This document is posted to help you gain knowledge. Please leave a comment to let me know what you think about it! Share it to your friends and learn new things together.
Transcript

North American Branch 40 West 20th Street New York, NY 10011-4211, USA
PROOFREADING INSTRUCTIONS Tel: (212) 337-5980 Fax : (212) 337-5959 E-mail: [email protected] Dear Journal Article Contributor: Attached is a PDF file of your article scheduled to be published in: Visual Neuroscience Please follow these procedures: 1. Proofread your article carefully. This will be your final reading before publication. Check especially the
spellings of names and places as well as the accuracy of dates and numbers. 2. Please answer all queries that appear on a separate page. If the query involves a reference entry, please make
the corrections as complete as possible. To obtain an online link, the complete information including correct spelling of author names, titles, publisher, and city of publication, page range, and so forth are needed.
3. Figures: Review the figure reproductions on the page proofs to see if important features have been well
represented. If something seems out of order, indicate this in a cover letter. Should it be necessary that new electronic copy of the figures or text will have to be provided, please include a cover letter as well, explaining the errant features and which graphics application is being used.
4. Please respond with an e-mail message, identifying the correction by page number, column, and line. Changes
in the text are limited to typographical and factual errors. Rewriting or other stylistic changes are not permitted. Contributors may be charged for excessive author alterations, and publication of your article may be delayed.
5. Complete and return the attached Offprint Order Form to the address noted on the form. The printers must
receive this form before the journal is printed for you to receive 25 free offprints and any additional quantity of offprints you might want to purchase.
6. Please e-mail the corrections to the proofs within 3 days of receipt. Corrections can also be sent by fax to
(212) 337-5959. 7. Please note that failure to return your proofs in a timely fashion may delay publication of your article or may
require publication without your corrections. Thank you for your prompt attention to these proofs. If you have any questions, please feel free to contact Steven Price at (212) 337-5980, or by e-mail: [email protected], or send a fax to (212) 337-5959. Thanks.
Best Regards, Steven Price, Production Editor

OFFPRINT ORDER FORMVisual NeuroscienceVol.: ______ No.: ________
Author: ______________________________________________________________________
Article Title: __________________________________________________________________
Important instructions:1. Journal contributors must complete this Offprint Order Form and return it to Cambridge in order toreceive your free offprints. For each article published, 25 free offprints will be mailed to the addressindicated below.
2. Please also use this form if you wish to purchase additional offprints or copies of the issue containingyour contribution (at contributor's discount).
3. For co-authored articles, please note that this form is being sent only to the author receiving pageproofs. Accordingly, please be sure that all co-authors' offprint orders are included on this form.
4. Please return this form within 4 days from the date you return the corrected page proofs. Your ordermust be received before the printing of the journal to qualify for the prices listed. There is a 50%surcharge for late orders. Return to:
Journals Offprint CoordinatorVisual Neuroscience
Cambridge University Press40 West 20th Street
New York, NY 10011-4211, USA
5. Orders for additional offprints must be prepaid by check, credit card, or accompanied by aninstitutional purchase order. Payment must be in US dollars or Canadian dollar equivalent.
6. Canadian customers must add 7% GST.
7. Surface shipment outside North America may take 12 weeks to reachits destination.
******************************************************************************************PAYMENT Total amount: $___________ PRICE LIST (in US dollars, incl. surface delivery)
[__] Check enclosed Number of Additional Paid Offprints No. of ----------------------------------------[__] Purchase order enclosed pages 25 50 100 150 200 add'l 50s ------------------------------------------------[__] MasterCard [__] Visa 1-8 $79. $118. $156. $195. $235. $31. 9-16 94. 141. 188. 235. 281. 39.___________________________ ________ 17-24 110. 164. 226. 274. 329. 55.Card No. Exp.Date 25-32 125. 188. 259. 313. 375. 63. add'l______________________________________ 8 pp. 17. 24. 31. 39. 48. 9.Signature For Air Delivery, add 25% to price. Color plates extra.******************************************************************************************ORDER HERE MAIL TO: [___] Air Delivery (add 25%)
______ Number of offprints Name __________________________________________________======================================__ __ _ Free copy of issue Address________________________________________________
______ Additional issues @ $12.50 _______________________________________________________
______ TOTAL copies of issue City _________________________ State _____ Zip ______
******************************************************************************************
Global integration of local color differences in transparencyperception: An fMRI study
MICHEL DOJAT,1 LOYS PIETTRE,1 CHANTAL DELON-MARTIN,1
MATHILDE PACHOT-CLOUARD,1 CHRISTOPH SEGEBARTH,1 and KENNETH KNOBLAUCH2
1Unité mixte Inserm0UJF U594, Neuroimagerie Fonctionnelle et Métabolique, LRC CEA 30V, Grenoble, France2Inserm, U371, Cerveau et Vision, Department of Cognitive Neurosciences, Bron, France3Université Claude Bernard Lyon 1, Lyon, France
(Received December 21, 2005; Accepted December 28, 2005!
Abstract
In normal viewing, the visual system effortlessly assigns approximately constant attributes of color and shape toperceived objects. A fundamental component of this process is the compensation for illuminant variations andintervening media to recover reflectance properties of natural surfaces. We exploited the phenomenon oftransparency perception to explore what cortical regions are implicated in such processes, using fMRI. Bymanipulating the coherence of local color differences around a region in an image, we interfered with their globalperceptual integration and thereby modified whether the region appeared transparent or not. We found the majorcortical activation due to global integration of local color differences to be in the anterior part of theparahippocampal gyrus. Regions differentially activated by chromatic versus achromatic geometric patterns showedno significant differential response related to the coherence0incoherence of local color differences. The results linkthe integration of local color differences in the extraction of a transparent layer with sites activated by object-relatedproperties of an image.
Keywords: Color vision, Transparency, Color scission, fMRI, Human vision
Introduction
Discounting an intervening medium to recover attributes of theworld is a general and powerful ability of the visual system thatrenders it particularly robust in surface perception and objectrecognition in a way that current machine vision systems are not~Adelson, 2000!. Numerous examples can be cited, such as seeingthrough shadow or illuminant changes ~D’Zmura et al., 2000! andgradients and seeing objects through screens or turgid and noisymedia, such as fog, a dirty window or a poor video image~Hagedorn & D’Zmura, 2000!. Little is actually known about themechanisms and the sites in the brain that perform these tasks. Thephenomenon of transparency provides an interesting model forstudying such processes.
Because several stimulus cues can evoke a transparent percept,for example arising from motion ~Adelson & Movshon, 1982;Wallach, 1976! or lightness relations across junctions at surfaceboundaries ~Adelson, 1993; Anderson, 1997; Kersten, 1991; Me-telli, 1974!, it has recently been demonstrated that local changes incolor across a region that follow certain rules of coherence suffice
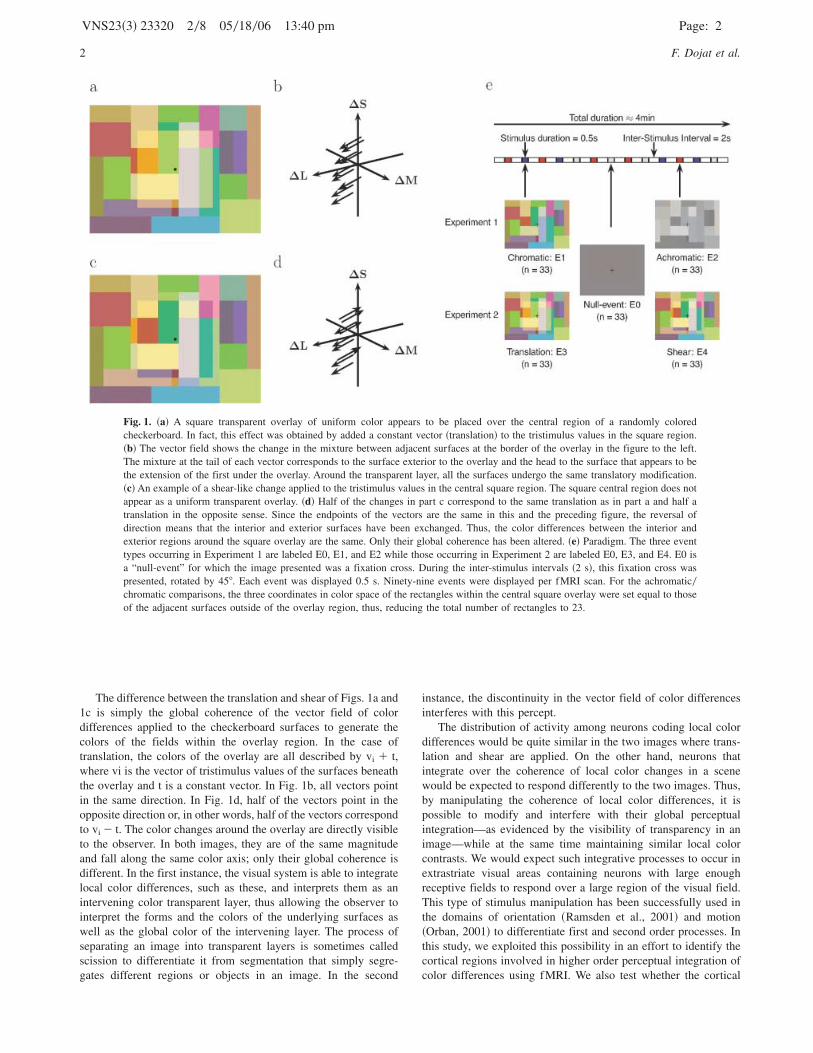
to produce the appearance of color transparency ~D’Zmura et al.,1997; Faul & Ekroll, 2002; Khang & Zaidi, 2002!. For example,Fig. 1a shows an image of 33 rectangles which, appear to becomposed of 23 rectangles with a square transparent overlaypartially covering the 10 rectangles in the center. The figure wasgenerated in two steps. First, random tristimulus values wereassigned to the 23 rectangles of a base image. Then, in the squareregion in the center of the image, a constant vector was added tothe tristimulus values of each pixel. This translation of tristimulusvalues results in the central region appearing as a transparentoverlay. The changes in tristimulus values between the outer andinner fields bordering the overlay region are indicated as vectors inFig. 1b in a cone modulation space.
Not all translations appear as transparent, however, ~Chen &D’Zmura, 1998; Faul & Ekroll, 2002! nor does transparency ariseonly from translations ~D’Zmura et al., 1997; Faul & Ekroll,2002!. Convergences also typically appear transparent. Some othersystematic color changes do not lead to the appearance of trans-parency. Fig. 1c was generated by reversing the direction ofthe translation for alternate surfaces. Half of the surfaces from theinterior of the overlay region of Fig. 1a are distributed in theexterior and vice versa. Now the central overlap does not looktransparent. The changes in tristimulus values between the outerand inner fields bordering the overlay region are indicated inFig. 1d and are like a shear.
Address corresponding and reprint requests to: Kenneth Knoblauch,Inserm Unité 371, Cerveau et Vision, 18 avenue du Doyen Lépine, 69500Bron, France. E-mail: [email protected]
VNS23~3! 23320 108 05018006 13:40 pm log no. VNS23320Visual Neuroscience ~2006!, 23, 1–8. Printed in the USA.Copyright © 2006 Cambridge University Press 0952-5238006 $16.00DOI: 10.10170S0952523806233200
1
The difference between the translation and shear of Figs. 1a and1c is simply the global coherence of the vector field of colordifferences applied to the checkerboard surfaces to generate thecolors of the fields within the overlay region. In the case oftranslation, the colors of the overlay are all described by vi � t,where vi is the vector of tristimulus values of the surfaces beneaththe overlay and t is a constant vector. In Fig. 1b, all vectors pointin the same direction. In Fig. 1d, half of the vectors point in theopposite direction or, in other words, half of the vectors correspondto vi � t. The color changes around the overlay are directly visibleto the observer. In both images, they are of the same magnitudeand fall along the same color axis; only their global coherence isdifferent. In the first instance, the visual system is able to integratelocal color differences, such as these, and interprets them as anintervening color transparent layer, thus allowing the observer tointerpret the forms and the colors of the underlying surfaces aswell as the global color of the intervening layer. The process ofseparating an image into transparent layers is sometimes calledscission to differentiate it from segmentation that simply segre-gates different regions or objects in an image. In the second
instance, the discontinuity in the vector field of color differencesinterferes with this percept.
The distribution of activity among neurons coding local colordifferences would be quite similar in the two images where trans-lation and shear are applied. On the other hand, neurons thatintegrate over the coherence of local color changes in a scenewould be expected to respond differently to the two images. Thus,by manipulating the coherence of local color differences, it ispossible to modify and interfere with their global perceptualintegration—as evidenced by the visibility of transparency in animage—while at the same time maintaining similar local colorcontrasts. We would expect such integrative processes to occur inextrastriate visual areas containing neurons with large enoughreceptive fields to respond over a large region of the visual field.This type of stimulus manipulation has been successfully used inthe domains of orientation ~Ramsden et al., 2001! and motion~Orban, 2001! to differentiate first and second order processes. Inthis study, we exploited this possibility in an effort to identify thecortical regions involved in higher order perceptual integration ofcolor differences using fMRI. We also test whether the cortical
Fig. 1. ~a! A square transparent overlay of uniform color appears to be placed over the central region of a randomly coloredcheckerboard. In fact, this effect was obtained by added a constant vector ~translation! to the tristimulus values in the square region.~b! The vector field shows the change in the mixture between adjacent surfaces at the border of the overlay in the figure to the left.The mixture at the tail of each vector corresponds to the surface exterior to the overlay and the head to the surface that appears to bethe extension of the first under the overlay. Around the transparent layer, all the surfaces undergo the same translatory modification.~c!An example of a shear-like change applied to the tristimulus values in the central square region. The square central region does notappear as a uniform transparent overlay. ~d! Half of the changes in part c correspond to the same translation as in part a and half atranslation in the opposite sense. Since the endpoints of the vectors are the same in this and the preceding figure, the reversal ofdirection means that the interior and exterior surfaces have been exchanged. Thus, the color differences between the interior andexterior regions around the square overlay are the same. Only their global coherence has been altered. ~e! Paradigm. The three eventtypes occurring in Experiment 1 are labeled E0, E1, and E2 while those occurring in Experiment 2 are labeled E0, E3, and E4. E0 isa “null-event” for which the image presented was a fixation cross. During the inter-stimulus intervals ~2 s!, this fixation cross waspresented, rotated by 458. Each event was displayed 0.5 s. Ninety-nine events were displayed per fMRI scan. For the achromatic0chromatic comparisons, the three coordinates in color space of the rectangles within the central square overlay were set equal to thoseof the adjacent surfaces outside of the overlay region, thus, reducing the total number of rectangles to 23.
VNS23~3! 23320 208 05018006 13:40 pm Page: 2
2 F. Dojat et al.
areas involved in integrating local color differences are the sameareas activated differentially by chromatic stimuli.
Materials and methods
Subjects
Nine subjects ~4 men, 5 women, mean age � 28 6 6 years! withnormal color vision were examined. Four of the observers hadpreviously participated in several fMRI experiments and could beconsidered accustomed to the procedures. All subjects gave in-formed consent to participate in the study, which was approved byour institutional review board.
Experiments
All subjects participated in two experiments. Experiment 1 wasaimed at localizing the functional responses produced by theintroduction of chromatic contrast, Experiment 2 at identifyingfunctional responses related to color scission. Each observer alsoparticipated in preliminary tests to estimate individual conditionsyielding equiluminance, based on a minimum motion task ~Anstis& Cavanagh, 1983! performed in the scanner.
Paradigms
For each of Experiments 1 and 2, four event-related fMRI scanswere performed. During each of these scans, three different typesof events ~33 of each type! were programmed, in a pseudo-randomfashion, at 2.5 sec intervals. We used a stationary, stochasticexperimental design with a constant occurrence probability foreach type of event equal to 103 ~see Fig. 1e!. The sequence of theevents was designed so as to optimize the efficiencies of theestimation both of the main and of the differential effects ~Fristonet al., 1999!. Each event consisted in the presentation of an image,during 0.5 seconds. The three event types occurring in Experiment1 are labeled E0, E1, and E2 whereas those occurring in Experi-ment 2 are labeled E0, E3, and E4. E0 is a “null-event” for whichthe image presented was just a fixation cross. During the inter-stimulus intervals ~2 s!, a fixation cross was also presented butrotated by 458.
Prior to the experiment, we verified that the stimulus manipu-lations ~translation and shear! did differentially affect the percep-tion of transparency. Observers classified images with translatoryand shearing transformations of the tristimulus coordinates acrossa central square region as to whether the region appeared trans-parent or not. The overall accuracy was at 95% correct. Examplesthat were misclassified by observers were excluded from thestimulus set used in the rest of the experiment.
Visual stimulation
Visual stimuli were created with Matlab ~Mathworks, Inc., Natick,MA! and controlled during the experiment by a PC, runningWindows 98 with the software Presentation ~NeurobehavioralSystems Inc!. The stimuli were presented to the observers using avideo-projector ~Epson 7250M, Epson Inc., Long Beach, CA!, aback-projection screen, and a mirror system. Viewing distance was160 cm. The projected image spanned 13 by 108. Spectral andluminance calibrations of the display were performed with aMinolta CS-1000 spectroradiometer. The spectral radiance mea-
sures were used to calculate the coordinates of all stimuli in termsof Judd’s modification of the 1931 CIE 28 observer ~Judd, 1951!.
The test stimulus for all experiments was a rectangular field ~11by 88! on a gray background Bg ~luminance: 383 cd0m2, Judd CIExy � @0.31, 0.38#!. The rectangular field was divided into either 23or 33 rectangles of various sizes ~see Figs. 1a, 1c, and 1e!. Duringthe “null-event” and the inter-stimuli intervals, the fixation crosswas presented on a uniform gray screen equal to the Bg.
For Experiment 1, the rectangles of the test stimulus were eitherassigned random chromaticities at equiluminance ~E1, “chromaticevent”! or random luminances ~E2, “achromatic event”!. The onlyconstraints on the choice of chromaticities and luminances ofinance for each set is to be equal to those of the background Bg.
For Experiment 2, the chromaticity coordinates of 10 centralrectangles were modified to induce the perception of a centraltransparent square of 58 ~E3, “translation event,” see Fig. 1a!.Transparency was obtained by adding a constant vector ~transla-tion! to the coordinates in color space of each rectangle. Thedirection and length of the translation in the color space wererandomly chosen for each image. Images were customized withrespect to the luminosity of each observer. Only translations thatinduced a strong perception of transparency were retained. For thesecond set of stimuli, the direction of the translation was reversedfor half of the surfaces ~E4, “shear event,” see Fig. 1c!. Practically,this means that the positions of the adjacent surfaces interior andexterior to the central square overlay are exchanged. Because thechromaticity coordinates across the border have not changed, thechromatic contrasts around the square overlay are the same fortranslation and shear. Only the coherence ~or phase! of the chro-matic contrasts has been changed between translation and shearconditions.
Attentional and behavioral tasks
Observers were instructed to fixate the central fixation crossduring the presentation of the stimuli. Eye movements were notmonitored over the course of the experiment. In order to maintainand control observers’ attention, additional tasks were built into theparadigm for both experiments. Subjects were instructed to report,by means of a three button mouse press, the occurrence ofchromatic, achromatic, or null events in Experiment 1 and whetherthe image included a transparent region or not, or a null event inExperiment 2.
MR acquisition
Subjects were examined at 1.5 T on a clinical MR scanner ~PhilipsACS II, Best, Eindhoven, The Netherlands!. The body coil wasused for excitation. A head coil was used for detection. Headmotion was restricted by means of sand bags placed on each sideof the head. Positioning of the volume of interest was performedon scout images acquired in the sagittal plane. Both experimentswere performed during the same session with the following se-quencing: acquisition of 4 functional runs ~Experiment 1!, ananatomic run ~T1-weighted!, and then four functional runs ~Ex-periment 2!. The functional volume of interest was composed ofadjacent transverse 5-mm thick slices and oriented parallel to thebicommissural plane. A conventional gradient-recalled echo ~GRE!MR EPI sequence was used with the following major parameters:TR0TE0flip � 2.5s045ms0708, FOV � 256 � 256 mm2, acquisi-tion matrix � 64*64. The total acquisition duration per functionalscan was about 4 min.
VNS23~3! 23320 308 05018006 13:40 pm Page: 3
Cerebral imagery of perceptual integration 3
Data processing
Data analysis relied on the General Linear Model, as implementedin the statistical parametric mapping ~SPM99! software package~Friston et al., 1995! and in the SnPM toolbox ~Nichols & Holmes,2002!.
PreprocessingFunctional data were successively corrected in time to take into
account the inter-slice delay caused by multiple single slice imageacquisition, realigned to the functional scan closest to the anatom-ical one, normalized for group study using the template providedby the Montreal Neurological Institute ~MNI!, and finally spatiallysmoothed with a Gaussian kernel of 8 � 8 � 10 voxels FWHM, toconform to the assumptions underlying random Gaussian fieldtheory used in SPM. Coordinates of statistically significant voxelsinitially expressed in the MNI space were converted for referenceto the Talairach space.
Statistical analysisFor each experiment, the analysis was performed in a two-stage
procedure. In the first stage, at the individual level, the responsefor each event type was modeled with the canonical HemodynamicResponse Function and then convolved with a train of deltafunctions, corresponding to each stimulus onset, and a constantterm for each functional run ~session effect!, to create correspond-ing covariates in a general linear model. From voxel time courses,parameter estimates for each covariate were computed. Contrastswere designed to assess the main effect of each event type and thedifferential effect between two events type ~chromatic vs achro-matic or translation vs shear events!.
In a second stage, the “differential effect” images were used fora statistical non-parametric group analysis ~random effects analy-sis!. This was performed using the SnPM toolbox ~Nichols &Holmes, 2002!. Similarly to SPM99, SnPM relies on the GeneralLinear Model. Based on minimal assumptions, ~i.e., independenceof the subjects and a smooth variance structure! this approach iswell-suited for variance estimation in the presence of a limitednumber of degrees of freedom, when high variance images lead tonoisy statistical images and when the assumption that data arenormally distributed is not viable. To overcome these difficulties,weighted locally pooled variance estimates are obtained by smooth-ing the raw variance images. Then, permutation tests performed onthe data allow the computation of the corresponding null samplingdistribution. Pseudo t-statistic images are formed with smoothedvariance estimators, which are assessed for significance using astandard, non-parametric, multiple comparisons procedure basedon permutation testing. The smoothed variance t-statistic via pseudot-statistic improves sensitivity relative to the standard t-statistic~Nichols & Holmes, 2002!. With a parametric voxel-based statis-tic, the null distribution is generally used to specify a threshold byusing a t-table. With a non-parametric voxel-based statistic, thenull-distribution is not known a priori. Based on a parametricvoxel-based statistical analysis of the data from Experiment 1~which was less noisy, perhaps owing to the greater robustness ofthe perceptual differences than in Experiment 2! statistically sig-nificant activated clusters were established at a pseudo-t �4 andregion size �8 voxels.
In order to assess the possible involvement of color sensitiveareas in color transparency processing, a region of interest- ~ROI!based analysis was additionally performed as follows. First, the
two most active regions found in Experiment 1 were used asfunctional individual 10 ROIs. The MarsBar toolbox was used forindividual ROI extraction ~Brett et al., 2002!, ~http:00marsbar.sourceforge.net!. Second, within these ROIs, the mean parameterestimates were computed separately for each main covariate ofExperiment 2 ~corresponding to translation and shear events! foreach subject. Third, a paired t-test was performed to evaluate thestatistical significance of the differences between the mean param-eter estimates for the two covariates.
Results
Experiment 1: cortical areas involved in chromaticprocessing
In the first experiment cortical activity evoked by “chromatic” and“achromatic” events was compared to determine the cortical sitesinvolved in chromatic processing.
Group analysisThe statistical group analysis for “chromatic” versus “achro-
matic” events showed bilateral activation within the posteriorfusiform gyri ~see Fig. 2a!. In the left hemisphere, the largeactivation cluster is composed of two overlapping smaller clusterspositioned along the antero-posterior direction, and that couldcorrespond to the activations denoted as areas V4 and V4a byBartels & Zeki ~2000!. Activation was also found in the superiorparietal gyrus. The coordinates of the major peak activations arelisted in Table 1. No significant clusters were found in areasV10V2. In Table 2, the Talairach coordinates of the color sensitiveposterior region detected here are listed along with those from theliterature. The “achromatic” events did not activate any significantareas in comparison with “chromatic” events.
Experiment 2: cortical areas involved in color scission
The second experiment was designed to determine the corticalareas involved in the perception of color scission.
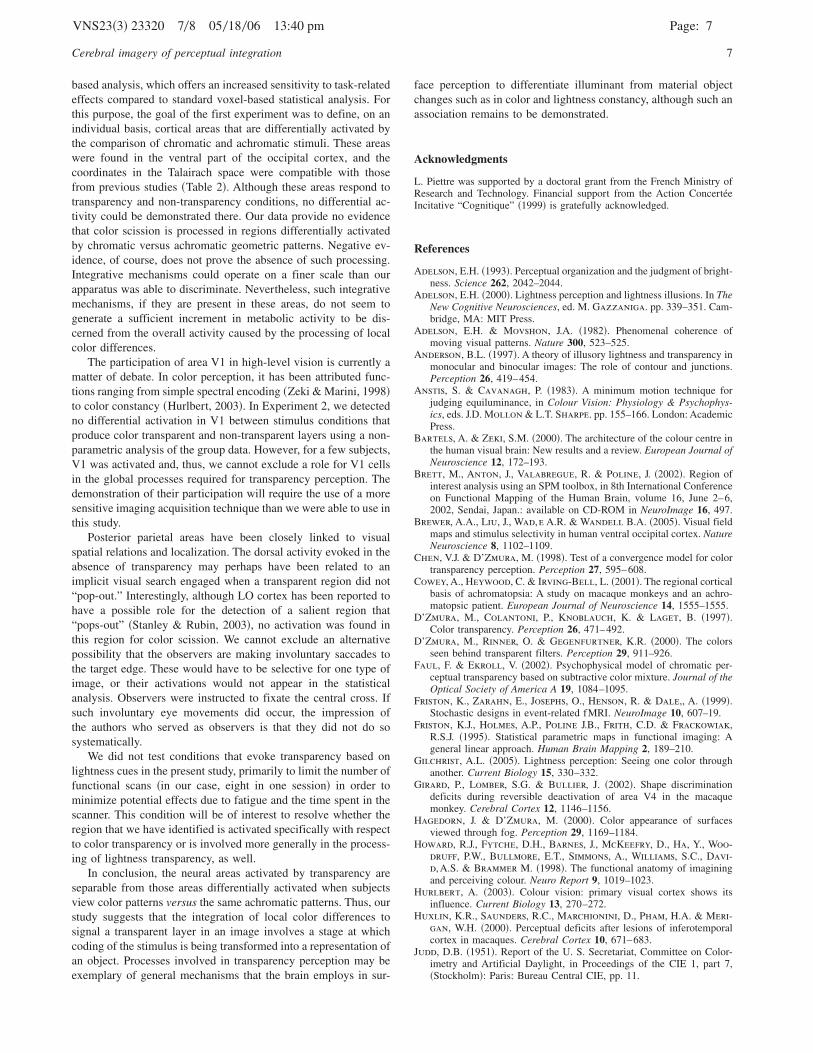
Group analysisThe group analysis for the @translation-shear# contrast reveals
an activation within the left parahippocampal gyrus ~Fig. 2b!.Talairach coordinates, z-score, and cluster size of this activation
Table 1. Experiment 1. Talairach coordinates of the voxels moststrongly activated for the [chromatic–achromatic] contrast. Inthe left hemisphere, the major cluster can be split into tworegions along the antero-posterior direction. The size(expressed in terms of voxels) is given for the entire cluster.(9 subjects, non-parametric statistical analysis,pseudo-t � 4 and cluster size � 8 voxels).
Region Hemisphere x y z size Pseudo-t
FusG R 28 �70 �9 10 4.88FusG L �28 �71 �13 34 5.6FusG L �32 �55 �10 34 5.66P1 L �12 �55 58 12 5.13
FusG � fusiform gyrus; P1 � superior parietal gyrus.
VNS23~3! 23320 408 05018006 13:40 pm Page: 4
4 F. Dojat et al.

are presented in Table 3. This activation is distinct from thatinduced by the ~chromatic–achromatic! contrast in Experiment 1.No activation was detected in area V10V2, either for the ~translation–shear! contrast or for the reverse. The ~shear translation! contrastrevealed activation within the superior part of the right posteriorparietal gyrus ~see Fig. 2c and Table 3!.
For both experiments, subjects were instructed to press one ofthree buttons for occurrences of chromatic, achromatic or nullevents or of transparency, and non-transparency or null events inExperiments 1 and 2, respectively. The activations during the nullevents served as a baseline to control for the button-pressingbehavior. The behavioral task was not found to modify expected
activations in Experiment 1, and the results are in excellent agree-ment with those already published in the literature ~see Table 2!.Similarly, for Experiment 2, it is highly unlikely that the activa-tions obtained were caused by pressing a specific key.
ROI analysisThe mean parameter estimates for each main covariate, corre-
sponding to translation and shear events, computed in the left andright ventral areas differentially activated by chromatic contrast ofeach subject as previously delineated on the basis of the results ofExperiment 1, are displayed in Fig. 2d. Both regions were sensitiveto the events, but as already shown in Fig. 2b, no significant
Fig. 2. ~a! Differential activation corresponding to Experiment 1, chromatic versus achromatic ~Non-parametric statistical analysis!,appears at two large clusters located in the ventral occipital region, ~sagittal: X � �28, coronal: Y � �70, transverse: Z � �9!. Notethat some clusters with a size less than eight voxels are displayed on the figure but are not reported in Table 1. ~b! Differential activationcorresponding to Experiment 2, translation versus shear ~Non-parametric statistical analysis! appears in the left Parahippocampal Gyrus~sagital: X � �16, coronal: Y � �46, transverse: Z � 2!. ~c! Regions preferentially activated by non-transparency events~non-parametric analysis! were in the-Posterior Parietal Gyrus ~sagital: X � 33, coronal: Y � �72, transverse: Z � 31!. ~d! A ROIanalysis was performed in the area defined by the Chromatic0Achromatic experiment. The mean parameter estimates were computedseparately for each main covariate, corresponding to translation and shear events, in the left and right regions of each subject, delineatedon the basis of the Chromatic0Achromatic experiment ~Experiment 1!. The data are averaged across subjects. Error bars represent6SEM. No significant difference was found in either condition.
VNS23~3! 23320 508 05018006 13:40 pm Page: 5
Cerebral imagery of perceptual integration 5
difference was found between either event ~RH: Translation: 0.3560.04, Shear: 0.30 6 0.04; LH: Translation: 0.41 6 0.02, Shear:0.4086 0.02!. Our data do not provide evidence for a differentialinvolvement of the “color specific” regions in color scission. AROI analysis performed in the left parahippocampal gyrus re-vealed no differential activation for chromatic versus achromaticevents.
Discussion
We identified cortical areas that are differentially activated causedby the manipulation of the coherence of local color differences soas to modulate the perception of a transparent overlay. Transpar-ency is not a particularly exotic phenomenon because it frequentlyoccurs in natural contexts. In fact, the underlying neuronal mech-anisms may be common to color induction phenomena such asneon spreading ~Anderson, 1997! and more general compensatorymechanisms, such as color ~D’Zmura et al., 1997; Khang & Zaidi,
2002; Koffka, 1935; Ripamonti & Westland, 2003! and lightnessconstancy ~Gilchrist, 2005; Schirillo & Shevell, 1997!. Thus,transparency perception presents a potentially rich model for ex-ploring the neural substrate of these fundamental visual processes.We found the major cortical activation, caused by color scission, tobe located in the anterior part of the parahippocampal gyrus. Inprevious studies of color, parts of the parahippocampal gyrus havebeen reported to be activated by tasks requiring the retrieval ofobject color or color imagery ~Howard et al., 1998!, color knowl-edge ~Martin et al., 1995!, or the perception of naturally coloredobjects ~Zeki & Marini, 1998!. Thus, color scission seems to beimplicated in a stage of processing at which object properties areassociated with the chromatic information coded from an image.
The association of transparency with object perception raises aquestion as to whether the responses that we measured werebecause of the perception of a square object in the image or thecoherent color change, as we propose. This alternative suggestionwould be valid if the square test region was less salient during theshear trials. In fact, as the examples in Fig. 1a and c demonstrate,the square region is equally visible whether the chromatic changeis coherent or not. During the experiment, the observers’ attentionwas directed to this region on every trial to decide if it appearedtransparent or not. Thus, it seems unlikely that the salience of thesquare or attention to it could explain our results.
The extraction of surface characteristics in the presence ofglobal illuminant changes has been attributed to V4 and associatedareas ~Bartels & Zeki, 2000!. Bartels and Zeki ~2000! reported thatarea V4 can be dissociated into 2 sub-areas: posterior V4 andanterior V4. Retinotopy is clearly revealed in the former, whereasit is not evident in the latter. Natural object colors also activatesites beyond this V4-complex ~Bartels & Zeki, 2000; Zeki &Marini, 1998!. The parahippocampal activation suggests that theglobal integration of local color differences is not restricted to theV4 area proposed as a color center ~Bartels & Zeki, 2000!. Rather,our results support the view of a complex network for colorprocessing and are consistent with studies on macaque monkeys~Tootell et al., 2004!, on human observers with normal vision~Brewer et al., 2005!, on achromatopsic patients ~Cowey et al.,2001; Huxlin et al., 2000! displaying color deficits followingcortical lesions anterior and ventral to area V4 as well as studiesthat indicate that inactivation of area V4 through cooling ~Girardet al., 2002! or lesions ~Walsh et al., 1993! does not alter simplehue discriminations. The parahippocampal activation could berelayed through pathways arising from V4 and more rostral tem-poral regions as have been shown to exist in the macaque ~Suzuki& Amaral, 1994!. The left activation found here does not excludethe possible involvement of the right hemisphere, the activations ofwhich might be below threshold in this study.
The possible implication of ventral regions differentially acti-vated by chromatic contrast was explicitly addressed using an ROI
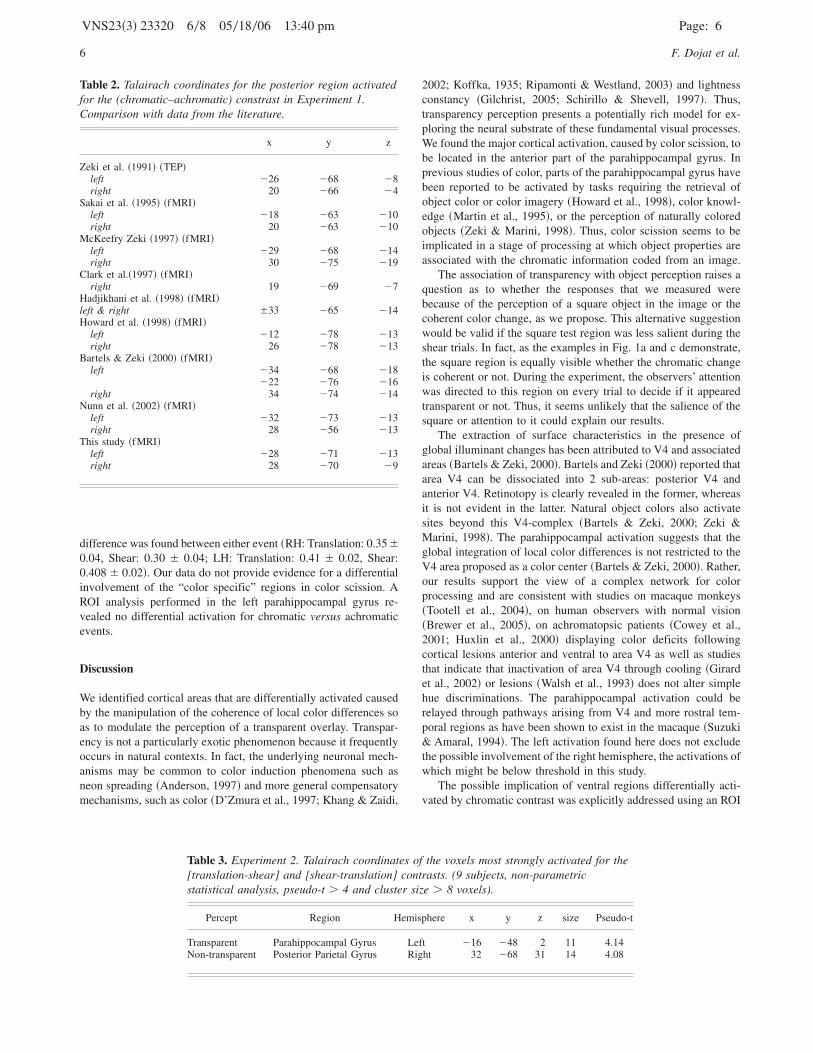
Table 2. Talairach coordinates for the posterior region activatedfor the (chromatic–achromatic) constrast in Experiment 1.Comparison with data from the literature.
x y z
Zeki et al. ~1991! ~TEP!left �26 �68 �8right 20 �66 �4
Sakai et al. ~1995! ~fMRI!left �18 �63 �10right 20 �63 �10
McKeefry Zeki ~1997! ~fMRI!left �29 �68 �14right 30 �75 �19
Clark et al.~1997! ~fMRI!right 19 �69 �7
Hadjikhani et al. ~1998! ~fMRI!left & right 633 �65 �14Howard et al. ~1998! ~fMRI!
left �12 �78 �13right 26 �78 �13
Bartels & Zeki ~2000! ~fMRI!left �34 �68 �18
�22 �76 �16right 34 �74 �14
Nunn et al. ~2002! ~fMRI!left �32 �73 �13right 28 �56 �13
This study ~fMRI!left �28 �71 �13right 28 �70 �9
Table 3. Experiment 2. Talairach coordinates of the voxels most strongly activated for the[translation-shear] and [shear-translation] contrasts. (9 subjects, non-parametricstatistical analysis, pseudo-t � 4 and cluster size � 8 voxels).
Percept Region Hemisphere x y z size Pseudo-t
Transparent Parahippocampal Gyrus Left �16 �48 2 11 4.14Non-transparent Posterior Parietal Gyrus Right 32 �68 31 14 4.08
VNS23~3! 23320 608 05018006 13:40 pm Page: 6
6 F. Dojat et al.
based analysis, which offers an increased sensitivity to task-relatedeffects compared to standard voxel-based statistical analysis. Forthis purpose, the goal of the first experiment was to define, on anindividual basis, cortical areas that are differentially activated bythe comparison of chromatic and achromatic stimuli. These areaswere found in the ventral part of the occipital cortex, and thecoordinates in the Talairach space were compatible with thosefrom previous studies ~Table 2!. Although these areas respond totransparency and non-transparency conditions, no differential ac-tivity could be demonstrated there. Our data provide no evidencethat color scission is processed in regions differentially activatedby chromatic versus achromatic geometric patterns. Negative ev-idence, of course, does not prove the absence of such processing.Integrative mechanisms could operate on a finer scale than ourapparatus was able to discriminate. Nevertheless, such integrativemechanisms, if they are present in these areas, do not seem togenerate a sufficient increment in metabolic activity to be dis-cerned from the overall activity caused by the processing of localcolor differences.
The participation of area V1 in high-level vision is currently amatter of debate. In color perception, it has been attributed func-tions ranging from simple spectral encoding ~Zeki & Marini, 1998!to color constancy ~Hurlbert, 2003!. In Experiment 2, we detectedno differential activation in V1 between stimulus conditions thatproduce color transparent and non-transparent layers using a non-parametric analysis of the group data. However, for a few subjects,V1 was activated and, thus, we cannot exclude a role for V1 cellsin the global processes required for transparency perception. Thedemonstration of their participation will require the use of a moresensitive imaging acquisition technique than we were able to use inthis study.
Posterior parietal areas have been closely linked to visualspatial relations and localization. The dorsal activity evoked in theabsence of transparency may perhaps have been related to animplicit visual search engaged when a transparent region did not“pop-out.” Interestingly, although LO cortex has been reported tohave a possible role for the detection of a salient region that“pops-out” ~Stanley & Rubin, 2003!, no activation was found inthis region for color scission. We cannot exclude an alternativepossibility that the observers are making involuntary saccades tothe target edge. These would have to be selective for one type ofimage, or their activations would not appear in the statisticalanalysis. Observers were instructed to fixate the central cross. Ifsuch involuntary eye movements did occur, the impression ofthe authors who served as observers is that they did not do sosystematically.
We did not test conditions that evoke transparency based onlightness cues in the present study, primarily to limit the number offunctional scans ~in our case, eight in one session! in order tominimize potential effects due to fatigue and the time spent in thescanner. This condition will be of interest to resolve whether theregion that we have identified is activated specifically with respectto color transparency or is involved more generally in the process-ing of lightness transparency, as well.
In conclusion, the neural areas activated by transparency areseparable from those areas differentially activated when subjectsview color patterns versus the same achromatic patterns. Thus, ourstudy suggests that the integration of local color differences tosignal a transparent layer in an image involves a stage at whichcoding of the stimulus is being transformed into a representation ofan object. Processes involved in transparency perception may beexemplary of general mechanisms that the brain employs in sur-
face perception to differentiate illuminant from material objectchanges such as in color and lightness constancy, although such anassociation remains to be demonstrated.
Acknowledgments
L. Piettre was supported by a doctoral grant from the French Ministry ofResearch and Technology. Financial support from the Action ConcertéeIncitative “Cognitique” ~1999! is gratefully acknowledged.
References
Adelson, E.H. ~1993!. Perceptual organization and the judgment of bright-ness. Science 262, 2042–2044.
Adelson, E.H. ~2000!. Lightness perception and lightness illusions. In TheNew Cognitive Neurosciences, ed. M. Gazzaniga. pp. 339–351. Cam-bridge, MA: MIT Press.
Adelson, E.H. & Movshon, J.A. ~1982!. Phenomenal coherence ofmoving visual patterns. Nature 300, 523–525.
Anderson, B.L. ~1997!. A theory of illusory lightness and transparency inmonocular and binocular images: The role of contour and junctions.Perception 26, 419–454.
Anstis, S. & Cavanagh, P. ~1983!. A minimum motion technique forjudging equiluminance, in Colour Vision: Physiology & Psychophys-ics, eds. J.D. Mollon & L.T. Sharpe. pp. 155–166. London: AcademicPress.
Bartels, A. & Zeki, S.M. ~2000!. The architecture of the colour centre inthe human visual brain: New results and a review. European Journal ofNeuroscience 12, 172–193.
Brett, M., Anton, J., Valabregue, R. & Poline, J. ~2002!. Region ofinterest analysis using an SPM toolbox, in 8th International Conferenceon Functional Mapping of the Human Brain, volume 16, June 2–6,2002, Sendai, Japan.: available on CD-ROM in NeuroImage 16, 497.
Brewer, A.A., Liu, J., Wad,e A.R. & Wandell B.A. ~2005!. Visual fieldmaps and stimulus selectivity in human ventral occipital cortex. NatureNeuroscience 8, 1102–1109.
Chen, V.J. & D’Zmura, M. ~1998!. Test of a convergence model for colortransparency perception. Perception 27, 595–608.
Cowey, A., Heywood, C. & Irving-Bell, L. ~2001!. The regional corticalbasis of achromatopsia: A study on macaque monkeys and an achro-matopsic patient. European Journal of Neuroscience 14, 1555–1555.
D’Zmura, M., Colantoni, P., Knoblauch, K. & Laget, B. ~1997!.Color transparency. Perception 26, 471–492.
D’Zmura, M., Rinner, O. & Gegenfurtner, K.R. ~2000!. The colorsseen behind transparent filters. Perception 29, 911–926.
Faul, F. & Ekroll, V. ~2002!. Psychophysical model of chromatic per-ceptual transparency based on subtractive color mixture. Journal of theOptical Society of America A 19, 1084–1095.
Friston, K., Zarahn, E., Josephs, O., Henson, R. & Dale,, A. ~1999!.Stochastic designs in event-related fMRI. NeuroImage 10, 607–19.
Friston, K.J., Holmes, A.P., Poline J.B., Frith, C.D. & Frackowiak,R.S.J. ~1995!. Statistical parametric maps in functional imaging: Ageneral linear approach. Human Brain Mapping 2, 189–210.
Gilchrist, A.L. ~2005!. Lightness perception: Seeing one color throughanother. Current Biology 15, 330–332.
Girard, P., Lomber, S.G. & Bullier, J. ~2002!. Shape discriminationdeficits during reversible deactivation of area V4 in the macaquemonkey. Cerebral Cortex 12, 1146–1156.
Hagedorn, J. & D’Zmura, M. ~2000!. Color appearance of surfacesviewed through fog. Perception 29, 1169–1184.
Howard, R.J., Fytche, D.H., Barnes, J., McKeefry, D., Ha, Y., Woo-druff, P.W., Bullmore, E.T., Simmons, A., Williams, S.C., Davi-d,A.S. & Brammer M. ~1998!. The functional anatomy of imaginingand perceiving colour. Neuro Report 9, 1019–1023.
Hurlbert, A. ~2003!. Colour vision: primary visual cortex shows itsinfluence. Current Biology 13, 270–272.
Huxlin, K.R., Saunders, R.C., Marchionini, D., Pham, H.A. & Meri-gan, W.H. ~2000!. Perceptual deficits after lesions of inferotemporalcortex in macaques. Cerebral Cortex 10, 671–683.
Judd, D.B. ~1951!. Report of the U. S. Secretariat, Committee on Color-imetry and Artificial Daylight, in Proceedings of the CIE 1, part 7,~Stockholm!: Paris: Bureau Central CIE, pp. 11.
VNS23~3! 23320 708 05018006 13:40 pm Page: 7
Cerebral imagery of perceptual integration 7
Kersten, D. ~1991!. Transparency and the cooperative computationof scene attributes, in Computational Models of Visual Processing,eds. M.S. Landy & J.A. Movshon, Cambridge, MA: MIT Press,pp. 209–228.
Khang, B.G. & Zaidi Q. ~2002!. Cues and strategies for color constancy:Perceptual scission, image junctions and transformational color match-ing. Vision Research, 42, 211–226.
Koffka, K. ~1935!. Principles of Gestalt psychology, New York: Harcourt,Brace and Company.
Martin, A., Haxby, J., Lalonde, F., Wigg,s C. & Ungerleider, L.~1995!. Discrete cortical regions associated with knowledge of colorand knowledge of action. Science 270, 102–105.
Metelli, F. ~1974!. The perception of transparency. Scientific American230, 47–54.
Nichols, T. & Holmes, A. ~2002!. Nonparametric permutation tests forfunctional neuroimaging: A primer with examples. Human Brain Map-ping 15, 1–25.
Orban, G.A. ~2001!. Imaging image processing in the human brain.Current Opinion in Neurology 14, 47–54.
Ramsden, B.M., Hung, C.P. & Roe, A.W. ~2001!. Real and illusorycontour processing in Area V1 of the primate—A cortical balancingact. Cerebral Cortex 11, 648–665.
Ripamonti, C. & Westland, S. ~2003!. Prediction of transparency per-ception based on cone-excitation ratios. Journal of the Optical Societyof America A 20, 1673–1680.
Schirillo, J.A. & Shevell, S.K. ~1997!. An account of brightness incomplex scenes based on inferred illumination. Perception 26, 507–518.
Stanley, D. & Rubin, N. ~2003!. fMRI activation in response to illusorycontours and salient regions in the human lateral occipital complex.Neuron 37, 323–31.
Suzuki, W.A. & Amaral, D.G. ~1994!. Perirhinal and parahippocampalcortices of the macaque monkey: Cortical afferents. Journal of Com-parative Neurology 350, 497–533.
Tootell, R.B.H., Nelissen, K., Vanduffel, W. & Orban, G.A. ~2004!.Search for color center~s! in macaque visual cortex. Cerebral Cortex14, 353–363.
Wallach, H. ~1976!. On Perception. New York: Quadrangle.Walsh, V., Carden, D., Butler, S.R. & Kulikowski, J.J. ~1993!. The
effects of V4 lesions on the visual abilities of macaques: hue discrim-ination and colour constancy. Behavioral Brain Research 53, 51–62.
Zeki, S.M. & Marini, L. ~1998!. Three cortical stages of colour processingin the human brain. Brain 121, 1669–1685.
VNS23~3! 23320 808 05018006 13:40 pm Page: 8
8 F. Dojat et al.
Related Documents