Key Findings of the Global Innovation Index (GII) 2018 xxix KEY FINDINGS OF THE GLOBAL INNOVATION INDEX (GII) 2018 The main messages of the Global Innovation Index 2018 can be summarized in seven key findings. 1: Becoming optimistic about global innovation and growth is possible After almost a decade of uneven progress, a broad-based global economic growth momentum is now in place. The current challenge is for the global economy to reach a comfortable cruising speed that can be sustained for the next several years. In this context, there is a renewed need to prioritize policies that foster new sources of innovation-driven growth. Investments in innovation are central in this goal. Certainly, according to the GII estimates, year-on-year growth of corporate and public R&D spending is still mostly lower than it was before the crisis (see Figure B). There are also downward risks to economic projections and innovation in the months to come. Yet many considerations also allow for considerable optimism. The global landscape of investment in science and technology as well as in education and human capital has undergone important positive shifts over the last three decades. Today innovation and research and development (R&D) are a serious policy ambition in most developed and developing economies and in all world regions. Global R&D expenditures have continued to rise, more than doubling over the 20-year period between 1996 and 2016; businesses increasingly account for most R&D investments. In 2016, worldwide total R&D expenditure (GERD) grew at 3% (Figure B). Global R&D intensity too has been stable or it even has intensified over recent years. Intellectual property (IP) filings too have reached record levels in 2016; that growth is mainly driven by China. Another positive message can be found on the business front. Global business R&D spending increased at faster pace in 2016 (4.2%) than in 2015. The top 1,000 R&D companies raised their R&D expenditures between 2015 and the first half of 2017.

Welcome message from author
This document is posted to help you gain knowledge. Please leave a comment to let me know what you think about it! Share it to your friends and learn new things together.
Transcript

Key Findings of the Global Innovation Index (GII) 2018 xxix
KEY FINDINGS OF THE GLOBAL INNOVATION INDEX (GII) 2018
The main messages of the Global Innovation Index 2018 can
be summarized in seven key findings.
1: Becoming optimistic about global
innovation and growth is possible
After almost a decade of uneven progress, a broad-based
global economic growth momentum is now in place. The
current challenge is for the global economy to reach a
comfortable cruising speed that can be sustained for the
next several years.
In this context, there is a renewed need to prioritize policies
that foster new sources of innovation-driven growth.
Investments in innovation are central in this goal.
Certainly, according to the GII estimates, year-on-year
growth of corporate and public R&D spending is still mostly
lower than it was before the crisis (see Figure B). There are
also downward risks to economic projections and innovation
in the months to come.
Yet many considerations also allow for considerable
optimism. The global landscape of investment in science
and technology as well as in education and human capital
has undergone important positive shifts over the last three
decades. Today innovation and research and development
(R&D) are a serious policy ambition in most developed and
developing economies and in all world regions. Global R&D
expenditures have continued to rise, more than doubling
over the 20-year period between 1996 and 2016; businesses
increasingly account for most R&D investments.
In 2016, worldwide total R&D expenditure (GERD) grew at
3% (Figure B). Global R&D intensity too has been stable or it
even has intensified over recent years. Intellectual property
(IP) filings too have reached record levels in 2016; that
growth is mainly driven by China.
Another positive message can be found on the business
front. Global business R&D spending increased at faster
pace in 2016 (4.2%) than in 2015. The top 1,000 R&D
companies raised their R&D expenditures between 2015 and
the first half of 2017.

xxx The Global Innovation Index 2018
To start with, significant progress has been
achieved recently in energy innovation. For
example, lower costs of renewable energy
technologies have combined with increasing
energy efficiencies. Today offshore wind and
concentrated solar power technologies are
relevant energy supply options. Ultra-high
voltage lines and smart grids are opening the
possibility that power and electricity can be
transported across long distances.
Furthermore, innovation in the energy sector
is not the privilege of high-income economies
alone. India and China are delving deeper into
the downstream applications of photovoltaic
technologies. Energy innovation is happening
at the grassroots level too. For example, small-
scale systems to provide electricity for people
living far from the grid are on the rise.
Yet to realize their full potential, new energy
innovation systems, coupled with intense
innovation efforts, are needed at all stages of
the energy system value chain.
Higher levels of technological and non-
technological innovation are required on
diverse fronts:
• on the supply side of the energy equation,
including cleaner energy sources;
• on the demand side, including smart cities,
homes and buildings, energy efficient
industries, and transport and future
mobility; and
• in enabling technologies for the
optimization of energy systems, including
smart grids and advanced storage
technologies.
In this context, however, Chapter 1 of the GII
2018 notes that green investment growth
has slowed on the basis of available figures;
energy-related patenting has also stagnated
and even declined in recent years following a
period of accelerated growth. Moreover, at the
moment, innovation has been uneven across
the different stages of the energy system value
chain, with more attention needed to be paid
to energy storage technologies and energy
transmission technologies.
According to an analysis done by the World
Intellectual Property Organization (WIPO) for
the GII 2018, the total number of patent families
and PCT international patent applications in
energy technologies almost doubled between
2005 and 2013 (see Figure D). Yet this period of
accelerated growth in the number of patented
green energy inventions has been followed
Building on this movement, and overcoming
the global innovation divide, there is potential
to ramp up innovation in most middle-income
economies as well as to progressively increase
innovation in low-income economies.
Looking forward, what if innovation
expenditures are aligned with economic
growth over the next few years? What if India
and other emerging countries in Asia, and
hopefully also in other world regions such as
Latin America, Central Asia, and Africa—the
regions that currently lag in comparison—follow
the dynamic innovation trajectory of China
in the next several years? What if increased
protectionism—in particular protectionism that
impacts technology-intensive sectors, IP, and
knowledge flows across the board—could be
contained in the months ahead?
Such dynamics could create the basis
for productive knowledge spillovers and
opportunities for collaboration and the
generation of new knowledge and innovation.
2: Continued investments in
breakthrough energy innovations
are essential for global growth
and to avert an environmental
crisis
Projections indicate that by 2040 the world will
require up to 30% more energy than it needs
today. Conventional approaches to energy
supply are unsustainable in the face of climate
change. The chapters of the 11th edition of
the GII explore how innovation contributes to
addressing and solving the energy equation in
specific geographies and contexts.
Five messages emerge from this year’s GII
thematic focus, namely:
1. Innovation has a key role in meeting
increasing global energy demand.
2. Energy innovations are happening
globally, while objectives differ across
countries.
3. New energy innovation systems need
to emerge, with efforts along all stages,
including energy distribution and storage.
4. Obstacles to the adoption and diffusion
of energy innovations remain numerous.
5. Public policy plays a central role in
driving the energy transition.

Key Findings of the Global Innovation Index (GII) 2018 xxxi
–15
–12
–9
–6
–3
0
3
6
9
12
15
201620142012201020082006
Productivity growth, 1970–2018 Investment growth, 2006–16
Figure B.
Global productivity, investment, and business R&D falling short?
Source: See Figure 1 in Chapter 1.
Percent Percent
World
High income
Middle income
–1
0
1
2
3
4
5
‘182015201020052000199519901985198019751970
Global R&D expenditures growth, 2006–16
GDP growth (percent) Total R&D (percent) Business R&D (percent)
0
2
4
6
8
10
201620142012201020082006
–0.2
5.4
3.3
0
2
4
6
8
10
201620142012201020082006
2.3
6.7
3.0
0
2
4
6
8
10
201620142012201020082006
0.3
8.1
4.2
2018 productivity levels
1.8% World
1.0% High income (excluding U.S.)
2.4% Middle income
0.9% United States
of America

xxxii The Global Innovation Index 2018
20
142
015
20
162
017
20
18GB SE NL US SG LUDK HKCH
SE GB NLUS FI SG IE DE
DE
CH
SE NL US FISGCH
GB SE NL US FI SG IE
IE
LU DK
DK
DK
CH
NL SE GB SG US FI DK IECH
FI
GB DE
Hong Kong (China)
Ireland
Luxembourg
HK
IE
LU
Netherlands
Singapore
Sweden
NL
SG
SE
Switzerland
United Kingdom
United States of America
CH
GB
US
KEY
Denmark
Finland
Germany
DK
FI
DE
987654321 10
Sweden maintained
2nd place for the
second time in 2017.
After 2016
no country has entered
or exited the top 10.
In 2015 Ireland
entered the top 10
and Hong Kong
(China) exited.
Since 2011
Switzerland has
ranked 1st in the
GII every year.
In 2018
the Netherlands
and Sweden traded
2nd and 3rd place.
Figure C.
Movement in the GII top 10
Source: See Figure 5 in Chapter 1.

Key Findings of the Global Innovation Index (GII) 2018 xxxiii
3: China’s rapid rise shows the
way for other middle-income
economies
The global innovation divide remains wide, with
high-income economies leading the innovation
landscape and big gaps in terms of nearly all
innovation input and output metrics between
these leaders and other less-developed
countries.
In this context, China’s rise in the GII rankings
over the last few years has been spectacular.
Since 2016 China has featured in the top 25
group and has consistently moved upward in
the rankings to 17th this year. The only middle-
income economy that continues to edge closer
to the top 25 is Malaysia (35th).
China’s innovation prowess becomes evident
in various areas. It shows some of its greatest
improvements in global R&D companies, high-
tech imports, the quality of its publications,
and tertiary enrolment. In absolute values,
and in areas such as R&D expenditures and
the number of researchers, patents, and
publications, China is now 1st or 2nd in the
world, with volumes that overshadow most high-
income economies (see Figure G).
Indeed, China presents an impressive example
for other middle-income countries to follow as
they seek to join the echelons of high-income
economies. With this success in mind, China’s
attention is now turning to the quality and
impact of innovation.
The GII 2018 also identifies 20 countries that
outperform on innovation relative to their
level of development (see Figure E and Table
A). New entrants include Colombia, Tunisia,
South Africa, Costa Rica, Serbia, Montenegro,
Thailand, Georgia, and Mongolia. Among these,
Colombia, Tunisia, and South Africa enter this
group for the first time.
Of these 20 economies—six in total, the
most from any region—come from Sub-
Saharan Africa. Importantly, Kenya, Rwanda,
Mozambique, Malawi, and Madagascar stand
out for being innovation achievers at least three
times in the previous eight years. For the very
first time, South Africa also joins this group of
achievers from the Sub-Saharan Africa region.
In other regions, this year Mongolia, Thailand,
and Montenegro make a comeback.
by a period of deceleration and, indeed, a
slow decline. The number of green patent
families peaked in 2012—with the underlying
invention usually happening about 18 months
before the patent publication. Hence the peak
of inventive activity was around 2010. Since
then a decrease in the absolute number of
patent families has been observed every year
until 2015, a reduction from peak to bottom of
close to 4% percent—from 113,547 green patent
families in 2012 to 109,266 families in 2015.
Similarly, published PCT international patent
applications peaked in 2013, and were followed
by a decrease of about 11 % between 2013 and
2017.
With regard to patent families, although most
green energy technologies saw a downward
trend in the annual number of patents granted
since 2012, the decline has been most
pronounced in nuclear power generation
technologies and alternative energy production
technologies. The latter include notably
renewable energy technologies, such as solar
energy, wind energy, and fuel cells. In contrast,
inventions in energy conservation technologies
and green transportation technologies have
continued growing but at a slower pace. An
analysis conducted by the European Patent
Office (EPO) for the GII 2018 confirms the
above-mentioned slowdown for smart grid
technology.
Moving beyond the actual invention of
technologies, one of the biggest challenges
with respect to energy innovation seems to
be on the side of diffusion and adoption and
the fact that incentives to address this need
are missing. The challenges and costs linked
to the commercialization and uptake of energy
innovations are mostly underestimated.
Finally, the role of government is central to
implementing strong incentives and regulations
to drive the transition. Governments often play
the role of risk taker by promoting mechanisms
that stimulate investment and the diffusion of
technologies with disruptive potential. Policy
incentives are particularly lacking in sectors
with the least progress in innovation for
decarbonization, such as the heavy industries,
freight transport, and aviation. Innovation efforts
around grid infrastructure need additional
support. At the same time, the role of the
effect of subsidies on innovation is currently
underappreciated. Although subsidies might be
critical to fostering the uptake of, for example,
solar energy panels by private households, their
role in driving innovation on the supply-side
across this and other energy technologies is
unclear.

xxxiv The Global Innovation Index 2018
Source: See Figure 3 in Chapter 1.
Patent families, thousands PCT int’l patent applications, thousands
Green energy patent families, thousands
Number of patent families and PCT int’l patent applications in green energy technologies, 2005–17
Total number of patent families in green energy technologies, 2005–15
Patent families PCT international
patent applications
Energy conservation Solar Biofuels Green transportation Fuel cells Manmade waste Wind Nuclear Other energy
technologies
Figure D.
Green energy patent filings
Publication year
Publication year
40
60
80
100
120
2017201620152014201320122011201020092008200720062005
6
9
12
15
18
0
20
40
60
80
100
120
20152014201320122011201020092008200720062005

Key Findings of the Global Innovation Index (GII) 2018 xxxv
For this edition of the GII, the statistical
relationship of the GII score relative to country
features has been assessed. The core
findings—which do not imply causality in either
direction but correlation—are as follows:
1. All editions of the GII demonstrate
the positive link between innovation
performance and an economy’s level
of development as measured by GDP
per capita, aka the ‘GII bubble chart’
(Figure E). Still, some economies stand
out because they overperform relative
to their levels of development (see key
finding 3).
2. All factors considered, country size
as reflected by population size is
not correlated with the GII score in a
statistically significant way. Both large
and small countries have a good shot at
scoring high on the GII; small countries
do not unduly lead the rankings.
3. High-income economies are more
innovative when their economic
structures—and thus their industry
portfolios—are more diverse.
4. Similarly, economies at all levels of
development happen to be more
innovative when they have a more
diversified export portfolio.
India is consistently an overachiever relative to
its level of development, although it is making
progress in its rankings year on year. Given
its size, India has the potential to make a true
difference to the global innovation landscape in
the years to come.
4: Richer economies, with more
diverse industry and export
portfolios, are likelier to score
high in innovation
A look at the 2018 league table of the GII
confirms the surprising presence of several
countries or economies with small populations
or relatively small economies (see Figure
C). Among the GII top 20, one can find, for
example, the Netherlands, the Nordic EU
countries, Singapore, Israel, and Luxembourg—
in spite of the fact that large economies such as
the United States of America (U.S.), Germany,
and now China are also part of this top-ranked
group. Thus the question has legitimately
been asked: Does being small give a country a
positive advantage in the innovation rankings?
Economy Income group Region Years as an innovation achiever (total)
Moldova, Rep. Lower-middle income Europe 2018, 2017, 2016, 2015, 2014, 2013, 2012, 2011 (8)
Viet Nam Lower-middle income South East Asia, East Asia, and Oceania 2018, 2017, 2016, 2015, 2014, 2013, 2012, 2011 (8)
India Lower-middle income Central and Southern Asia 2018, 2017, 2016, 2015, 2014, 2013, 2012, 2011 (8)
Kenya Lower-middle income Sub-Saharan Africa 2018, 2017, 2016, 2015, 2014, 2013, 2012, 2011 (8)
Armenia Lower-middle income Northern Africa and Western Asia 2018, 2017, 2016, 2015, 2014, 2013, 2012 (7)
Ukraine Lower-middle income Europe 2018, 2017, 2016, 2015, 2014, 2012 (6)
Mongolia Lower-middle income South East Asia, East Asia, and Oceania 2018, 2015, 2014, 2013, 2012, 2011 (6)
Malawi Low income Sub-Saharan Africa 2018, 2017, 2016, 2015, 2014, 2012 (6)
Mozambique Low income Sub-Saharan Africa 2018, 2017, 2016, 2015, 2014, 2012 (6)
Rwanda Low income Sub-Saharan Africa 2018, 2017, 2016, 2015, 2014, 2012 (6)
Georgia Lower-middle income Northern Africa and Western Asia 2018, 2014, 2013, 2012 (4)
Thailand Upper-middle income South East Asia, East Asia, and Oceania 2018, 2015, 2014, 2011 (4)
Montenegro Upper-middle income Europe 2018, 2015, 2013, 2012 (4)
Bulgaria Upper-middle income Europe 2018, 2017, 2015 (3)
Madagascar Low income Sub-Saharan Africa 2018, 2017, 2016 (3)
Serbia Upper-middle income Europe 2018, 2012 (2)
Costa Rica Upper-middle income Latin America and the Caribbean 2018, 2013 (2)
South Africa Upper-middle income Sub-Saharan Africa 2018 (1)
Tunisia Lower-middle income Northern Africa and Western Asia 2018 (1)
Colombia Upper-middle income Latin America and the Caribbean 2018 (1)
Source: See Table 2 in Chapter 1.
Table A: Innovation achievers: Income group, region, and years as an innovation achiever

xxxvi The Global Innovation Index 2018
Source: See Figure 9 in Chapter 1.
10
15
20
25
30
35
40
45
50
55
60
65
70
750 3,000 12,000 48,000 192,000
DZ
AR
BH
BD
BY
BJ
BO
BW
BN
BF
CM
SV
GH
GTHN
KZ
KW
LB
LT
MU
NG
OM
PK
PA
QA
RU
SA
TG
TT
TR
AE
YE
ZM
AL AZBA
BR
KH
CL
HR
CY
CZ
CI
DO
ECEG
GR
GN
HU
ID
IR
IT
JMJO
KG
LVMY
ML
MT
MX
MA
NA
NP
NE
PY
PEPH
PL
PT
RO
SN
SK
SI
ES
LK
MK
TJ
TZ
UG
UY
ZW
AM
BG
CO
CRGE
IN
KE
MG
MW
MD
MN ME
MZ
RW
RS
ZA
TH
TN
UAVN
ATBE
CACN
DK
EE
FI
FR
DE
HK
IS
IEIL
JP
KR
LU
NL
NZ
NO
SG
SE
CH
GB
US
AU
L
L
Figure E.
GII scores and GDP per capita in PPP$ (bubbles sized by population)
GII score GDP per capita in PPP$
(logarithmic scale)
Innovation leaders
Innovation achievers Performing at
expectations for level of development
Performing below expectations for level of development

Key Findings of the Global Innovation Index (GII) 2018 xxxvii
ISO-2 Country Codes
Code Country/Economy
AE United Arab Emirates
AL Albania
AM Armenia
AR Argentina
AT Austria
AU Australia
AZ Azerbaijan
BA Bosnia and Herzegovina
BD Bangladesh
BE Belgium
BF Burkina Faso
BG Bulgaria
BH Bahrain
BJ Benin
BN Brunei Darussalam
BO Bolivia, Plurinational State of
BR Brazil
BW Botswana
BY Belarus
CA Canada
CH Switzerland
CI Côte d'Ivoire
CL Chile
CM Cameroon
CN China
CO Colombia
CR Costa Rica
CY Cyprus
CZ Czech Republic
DE Germany
DK Denmark
DO Dominican Republic
DZ Algeria
EC Ecuador
EE Estonia
EG Egypt
ES Spain
FI Finland
FR France
GB United Kingdom
GE Georgia
GH Ghana
Code Country/Economy
GN Guinea
GR Greece
GT Guatemala
HK Hong Kong (China)
HN Honduras
HR Croatia
HU Hungary
ID Indonesia
IE Ireland
IL Israel
IN India
IR Iran, Islamic Republic of
IS Iceland
IT Italy
JM Jamaica
JO Jordan
JP Japan
KE Kenya
KG Kyrgyzstan
KH Cambodia
KR Korea, Republic of
KW Kuwait
KZ Kazakhstan
LB Lebanon
LK Sri Lanka
LT Lithuania
LU Luxembourg
LV Latvia
MA Morocco
MD Moldova, Republic of
ME Montenegro
MG Madagascar
MK The former Yugoslav Republic of Macedonia
ML Mali
MN Mongolia
MT Malta
MU Mauritius
MW Malawi
MX Mexico
MY Malaysia
MZ Mozambique
NA Namibia
Code Country/Economy
NE Niger
NG Nigeria
NL Netherlands
NO Norway
NP Nepal
NZ New Zealand
OM Oman
PA Panama
PE Peru
PH Philippines
PK Pakistan
PL Poland
PT Portugal
PY Paraguay
QA Qatar
RO Romania
RS Serbia
RU Russian Federation
RW Rwanda
SA Saudi Arabia
SE Sweden
SG Singapore
SI Slovenia
SK Slovakia
SN Senegal
SV El Salvador
TG Togo
TH Thailand
TJ Tajikistan
TN Tunisia
TR Turkey
TT Trinidad and Tobago
TZ Tanzania, United Republic of
UA Ukraine
UG Uganda
US United States of America
UY Uruguay
VN Viet Nam
YE Yemen
ZA South Africa
ZM Zambia
ZW Zimbabwe

xxxviii The Global Innovation Index 2018
• Among high-income countries, Switzerland,
the Netherlands, Sweden, Germany,
Ireland, Luxembourg, and also Hungary
stand out for producing many outputs
for their given level of inputs. Singapore,
Australia, Japan, Hong Kong (China),
Canada, New Zealand, and Norway, as
well as many resource-rich economies
such as Saudi Arabia, Qatar, and Trinidad
and Tobago stand out as high-income
economies that—assuming that both inputs
and outputs are properly measured—tend
to perform worse.
• Among upper-middle-income countries,
China strongly overperforms in the said
efficiency relationship, whereas Malaysia
slightly underperforms.
• Among lower-middle economies, Ukraine,
the Republic of Moldova, and Viet Nam
stand out as performing better than would
be expected by their levels of inputs.
5: Focusing on translating
innovation investments into
results is key
What is the best way to translate investments
on education, a high number of qualified
researchers, and high R&D expenditures
into high-quality innovation outputs? Despite
significant investment in innovation inputs, some
economies do not generate a corresponding
level of innovation outputs.
Most economies have a linear relationship
between innovation inputs and outputs (see
Figure F). But there are important outliers that
strongly over- or under-deliver with respect to
obtaining a ‘bang for their buck’.
Source: See Figure 8 in Chapter 1.
Output score
Input score
0
10
20
30
40
50
60
70
80
20 30 40 50 60 70 80
AE
CN LU
MTSG
BN
HU
MY
Group 1ZM
Group 4
Group 3
Group 2
TZ
BDBYBW
EEFR
GR
JP
LV
LT
NANP
SK
SE
CH
TTUG
GB US
NL
PL
High income Upper-middle income Lower-middle income Low income Fitted values
Figure F.
Innovation Output Sub-Index score vs Innovation Input Sub-Index score by income group, 2018
Key Findings of the Global Innovation Index (GII) 2018 xxxix
The GII, however, also documents some
longstanding innovation policy concerns of
the EU. First, it showcases the persistent
differences in innovation performance within
the EU region. While the above-mentioned EU
countries are in the top 10, others are in the top
30 and 40, or even in the top 50. Second, the
GII also shows the important strengths that the
EU harbours on the side of innovation inputs
versus lower performance on business R&D or
innovation outputs. Third, the GII also attests
that entrepreneurial activity is sometimes more
constrained than would be ideal. Recent years,
however, have witnessed a renewed start-up
spurt in European capitals—a trend that is worth
amplifying.
In 3rd place comes South East Asia, East Asia,
and Oceania—the region showing the most
progress again this year, driven mainly by the
Association of Southeast Asian Nations (ASEAN)
region. Seven of this region’s 15 economies
rank in the top 25 of the GII: Singapore (5th),
the Republic of Korea (12th), Japan (13th), Hong
Kong (China) (14th), China (17th), Australia (20th),
and New Zealand (22nd).
Malaysia moves up two positions to 35th.
Thailand jumps forward seven positions,
reaching the 44th place. Viet Nam gains another
two positions, ranking 45th this year.
ASEAN economies are making great progress
in innovation indicators, yet with significant
differences in performance. Singapore has
the highest scores among ASEAN members
in many of the selected indicators, excluding
expenditure on education (topped again by
Viet Nam), tertiary enrolment (where Thailand
leads the ASEAN countries), gross capital
formation (topped again by Brunei Darussalam),
ICT service exports (topped again by the
Philippines), and trademarks by origin (topped
by Viet Nam this year).
In 4th place is Northern Africa and Western
Asia. Israel (11th, up by six), has the most striking
upward movement in the region. Following
Cyprus (29th), the United Arab Emirates (38th) is
3rd in the region.
Latin America and the Caribbean comes in
at 5th place. Although important regional
potential exists, the GII rankings of countries
in Latin America relative to other regions have
not steadily improved. Chile continues to lead
the region in the GII rankings for another year,
while Mexico has consistently moved upward
in recent years. Brazil is ranked 64th in the GII
2018. This year Costa Rica and Colombia are
identified as innovation achievers.
Another frequent policy ambition is to achieve
innovation inputs and outputs of high quality.
Rather than targeting quantity in terms of
university spending, publications, or patents,
the focus is on top-ranked universities,
much-cited publications, or patents that go
international. The top 5 high-income economies
in the quality of innovation in 2018 are Japan,
Switzerland, the U.S., Germany, and the United
Kingdom (U.K.) (see Figure 5.1 in Box 5 of
Chapter 1). The Republic of Korea moves up in
the quality of innovation, overtaking Sweden
this year, while France enters the top 10 for the
first time.
Among the middle-income group, the top 5
remain steady with China, India, and the Russian
Federation at the top, followed by Brazil and
Argentina. Mexico and Malaysia are advancing
the most in this group.
6: Strong regional innovation
imbalances persevere,
hampering economic and human
development
Regional performance as measured by the
average scores shows that (1) Northern America
is the top performer with top scores for all
pillars, followed by (2) Europe, (3) South East
Asia, East Asia, and Oceania, (4) Northern Africa
and Western Asia, (5) Latin America and the
Caribbean, (6) Central and Southern Asia, and,
finally, (7) Sub-Saharan Africa (see Figure A).
Northern America—the U.S. and Canada—make
up the top-performing region. The U.S. ranks
6th in the GII this year. Its position deteriorates
in both the innovation input and output sides,
driven by declines in Human capital and
research, Infrastructure, and Creative outputs.
Despite these downward movements, the U.S.—
in conjunction with China—remains among the
largest world contributors in all dimensions
of absolute, unscaled innovation inputs and
outputs, including R&D expenditures and
patent applications (see Figure G). The U.S.
also still harbours most top innovation clusters
such as Silicon Valley. If parts of the San Jose/
San Francisco or the Boston area in the U.S.
were countries, they could top most, if not all,
innovation rankings.
Europe is catching up with Northern America
in terms of average GII scores, coming in 2nd.
Although often underappreciated, 15 of the top
25 economies come from Europe, and most
belong to the European Union (EU).

xl The Global Innovation Index 2018
Source: See Figure 6 in Chapter 1.
0.0
0.5
1.0
1.5
2.0
SwitzerlandSingaporeIsraelU.K.U.S.China
0.0
0.3
0.6
0.9
1.2
1.5
IsraelSingaporeSwitzerland U.K.U.S.China
0
100
200
300
400
500
SingaporeIsraelSwitzerland U.K.ChinaU.S.
0
50
100
150
200
250
300
IsraelSingaporeSwitzerlandU.K.U.S.China
ChinaU.S.U.K.IsraelSingaporeSwitzerland
Researchers, 2015 or latest year available
Patents by origin Scientific and technical publications, 2017
R&D expenditures, 2016 or latest year available
Figure G.
Large high-income economies, and upper-middle income China, overshadow small countries in absolute innovation performance
Number of researchers, millions
Number of applications, millions
PPP$ (2005 constant prices), millions
Number of publications, thousands
Key Findings of the Global Innovation Index (GII) 2018 xli
The high-levels results are:
• Again, Tokyo–Yokohama tops this ranking,
followed by Shenzhen–Hong Kong.
• The U.S., with 26 clusters, accounts for the
highest number, followed by China (16),
Germany (8), the U.K. (4), and Canada (4).
• In addition to China, there are clusters from
five middle-income countries—Brazil, India,
the Islamic Republic of Iran, the Russian
Federation, and Turkey—in the top 100.
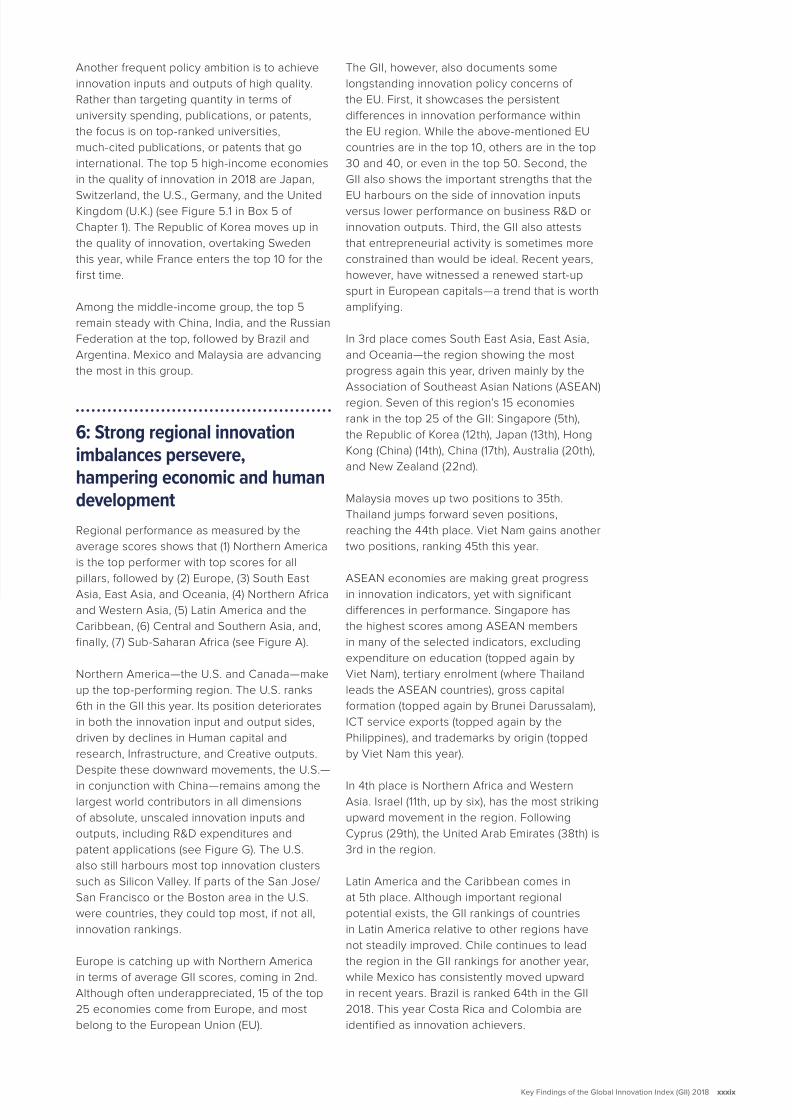
In 6th place is Central and Southern Asia, which
is a rather heterogeneous region. India is the
only economy from the region in the top half
of the GII, gaining positions since 2016. At the
indicator level, India ranks well in a number of
important indicators, including graduates in
science and engineering, productivity growth,
and ICT services exports, where it ranks
number 1 in the world. The Islamic Republic of
Iran, which is moving closer to the top half of
the GII this year, has also improved its ranking
remarkably since 2014. The other economies in
the region— in particular Kazakhstan, Sri Lanka,
Nepal, Pakistan, and Bangladesh—which rank
lower, will benefit from more innovation in the
future.
Finally, Sub-Saharan Africa is last as a region,
despite the strong performance of individual
countries. As last year, this year South Africa
takes the top spot among all economies in
the region (58th), followed by Mauritius (75th),
Kenya (78th), and Botswana (91st). Since 2012,
most countries among the group of innovation
achievers have been from Sub-Saharan Africa
(see key finding 3 and Table A). It will be
important for Africa to preserve this innovation
momentum.
7: Most top science and
technology clusters are in the
U.S., China, and Germany; Brazil,
India, and Iran also make the top
100 list
Countries have shown particular interest
in assessing and monitoring innovation
performance at the sub-national level in
clusters in their states, regions, or cities. The
challenge is that official data on the existence
and performance of innovation clusters at the
international level are hard to come by.
For the second year in a row, the Special
Section on Clusters includes a ranking of
the world’s largest clusters of science and
technology activity (see Figure H and Table B).
As last year, this ranking relies on international
patent filings to identify such clusters. But in
addition, this year the cluster ranking introduces
scientific publishing activity as an additional
measure of cluster performance.
Rank Cluster name
1 Tokyo–Yokohama JP
2 Shenzhen–Hong Kong CN/HK
3 Seoul KR
4 San Jose–San Francisco, CA US
5 Beijing CN
9 Paris FR
15 London GB
17 Amsterdam–Rotterdam NL
20 Cologne DE
22 Tel Aviv–Jerusalem IL
28 Singapore SG
29 Eindhoven BE/NL
30 Moscow RU
31 Stockholm SE
33 Melbourne AU
37 Toronto, ON CA
38 Madrid ES
44 Tehran IR
45 Milan IT
48 Zurich CH/DE
Source: See Table 2 in the Special Section Annex.
Note: refer to the ISO-2 codes; see page xxxvii for a full list.
Table B: Top cluster of or cross-border regions within the top 50

xlii The Global Innovation Index 2018
PCT patent density per 100 square kilometres
100
30,000
60,000
Patents per 100 km2
10,000
100,000
200,000
Publications per 100 km2
Figure H.
PCT patent density and SCIE publication density per 100 square kilometres
Source: See Figures 1 and 2 in the Special Section Annex.
SCIE publication density per 100 square kilometres
Related Documents