Global Imbalances Warwick J. McKibbin Center for Applied Macroeconomic Analysis (CAMA) RSPAS Australian National University &The Lowy Institute for International Policy & The Brookings Institution Presentation at Oxford University, 16 May 2006

Welcome message from author
This document is posted to help you gain knowledge. Please leave a comment to let me know what you think about it! Share it to your friends and learn new things together.
Transcript

Global Imbalances
Warwick J. McKibbin
Center for Applied Macroeconomic Analysis (CAMA) RSPAS
Australian National University
&The Lowy Institute for International Policy
& The Brookings Institution
Presentation at Oxford University, 16 May 2006
Based on
• Lee, McKibbin and Park (2006) “Transpacific Trade Imbalances: Causes and Cures” World Economy vol 29
• McKibbin and Stoeckel (2005) The United States current account
deficits and world markets www.economicscenarios.com
• Forthcoming paper with Jong-Wha Lee on “Global Imbalances”
• McKibbin (2006) “The Global Macroeconomic Consequences of a Demogrphic Transition” Asian Economic Papers, MIT Press
Overview
• What are the macroeconomic imbalances? • Sources of current account imbalances• Quantifying Possible policies and shocks that can affect
current accounts• The Role of Demographics• Summary and Conclusion

Two Aspects of Global Imbalances
• Global Savings in excess of global investment which shows up as low long term real interest rates
• National savings and investment imbalances which show up as current account imbalances between countries
– Countries with national savings greater than national investment run current account surpluses
– Countries with national investment greater than national savings run current account deficits
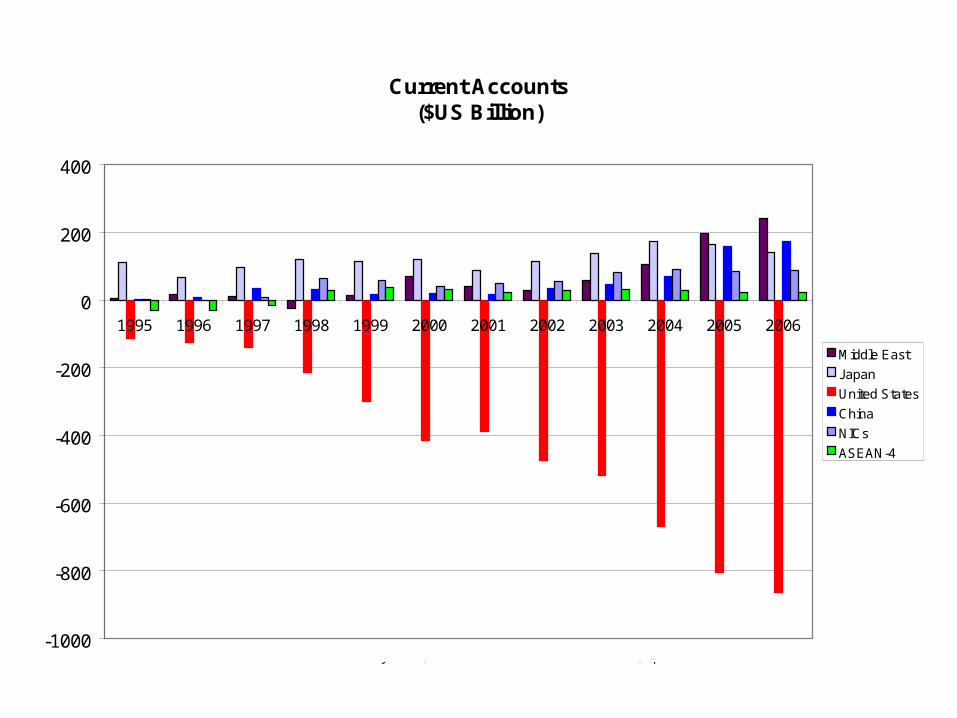
Current Accounts ($US Billion)
-1000
-800
-600
-400
-200
0
200
400
1995 1996 1997 1998 1999 2000 2001 2002 2003 2004 2005 2006
Middle East
Japan
United States
China
NICs
ASEAN-4
International Monetary Fund, World Economic Outlook Database, April 2006
Global Current accounts
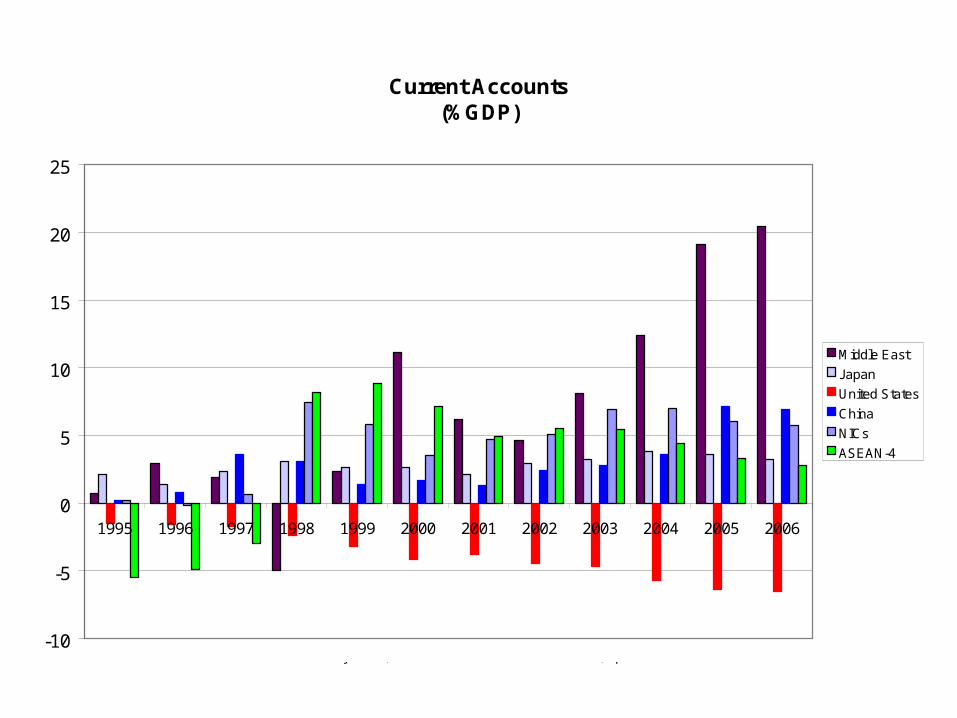
Current Accounts (%GDP)
-10
-5
0
5
10
15
20
25
1995 1996 1997 1998 1999 2000 2001 2002 2003 2004 2005 2006
Middle East
Japan
United States
China
NICs
ASEAN-4
International Monetary Fund, World Economic Outlook Database, April 2006
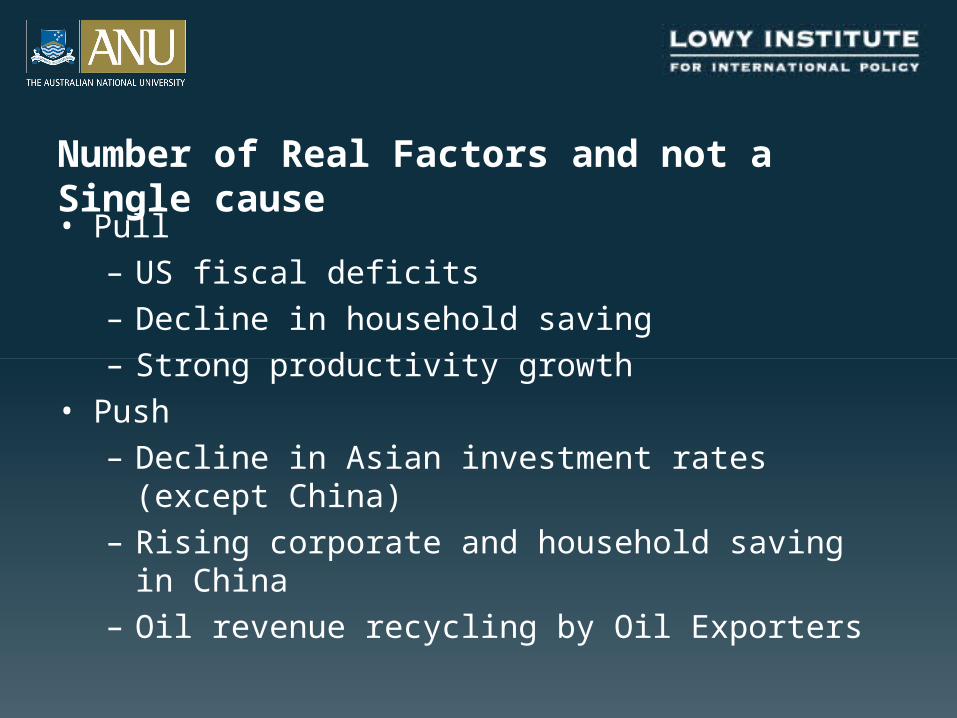
Number of Real Factors and not a Single cause
• Pull– US fiscal deficits– Decline in household saving– Strong productivity growth
• Push– Decline in Asian investment rates (except China)– Rising corporate and household saving in China– Oil revenue recycling by Oil Exporters
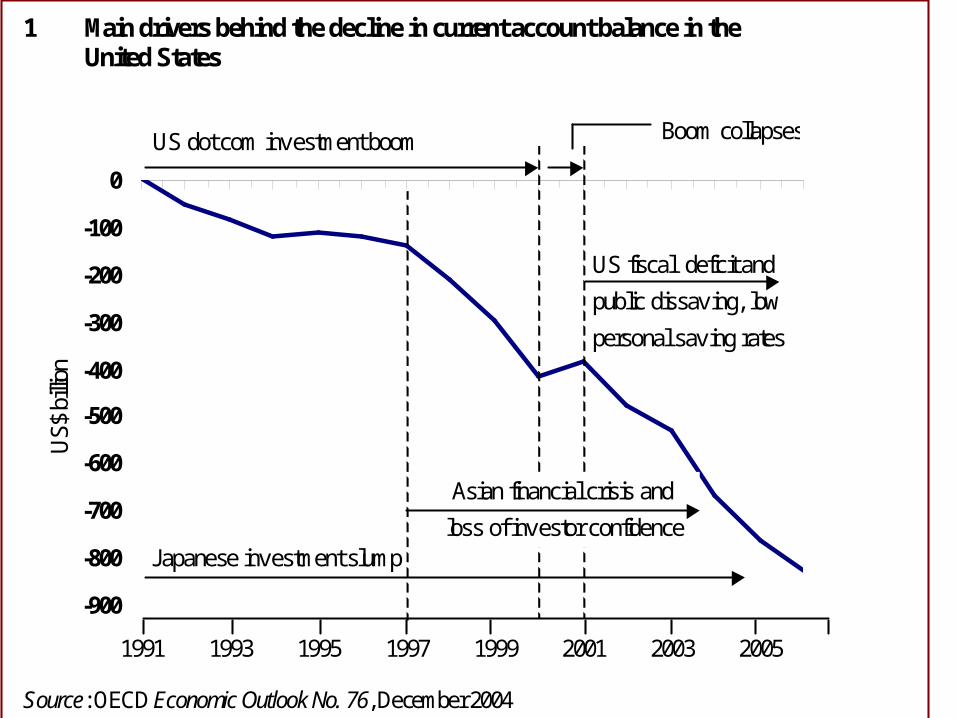
1 Main drivers behind the decline in current account balance in the United States
-900
-800
-700
-600
-500
-400
-300
-200
-100
0
1991 1993 1995 1997 1999 2001 2003 2005
US$
billi
on .
..
US fiscal deficit and
public dissav ing, low
personal sav ing rates
Japanese inv estment slump
US dot com inv estment boom Boom collapses
Asian financial crisis and
loss of inv estor confidence
Source: OECD Economic Outlook No. 76, December 2004
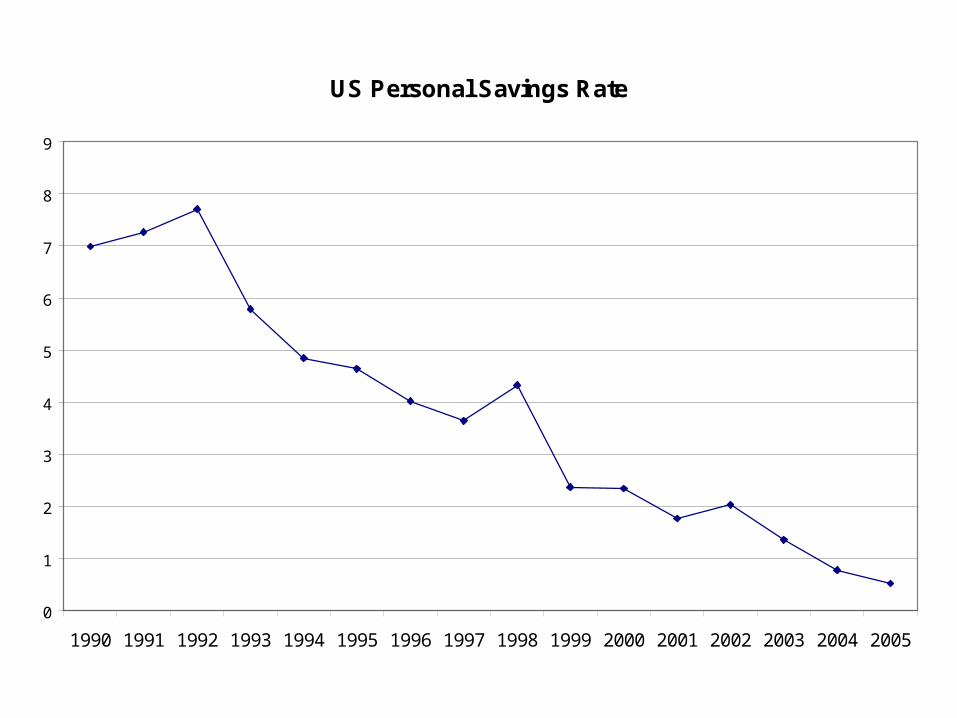
US Personal Savings Rate
0
1
2
3
4
5
6
7
8
9
1990 1991 1992 1993 1994 1995 1996 1997 1998 1999 2000 2001 2002 2003 2004 2005
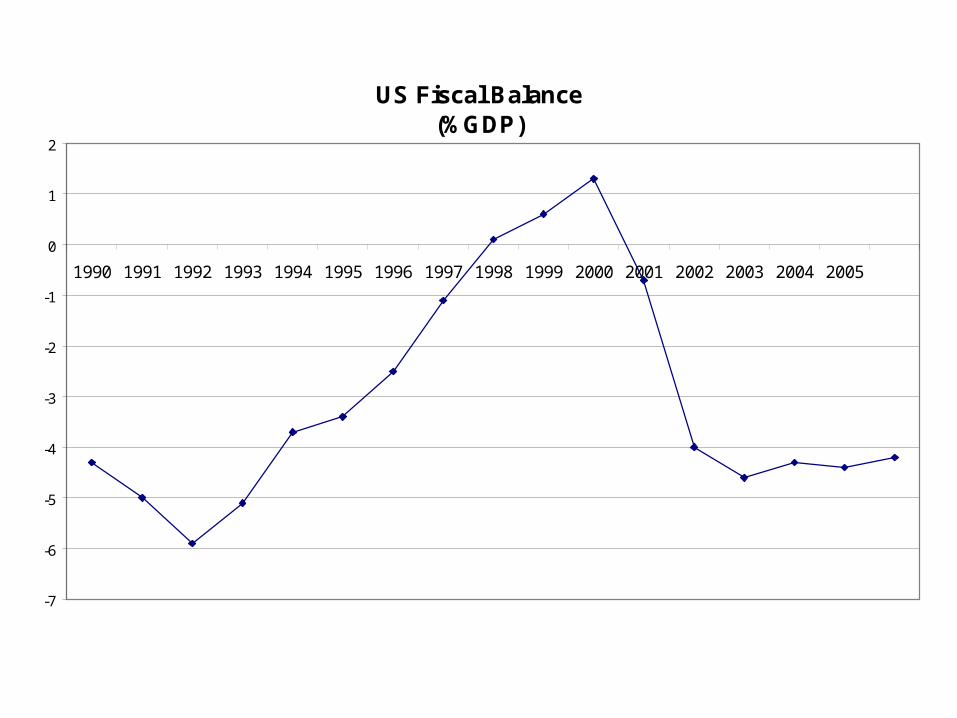
US Fiscal Balance(%GDP)
-7
-6
-5
-4
-3
-2
-1
0
1
2
1990 1991 1992 1993 1994 1995 1996 1997 1998 1999 2000 2001 2002 2003 2004 2005
Source: IMF WEO database 2005
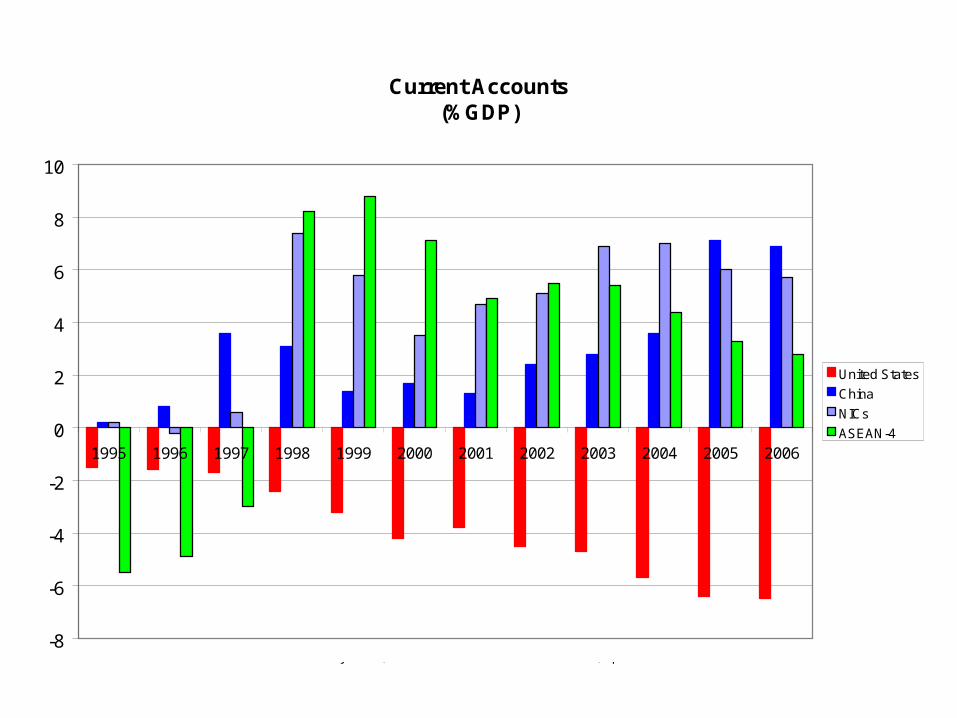
Current Accounts (%GDP)
-8
-6
-4
-2
0
2
4
6
8
10
1995 1996 1997 1998 1999 2000 2001 2002 2003 2004 2005 2006
United States
China
NICs
ASEAN-4
International Monetary Fund, World Economic Outlook Database, April 2006
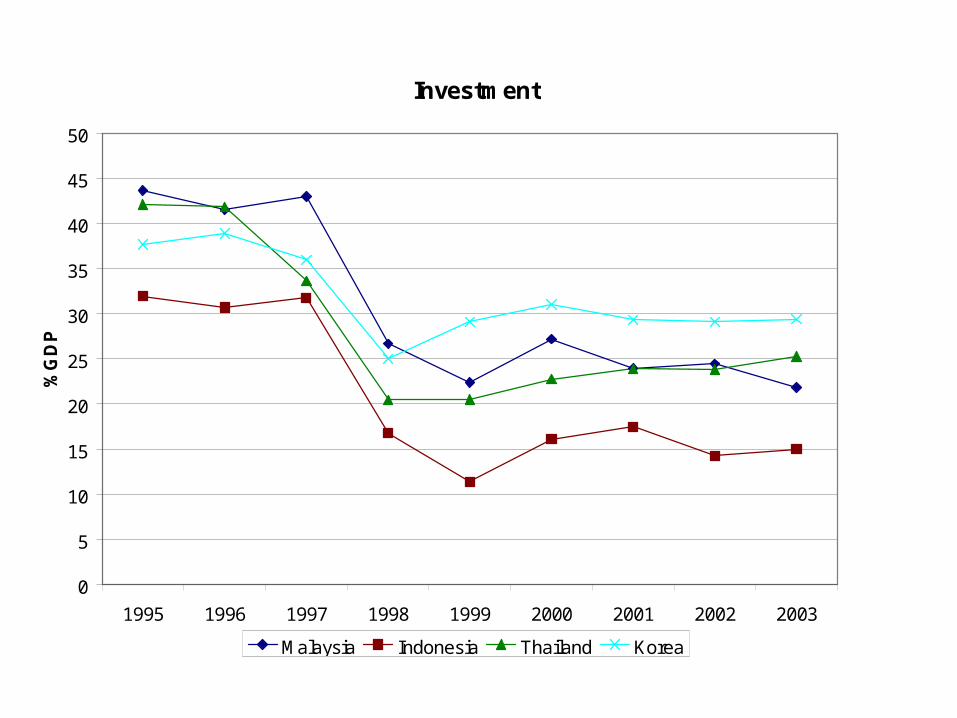
Investment
0
5
10
15
20
25
30
35
40
45
50
1995 1996 1997 1998 1999 2000 2001 2002 2003
%G
DP
Malaysia Indonesia Thailand Korea
Change in Asian Current accounts
• Large fall in Investment except China• Rise in Chinese corporate and household savings

Implication of various shocks for Current accounts
Using the G-Cubed (Asia Pacific Model)
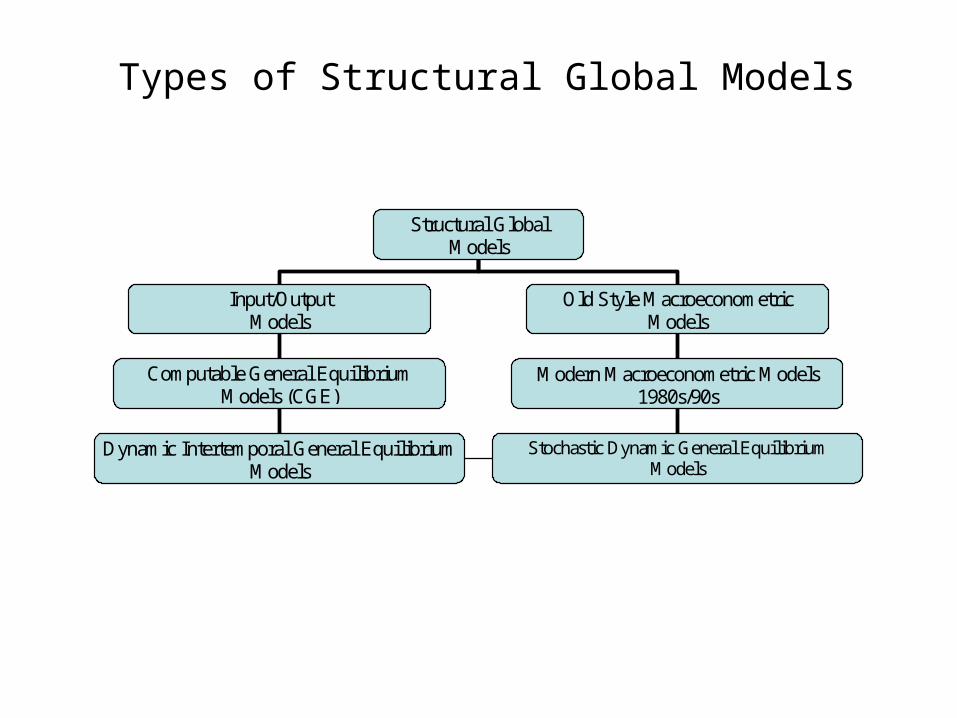
Types of Structural Global Models
Structural Global Models
Input/Output Models
Old Style Macroeconometric Models
1960s/70s
Computable General Equilibrium Models (CGE)
Models
Dynamic Intertemporal General Equilibrium Models
Modern Macroeconometric Models 1980s/90s
Stochastic Dynamic General Equilibrium Models
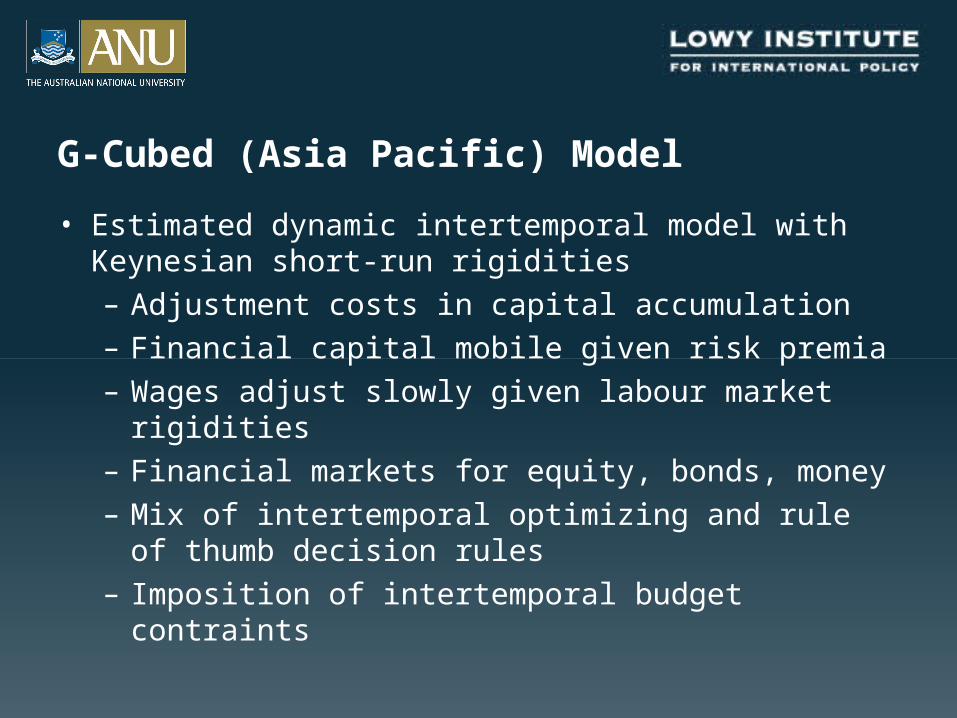
G-Cubed (Asia Pacific) Model
• Estimated dynamic intertemporal model with Keynesian short-run rigidities– Adjustment costs in capital accumulation– Financial capital mobile given risk premia– Wages adjust slowly given labour market rigidities– Financial markets for equity, bonds, money– Mix of intertemporal optimizing and rule of thumb
decision rules– Imposition of intertemporal budget contraints
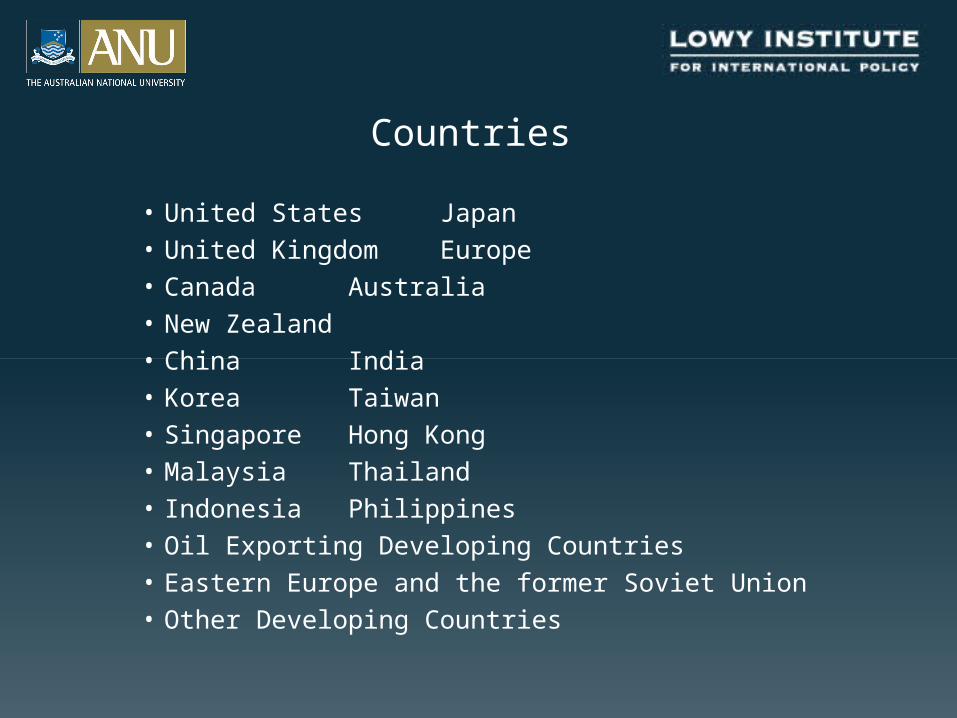
Countries
• United States Japan• United Kingdom Europe• Canada Australia• New Zealand • China India • Korea Taiwan• Singapore Hong Kong• Malaysia Thailand • Indonesia Philippines • Oil Exporting Developing Countries • Eastern Europe and the former Soviet Union • Other Developing Countries

Sectors
• Energy
• Mining
• Agriculture
• Durable Manufacturing
• Non-Durable Manufacturing
• Services
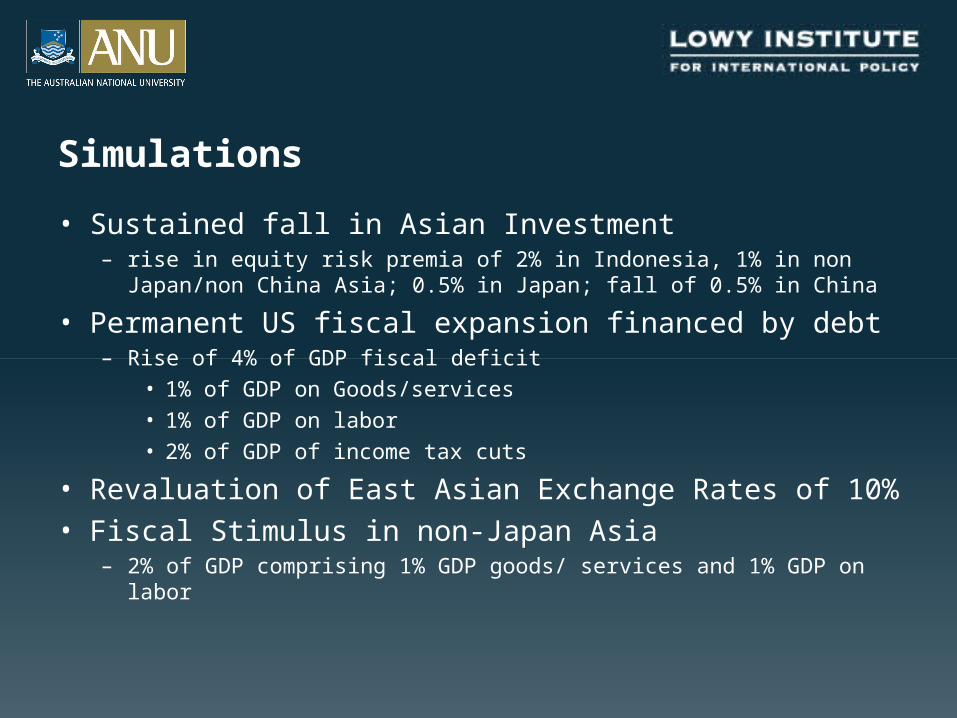
Simulations
• Sustained fall in Asian Investment – rise in equity risk premia of 2% in Indonesia, 1% in non Japan/non
China Asia; 0.5% in Japan; fall of 0.5% in China
• Permanent US fiscal expansion financed by debt – Rise of 4% of GDP fiscal deficit
• 1% of GDP on Goods/services
• 1% of GDP on labor
• 2% of GDP of income tax cuts
• Revaluation of East Asian Exchange Rates of 10%• Fiscal Stimulus in non-Japan Asia
– 2% of GDP comprising 1% GDP goods/ services and 1% GDP on labor
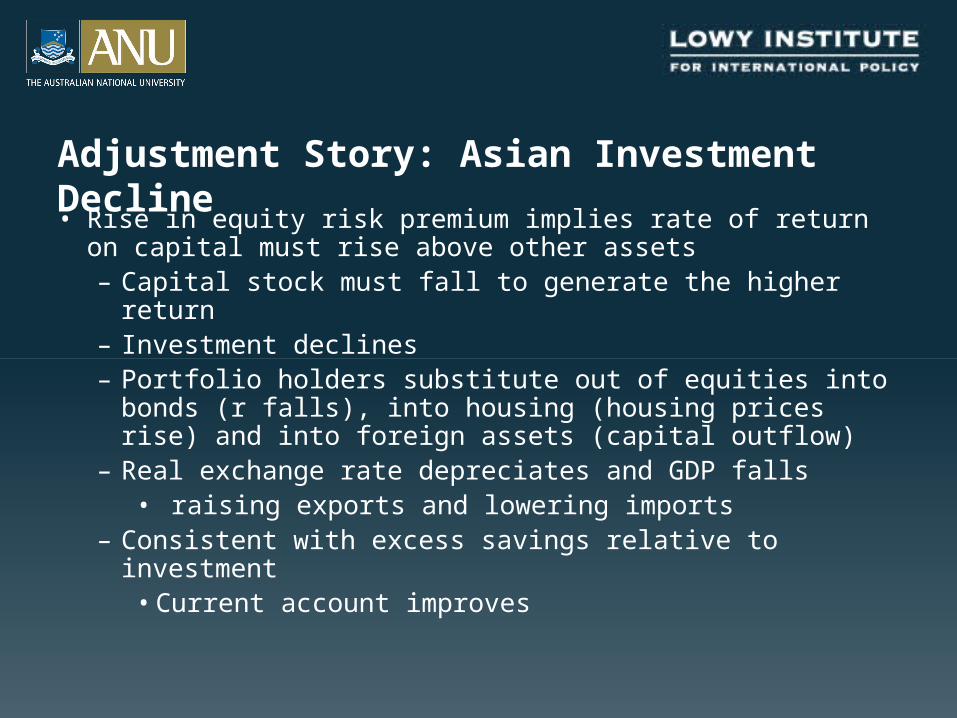
Adjustment Story: Asian Investment Decline
• Rise in equity risk premium implies rate of return on capital must rise above other assets– Capital stock must fall to generate the higher return– Investment declines– Portfolio holders substitute out of equities into bonds
(r falls), into housing (housing prices rise) and into foreign assets (capital outflow)
– Real exchange rate depreciates and GDP falls• raising exports and lowering imports
– Consistent with excess savings relative to investment• Current account improves
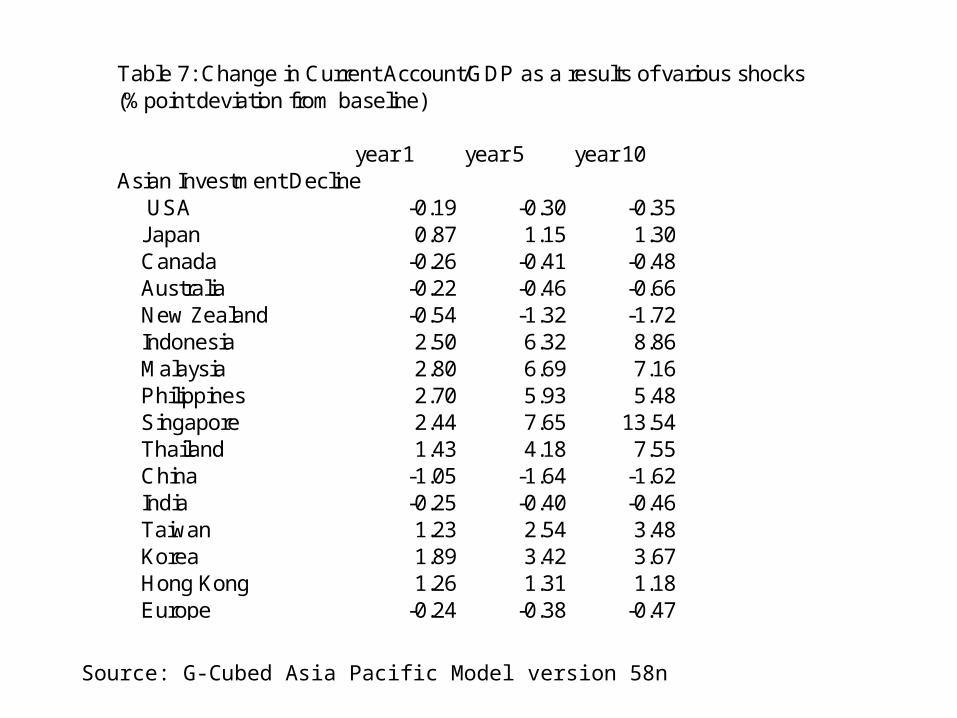
Source: G-Cubed Asia Pacific Model version 58n
Table 7: Change in Current Account/GDP as a results of various shocks(%point deviation from baseline)
year 1 year 5 year 10Asian Investment Decline USA -0.19 -0.30 -0.35 Japan 0.87 1.15 1.30 Canada -0.26 -0.41 -0.48 Australia -0.22 -0.46 -0.66 New Zealand -0.54 -1.32 -1.72 Indonesia 2.50 6.32 8.86 Malaysia 2.80 6.69 7.16 Philippines 2.70 5.93 5.48 Singapore 2.44 7.65 13.54 Thailand 1.43 4.18 7.55 China -1.05 -1.64 -1.62 India -0.25 -0.40 -0.46 Taiwan 1.23 2.54 3.48 Korea 1.89 3.42 3.67 Hong Kong 1.26 1.31 1.18 Europe -0.24 -0.38 -0.47
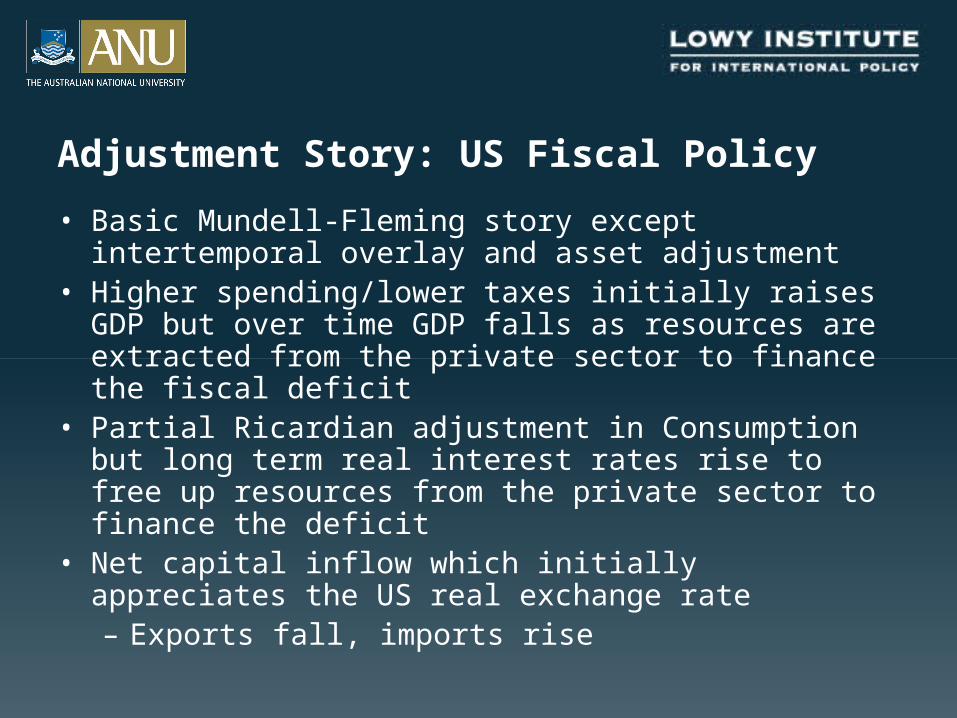
Adjustment Story: US Fiscal Policy
• Basic Mundell-Fleming story except intertemporal overlay and asset adjustment
• Higher spending/lower taxes initially raises GDP but over time GDP falls as resources are extracted from the private sector to finance the fiscal deficit
• Partial Ricardian adjustment in Consumption but long term real interest rates rise to free up resources from the private sector to finance the deficit
• Net capital inflow which initially appreciates the US real exchange rate– Exports fall, imports rise
Adjustment Story: US Fiscal Policy
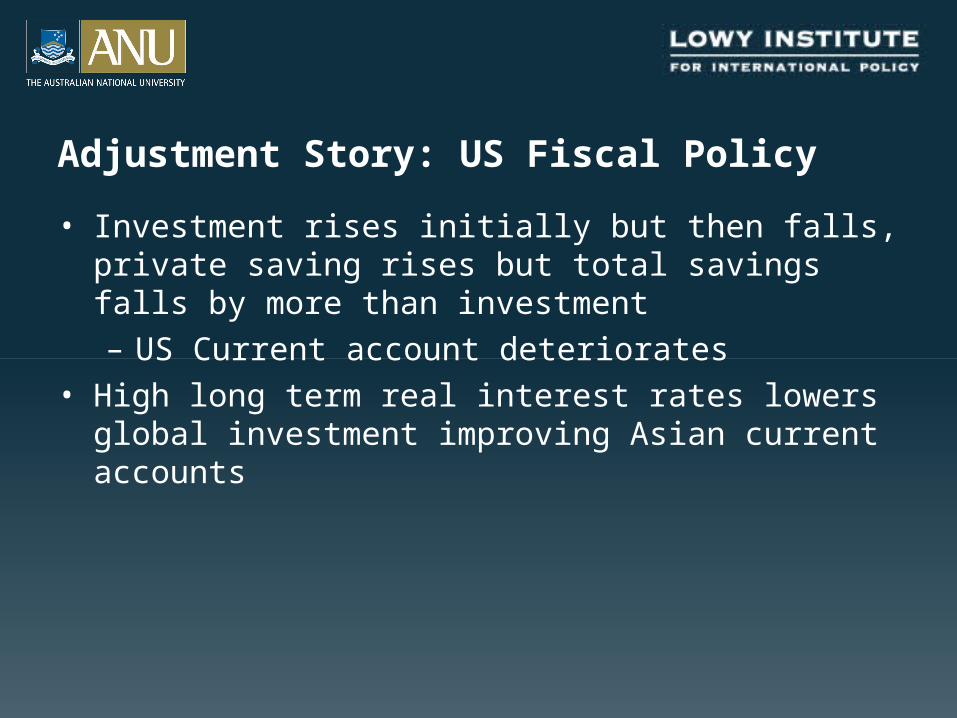
• Investment rises initially but then falls, private saving rises but total savings falls by more than investment– US Current account deteriorates
• High long term real interest rates lowers global investment improving Asian current accounts

Source: G-Cubed Asia Pacific Model version 58n
Table 7: Change in Current Account/GDP as a results of various shocks(%point deviation from baseline)
US Fiscal policy USA -1.58 -1.89 -1.95 Japan 0.95 0.94 1.00 Canada 1.04 1.36 1.41 Australia 1.00 1.11 1.21 New Zealand 1.57 2.57 2.67 Indonesia 0.56 1.24 1.22 Malaysia 1.03 2.10 1.75 Philippines 2.54 2.94 2.20 Singapore -0.40 0.34 1.51 Thailand 1.31 2.09 2.32 China 0.24 0.48 0.38 India 0.52 0.82 0.71 Taiwan 0.43 0.73 0.89 Korea 1.10 1.59 1.33 Hong Kong 5.14 4.53 3.57 Europe 0.67 0.61 0.66
Adjustment Story: East Asia Revaluation
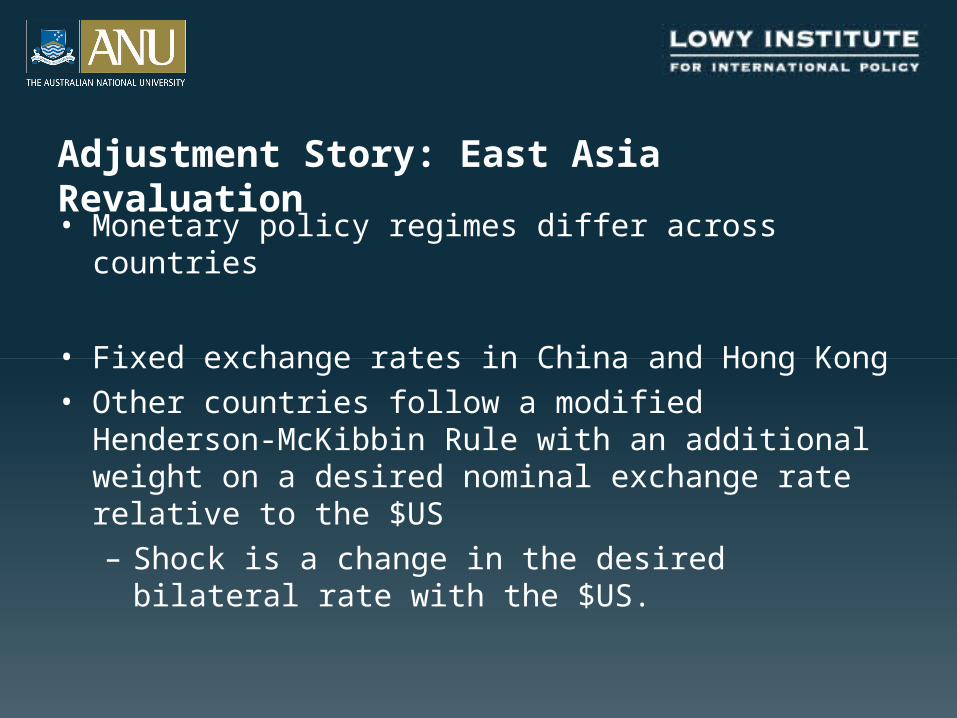
• Monetary policy regimes differ across countries
• Fixed exchange rates in China and Hong Kong• Other countries follow a modified Henderson-McKibbin
Rule with an additional weight on a desired nominal exchange rate relative to the $US– Shock is a change in the desired bilateral rate with the
$US.
Adjustment Story: East Asia Revaluation
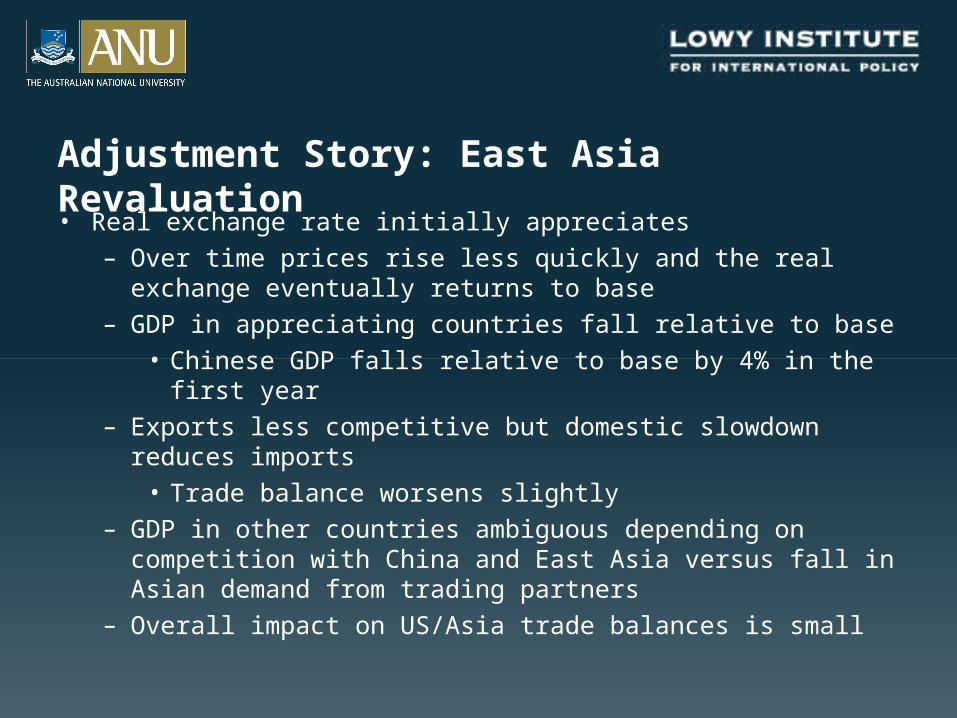
• Real exchange rate initially appreciates– Over time prices rise less quickly and the real exchange
eventually returns to base– GDP in appreciating countries fall relative to base
• Chinese GDP falls relative to base by 4% in the first year– Exports less competitive but domestic slowdown reduces
imports• Trade balance worsens slightly
– GDP in other countries ambiguous depending on competition with China and East Asia versus fall in Asian demand from trading partners
– Overall impact on US/Asia trade balances is small
Source: G-Cubed Asia Pacific Model version 58n
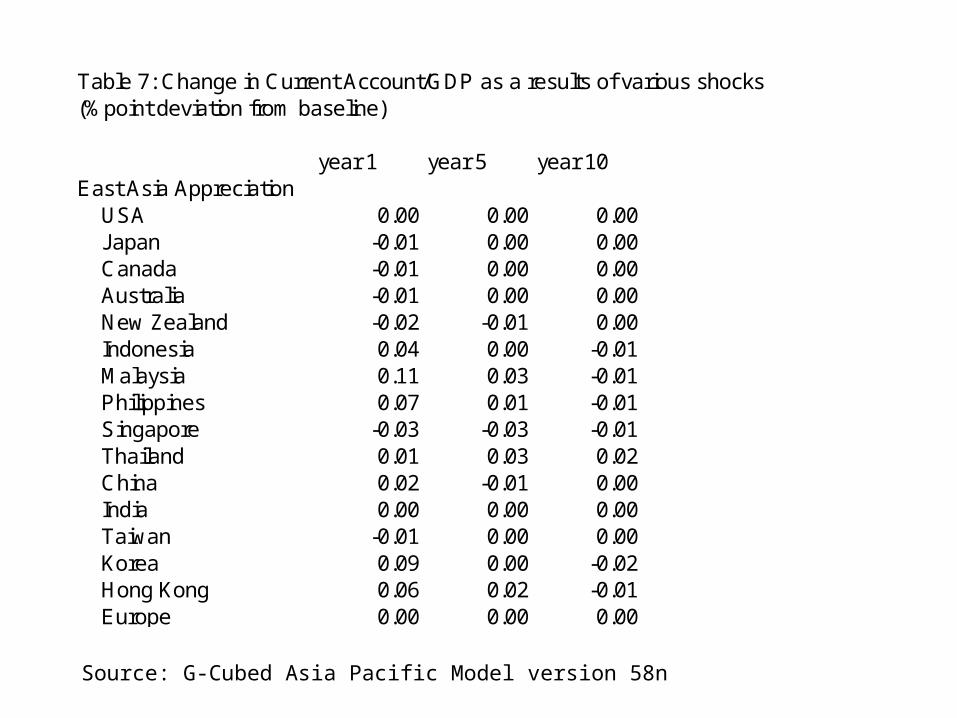
Table 7: Change in Current Account/GDP as a results of various shocks(%point deviation from baseline)
year 1 year 5 year 10East Asia Appreciation USA 0.00 0.00 0.00 Japan -0.01 0.00 0.00 Canada -0.01 0.00 0.00 Australia -0.01 0.00 0.00 New Zealand -0.02 -0.01 0.00 Indonesia 0.04 0.00 -0.01 Malaysia 0.11 0.03 -0.01 Philippines 0.07 0.01 -0.01 Singapore -0.03 -0.03 -0.01 Thailand 0.01 0.03 0.02 China 0.02 -0.01 0.00 India 0.00 0.00 0.00 Taiwan -0.01 0.00 0.00 Korea 0.09 0.00 -0.02 Hong Kong 0.06 0.02 -0.01 Europe 0.00 0.00 0.00
Source: G-Cubed Asia Pacific Model version 58n
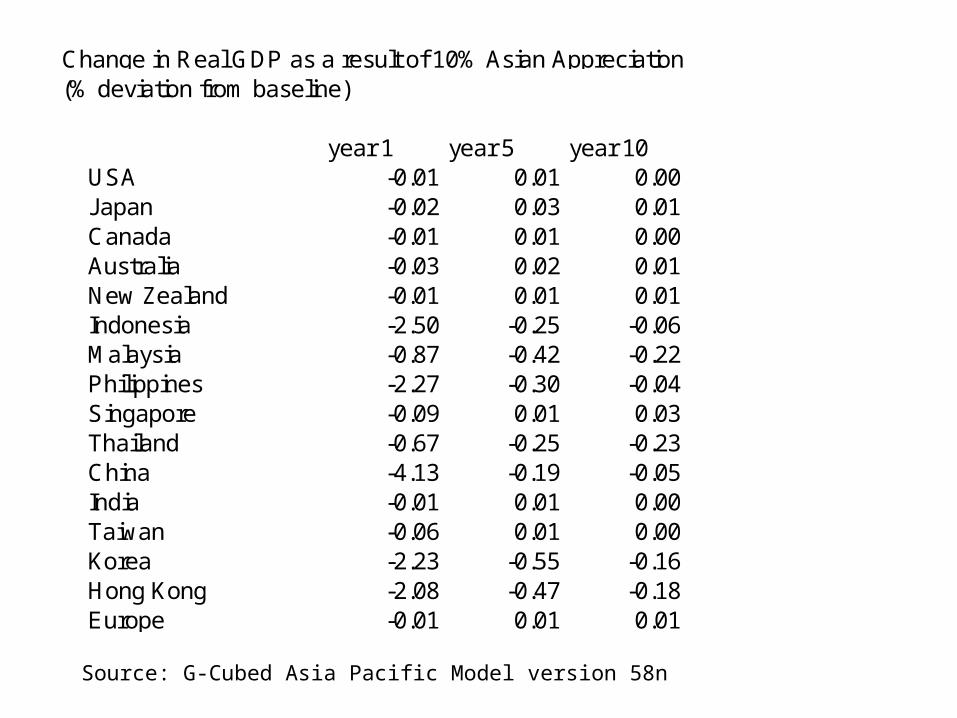
Change in Real GDP as a result of 10% Asian Appreciation(% deviation from baseline)
year 1 year 5 year 10 USA -0.01 0.01 0.00 Japan -0.02 0.03 0.01 Canada -0.01 0.01 0.00 Australia -0.03 0.02 0.01 New Zealand -0.01 0.01 0.01 Indonesia -2.50 -0.25 -0.06 Malaysia -0.87 -0.42 -0.22 Philippines -2.27 -0.30 -0.04 Singapore -0.09 0.01 0.03 Thailand -0.67 -0.25 -0.23 China -4.13 -0.19 -0.05 India -0.01 0.01 0.00 Taiwan -0.06 0.01 0.00 Korea -2.23 -0.55 -0.16 Hong Kong -2.08 -0.47 -0.18 Europe -0.01 0.01 0.01
Adjustment Story: Asian Fiscal Stimulus
• Similar story to US policy except partial exchange rate targeting in some countries causes larger rises in GDP in Asia
• Less impact on long term real interest rates because of economic size and less crowding out of foreign investment
• Capital flows in to finance the fiscal deficit• Real exchange rate appreciation
– Trade balance deteriorates
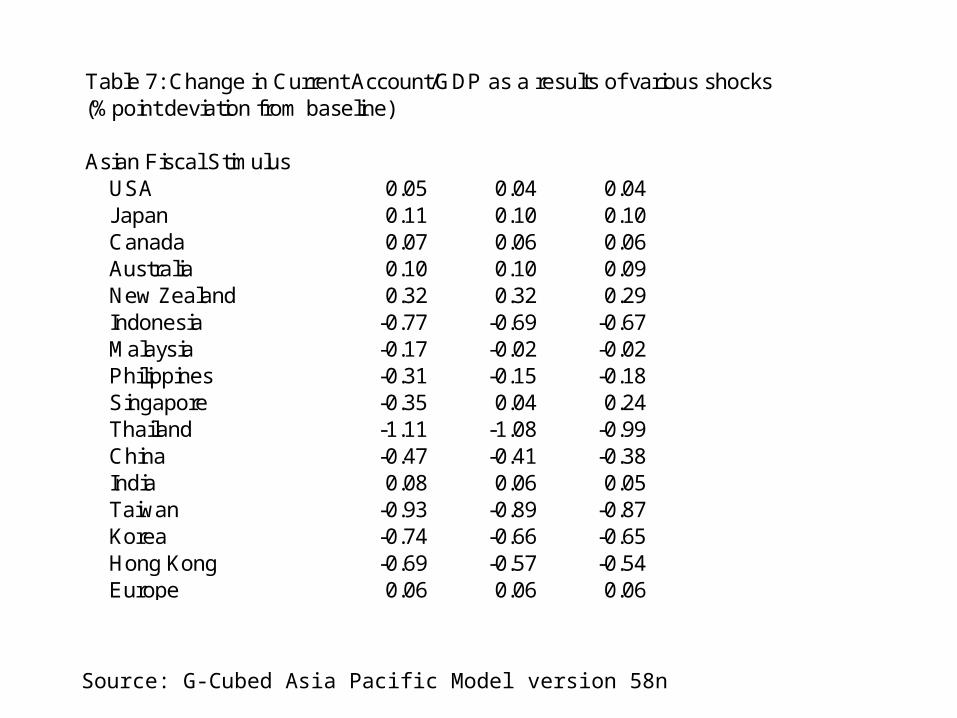
Source: G-Cubed Asia Pacific Model version 58n
Table 7: Change in Current Account/GDP as a results of various shocks(%point deviation from baseline)
Asian Fiscal Stimulus USA 0.05 0.04 0.04 Japan 0.11 0.10 0.10 Canada 0.07 0.06 0.06 Australia 0.10 0.10 0.09 New Zealand 0.32 0.32 0.29 Indonesia -0.77 -0.69 -0.67 Malaysia -0.17 -0.02 -0.02 Philippines -0.31 -0.15 -0.18 Singapore -0.35 0.04 0.24 Thailand -1.11 -1.08 -0.99 China -0.47 -0.41 -0.38 India 0.08 0.06 0.05 Taiwan -0.93 -0.89 -0.87 Korea -0.74 -0.66 -0.65 Hong Kong -0.69 -0.57 -0.54 Europe 0.06 0.06 0.06
Source: G-Cubed Asia Pacific Model version 58n
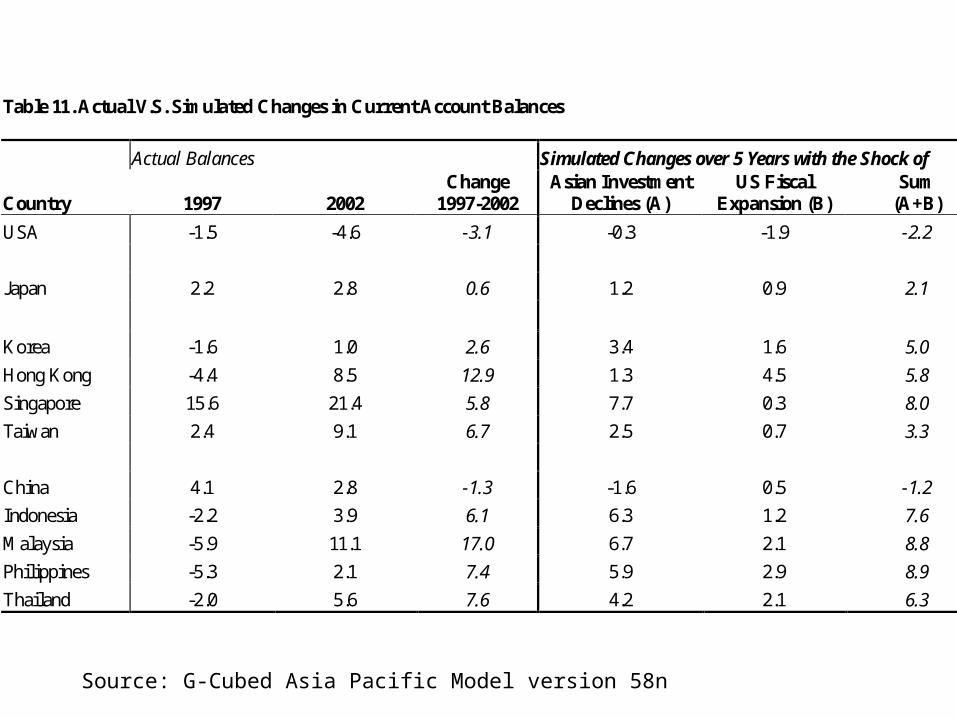
Table 11. Actual V.S. Simulated Changes in Current Account Balances
Actual Balances Simulated Changes over 5 Years with the Shock of
Country 1997 2002 Change
1997-2002 Asian Investment
Declines (A) US Fiscal
Expansion (B) Sum
(A+B)
USA -1.5 -4.6 -3.1 -0.3 -1.9 -2.2
Japan 2.2 2.8 0.6 1.2 0.9 2.1
Korea -1.6 1.0 2.6 3.4 1.6 5.0
Hong Kong -4.4 8.5 12.9 1.3 4.5 5.8
Singapore 15.6 21.4 5.8 7.7 0.3 8.0
Taiwan 2.4 9.1 6.7 2.5 0.7 3.3
China 4.1 2.8 -1.3 -1.6 0.5 -1.2
Indonesia -2.2 3.9 6.1 6.3 1.2 7.6
Malaysia -5.9 11.1 17.0 6.7 2.1 8.8
Philippines -5.3 2.1 7.4 5.9 2.9 8.9
Thailand -2.0 5.6 7.6 4.2 2.1 6.3
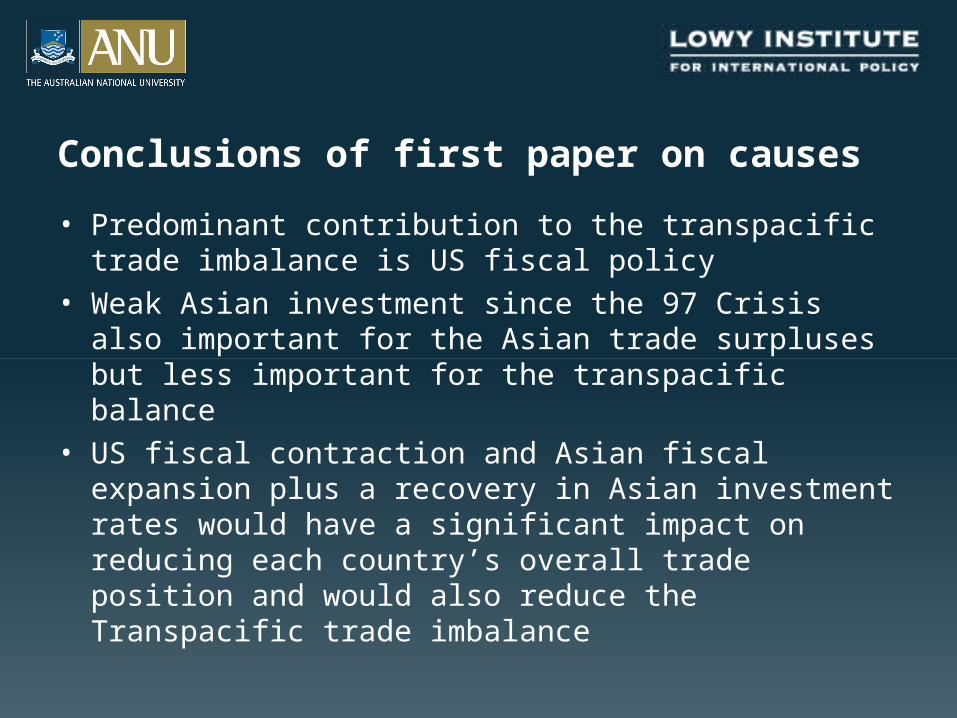
Conclusions of first paper on causes
• Predominant contribution to the transpacific trade imbalance is US fiscal policy
• Weak Asian investment since the 97 Crisis also important for the Asian trade surpluses but less important for the transpacific balance
• US fiscal contraction and Asian fiscal expansion plus a recovery in Asian investment rates would have a significant impact on reducing each country’s overall trade position and would also reduce the Transpacific trade imbalance
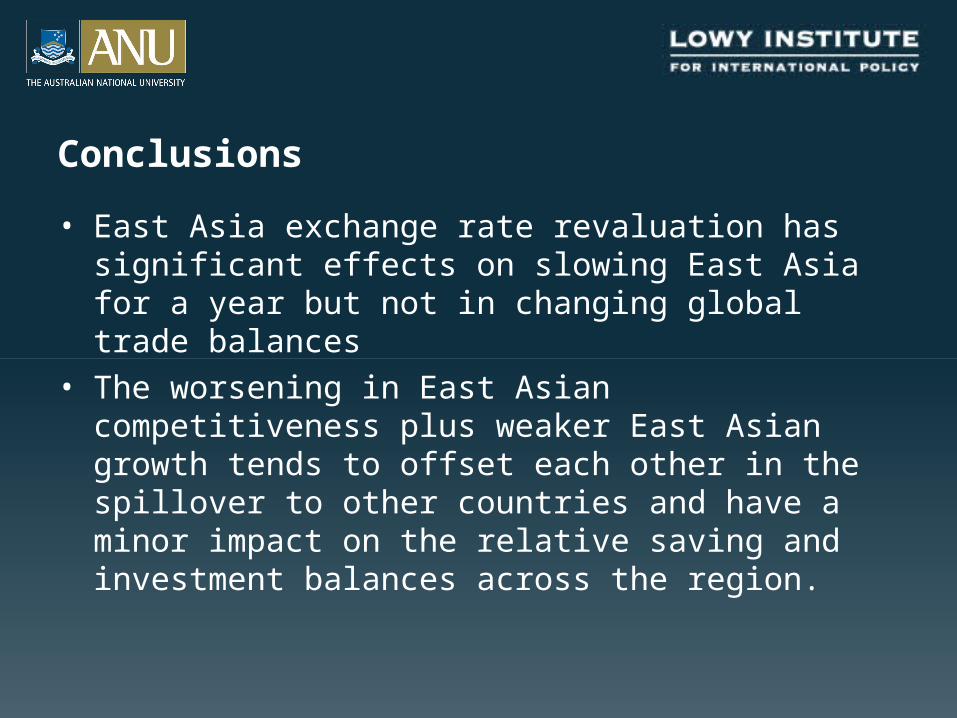
Conclusions
• East Asia exchange rate revaluation has significant effects on slowing East Asia for a year but not in changing global trade balances
• The worsening in East Asian competitiveness plus weaker East Asian growth tends to offset each other in the spillover to other countries and have a minor impact on the relative saving and investment balances across the region.
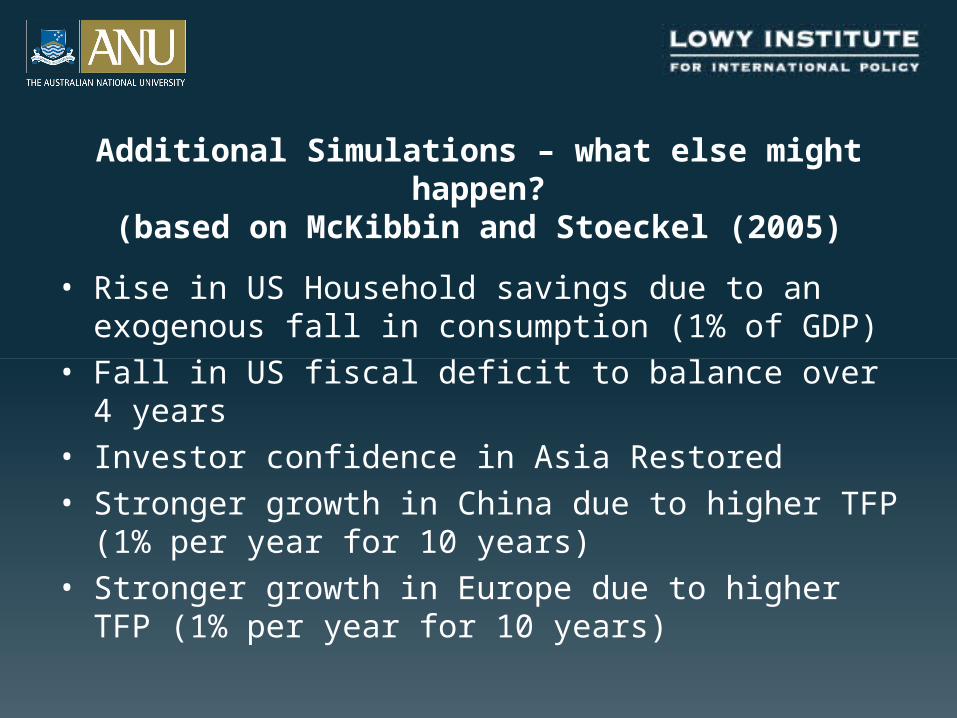
Additional Simulations – what else might happen?(based on McKibbin and Stoeckel (2005)
• Rise in US Household savings due to an exogenous fall in consumption (1% of GDP)
• Fall in US fiscal deficit to balance over 4 years• Investor confidence in Asia Restored• Stronger growth in China due to higher TFP (1% per
year for 10 years)• Stronger growth in Europe due to higher TFP (1% per
year for 10 years)
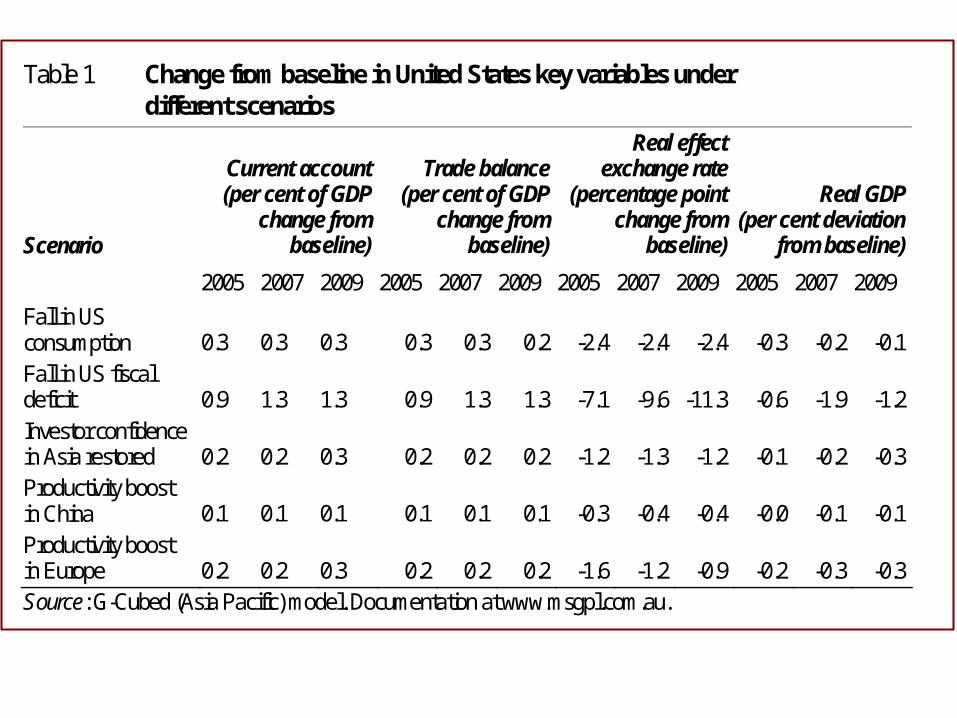
Table 1 Change from baseline in United States key variables under different scenarios
Scenario
Current account (per cent of GDP
change from baseline)
Trade balance (per cent of GDP
change from baseline)
Real effect exchange rate
(percentage point change from
baseline)
Real GDP (per cent deviation
from baseline)
2005 2007 2009 2005 2007 2009 2005 2007 2009 2005 2007 2009 Fall in US consumption 0.3 0.3 0.3 0.3 0.3 0.2 -2.4 -2.4 -2.4 -0.3 -0.2 -0.1 Fall in US fiscal deficit 0.9 1.3 1.3 0.9 1.3 1.3 -7.1 -9.6 -11.3 -0.6 -1.9 -1.2 Investor confidence in Asia restored 0.2 0.2 0.3 0.2 0.2 0.2 -1.2 -1.3 -1.2 -0.1 -0.2 -0.3 Productivity boost in China 0.1 0.1 0.1 0.1 0.1 0.1 -0.3 -0.4 -0.4 -0.0 -0.1 -0.1 Productivity boost in Europe 0.2 0.2 0.3 0.2 0.2 0.2 -1.6 -1.2 -0.9 -0.2 -0.3 -0.3 Source: G-Cubed (Asia Pacific) model. Documentation at www.msgpl.com.au.

Is there a demographic story behind the imbalances?
The Global Macroeconomic Consequences of a Demographic
Transition
Warwick J McKibbin
Centre for Applied Macroeconomic Analysis, RSPAS, ANU;Lowy Institute for International Policy, Sydney
The Brookings Institution, Washington DC;
Prepared for a seminar at the Bank of Korea, Seoul Wednesday May 10 2006
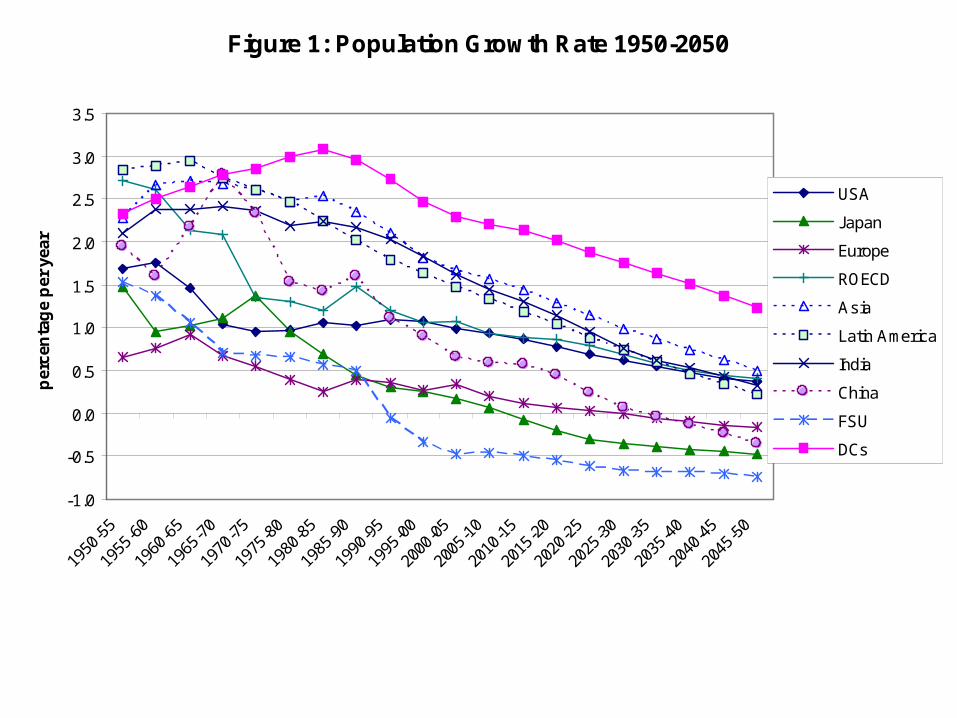
Figure 1: Population Growth Rate 1950-2050
-1.0
-0.5
0.0
0.5
1.0
1.5
2.0
2.5
3.0
3.5
1950
-55
1955
-60
1960
-65
1965
-70
1970
-75
1975
-80
1980
-85
1985
-90
1990
-95
1995
-00
2000
-05
2005
-10
2010
-15
2015
-20
2020
-25
2025
-30
2030
-35
2035
-40
2040
-45
2045
-50
per
cen
tag
e p
er y
ear
USA
Japan
Europe
ROECD
Asia
Latin America
India
China
FSU
DCs
Source: UN, World Population Prospects: The 2004 Revision (Medium Variant)
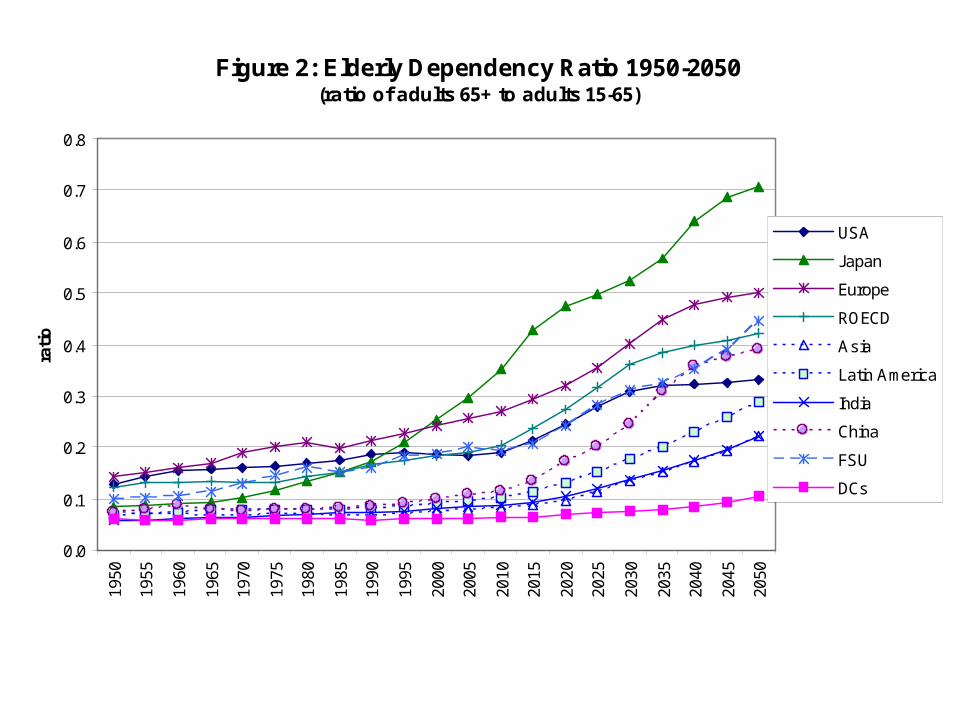
Figure 2: Elderly Dependency Ratio 1950-2050(ratio of adults 65+ to adults 15-65)
0.0
0.1
0.2
0.3
0.4
0.5
0.6
0.7
0.8
1950
1955
1960
1965
1970
1975
1980
1985
1990
1995
2000
2005
2010
2015
2020
2025
2030
2035
2040
2045
2050
rati
o
USA
Japan
Europe
ROECD
Asia
Latin America
India
China
FSU
DCs
Source: UN, World Population Prospects: The 2004 Revision (Medium Variant)
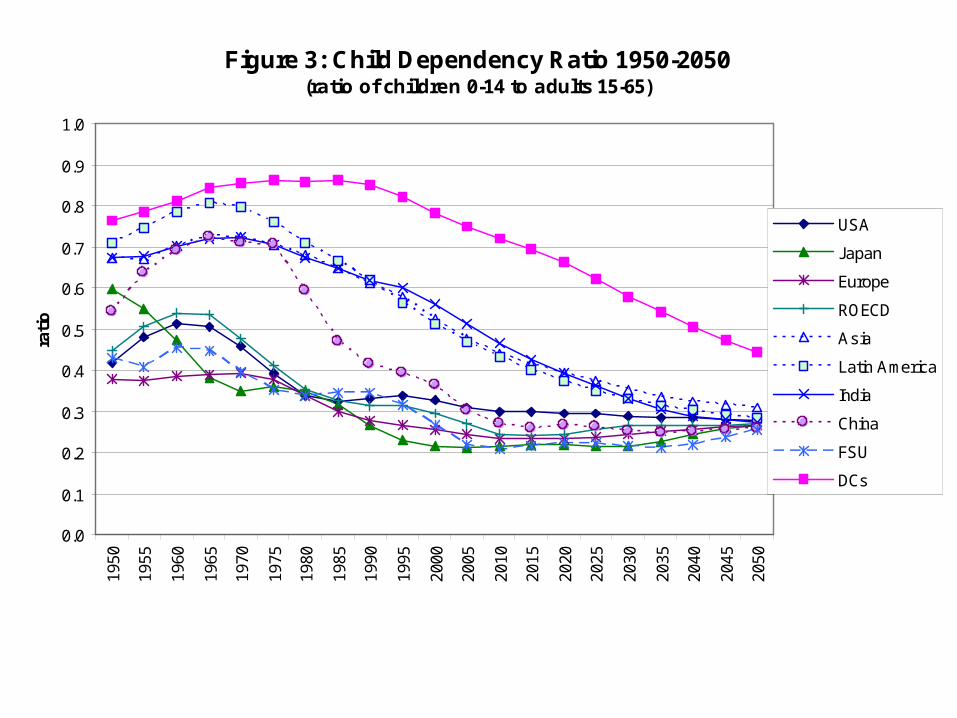
Figure 3: Child Dependency Ratio 1950-2050(ratio of children 0-14 to adults 15-65)
0.0
0.1
0.2
0.3
0.4
0.5
0.6
0.7
0.8
0.9
1.019
50
1955
1960
1965
1970
1975
1980
1985
1990
1995
2000
2005
2010
2015
2020
2025
2030
2035
2040
2045
2050
rati
o
USA
Japan
Europe
ROECD
Asia
Latin America
India
China
FSU
DCs
Source: UN, World Population Prospects: The 2004 Revision (Medium Variant)

Figure 12: Contribution to Current Accounts of Own versus Global Demographic
Change US Current Account/GDP
(relative to no demographic transi tion)
-1
-0.5
0
0.5
1
1.5
2005
2010
2015
2020
2025
2030
2035
2040
2045
2050
% p
oin
t ch
ang
e
global ow n
Japan Current Account/GDP(relative to no demographic transi tion)
0
1
2
3
4
5
2005
2009
2013
2017
2021
2025
2029
2033
2037
2041
2045
2049
% p
oin
t ch
ang
e
global ow n
China Current Account/GDP(relative to no demographic transi tion)
00.10.2
0.30.40.50.6
0.70.8
2005
2009
2013
2017
2021
2025
2029
2033
2037
2041
2045
2049
% p
oin
t ch
ang
e
global ow n
Latin America Current Account/GDP(relative to no demographic transi tion)
-1
-0.5
0
0.5
1
1.5
2005
2009
2013
2017
2021
2025
2029
2033
2037
2041
2045
2049
% p
oin
t ch
ang
e
global ow n
Overall Conclusion
• US current account deficit and corresponding current account surpluses in other countries caused by a variety of factors that affect– Savings and investment changes in the United States
China, East Asia and rest of world
• Exchange rate policy has little to do with changing current account balances which reflect real rather than monetary factors – This is unlikely to be a solution (especially for China)
because it has minor effect on US savings and investment

Background Papers
www.sensiblepolicy.com
www.gcubed.com
Related Documents