Thematic Global Second Quarter 2019 Global house price growth is slowing… …as many of the country-specific booms look to have cooled …but labour markets and low rates should support prices for now Down, but not out Global housing markets

Welcome message from author
This document is posted to help you gain knowledge. Please leave a comment to let me know what you think about it! Share it to your friends and learn new things together.
Transcript

Thematic Global
Second Quarter 2019
� Global house price growth is slowing…
� …as many of the country-specific booms look to have cooled
� …but labour markets and low rates should support prices for now
Down, but not outGlobal housing markets
2
� Global housing growth has slowed recently and remains a key metric to gauge economic strength
� Canada’s housing market seems most at risk, whilst the US and China are proving more resilient
� For now, housing markets do not pose any immediate threat to economic stability
House prices are a key indicator for signs of strength and weakness in an economy and we have seen a slowdown in global house price growth in recent times. In this report, we take stock of the current state of global housing markets in terms of house prices, demand and supply and policy outlook, as well as examine some of the larger housing markets, so as to give investors a better understanding to make informed investment decisions.
Our biggest concerns are in Canada, where monetary tightening could weigh on both the housing market and the broader economy. We believe New Zealand’s housing market also remains vulnerable to shocks, but undersupply should support prices for now.
Australia has already seen a sharp correction in house prices, more in line with fundamentals, in the past year. Nevertheless, this weakness does not seem to have spread to the rest of the economy as the low level of unemployment means there are few signs of distressed sales and overdue loans have remained low.
In the largest economies in the world, there appears to be little to worry about. The US housing data were clearly softer around the turn of the year, but prices haven’t “bubbled” up and the drop in mortgage rates should provide a cushion.
In China, national home sales data may have slowed and house price growth is down in the largest cities, while smaller tier-2 and tier-3 cities are seeing steadier price growth, partly due to government action and partly due to a pick-up in construction.
But overall, at least for now, tight labour markets, positive real wage growth, and low interest rates should keep house price growth steady in most countries. Of course, if these supports change because the unemployment rate rises as the economic outlook sours further, or conversely, central banks start tightening more, we believe that housing markets may start to come under more pressure.
Executive summary

3
Down, but not out
Spotting where house price growth may be at risk is easier in developed markets… most countries seem to be experiencing a healthy, slow, and positive house price growth
…and is growing at 4-5% per year in nominal terms
Global house prices have cooled over the last 18 months…
� Global housing markets have cooled, with fewer booms across the world
� In many places, house prices may be supported by loose policy and falling unemployment…
� …and so these data will be key to follow for signs of vulnerability
Global house prices are cooling…
After the run-up in prices over the past few years, global house price growth has cooled over the past 18 months or so. Nominal prices were up around 4% year-on-year to Q4 2018, with real prices 2 percentage points lower, but global house prices have risen for the past five years even if the pace slowed in 2018.
1. Global house price growth is slowing, not collapsing
Source: Refinitiv Datastream, Dallas Fed. Past performance is not an indication of future performance.
Although the globally comparable Bank of International Settlements (BIS) data is slightly lagged, if we make a global aggregate from the countries who supply timely monthly data, we can see a very similar pattern – with house prices growing at 4-5% per year in nominal terms right now.
Encouragingly, most countries in the world seem to be experiencing relatively healthy, slow, and positive house price growth, which shows signs of continued demand but not a clear bubble in property prices that could pose macro stability risks.
-8-6-4-2024681012
-8-6-4-202468
1012
1975 1978 1981 1984 1987 1990 1993 1996 1999 2002 2005 2008 2011 2014 2017
% Yr% Yr World house prices
Nominal Real
4
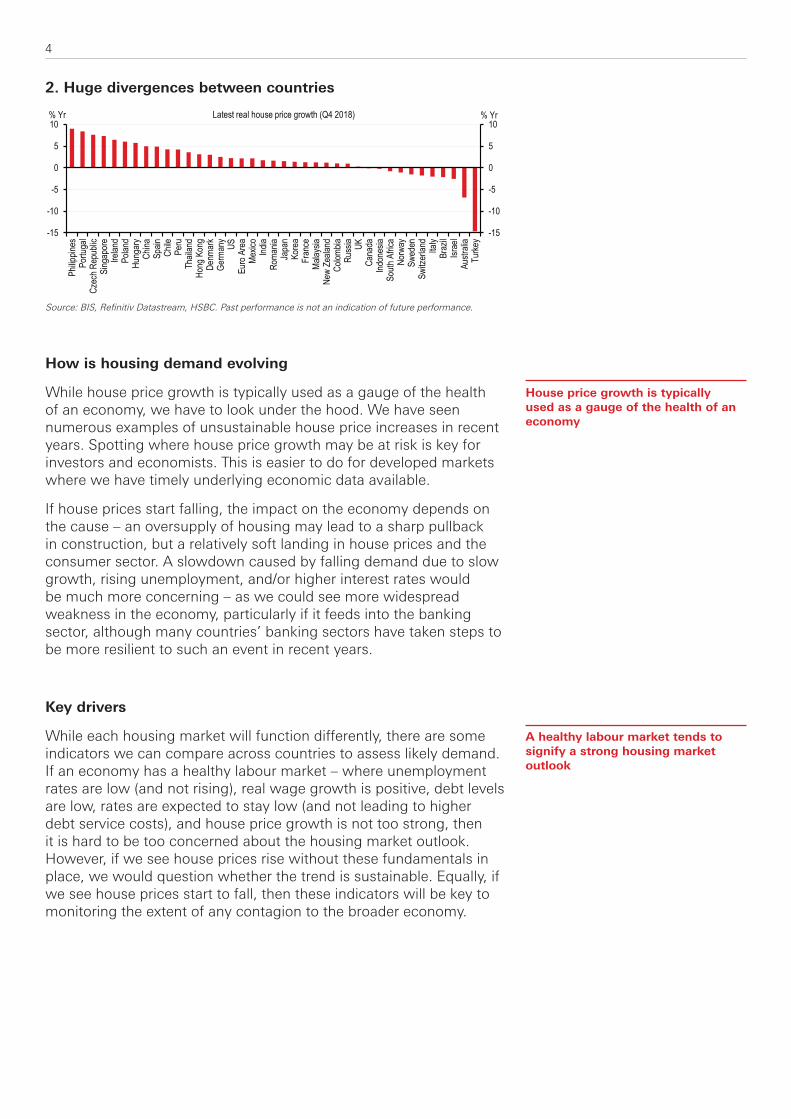
2. Huge divergences between countries
Source: BIS, Refinitiv Datastream, HSBC. Past performance is not an indication of future performance.
How is housing demand evolving
While house price growth is typically used as a gauge of the health of an economy, we have to look under the hood. We have seen numerous examples of unsustainable house price increases in recent years. Spotting where house price growth may be at risk is key for investors and economists. This is easier to do for developed markets where we have timely underlying economic data available.
If house prices start falling, the impact on the economy depends on the cause – an oversupply of housing may lead to a sharp pullback in construction, but a relatively soft landing in house prices and the consumer sector. A slowdown caused by falling demand due to slow growth, rising unemployment, and/or higher interest rates would be much more concerning – as we could see more widespread weakness in the economy, particularly if it feeds into the banking sector, although many countries’ banking sectors have taken steps to be more resilient to such an event in recent years.
Key drivers
While each housing market will function differently, there are some indicators we can compare across countries to assess likely demand. If an economy has a healthy labour market – where unemployment rates are low (and not rising), real wage growth is positive, debt levels are low, rates are expected to stay low (and not leading to higher debt service costs), and house price growth is not too strong, then it is hard to be too concerned about the housing market outlook. However, if we see house prices rise without these fundamentals in place, we would question whether the trend is sustainable. Equally, if we see house prices start to fall, then these indicators will be key to monitoring the extent of any contagion to the broader economy.
House price growth is typically used as a gauge of the health of an economy
A healthy labour market tends to signify a strong housing market outlook
-15
-10
-5
0
5
10
-15
-10
-5
0
5
10
Philip
pines
Portu
gal
Czec
h Rep
ublic
Sing
apor
eIre
land
Polan
dHu
ngar
yCh
inaSp
ainCh
ilePe
ruTh
ailan
dHo
ng K
ong
Denm
ark
Germ
any
USEu
ro A
rea
Mexic
oInd
iaRo
mania
Japa
nKo
rea
Fran
ceMa
laysia
New
Zeala
ndCo
lombia
Russ
ia UKCa
nada
Indon
esia
South
Afric
aNo
rway
Swed
enSw
itzer
land
Italy
Braz
ilIsr
ael
Austr
alia
Turke
y
% Yr% Yr Latest real house price growth (Q4 2018)

5
3. Assessing the fundamentals for the housing market
Source: HSBC, based on data from Refinitiv Datastream and BIS. Note: Markets where we have adequate, timely data, included. BIS do not have data on household debt service ratios for New Zealand and Switzerland. Grey denotes lowest risk, Red denotes highest risk. Data are all latest available data points.
Supply issues
While the demand side of the housing equation is easier to analyse, the supply side is important too. Legislation aimed at raising the supply of housing carries the benefit of creating jobs and supporting growth in the short term, as well as limiting the extent to which house price bubbles can appear in the economy.
In 2018, we saw an almost universal slowdown in housing construction globally. Sweden, Canada, Australia, and the US all have negative residential construction growth on a six-monthly rolling basis, while the Australian average masks a far sharper run-up in both Victoria and New South Wales between 2012 and 2017.
4. Construction booms have cooled
Source: Refinitiv Datastream
Fewer concerns in many countries
The cooling of many of the biggest housing markets could be seen as a positive for economists concerned by financial stability issues. The biggest question is how this slowdown feeds into the wider economy, and that will clearly vary by country. In Australia, lower house prices could have a limited impact as long as the labour market does not weaken much more from here, whereas Canada, New Zealand, and South Korea may face bigger hurdles, with rising debt service costs (Canada and South Korea) and weaker growth (New Zealand and South Korea), which could put house prices under pressure in the near term.
Cooling housing markets can be positive for financial stability but it depends how the slowdown feeds into the economy
75100125150175200225250275300325
75100125150175200225250275300325
2012 2013 2014 2015 2016 2017 2018 2019
Index (2012=100)Index (2012=100) Housing Starts
Canada US UK Norway Australia Japan Sweden

6
On a similar basis, we are less concerned about the US housing market from a financial stability perspective as it has not ‘bubbled’ up like we saw in some smaller developed markets.
Concerns about unsustainable house price growth and consumer leverage have dissipated in the past few years, and are now in the bottom left of this chart, where the challenge is very different. The question is now whether the economies can weather this slowdown.
5. Broader financial stability concerns are dissipating for many countries
Source: BIS, HSBC. Note: Bubble size refers to the level of household debt to GDP based on latest data. Past performance is not an indication of future performance.
Australia
Brazil Canada
Chile
Colombia
China
Czech
Denmark
France
Germany
IndiaIndonesiaIsrael
Italy
Japan
Malaysia
Mexico
Netherlands
New Zealand
Norway
Poland
Russia
South Africa
Korea
Spain
SwedenSwitzerland
Thailand
UKUS
-8
-6
-4
-2
0
2
4
6
8
10
-4 -2 0 2 4 6 82-year change in real house prices (% ann.)
2-ye
ar ch
ange
in ho
useh
old de
bt/GD
P ra
tio (p
pts)
Financial stability risks growing
Falling house prices and deleveraging
pose threat
Concerns about unsustainable house growth and consumer leverage have reduced

7
� Global policy rates could remain supportive for housing markets
� Macroprudential policies could see greater use to cool demand
� Limits to borrowing and maximum loan-to-value limits have been amongst the most common policies implemented
The global policy rate outlook should be supportive for housing markets with financial markets not expecting much to come in the way of further central bank tightening. Despite this, alternative policy measures could play a role in a world of persistently low rates and an environment that could be supportive of housing demand.
Leaning against the wind
The Norges Bank published a paper in 20161 which suggests that ‘leaning against the wind’ in terms of raising rates to prevent financial instability can be a good idea. They find that the “benefits of leaning against the wind in terms of a lower frequency of severe financial recessions exceed costs in terms of higher volatility in output and in inflation in normal times”. Australia also had some experience with leaning against the wind during the 2002 and 2003 housing price boom2.
However, in recent years, many central banks have chosen a different approach, and with inflation persistently undershooting targets, these policy makers have cut rates in the post-crisis period. Some central banks may also be opposed to raising interest rates, fearing it might lead to currency strength and subsequent disinflationary pressures. Failing to meet inflation objectives has led to policy rates being held lower than might seem justified given robust growth and growing financial imbalances.
Regulate more?
A legislative approach may be market-distorting but could work as a non-monetary policy measure to cool demand. In the UK, changes to the tax regime for buy-to-let mortgages have discouraged people from buying second homes. In Canada, the additional tax levied on foreign purchases in Vancouver and subsequently in Toronto has also been aimed at cooling the market. Australia has recently taken macroprudential policy the other way, with the Australian Prudential Regulatory Authority (APRA) announcing a proposal to lower the serviceability test for new borrowers.
The policy outlook
Some countries have changed laws to cool demand
Some central banks have been opposed to raising interest rates
Global policy rates should be supportive for housing markets
1 Karsten R. Gerdrup, Frank Hansen, Tord Krogh and Junior Maih, Leaning against the wind when credit bites back, Norges Bank working paper 9/20162 For more on this see Bloxham, P, Kent, C. and Robson, M. (2010) ‘Asset prices, credit growth, monetary and other policies: An Australian case study’, NBER working paper 168455

8
New tools replaced by the old?
In light of this struggle to balance below-target inflation and more pressing stability risks, many central banks and regulators have turned to a range of macroprudential policy measures over the past few years. The most common so far have been limits to borrowing, from maximum Loan-To-Value (LTV) limits to countercyclical capital buffers which require banks to increase capital during times of rapid credit growth (refer to Appendix 1 for full list).
So far, the experiences have been over a short timeframe, and those countries where we have seen the broadest use of macroprudential policy have also seen house prices rise most sharply in recent years. However, regulators in Australia and New Zealand have clearly stated that the aim is to reduce risk in the financial system by ensuring a lower risk allocation of new household debt. In a similar vein, the International Monetary Fund (IMF) suggests that macroprudential policy in Europe has helped to make the housing market more resilient3, but in the case of Sweden, many of these policies failed to quell the rapid run-up in house prices between 2012 and 2018 – it was only higher supply that caused house prices to fall.
6. Macroprudential policy didn’t stop Sweden’s housing market, at least at first
Please see Frank Will in Covered Bonds: White-water Rafting, March 2017 for the original version of this chart. We have updated with recent data and policy measures. Source: Thomson Reuters Datastream, HSBC
However, these policies have been used against a backdrop of even looser monetary policy – and so their efficacy may improve if adopted in conjunction with tighter or stable policy rates.
Many regulators are turning to macroprudential policy measures to control demand
Efficacy of these approaches may improve with higher interest rates
3 Macroprudential Policies and House Prices in Europe: An Overview of Recent Experiences, International Monetary Fund, November 2018
LTV Cap 85%
Amortisation requirements on all loans >75% LTV
15% risk weight floor on mortgages
Amortisation recommendation increased
Risk weight floor on mortgages increased to
25%
Countercyclical capital
buffer increased to 1.5%
Amortisation requirements down to 50% LTV
Countercyclical capital buffer increased to 2.0%
Countercyclical capital buffer increased to 2.5%
100
125
150
175
200
225
250
100
125
150
175
200
225
250
2005 2006 2007 2008 2009 2010 2011 2012 2013 2014 2015 2016 2017 2018 2019
Index: 2005=100Index: 2005=100 Sweden: House prices
9
� We take a deeper look into housing markets in larger markets
� The US and China housing markets should remain resilient
� We see sluggish growth in the UK and risks are present in Canada
Most of the exciting stories in global housing markets are in small countries: with the booms and busts coming in small developed markets. However, there are also some interesting stories developing in the biggest markets in the world:
US
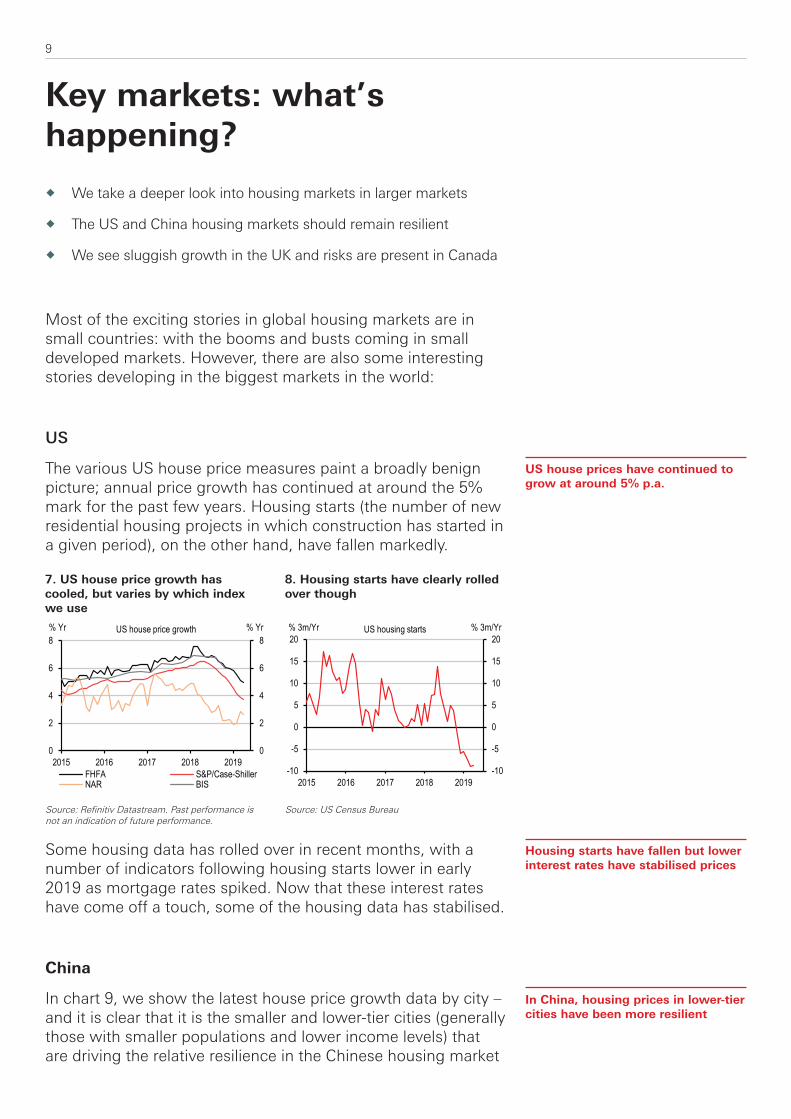
The various US house price measures paint a broadly benign picture; annual price growth has continued at around the 5% mark for the past few years. Housing starts (the number of new residential housing projects in which construction has started in a given period), on the other hand, have fallen markedly.
Some housing data has rolled over in recent months, with a number of indicators following housing starts lower in early 2019 as mortgage rates spiked. Now that these interest rates have come off a touch, some of the housing data has stabilised.
China
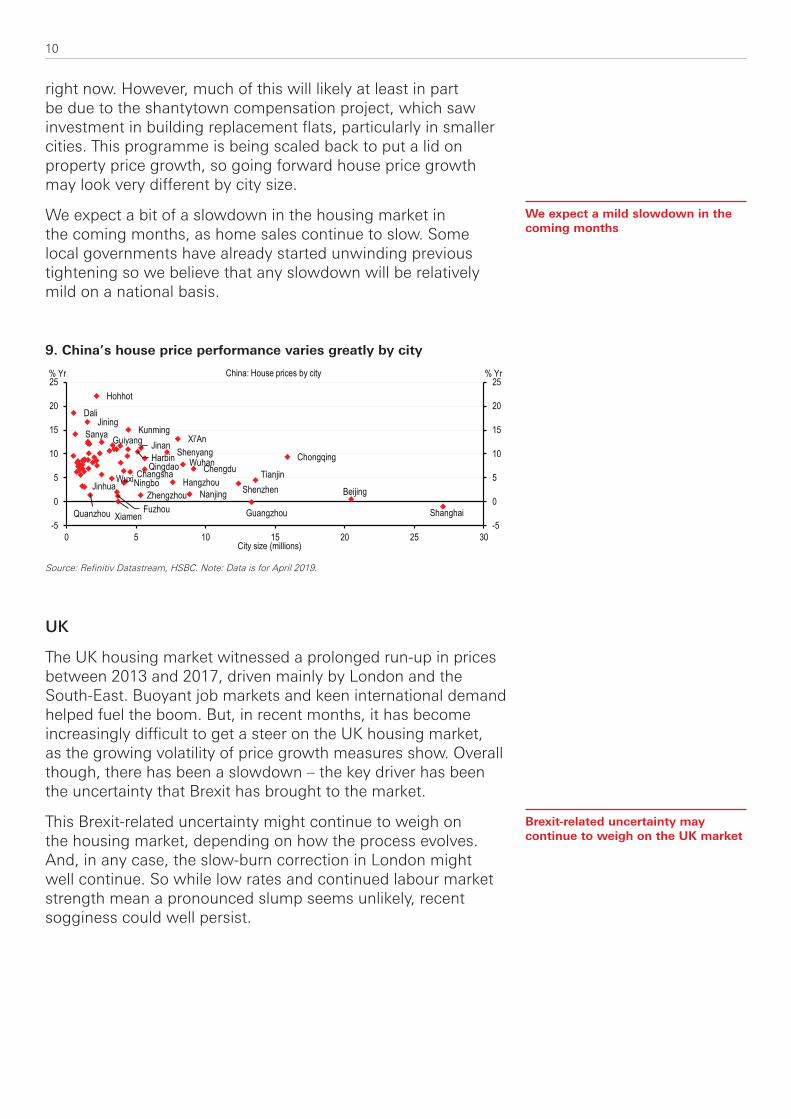
In chart 9, we show the latest house price growth data by city – and it is clear that it is the smaller and lower-tier cities (generally those with smaller populations and lower income levels) that are driving the relative resilience in the Chinese housing market
Key markets: what’s happening?
Housing starts have fallen but lower interest rates have stabilised prices
US house prices have continued to grow at around 5% p.a.
In China, housing prices in lower-tier cities have been more resilient
7. US house price growth has cooled, but varies by which index we use
8. Housing starts have clearly rolled over though
Source: US Census BureauSource: Refinitiv Datastream. Past performance is not an indication of future performance.
2015 2016 2017 2018 20190
2
4
6
8
0
2
4
6
8% Yr% Yr
FHFA S&P/Case-ShillerNAR BIS
US house price growth
2015 2016 2017 2018 2019-10
-5
0
5
10
15
20
-10
-5
0
5
10
15
20% 3m/Yr% 3m/Yr US housing starts
10
right now. However, much of this will likely at least in part be due to the shantytown compensation project, which saw investment in building replacement flats, particularly in smaller cities. This programme is being scaled back to put a lid on property price growth, so going forward house price growth may look very different by city size.
We expect a bit of a slowdown in the housing market in the coming months, as home sales continue to slow. Some local governments have already started unwinding previous tightening so we believe that any slowdown will be relatively mild on a national basis.
9. China’s house price performance varies greatly by city
Source: Refinitiv Datastream, HSBC. Note: Data is for April 2019.
UK
The UK housing market witnessed a prolonged run-up in prices between 2013 and 2017, driven mainly by London and the South-East. Buoyant job markets and keen international demand helped fuel the boom. But, in recent months, it has become increasingly difficult to get a steer on the UK housing market, as the growing volatility of price growth measures show. Overall though, there has been a slowdown – the key driver has been the uncertainty that Brexit has brought to the market.
This Brexit-related uncertainty might continue to weigh on the housing market, depending on how the process evolves. And, in any case, the slow-burn correction in London might well continue. So while low rates and continued labour market strength mean a pronounced slump seems unlikely, recent sogginess could well persist.
Brexit-related uncertainty may continue to weigh on the UK market
Beijing
Shanghai
Shenzhen
Quanzhou
ChengduHangzhou
Wuhan Chongqing
Nanjing
Tianjin
Xi'An
Changsha
ShenyangQingdao
ZhengzhouNingbo
XiamenFuzhou
Wuxi
Kunming
HarbinJinanGuiyang
Jinhua
Sanya
Hohhot
Jining
Guangzhou
Dali
-5
0
5
10
15
20
25
-5
0
5
10
15
20
25
0 5 10 15 20 25 30
% Yr% Yr
City size (millions)
China: House prices by city
We expect a mild slowdown in the coming months
11
Canada
In Canada, house price growth has slowed sharply in the past two years, driven mostly by the introduction of taxes on foreign real estate buyers in August 2016 and April 2017. Additionally, in January 2018, mortgage lending regulations were tightened, and more vigorous stress tests for potential borrowers were put in place.
Home prices remain historically high, both in real terms and relative to disposable income. Meanwhile, owing to past borrowing and rising interest rates, debt service charges are also near historic highs. Thus far the strong job market has kept households from falling behind. However, it usually takes about two years for interest rate increases to begin to affect arrears. As the Bank of Canada started to raise rates in mid-2017, households and the housing market face financial challenges through mid-2019 and beyond. So long as the job market remains strong, we would only expect any increase in arrears to be quite small. That said, the low arrears rate might not give a reliable measure of the financial situation of the household sector.
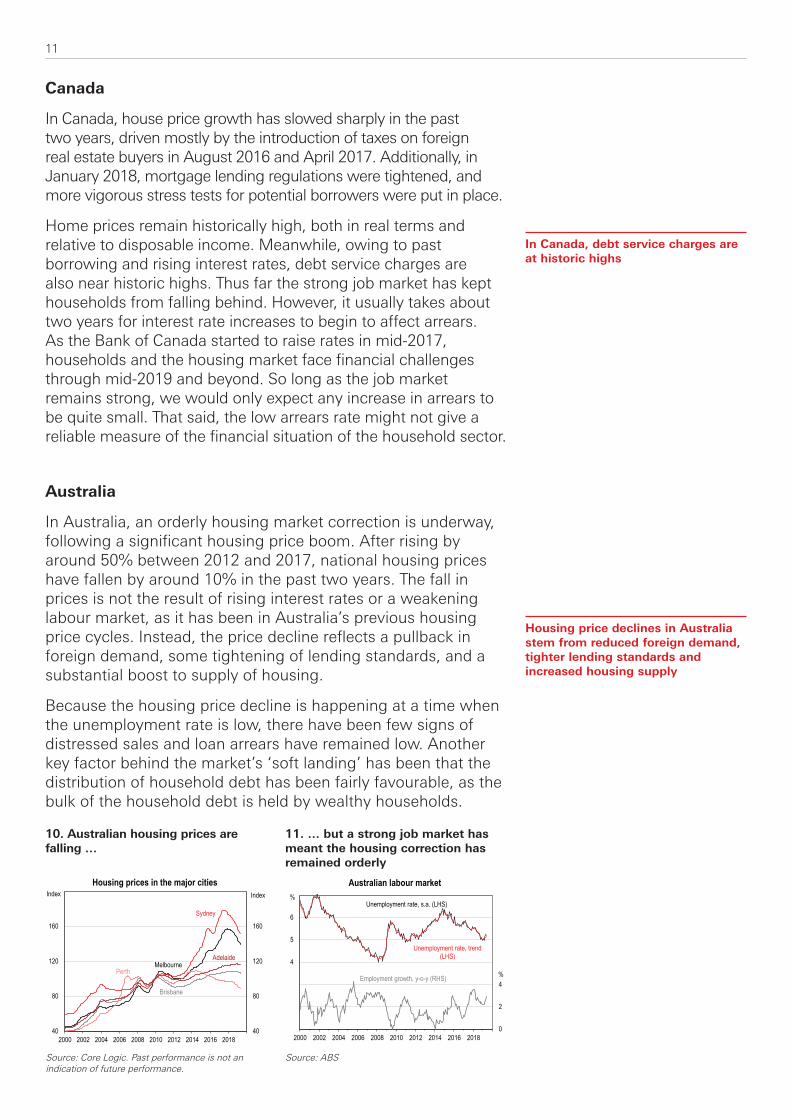
Australia
In Australia, an orderly housing market correction is underway, following a significant housing price boom. After rising by around 50% between 2012 and 2017, national housing prices have fallen by around 10% in the past two years. The fall in prices is not the result of rising interest rates or a weakening labour market, as it has been in Australia’s previous housing price cycles. Instead, the price decline reflects a pullback in foreign demand, some tightening of lending standards, and a substantial boost to supply of housing.
Because the housing price decline is happening at a time when the unemployment rate is low, there have been few signs of distressed sales and loan arrears have remained low. Another key factor behind the market’s ‘soft landing’ has been that the distribution of household debt has been fairly favourable, as the bulk of the household debt is held by wealthy households.
Housing price declines in Australia stem from reduced foreign demand, tighter lending standards and increased housing supply
In Canada, debt service charges are at historic highs
10. Australian housing prices are falling …
11. … but a strong job market has meant the housing correction has remained orderly
Source: ABSSource: Core Logic. Past performance is not an indication of future performance.
0
2
4
6
8
10
12
1
2
3
4
5
6
2000 2002 2004 2006 2008 2010 2012 2014 2016 2018
Australian labour market%
%
Unemployment rate, trend (LHS)
Unemployment rate, s.a. (LHS)
Employment growth, y-o-y (RHS)
40
80
120
160
40
80
120
160
2000 2002 2004 2006 2008 2010 2012 2014 2016 2018
Housing prices in the major cities
Melbourne
Sydney
Brisbane
Perth
Adelaide
Index Index

12
Auckland has led the slowdown in New Zealand housing price growth
New Zealand
After rising at annual average rates of around 10% a year from 2012 to 2017, national housing price growth slowed to around 2% in 2018. The slowdown has been led by Auckland, where prices have levelled out over the past two years, after having risen by around 90% over the previous five years.
The cooling of the Auckland housing market reflects a combination of pullback in foreign demand, a tightening of prudential settings in recent years and reduced affordability from the previous price rises. The housing market has cooled despite continued low interest rates and a tight labour market. A key feature of the Auckland housing market is that it is still significantly undersupplied. While this remains the case, we do not expect material housing price falls, unless there is some other negative economic shock to the economy.
12. Housing price growth has slowed
13. Auckland has a large housing undersupply
Source: Statistics New Zealand; HSBCSource: Refinitiv Datastream. Past performance is not an indication of future performance.
-40
-30
-20
-10
0
10
20
-40
-30
-20
-10
0
10
20
1997 1999 2001 2003 2005 2007 2009 2011 2013 2015 2017 2019f
Auckland housing supply and demandAnnual, June years
Growth in population (# of households)
New dwellings consented
Cumulative surplus/deficit
000s 000s
0
250
500
750
1000
1250
0
250
500
750
1000
1250
2004 2006 2008 2010 2012 2014 2016 2018
House Prices - Major CitiesAverage sale price, 3mma, NZD '000s
Auckland
Wellington
Christchurch
Dunedin
13
� Global house prices have been cooling
� This can be positive for financial stability but it depends how the slowdown filters into the rest of the economy
� We expect the US and China housing markets to stay relatively stable whilst risks are present in Canada
Housing prices are a key metric for investors to watch to gauge the strength of an economy. Over the last 18 months, we have seen prices slow although performance has varied between countries.
This cooling market can be seen as a positive for financial stability issues but it depends on how the slowdown feeds into the wider economy. Housing prices have fallen in Australia and Sweden with limited impact on household spending and employment so far. But Canada and New Zealand may face the biggest hurdles with debt service costs rising.
Policy rates should remain supportive with financial markets not expecting much in the way of central bank tightening. However, given persistently low inflation, some central banks have been opposed to raising rates and instead have implemented new legislation and macroprudential measures (e.g. loan-to-value ratio limits) to cool demand.
In the larger markets, we see housing price growth remaining resilient in the US supported by lower interest rates expectations whilst in China, we expect a mild slowdown on a national basis with prices supported by an unwinding of previous tightening restrictions. The UK housing market should see recent sogginess persist.
Conclusion
14
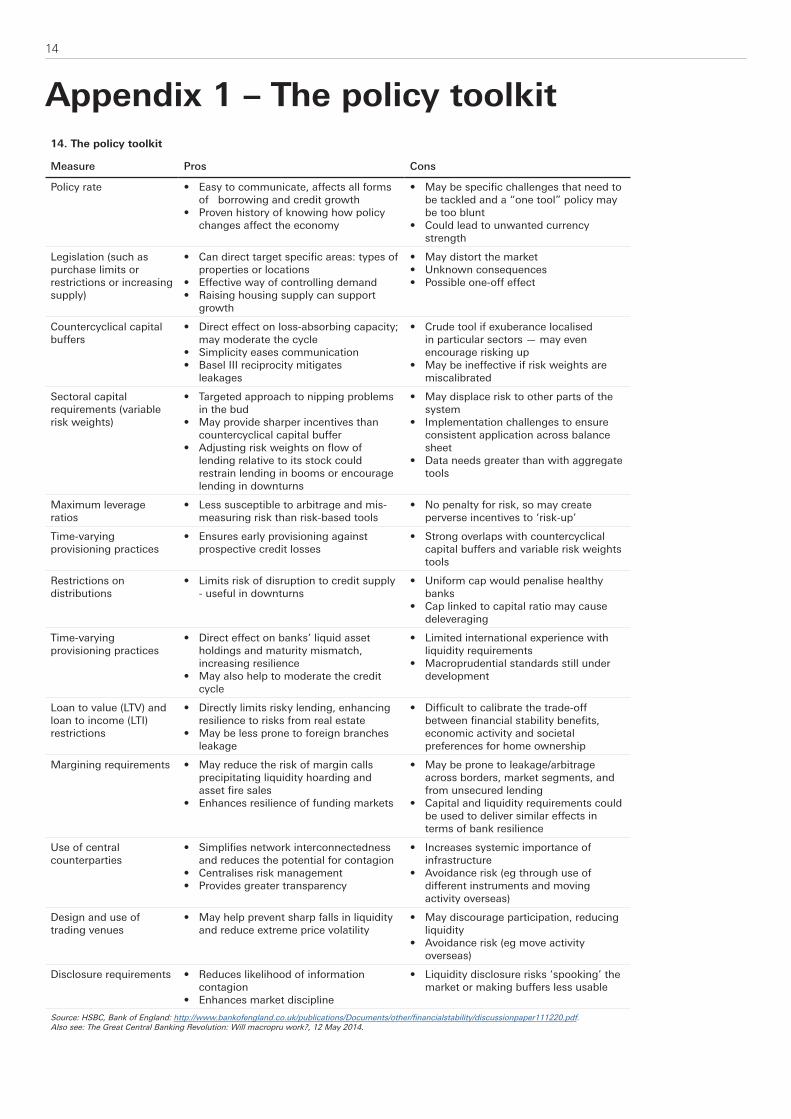
Appendix 1 – The policy toolkit14. The policy toolkit
Measure Pros Cons
Policy rate • Easy to communicate, affects all forms of borrowing and credit growth
• Proven history of knowing how policy changes affect the economy
• May be specific challenges that need to be tackled and a “one tool” policy may be too blunt
• Could lead to unwanted currency strength
Legislation (such as purchase limits or restrictions or increasing supply)
• Can direct target specific areas: types of properties or locations
• Effective way of controlling demand• Raising housing supply can support
growth
• May distort the market• Unknown consequences• Possible one-off effect
Countercyclical capital buffers
• Direct effect on loss-absorbing capacity; may moderate the cycle
• Simplicity eases communication• Basel III reciprocity mitigates
leakages
• Crude tool if exuberance localised in particular sectors — may even encourage risking up
• May be ineffective if risk weights are miscalibrated
Sectoral capital requirements (variable risk weights)
• Targeted approach to nipping problems in the bud
• May provide sharper incentives than countercyclical capital buffer
• Adjusting risk weights on flow of lending relative to its stock could restrain lending in booms or encourage lending in downturns
• May displace risk to other parts of the system
• Implementation challenges to ensure consistent application across balance sheet
• Data needs greater than with aggregate tools
Maximum leverage ratios
• Less susceptible to arbitrage and mis-measuring risk than risk-based tools
• No penalty for risk, so may create perverse incentives to ‘risk-up’
Time-varying provisioning practices
• Ensures early provisioning against prospective credit losses
• Strong overlaps with countercyclical capital buffers and variable risk weights tools
Restrictions on distributions
• Limits risk of disruption to credit supply - useful in downturns
• Uniform cap would penalise healthy banks
• Cap linked to capital ratio may cause deleveraging
Time-varying provisioning practices
• Direct effect on banks’ liquid asset holdings and maturity mismatch, increasing resilience
• May also help to moderate the credit cycle
• Limited international experience with liquidity requirements
• Macroprudential standards still under development
Loan to value (LTV) and loan to income (LTI) restrictions
• Directly limits risky lending, enhancing resilience to risks from real estate
• May be less prone to foreign branches leakage
• Difficult to calibrate the trade-off between financial stability benefits, economic activity and societal preferences for home ownership
Margining requirements • May reduce the risk of margin calls precipitating liquidity hoarding and asset fire sales
• Enhances resilience of funding markets
• May be prone to leakage/arbitrage across borders, market segments, and from unsecured lending
• Capital and liquidity requirements could be used to deliver similar effects in terms of bank resilience
Use of central counterparties
• Simplifies network interconnectedness and reduces the potential for contagion
• Centralises risk management• Provides greater transparency
• Increases systemic importance of infrastructure
• Avoidance risk (eg through use of different instruments and moving activity overseas)
Design and use of trading venues
• May help prevent sharp falls in liquidity and reduce extreme price volatility
• May discourage participation, reducing liquidity
• Avoidance risk (eg move activity overseas)
Disclosure requirements • Reduces likelihood of information contagion
• Enhances market discipline
• Liquidity disclosure risks ‘spooking’ the market or making buffers less usable
Source: HSBC, Bank of England: http://www.bankofengland.co.uk/publications/Documents/other/financialstability/discussionpaper111220.pdf. Also see: The Great Central Banking Revolution: Will macropru work?, 12 May 2014.

15
Appendix 2 – Snapshot: Key house price data and drivers
Source: HSBC, Refintiv Datastream, BIS. Note: * Construction is the GDP component where available, otherwise is housing starts. Past performance is not an indication of future performance.
Arg
entin
a
Aus
tral
ia
Bra
zil
Can
ada
Chi
le
Chi
na
Col
ombi
a
Eur
ozon
e
Fra
nce
Ger
man
y
Hon
g K
ong
Indi
a
Indo
nesi
a
Ital
y
Jap
an
Mal
aysi
a
Mex
ico
New
Zea
land
Nor
way
Phi
lippi
nes
Pol
and
Rus
sia
Sau
di A
rabi
a
Sin
gapo
re
Sou
th A
fric
a
Sou
th K
orea
Spa
in
Sw
eden
Sw
itzer
land
Tai
wan
Tha
iland
Tur
key
UK
US
House PricesBIS House price (Nominal) - -5.1 1.9 2.0 7.2 7.2 4.3 4.2 3.2 4.6 5.8 5.7 3.0 -0.6 2.5 1.6 7.1 3.1 2.3 15.5 7.6 4.9 - 7.9 4.1 3.2 6.7 0.6 -0.9 - 4.5 4.5 2.5 4.5(Q4 2018)
BIS House price (Real) - -6.8 -2.1 -0.1 4.3 5.0 1.1 2.2 1.3 2.5 3.1 1.8 -0.2 -2.0 1.6 1.3 2.2 1.2 -1.0 9.0 6.1 1.0 - 7.3 -0.8 1.4 4.9 -1.5 -1.8 - 3.6 -14.6 0.3 2.3(Q4 2018)
National House price growth - -5.5 0.0 0.1 5.0 4.3 9.2 4.2 3.2 7.8 2.4 5.6 1.8 -0.6 2.2 1.6 10.0 1.2 2.2 - 7.6 3.1 -5.8 3.1 - 1.9 4.5 -0.3 -0.1 2.1 6.3 3.5 1.4 3.7(% Yr)
(Dec
-18)
(Mar
-19)
(Mar
-19)
(Mar
-19)
(Apr
-19)
(Jan
-17)
(Dec
-18)
(Dec
-18)
(Apr
-19)
(Dec
-18)
(Sep
-18)
(Jun
-19)
(Dec
-18)
(Feb
-19)
(Dec
-16)
(Sep
-18)
(Apr
-19)
(Apr
-19)
(Dec
-18)
(Mar
-19)
(Mar
-19)
(Mar
-19)
(May
-19)
(Mar
-19)
(Mar
-19)
(Mar
-19)
(Mar
-19)
(Apr
-19)
(Mar
-19)
(Mar
-19)
(Mar
-19)
Household debt (% GDP, Q3 2018) 7 121 27 100 - 52 26 58 60 53 71 11 17 41 58 67 16 93 101 - 35 17 12 55 33 97 60 89 129 - 68 16 87 76
ConstructionConstruction growth* (% Yr) -13.8 -3.2 0.3 -7.5 2.7 6.2 1.7 2.6 1.1 4.7 -3.5 9.6 5.5 5.5 -2.8 0.3 -2.7 3.1 2.6 5.0 2.2 -5.7 -3.4 -4.8 44.6 -7.1 3.1 -11.3 0.8 2.3 3.1 -16.0 1.6 -8.9
(Q4
18)
(Q1
19)
(Q1
19)
(Q4
18)
(Q1
19)
(Q1
19)
(Q1
19)
(Q4
18)
(Q1
19)
(Q1
19)
(Q1
19)
(Q4
18)
(Q1
19)
(Q1
19)
(Q4
18)
(Q1
19)
(Q4
18)
(Q4
18)
(Q1
19)
(Q1
19)
(Q1
19)
(Q1
19)
(Q4
18)
(Q1
19)
(Q1
19)
(Q4
18)
(Q1
19)
(Q1
19)
(Q1
19)
(Q1
19)
(Q1
19)
(Q1
19)
(Q1
19)
(Q1
19)
Policy RateNominal Policy rate (%) 63.2 1.5 6.5 1.8 3.0 4.4 4.3 0.0 0.0 0.0 2.8 6.0 6.0 0.0 -0.1 3.0 8.3 1.5 1.0 4.5 1.5 7.8 3.0 - 6.8 1.8 0.0 -0.3 -0.8 1.4 1.8 24.0 0.8 2.4Real policy rate (%) 5.2 0.2 1.6 -0.3 1.0 3.7 1.0 -1.7 -1.3 -2.0 -0.2 3.1 3.2 -1.1 -1.0 2.8 3.8 0.3 -1.9 1.7 -0.7 2.6 5.1 - 2.4 1.2 -1.5 -2.4 -1.5 0.7 0.5 4.5 -1.4 0.4Economic BackdropGDP growth (% Yr) -6.5 2.3 0.4 1.6 1.9 6.4 2.3 1.2 1.2 0.7 0.6 6.8 5.0 -0.1 0.8 4.5 0.1 2.5 1.4 5.7 5.7 2.9 - 1.1 0.1 1.8 2.4 2.0 1.4 1.7 2.8 -3.5 1.8 3.2
(Q4
18)
(Q4
18)
(Q1
19)
(Q4
18)
(Q1
19)
(Q1
19)
(Q1
19)
(Q1
19)
(Q1
19)
(Q1
19)
(Q1
19)
(Q2
19)
(Q1
19)
(Q1
19)
(Q1
19)
(Q1
19)
(Q1
19)
(Q4
18)
(Q1
19)
(Q1
19)
(Q3
18)
(Q4
18)
(Q1
19)
(Q4
18)
(Q1
19)
(Q1
19)
(Q1
19)
(Q1
19)
(Q1
19)
(Q1
19)
(Q2
19)
(Q1
19)
(Q1
19)
Consumer Confidence -1.0 0.1 1.3 0.2 -0.1 1.3 -0.1 -0.1 0.1 -0.7 - 1.5 1.4 -0.2 -2.5 0.4 2.1 -1.6 0.4 -0.2 1.3 - - - 0.4 -0.8 0.4 -2.3 0.2 -0.6 0.5 -0.8 -0.5 1.2(z-score)
(May
-19)
(May
-19)
(Apr
-19)
(May
-19)
(Q1
19)
(Apr
-19)
(Apr
-19)
(May
-19)
(May
-19)
(May
-19)
(Q2
19)
(Apr
-19)
(May
-19)
(May
-19)
(Q1
19)
(Apr
-19)
(Q1
19)
(Q2
19)
(Q1
19)
(May
-19)
(Q2
19)
(May
-19)
(May
-19)
(May
-19)
(Q2
19)
(May
-19)
(Apr
-19)
(May
-19)
(May
-19)
(May
-19)
Employment growth (% Yr) 2.2 2.3 1.3 3.1 0.8 -1.4 0.5 1.3 0.7 1.4 -0.1 - 2.5 0.6 1.1 2.2 2.4 1.6 1.2 -0.9 3.0 -0.3 - 1.3 1.6 0.7 3.2 1.4 1.3 0.7 0.9 -0.7 1.2 1.8
(Q2
18)
(Q1
19)
(Q1
19)
(Q1
19)
(Q1
19)
(201
7)
(Q1
19)
(Q1
19)
(Q1
19)
(Q1
19)
(Q1
19)
(201
8)
(Q1
19)
(Q1
19)
(Q1
19)
(Q1
19)
(Q1
19)
(Q1
19)
(Q1
19)
(Q1
19)
(201
7)
(201
8)
(Q4
18)
(Q1
19)
(Q1
19)
(Q1
19)
(Q1
19)
(Q1
19)
(Q1
19)
(Q4
18)
(Q4
18)
(Q1
19)
Real wage growth (% Yr) - 0.5 1.1 0.8 1.1 - -3.1 0.3 -0.3 1.6 1.5 -2.5 7.8 0.7 -0.6 7.3 -3.7 0.5 -0.4 -3.8 5.7 2.9 2.1 2.3 2.0 2.1 0.5 0.2 0.7 0.6 1.3 -5.3 1.3 1.6
(Q4
17)
(Q1
19)
(Q1
19)
(Q4
18)
(Q1
19)
(Q4
18)
(Q4
18)
(Q1
19)
(Q4
18)
(Q1
19)
(Q3
17)
(Q1
19)
(Q1
19)
(Q1
19)
(Q4
18)
(Q1
19)
(Q4
18)
(Q1
19)
(Q1
19)
(Q1
19)
(Q1
19)
(Q4
18)
(Q4
18)
(Q1
19)
(Q1
19)
(Q1
19)
(Q3
16)
(Q1
19)
(Q1
19)
(Q1
19)
(Q1
19)
(Q1
19)
16
1. This report is dated as at 26 June 2019.
2. All market data included in this report are dated as at close 30 May 2019, unless a different date and/or a specific time of day is indicated in the report.
3. HSBC has procedures in place to identify and manage any potential conflicts of interest that arise in connection with its Research business. HSBC’s analysts and its other staff who are involved in the preparation and dissemination of Research operate and have a management reporting line independent of HSBC’s Investment Banking business. Information Barrier procedures are in place between the Investment Banking, Principal Trading, and Research businesses to ensure that any confidential and/or price sensitive information is handled in an appropriate manner.
4. You are not permitted to use, for reference, any data in this document for the purpose of (i) determining the interest payable, or other sums due, under loan agreements or under other financial contracts or instruments, (ii) determining the price at which a financial instrument may be bought or sold or traded or redeemed, or the value of a financial instrument, and/or (iii) measuring the performance of a financial instrument.
Disclosure appendix
DisclaimerThis document is prepared by The Hongkong and Shanghai Banking Corporation Limited (‘HBAP’), 1 Queen’s Road Central, Hong Kong. HBAP is incorporated in Hong Kong and is part of the HSBC Group. This document is distributed by HSBC Bank Canada, HSBC Bank (China) Company Limited, HSBC France, HBAP, HSBC Bank (Singapore) Limited and HSBC Bank plc (collectively, the “Distributors”) to their respective clients. This document is for general circulation and information purposes only. This document is not prepared with any particular customers or purposes in mind and does not take into account any investment objectives, financial situation or personal circumstances or needs of any particular customer. HBAP has prepared this document based on publicly available information at the time of preparation from sources it believes to be reliable but it has not independently verified such information. The contents of this document are subject to change without notice. HBAP and the Distributors are not responsible for any loss, damage or other consequences of any kind that you may incur or suffer as a result of, arising from or relating to your use of or reliance on this document. HBAP and the Distributors give no guarantee, representation or warranty as to the accuracy, timeliness or completeness of this document. This document is not investment advice or recommendation nor is it intended to sell investments or services or solicit purchases or subscriptions for them. You should not use or rely on this document in making any investment decision. HBAP and the Distributors are not responsible for such use or reliance by you. You should consult your professional advisor in your jurisdiction if you have any questions regarding the contents of this document. You should not reproduce or further distribute the contents of this document to any person or entity, whether in whole or in part, for any purpose. This document may not be distributed to any jurisdiction where its distribution is unlawful.
© Copyright 2019. The Hongkong and Shanghai Banking Corporation Limited, ALL RIGHTS RESERVED.
No part of this document may be reproduced, stored in a retrieval system, or transmitted, on any form or by any means, electronic, mechanical, photocopying, recording or otherwise, without the prior written permission of The Hongkong and Shanghai Banking Corporation Limited.
Related Documents