Copyright © UNU-WIDER 2008 * Development Prospects Group, World Bank, Washington, DC: emails: [email protected] (Maurizio Bussolo); [email protected] (Rafael E. De Hoyos, corresponding author); [email protected] (Dominique van der Mensbrugghe); [email protected] (Denis Medvedev) This study has been prepared within the UNU-WIDER project on the Southern Engines of Global Growth. UNU-WIDER acknowledges the financial contributions to the research programme by the governments of Denmark (Royal Ministry of Foreign Affairs), Finland (Ministry for Foreign Affairs), Norway (Royal Ministry of Foreign Affairs), Sweden (Swedish International Development Cooperation Agency—Sida) and the United Kingdom (Department for International Development). ISSN 1810-2611 ISBN 978-92-9230-075-3 Research Paper No. 2008/29 Global Growth and Distribution Are China and India Reshaping the World? Maurizio Bussolo, Rafael E. De Hoyos, Denis Medvedev, and Dominique van der Mensbrugghe* March 2008 Abstract Over the past 20 years, aggregate measures of global inequality have changed little even if significant structural changes have been observed. High growth rates of China and India lifted millions out of poverty, while the stagnation in many African countries caused them to fall behind. Using the World Bank’s LINKAGE global general equilibrium model and the newly developed Global Income Distribution Dynamics (GIDD) tool, this paper assesses the distribution and poverty effects of a scenario where these trends continue in the future. Even by anticipating a deceleration, growth in China and India is a key force behind the expected convergence of per capita incomes at the global level. Millions of Chinese and Indian consumers will enter into a rapidly …/. Keywords: China, India, global income distribution, middle class JEL classification: D58, D31, F16

Welcome message from author
This document is posted to help you gain knowledge. Please leave a comment to let me know what you think about it! Share it to your friends and learn new things together.
Transcript
Copyright © UNU-WIDER 2008 * Development Prospects Group, World Bank, Washington, DC: emails: [email protected] (Maurizio Bussolo); [email protected] (Rafael E. De Hoyos, corresponding author); [email protected] (Dominique van der Mensbrugghe); [email protected] (Denis Medvedev) This study has been prepared within the UNU-WIDER project on the Southern Engines of Global Growth. UNU-WIDER acknowledges the financial contributions to the research programme by the governments of Denmark (Royal Ministry of Foreign Affairs), Finland (Ministry for Foreign Affairs), Norway (Royal Ministry of Foreign Affairs), Sweden (Swedish International Development Cooperation Agency—Sida) and the United Kingdom (Department for International Development).
ISSN 1810-2611 ISBN 978-92-9230-075-3
Research Paper No. 2008/29
Global Growth and Distribution
Are China and India Reshaping the World?
Maurizio Bussolo, Rafael E. De Hoyos, Denis Medvedev, and Dominique van der Mensbrugghe*
March 2008
Abstract
Over the past 20 years, aggregate measures of global inequality have changed little even if significant structural changes have been observed. High growth rates of China and India lifted millions out of poverty, while the stagnation in many African countries caused them to fall behind. Using the World Bank’s LINKAGE global general equilibrium model and the newly developed Global Income Distribution Dynamics (GIDD) tool, this paper assesses the distribution and poverty effects of a scenario where these trends continue in the future. Even by anticipating a deceleration, growth in China and India is a key force behind the expected convergence of per capita incomes at the global level. Millions of Chinese and Indian consumers will enter into a rapidly
…/.
Keywords: China, India, global income distribution, middle class
JEL classification: D58, D31, F16
The World Institute for Development Economics Research (WIDER) was established by the United Nations University (UNU) as its first research and training centre and started work in Helsinki, Finland in 1985. The Institute undertakes applied research and policy analysis on structural changes affecting the developing and transitional economies, provides a forum for the advocacy of policies leading to robust, equitable and environmentally sustainable growth, and promotes capacity strengthening and training in the field of economic and social policy making. Work is carried out by staff researchers and visiting scholars in Helsinki and through networks of collaborating scholars and institutions around the world.
www.wider.unu.edu [email protected]
UNU World Institute for Development Economics Research (UNU-WIDER) Katajanokanlaituri 6 B, 00160 Helsinki, Finland Typescript prepared by Liisa Roponen at UNU-WIDER The views expressed in this publication are those of the author(s). Publication does not imply endorsement by the Institute or the United Nations University, nor by the programme/project sponsors, of any of the views expressed.
emerging global middle class—a group of people who can afford, and demand access to, the standards of living previously reserved mainly for the residents of developed countries. Notwithstanding these positive developments, fast growth is often characterized by high urbanization and growing demand for skills, both of which result in a widening of income distribution within countries. These opposing distributional effects highlight the importance of analysing global disparities by taking into account—as the GIDD does—income dynamics between and within countries.
Acknowledgements
The findings, interpretations, and conclusions expressed in this paper are entirely those of the authors; they do not necessarily reflect the views of the World Bank, its Executive Directors, or the countries they represent. We are grateful to Hans Timmer and seminar participants at the UNU-WIDER project meeting on ‘Southern Engines of Growth, China, India, Brazil, and South Africa’, Beijing, China, 12-13 January 2007 for helpful contributions, comments, and suggestions.
Acronyms
GIDD Global Income Distribution Dynamics GTAP Global Trade Analysis Project RoW rest of the world SSA Sub-Saharan Africa TFP total factor productivity
1
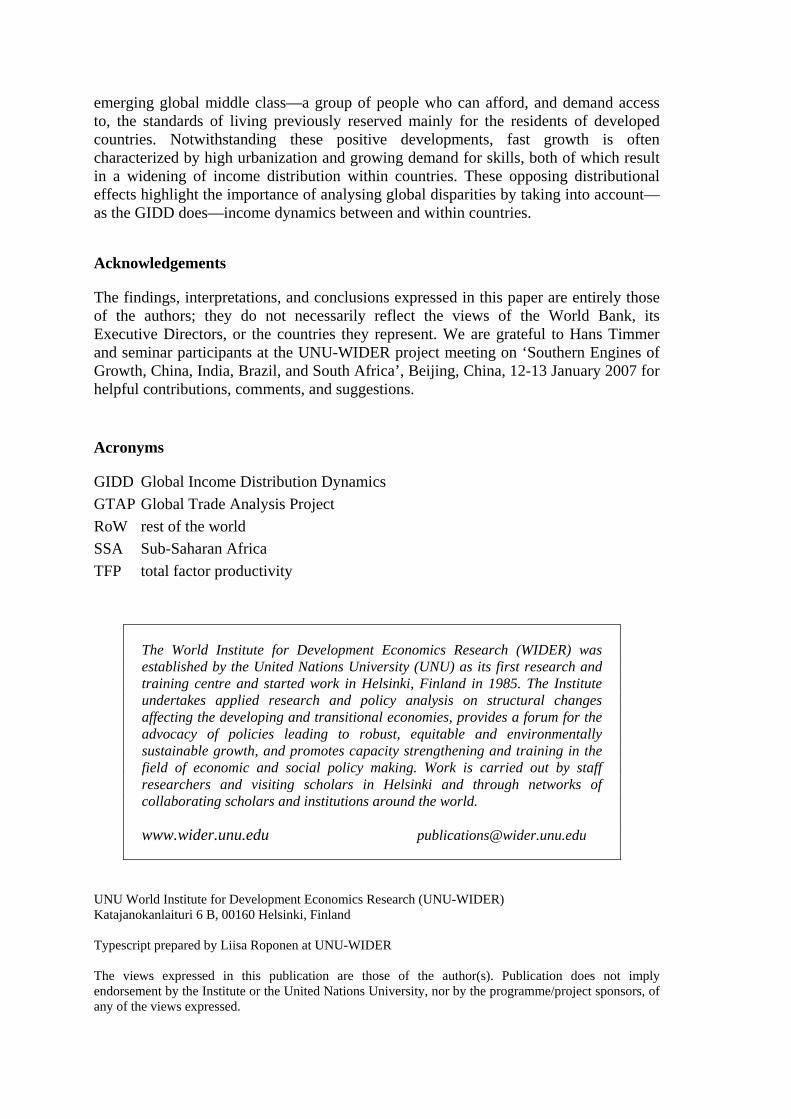
1 Introduction
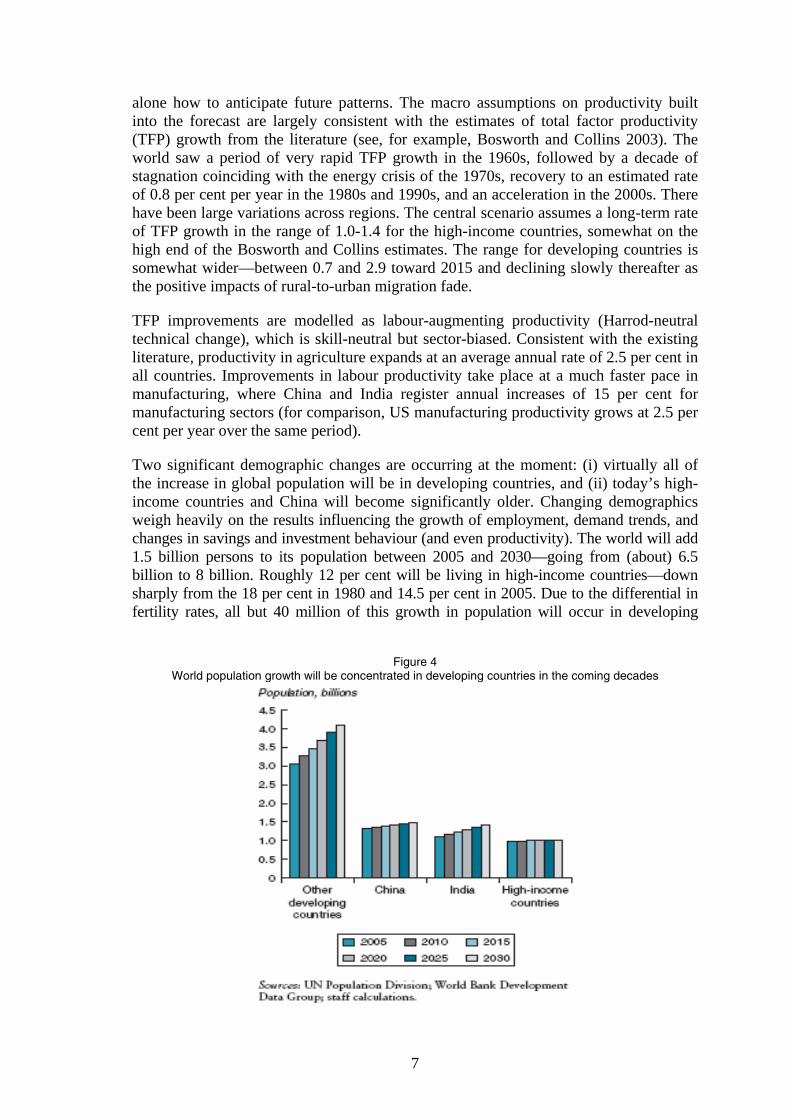
In 1980, China and India accounted for 2 per cent of global output, and the remaining low- and middle-income countries made up 16 per cent of world GDP. By 2005, the contribution of China and India nearly quadrupled to 7 per cent of global production, while the share of other developing countries declined to 15 per cent. The growing importance of developing economies can thus be largely explained by the economic expansion of China and India. In the future, the increasing level of China and India’s integration with the global economy, combined with sustained high growth, is likely to further cement their position as an important engine of global development.
This paper explores the potential consequences of sustained economic expansion in China and India by considering the effects the two emerging giants are likely to have on global trade, structure of production, and the distribution of income. While growth rates in China and India are likely to decelerate in the future, their growth path will still outperform growth outcomes of most other countries. Not only are these developments likely to drive convergence of per capita incomes at the global level; they are also a key force behind the expected entrance of millions of Chinese and Indian consumers into the global middle class—a group of people who can afford, and demand access to, the standards of living previously reserved mainly for the residents of developed countries. Growing demand for goods is likely to boost trade in manufactured products but also raise demand for highly skilled workers. This implies that the rules of the global marketplace will be increasingly determined by the preferences of citizens of China and India, and pressures for policies favouring global integration are thus likely to increase in the future.
An outstanding growth performance of relatively poor and highly populated countries like China and India signifies a reduction in the number of poor around the world and a decline in global income disparities. Nevertheless, as it is shown by Chaudhuri and Ravallion (2006), fast growth in China and India is characterized by high urbanization rates and growing demand for skills, both of which resulted in deteriorations in the distribution of income within these countries. These apparently opposing distributional effects highlight the importance of analysing global disparities taking into account income differences not only between national states but also within them. The definition of global income distribution used in this study captures income differences between all the citizens in the world; we may think of the resulting global inequality as showing the income differences that would prevail if the world was seen as a single country. The concept of global income distribution becomes increasingly relevant as people’s perception regarding their relative position in society is no longer based solely on a national yardstick, but is influenced by the increased awareness of living standards of people around the world (Milanovic 2006). On the other hand, within-country distributional changes should not be disregarded since economic policy is still decided and implemented at the national level.
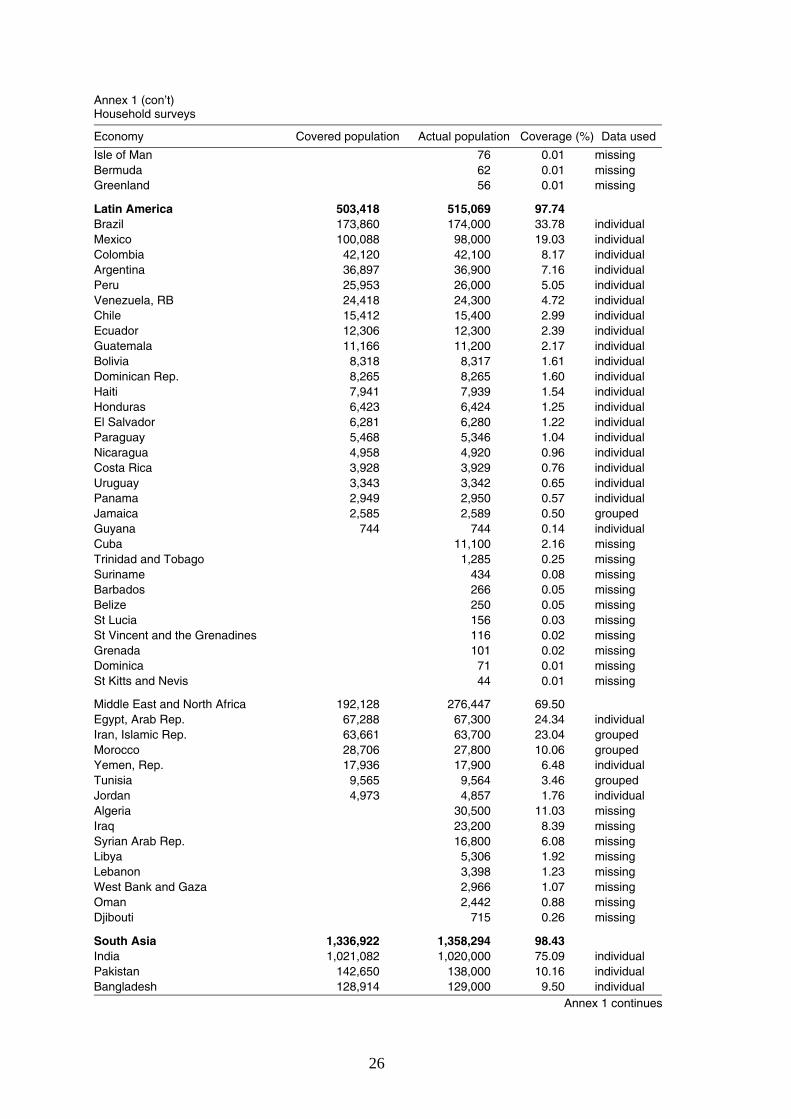
The empirical results of this paper are produced with the World Bank’s LINKAGE global general equilibrium model and the newly developed Global Income Distribution Dynamics (GIDD) tool. GIDD is a framework for ex ante analyses of the distribution and poverty effects of changes in macroeconomic policy and/or trends in global markets. It complements a global computable general equilibrium (CGE) analysis with global microsimulations based on standardized household surveys. The tool pools most of the currently available household surveys covering 1.2 million households in 63
2
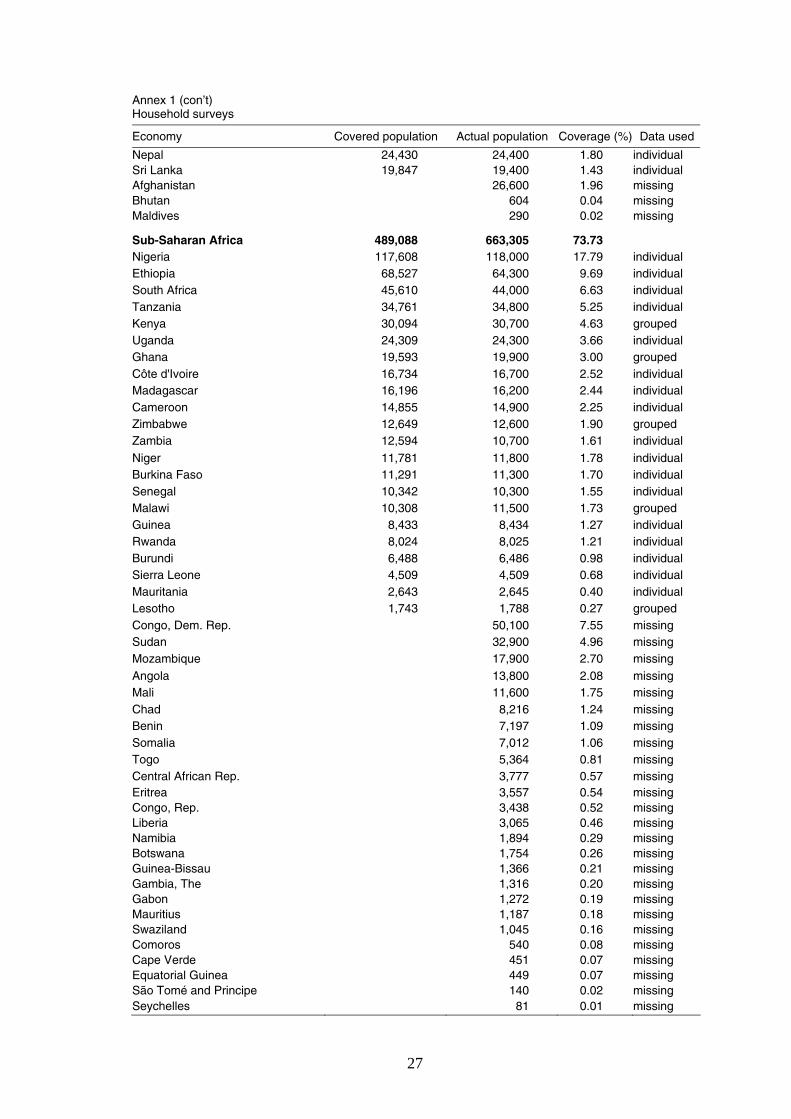
developing countries; household information from developed countries comes from the Luxemburg Income Study dataset. These micro data are complemented with more aggregate information for countries where no surveys are available; the final dataset covers 91 per cent of the world’s population (see Annex 1 for details).
The paper is organized as follows. The next section sketches the methodology, assumptions, and data behind the GIDD. Section 3 presents the macroeconomic results of the baseline scenario, showing the importance of China and India for global growth and trade. Section 4 assesses the importance of growth in China and India for the changes in the global income distribution and the emergence of a global middle class. The final section offers concluding remarks.
2 Methodology
The empirical analysis in this paper relies on two tools developed at the Development Economic Prospects Group of the World Bank: the LINKAGE global CGE model and the GIDD, which combines a consistent set of price and volume changes from the CGE model with expected changes in demographic structure to create a hypothetical distribution of income in 2030. We begin with a brief description of the LINKAGE model and then proceed to introduce the GIDD framework and its ability to map macroeconomic outcomes to disaggregated household survey data.
2.1 LINKAGE: a global dynamic multi-sectoral model
The forward-looking scenarios in this paper have been produced with the World Bank’s LINKAGE model. At its core, LINKAGE is essentially a neo-classical growth model, with aggregate growth predicated on assumptions regarding the growth of the labour force, savings/investment decisions (and therefore capital accumulation) and productivity. Unlike more simple growth models, however, LINKAGE has considerably more structure (see van der Mensbrugghe 2005, for a detailed description). First, it is multi-sectoral. This allows for more complex productivity dynamics including differentiating productivity growth between agriculture, manufacturing and services, and picking up the changing structure of demand (and therefore output) as growth in incomes leads to a relative shift into manufactures and services. Second, it is linked multi-regionally allowing for the influence of openness—via trade and finance—on domestic variables such as output and wages. Third, the LINKAGE model has a more diverse set of productive factors including land and natural resources (in the fossil fuel sectors), and labour is split between unskilled and skilled categories.
The LINKAGE model has a 2001 base year and relies on the Global Trade Analysis Project (GTAP) 6.1 database1 to calibrate initial parameters. A scenario is developed by solving for a new equilibrium in each subsequent year through 2030. The growth in the labour force is driven by demographics—essentially given by the growth of the working age population. Differentiated growth of skilled versus unskilled workers is partly driven by demographics and partly driven by changes in education rates. As education
1 See www.gtap.org for details.
3
levels rise (in the younger populations), they eventually increase relative growth of skilled workers once they enter the labour force (and older unskilled workers retire). Savings decisions are partly driven by demographics—rising as youth dependency ratios fall and falling as elderly dependency ratios rise. Investment rates are driven by changes in growth rates (the accelerator mechanism) and differential rates of return to capital. Net foreign savings is the difference between domestic savings and investment.
Productivity is derived by a combination of factors, but is also partially judgemental. First, agricultural productivity is assumed to be factor-neutral and exogenous and is set to estimates from empirical studies. Productivity in manufacturing and services is labour-augmenting and a constant wedge is imposed between productivity growth in the two broad sectors with the assumption that productivity growth is higher in manufacturing than in services. Finally, the model assumes that energy efficiency improves autonomously by 1 per cent per year in all regions and that international trade costs also decline by 1 per cent per year.
2.2 GIDD: linking macroeconomic outcomes to micro survey data
The GIDD framework is based on micro-simulation methodologies developed in the recent literature, including Bourguignon and Pereira da Silva (2003); Ferreira and Leite (2003, 2004); Chen and Ravallion (2003); and Bussolo, Lay and van der Mensbrugghe (2006). The starting point is the global income distribution in 2000, assembled using data from household surveys for 84 countries and data on income groups (usually vintiles) for the remaining countries; the final sample covers 91 per cent of the world population (see Annex for a full detailed list).2 The hypothetical 2030 distribution is then obtained by applying three main exogenous changes to the initial distribution: (i) demographic changes, including aging and shifts in the skill composition of the population; (ii) shifts in the sectoral composition of employment; and (iii) economic growth, including changes in relative wages across skills and sectors.
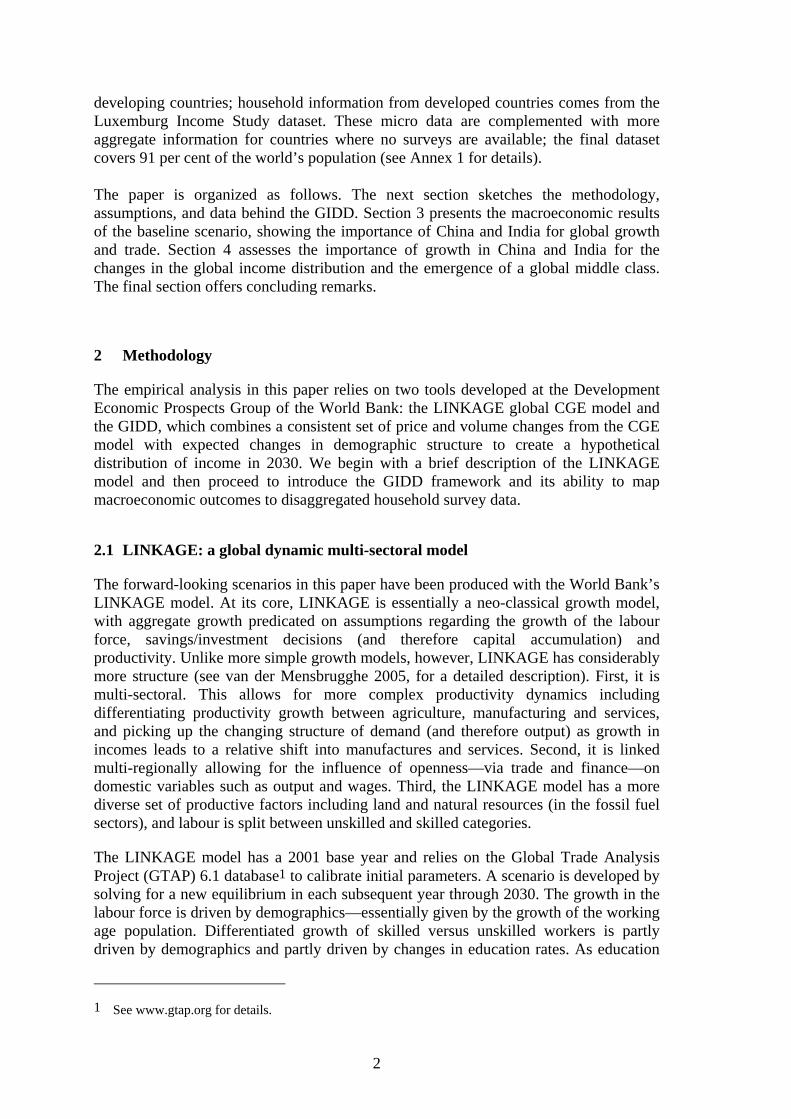
The empirical framework is depicted in Figure 1. Our simulations will include the expected changes in the shares of population by groups formed by age and education characteristics (top boxes of Figure 1). The future changes in population shares by age (upper left part of Figure 1) are taken as exogenous from the population projections provided by the World Bank’s Development Data Group. Therefore, we assume that fertility decisions and mortality rates are determined outside the model. The change in shares of the population by education groups incorporates the expected demographic changes (linking arrow from top left box to top right box in Figure 1). Next, new sets of population shares by age and education subgroups are computed and household sampling weights are rescaled according to the demographic and educational changes above (larger box in the middle of Figure 1). In a second step, the demographic changes will impact overall labour supply by age and skill groups. These changes are incorporated into the CGE model to simulate overall economic growth, growth in relative incomes by education groups and sector reallocation of labour (link between the middle and bottom rectangles). Finally, the results of the CGE are passed-on to the re-weighted household survey (bottom link in Figure 1).
2 Throughout the paper, when we talk about the global distribution, we are indeed referring to the
GIDD’s sample covering 91 per cent of the world population.
4
Figure 1 GIDD methodological framework
In reality these changes take place simultaneously, but in the GIDD’s simplified framework they are accommodated in a sequential fashion. In the first step, total population in each country is expanded until it reaches the World Bank’s projections for 2030. The structure of the population is also changed; for example, as fertility rates decrease and life expectancy increases, older age cohorts will become larger in many countries. To accommodate these changes in the survey data, larger weights have been assigned to older people than those assigned to younger individuals.3 In the next step, workers move from traditional agricultural sectors to more dynamic industrial and service sectors, and new incomes are estimated for these movers. Finally, consistent with an overall growth rate of real income per capita, changes in labour remuneration by skill level and sector are applied to each worker in the sample depending on their education and sector of employment. The number of workers changing sector of occupation and the growth differential in labour remuneration which are used to ‘shock’ the micro-data are consistent with the results of the global computable general
3 Actually weights are not changed for each single individual but for whole households. Therefore, in
the example in the text, households whose heads are older are assigned larger weights than households with younger heads. For a complete technical description of this re-weighting procedure, which in addition to the age structure also involves education attainments, see Bussolo, De Hoyos and Medvedev (2007).
Population projection by age groups(Exogenous)
Education projection(Semi- exogenous)
Household survey (new sampling weightsby age and education)
Simulated distribution
CGE - LINKAGE(Growth, new wages, sectoral reallocation
5
equilibrium (CGE) model described in the previous section. (Note that the outcomes of the CGE model are also influenced by the same demographic changes described above.)
The sequential changes described above reshape national income distribution under a set of strong assumptions. In particular, income inequality within population subgroups formed by age, skills, and sector of employment is assumed to be constant over the period. Moreover, data limitations affect estimates of the initial inequality and its evolution. Although consumption expenditure is a more reliable welfare measure than income, and its distribution is normally more equal than the distribution of income, consumption data are not available for all countries’ surveys. To get a global picture, the present study had to include countries for which only income data were available. Finally, measurement errors implicit in purchasing power parity exchange rates, which have been used to convert local currency units, also affect comparability across countries.
The resulting income distribution should thus not be seen as a forecast of what the future distribution might look like; instead it should be interpreted as the result of an exercise that captures the ceteris paribus distributional effect of demographic, sectoral, and economic changes.
3 The world economy in 2030
3.1 Developing countries will grow faster due to favourable demographic and productivity trends
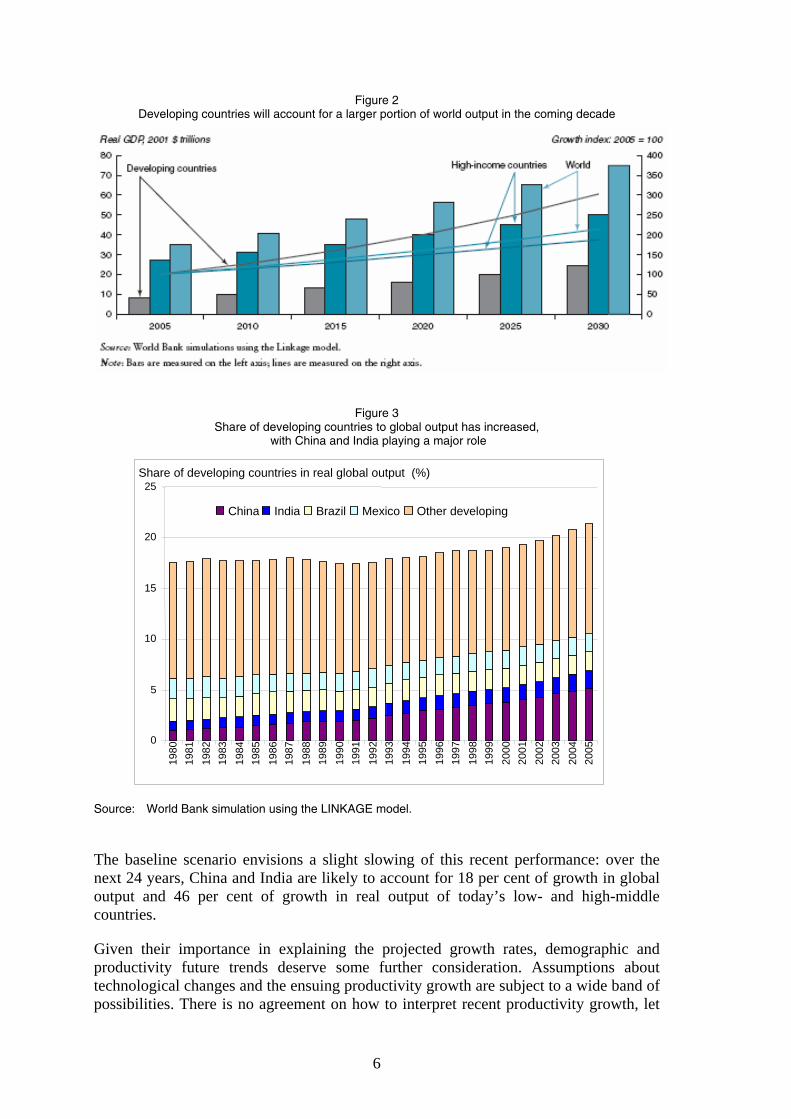
Under the baseline scenario of this paper, global GDP grows at an average annual rate of 2.9 per cent between 2005 and 2030.4 Measured at constant 2001 prices the global economy would reach US$75 trillion in 2030 up from US$35 trillion in 2005, an overall increase of some 2.1 times (Figure 2). The developing-country GDP would jump from US$8 trillion to US$24.3 trillion, increasing its global share of output from 23 per cent to 33 per cent.5
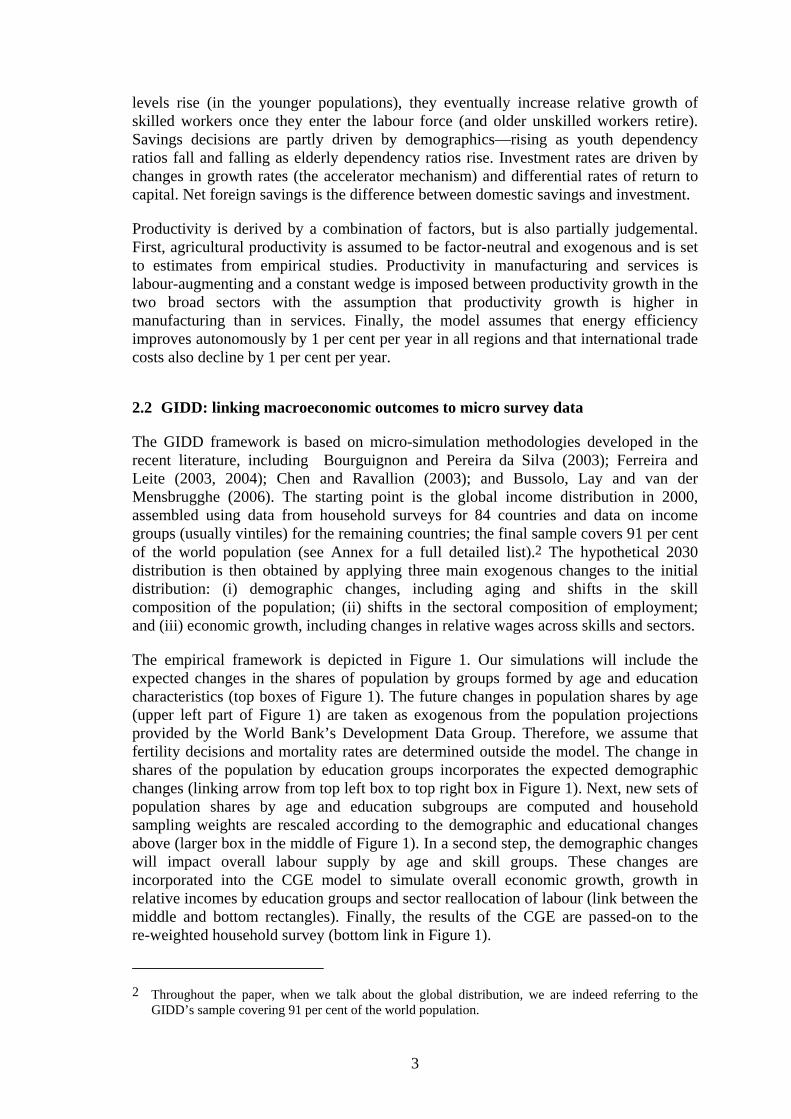
The accelerated growth path of many developing countries is a consequence, in the authors’ judgement, of the combination of improved initial conditions, better policies, demographic trends, and the still wide gap in productivity—relative to high-income countries. The influence of these factors on growth is already visible in the recent performance. If one decomposes the last 25 years in two periods—1980-2000 and 2000-05—average growth in developing countries jumped from 3.2 per cent per year in the first period to 5 per cent per year in the second. Over time, China and India played a major role in the quickening pace of growth in the developing world: the contribution of the two giants to growth of low- and middle-income countries has increased from 45 per cent in the first period to 50 per cent in the second (Figure 3). 4 This represents a modest acceleration of what was observed between 1980 and 2005. For high-income
countries, projected growth rates decrease slightly (from 2.0 to 1.9) but a more significant acceleration is attributed to developing countries (from 2.4 to 3.1).
5 Evaluated at 2001 market exchange rates and constant prices. The rapidly emerging economies would normally be associated with rising real exchange rates so that their weight in the global economy will actually be measurably higher in value terms than in constant price volume terms.
6
Figure 2 Developing countries will account for a larger portion of world output in the coming decade
Figure 3 Share of developing countries to global output has increased,
with China and India playing a major role
Source: World Bank simulation using the LINKAGE model.
The baseline scenario envisions a slight slowing of this recent performance: over the next 24 years, China and India are likely to account for 18 per cent of growth in global output and 46 per cent of growth in real output of today’s low- and high-middle countries.
Given their importance in explaining the projected growth rates, demographic and productivity future trends deserve some further consideration. Assumptions about technological changes and the ensuing productivity growth are subject to a wide band of possibilities. There is no agreement on how to interpret recent productivity growth, let
Share of developing countries in real global output (%)
0
5
10
15
20
25
1980
1981
1982
1983
1984
1985
1986
1987
1988
1989
1990
1991
1992
1993
1994
1995
1996
1997
1998
1999
2000
2001
2002
2003
2004
2005
China India Brazil Mexico Other developing
7
alone how to anticipate future patterns. The macro assumptions on productivity built into the forecast are largely consistent with the estimates of total factor productivity (TFP) growth from the literature (see, for example, Bosworth and Collins 2003). The world saw a period of very rapid TFP growth in the 1960s, followed by a decade of stagnation coinciding with the energy crisis of the 1970s, recovery to an estimated rate of 0.8 per cent per year in the 1980s and 1990s, and an acceleration in the 2000s. There have been large variations across regions. The central scenario assumes a long-term rate of TFP growth in the range of 1.0-1.4 for the high-income countries, somewhat on the high end of the Bosworth and Collins estimates. The range for developing countries is somewhat wider—between 0.7 and 2.9 toward 2015 and declining slowly thereafter as the positive impacts of rural-to-urban migration fade.
TFP improvements are modelled as labour-augmenting productivity (Harrod-neutral technical change), which is skill-neutral but sector-biased. Consistent with the existing literature, productivity in agriculture expands at an average annual rate of 2.5 per cent in all countries. Improvements in labour productivity take place at a much faster pace in manufacturing, where China and India register annual increases of 15 per cent for manufacturing sectors (for comparison, US manufacturing productivity grows at 2.5 per cent per year over the same period).
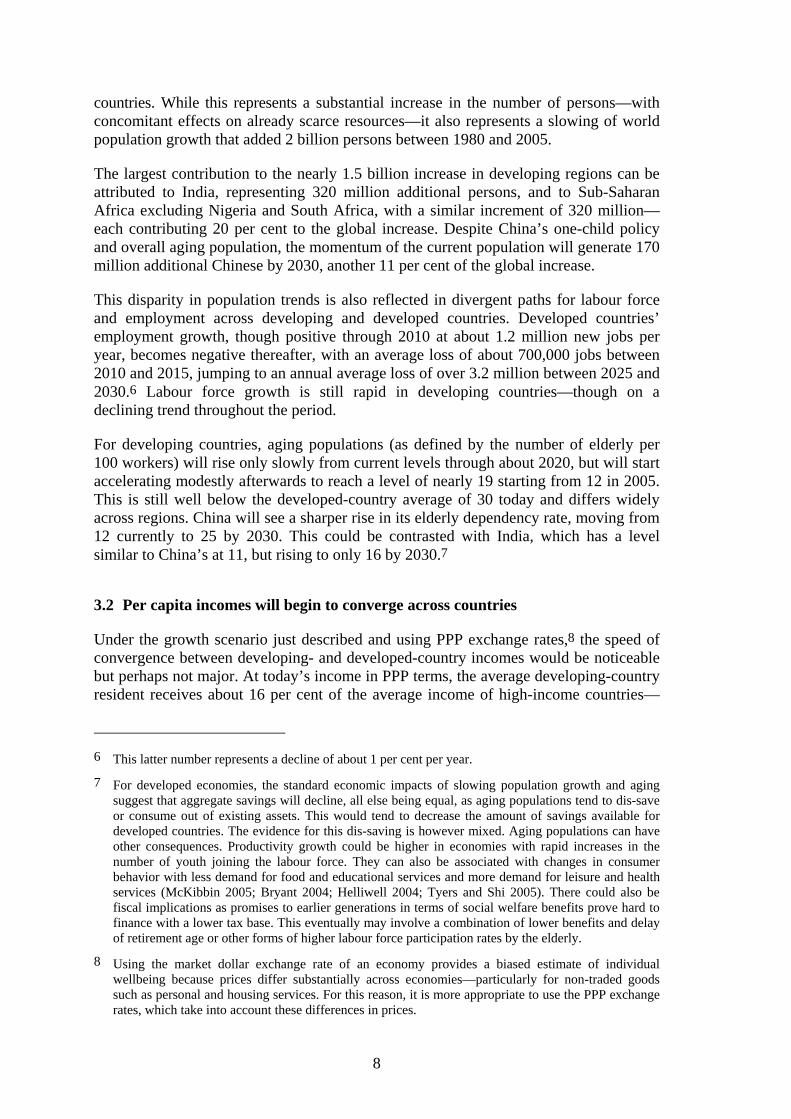
Two significant demographic changes are occurring at the moment: (i) virtually all of the increase in global population will be in developing countries, and (ii) today’s high-income countries and China will become significantly older. Changing demographics weigh heavily on the results influencing the growth of employment, demand trends, and changes in savings and investment behaviour (and even productivity). The world will add 1.5 billion persons to its population between 2005 and 2030—going from (about) 6.5 billion to 8 billion. Roughly 12 per cent will be living in high-income countries—down sharply from the 18 per cent in 1980 and 14.5 per cent in 2005. Due to the differential in fertility rates, all but 40 million of this growth in population will occur in developing
Figure 4 World population growth will be concentrated in developing countries in the coming decades
8
countries. While this represents a substantial increase in the number of persons—with concomitant effects on already scarce resources—it also represents a slowing of world population growth that added 2 billion persons between 1980 and 2005.
The largest contribution to the nearly 1.5 billion increase in developing regions can be attributed to India, representing 320 million additional persons, and to Sub-Saharan Africa excluding Nigeria and South Africa, with a similar increment of 320 million—each contributing 20 per cent to the global increase. Despite China’s one-child policy and overall aging population, the momentum of the current population will generate 170 million additional Chinese by 2030, another 11 per cent of the global increase.
This disparity in population trends is also reflected in divergent paths for labour force and employment across developing and developed countries. Developed countries’ employment growth, though positive through 2010 at about 1.2 million new jobs per year, becomes negative thereafter, with an average loss of about 700,000 jobs between 2010 and 2015, jumping to an annual average loss of over 3.2 million between 2025 and 2030.6 Labour force growth is still rapid in developing countries—though on a declining trend throughout the period.
For developing countries, aging populations (as defined by the number of elderly per 100 workers) will rise only slowly from current levels through about 2020, but will start accelerating modestly afterwards to reach a level of nearly 19 starting from 12 in 2005. This is still well below the developed-country average of 30 today and differs widely across regions. China will see a sharper rise in its elderly dependency rate, moving from 12 currently to 25 by 2030. This could be contrasted with India, which has a level similar to China’s at 11, but rising to only 16 by 2030.7
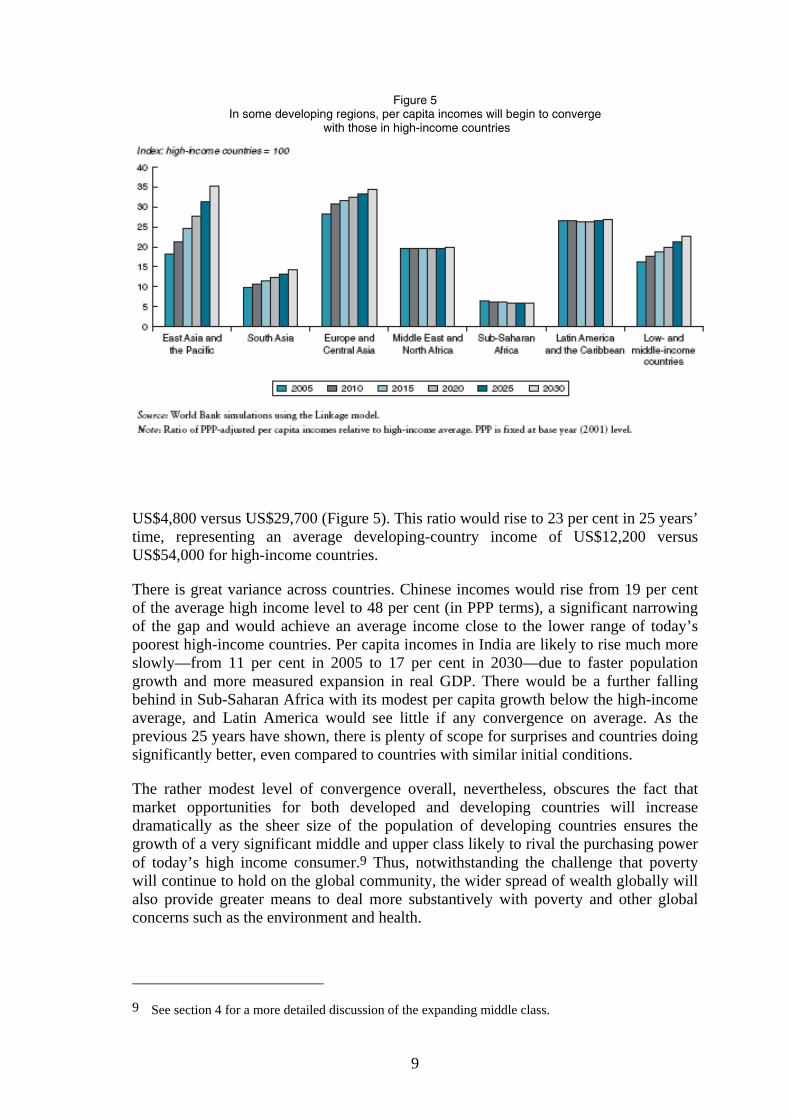
3.2 Per capita incomes will begin to converge across countries
Under the growth scenario just described and using PPP exchange rates,8 the speed of convergence between developing- and developed-country incomes would be noticeable but perhaps not major. At today’s income in PPP terms, the average developing-country resident receives about 16 per cent of the average income of high-income countries— 6 This latter number represents a decline of about 1 per cent per year.
7 For developed economies, the standard economic impacts of slowing population growth and aging suggest that aggregate savings will decline, all else being equal, as aging populations tend to dis-save or consume out of existing assets. This would tend to decrease the amount of savings available for developed countries. The evidence for this dis-saving is however mixed. Aging populations can have other consequences. Productivity growth could be higher in economies with rapid increases in the number of youth joining the labour force. They can also be associated with changes in consumer behavior with less demand for food and educational services and more demand for leisure and health services (McKibbin 2005; Bryant 2004; Helliwell 2004; Tyers and Shi 2005). There could also be fiscal implications as promises to earlier generations in terms of social welfare benefits prove hard to finance with a lower tax base. This eventually may involve a combination of lower benefits and delay of retirement age or other forms of higher labour force participation rates by the elderly.
8 Using the market dollar exchange rate of an economy provides a biased estimate of individual wellbeing because prices differ substantially across economies—particularly for non-traded goods such as personal and housing services. For this reason, it is more appropriate to use the PPP exchange rates, which take into account these differences in prices.
9
Figure 5 In some developing regions, per capita incomes will begin to converge
with those in high-income countries
US$4,800 versus US$29,700 (Figure 5). This ratio would rise to 23 per cent in 25 years’ time, representing an average developing-country income of US$12,200 versus US$54,000 for high-income countries.
There is great variance across countries. Chinese incomes would rise from 19 per cent of the average high income level to 48 per cent (in PPP terms), a significant narrowing of the gap and would achieve an average income close to the lower range of today’s poorest high-income countries. Per capita incomes in India are likely to rise much more slowly—from 11 per cent in 2005 to 17 per cent in 2030—due to faster population growth and more measured expansion in real GDP. There would be a further falling behind in Sub-Saharan Africa with its modest per capita growth below the high-income average, and Latin America would see little if any convergence on average. As the previous 25 years have shown, there is plenty of scope for surprises and countries doing significantly better, even compared to countries with similar initial conditions.
The rather modest level of convergence overall, nevertheless, obscures the fact that market opportunities for both developed and developing countries will increase dramatically as the sheer size of the population of developing countries ensures the growth of a very significant middle and upper class likely to rival the purchasing power of today’s high income consumer.9 Thus, notwithstanding the challenge that poverty will continue to hold on the global community, the wider spread of wealth globally will also provide greater means to deal more substantively with poverty and other global concerns such as the environment and health.
9 See section 4 for a more detailed discussion of the expanding middle class.
10
3.3 Accelerated growth and changes in production and trade structure: consequences for factor prices
The previous sections have shown that under baseline conditions, growth in China and India will account for a large share of global output. Similarly, as both of the giants are already major participants in the global trade arena, the continued expansion of Chinese and Indian economies is likely to have far-reaching consequences for world trade. This section highlights four main developments: increasing orientation of the giants’ economies towards services, growing demand for skilled workers, further improvements in competitiveness of manufactured goods, and rising imports of agricultural products from high-income countries.
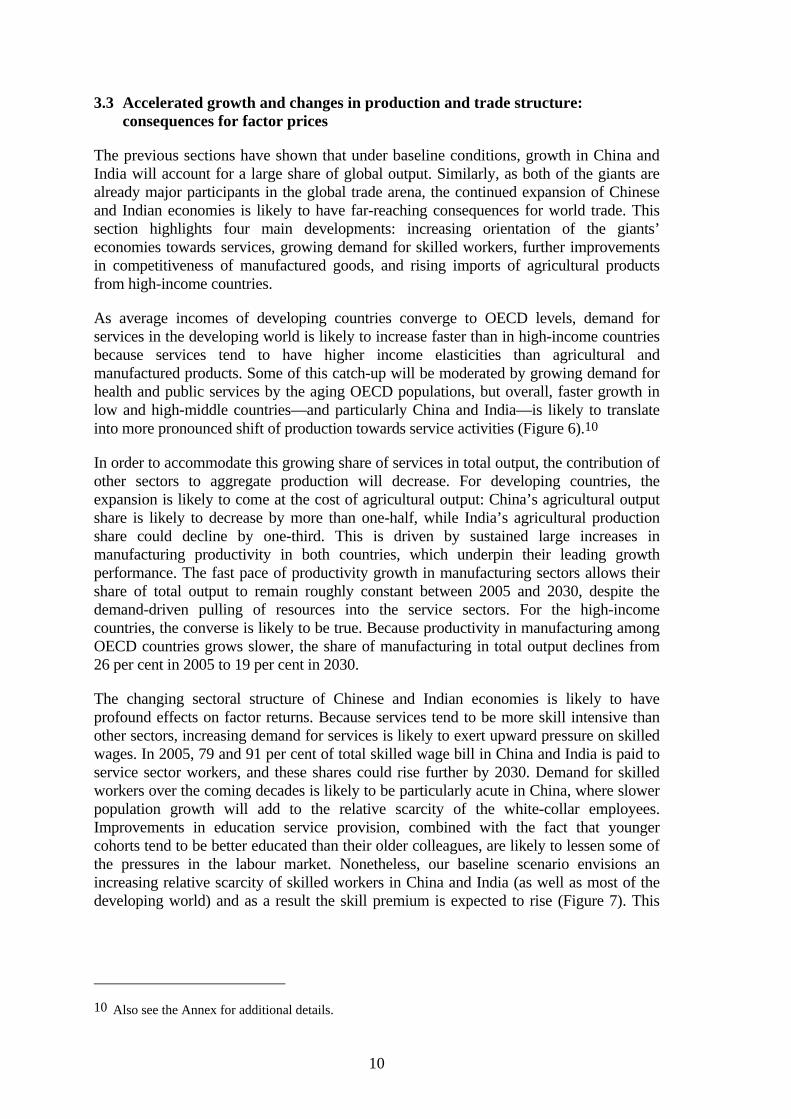
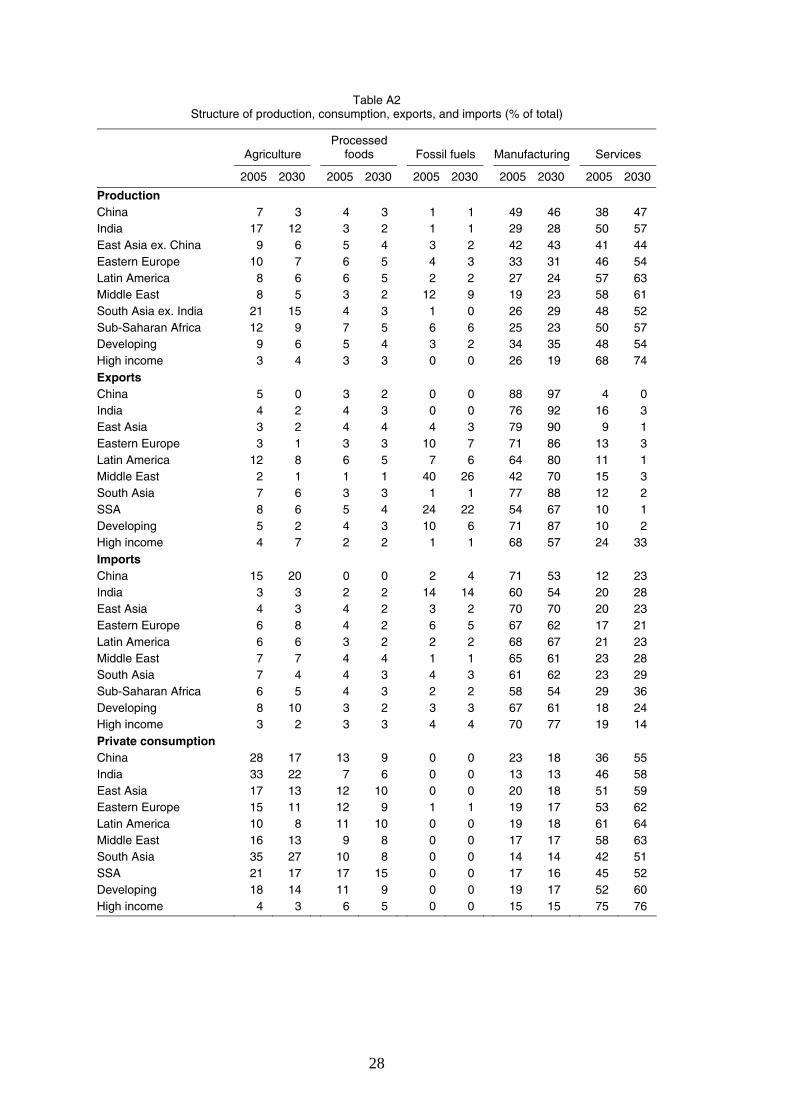
As average incomes of developing countries converge to OECD levels, demand for services in the developing world is likely to increase faster than in high-income countries because services tend to have higher income elasticities than agricultural and manufactured products. Some of this catch-up will be moderated by growing demand for health and public services by the aging OECD populations, but overall, faster growth in low and high-middle countries—and particularly China and India—is likely to translate into more pronounced shift of production towards service activities (Figure 6).10
In order to accommodate this growing share of services in total output, the contribution of other sectors to aggregate production will decrease. For developing countries, the expansion is likely to come at the cost of agricultural output: China’s agricultural output share is likely to decrease by more than one-half, while India’s agricultural production share could decline by one-third. This is driven by sustained large increases in manufacturing productivity in both countries, which underpin their leading growth performance. The fast pace of productivity growth in manufacturing sectors allows their share of total output to remain roughly constant between 2005 and 2030, despite the demand-driven pulling of resources into the service sectors. For the high-income countries, the converse is likely to be true. Because productivity in manufacturing among OECD countries grows slower, the share of manufacturing in total output declines from 26 per cent in 2005 to 19 per cent in 2030.
The changing sectoral structure of Chinese and Indian economies is likely to have profound effects on factor returns. Because services tend to be more skill intensive than other sectors, increasing demand for services is likely to exert upward pressure on skilled wages. In 2005, 79 and 91 per cent of total skilled wage bill in China and India is paid to service sector workers, and these shares could rise further by 2030. Demand for skilled workers over the coming decades is likely to be particularly acute in China, where slower population growth will add to the relative scarcity of the white-collar employees. Improvements in education service provision, combined with the fact that younger cohorts tend to be better educated than their older colleagues, are likely to lessen some of the pressures in the labour market. Nonetheless, our baseline scenario envisions an increasing relative scarcity of skilled workers in China and India (as well as most of the developing world) and as a result the skill premium is expected to rise (Figure 7). This
10 Also see the Annex for additional details.
11
Figure 6 Shift into services is more pronounced in China and India
Contribution to total output, percent
0102030405060708090
100
2005 2030 2005 2030 2005 2030 2005 2030
China India Developing High income
Agriculture Processed foods Fossil fuels Manufacturing Services
Figure 7
Skill premiums are likely to rise across the developing world
Ratio of skilled wages to unskilled wages
012345678
China
India
East A
sia
Eastern
Europe
Latin
America
Middle
East
South
Asia
Sub-S
ah. A
frica
Develo
ping
High in
come
2005 2030
Figure 8 Developing country exports will be increasingly concentrated in manufactured goods
Contribution to total merchandise exports, percent
0
5
10
15
20
25
2005 2030 2005 2030 2005 2030 2005 2030
China India Developing High income
Agriculture Processed foods Fossil fuels
Source for Figures 6, 7 and 8: World Bank simulation using the LINKAGE model.
12
widening of wage gaps could lead to increasing inequality within fast-growing economies, although such pressures could be counteracted by a host of effects including falling rural-urban wage differentials, decrease in the gender wage gap, or changing returns to other worker characteristics.
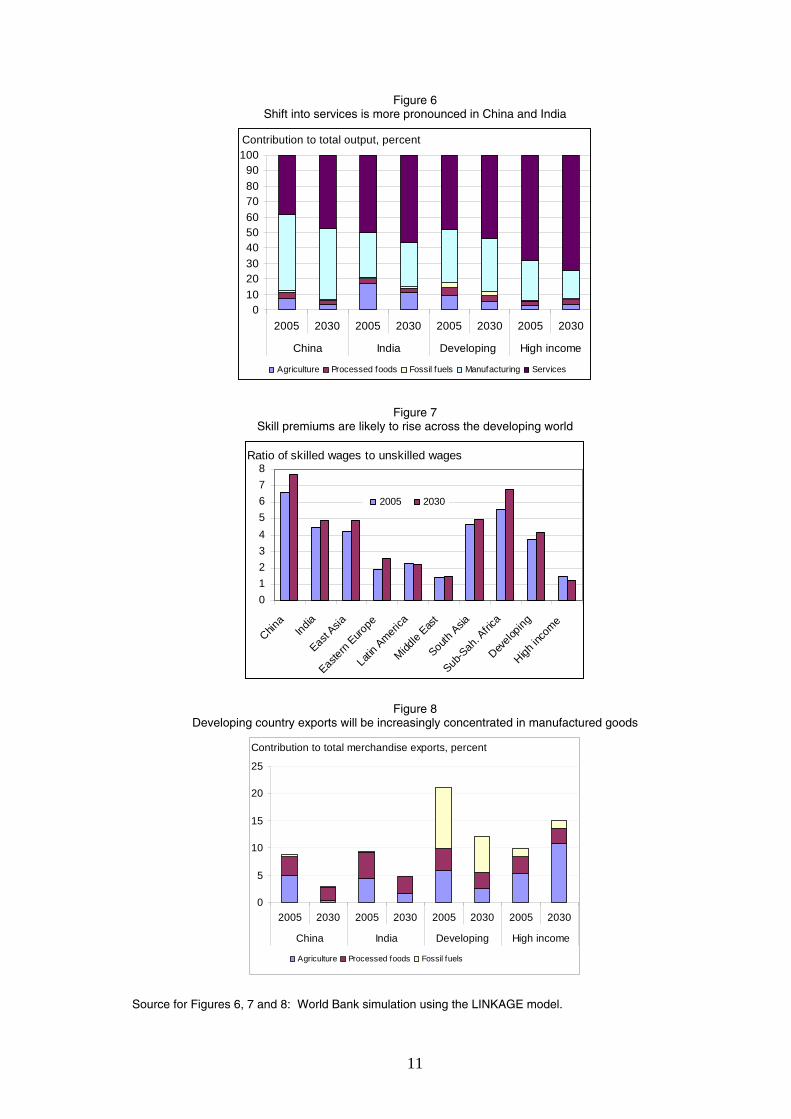
Productivity growth, changing sectoral structure, and widening skill premiums lead to important changes in international competitiveness of developing countries. Low- and middle-income nations solidify their comparative advantage in exports of manufactured goods, which rise from 79 to 88 per cent of total merchandise exports between 2005 and 2030 (Figure 8). The trend is even more pronounced in China and India, which benefit from a TFP growth significantly above the developing country average. In our scenario, 97 per cent of Chinese and 98 per cent of Indian merchandise exports are likely to originate from manufacturing sectors. As high-income countries lose competitiveness in the manufacturing sector due to their lower productivity, the share of manufacturing products in their total exports is likely to decline significantly.
The result that agricultural products become a more important component of high-income countries’ exports may seem counter-intuitive at first glance. There are two main reasons for this development. First, our baseline does not include any significant removal of domestic support in agriculture, which allows high income farm producers to sell a significant portion of their output on the world markets. Second, as developing countries, led by China and India, gain competitiveness in the manufacturing sector, the relative price of agricultural products imported from high-income countries declines.
Table 1 World trade shares, %
Agriculture Processed
foods Fossil fuels
Manufac-turing Services
Total
2005 2030 2005 2030 2005 2030 2005 2030 2005 2030 2005 2030
Export shares
China 10 1 11 17 1 0 11 21 1 0 9 16 India 1 0 1 2 0 0 1 3 1 0 1 2 East Asia ex. China 4 2 8 12 6 7 6 10 2 0 6 8 Eastern Europe 4 1 6 9 13 14 6 8 4 1 6 7 Latin America 15 10 12 14 11 13 6 8 3 0 6 7 Middle East 1 1 2 1 39 38 3 6 3 1 4 5 South Asia ex. India 1 1 1 1 0 0 1 1 0 0 0 1 SSA 3 2 3 3 9 12 1 2 1 0 1 2 Developing 38 19 43 60 79 84 34 60 15 2 33 48 High income 62 81 57 40 21 16 66 40 85 98 67 52 Import shares China 24 45 1 1 4 12 8 8 5 14 7 11 India 1 1 1 1 4 6 1 1 1 2 1 1 East Asia ex. China 4 4 6 6 3 4 4 6 5 8 4 6 Eastern Europe 8 11 8 7 9 12 6 6 5 8 6 7 Latin America 7 8 6 5 3 3 6 7 6 9 6 7 Middle East 6 6 5 7 1 1 4 4 5 8 4 5 South Asia ex. India 1 0 1 1 0 0 0 1 1 1 0 1 SSA 2 2 2 2 1 1 1 1 2 4 2 2 Developing 53 77 30 31 26 39 30 35 30 54 31 40 High income 47 23 70 69 74 61 70 65 70 46 69 60
Source: World Bank simulation using the LINKAGE model.
13
This is illustrated in Table 1, which shows global market shares for China and India, as well as the standard set of World Bank-defined regions. While China and India’s global market shares in exports of manufactured goods double and triple, respectively, their significance as exporters in world agricultural markets diminishes even more dramatically. Furthermore, while India’s share of global food imports does not change appreciably, by 2030 China could account for a large share of total imports of agriculture and processed food. It is important to note that the numbers in Table 1 are not forecasts, and are predicated on a number of assumptions, including the same rate of productivity improvement in farm products across high income and developing countries. If, on the other hand, China’s productivity growth in agriculture is able to follow the path of its manufacturing productivity more closely, the relative price of imported agriculture would rise and limit the country’s willingness to purchase agricultural products from abroad.11
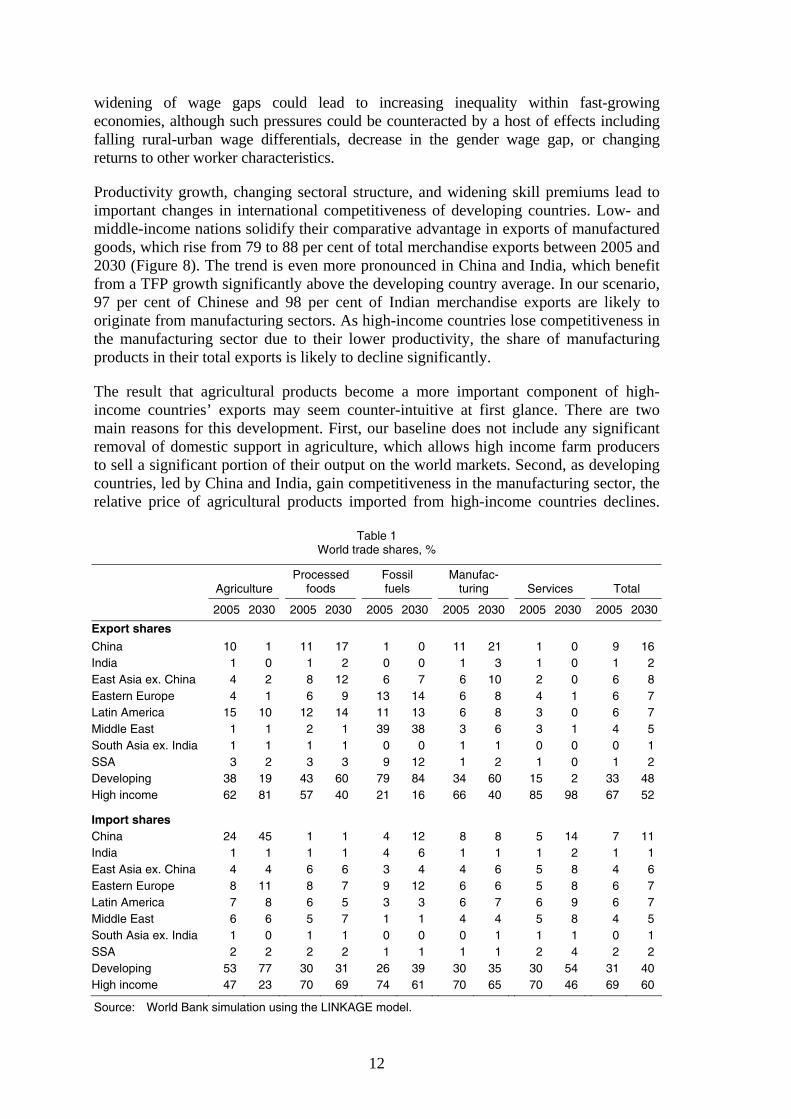
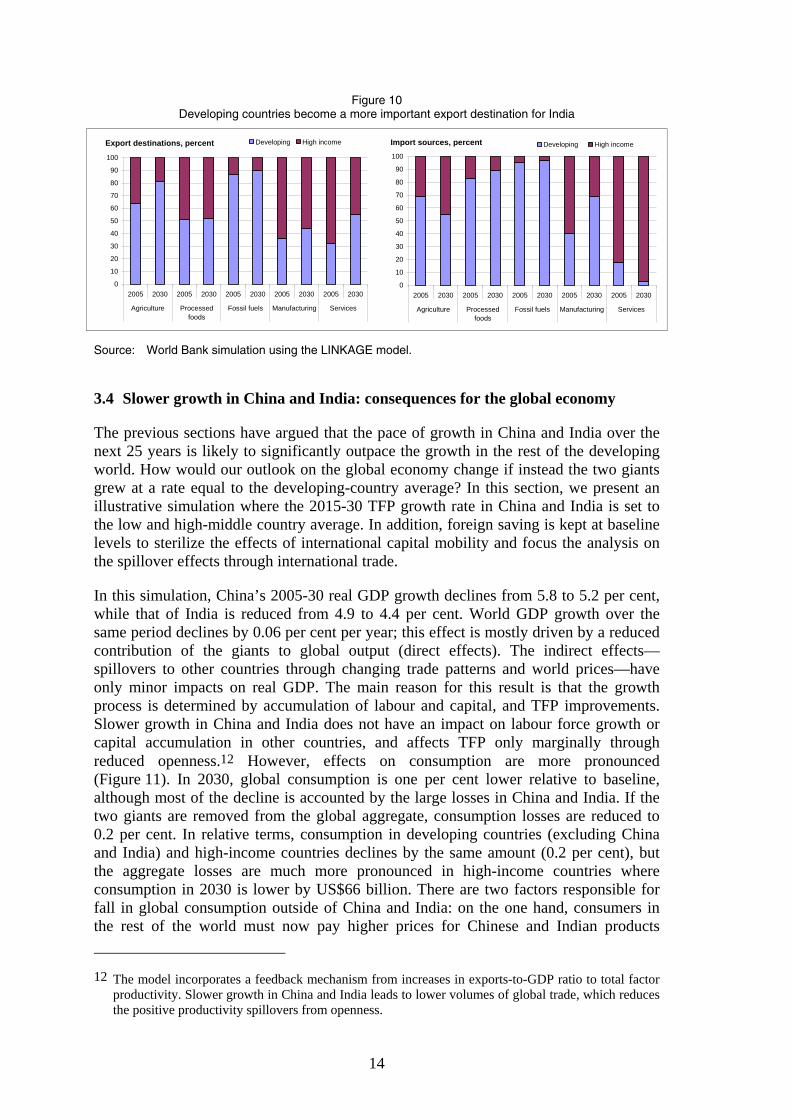
The last two columns of Table 1 show that the exports of low and high-middle countries could account for one-half of total global exports by 2030, up from one-third in 2005. This expansion is driven to a large extent by the growth in trade originating in China and other Asian countries, with the former already the world’s second leading exporter in 2005 behind high income European countries. This growing importance of developing countries is also reflected in changes in the direction of trade, which is also likely to undergo significant shifts over the next 25 years. Figure 9 and Figure 10 show that the faster pace of growth in developing countries translates into their rise as destinations for Chinese and Indian exports. At the same time, China and India buy many more of their manufacturing imports from developing countries, while agricultural imports are increasingly sourced from high-income countries (consistent with the analysis above). Much of the growing trade dependence between developing countries is due to trade in intermediate goods—today, 63 per cent of China’s imports are classified as intermediate goods, with roughly half of them coming in the form of parts and components. With the increasing orientation of developing countries towards manufacturing sectors, these linkages are likely to become even stronger in 2030.
Figure 9 Developing countries become a more important export destination for China
Export destinations, percent
0
10
20
30
40
50
60
70
80
90
100
2005 2030 2005 2030 2005 2030 2005 2030 2005 2030
Agriculture Processedfoods
Fossil fuels Manufacturing Services
Developing High income Import sources, percent
0
10
20
30
40
50
60
70
80
90
100
2005 2030 2005 2030 2005 2030 2005 2030 2005 2030
Agriculture Processedfoods
Fossil fuels Manufacturing Services
Developing High income
Source: World Bank simulation using the LINKAGE model.
11 An additional factor influencing the results is the relative land scarcity in China. Over the last decades,
about 0.7 per cent of arable farm land has been converted to non-agricultural use annually—including for roads, factories and residential and business construction.
14
Figure 10 Developing countries become a more important export destination for India
Export destinations, percent
0
10
20
30
40
50
60
70
80
90
100
2005 2030 2005 2030 2005 2030 2005 2030 2005 2030
Agriculture Processedfoods
Fossil fuels Manufacturing Services
Developing High income Import sources, percent
0
10
20
30
40
50
60
70
80
90
100
2005 2030 2005 2030 2005 2030 2005 2030 2005 2030
Agriculture Processedfoods
Fossil fuels Manufacturing Services
Developing High income
Source: World Bank simulation using the LINKAGE model.
3.4 Slower growth in China and India: consequences for the global economy
The previous sections have argued that the pace of growth in China and India over the next 25 years is likely to significantly outpace the growth in the rest of the developing world. How would our outlook on the global economy change if instead the two giants grew at a rate equal to the developing-country average? In this section, we present an illustrative simulation where the 2015-30 TFP growth rate in China and India is set to the low and high-middle country average. In addition, foreign saving is kept at baseline levels to sterilize the effects of international capital mobility and focus the analysis on the spillover effects through international trade.
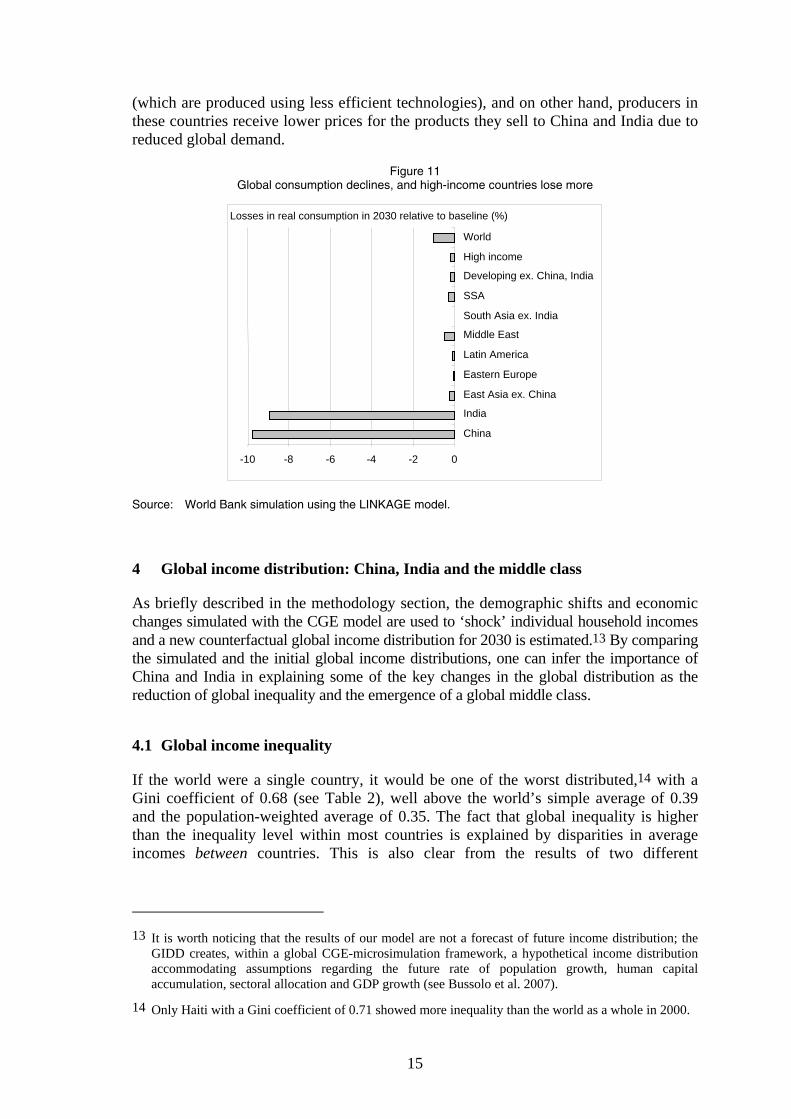
In this simulation, China’s 2005-30 real GDP growth declines from 5.8 to 5.2 per cent, while that of India is reduced from 4.9 to 4.4 per cent. World GDP growth over the same period declines by 0.06 per cent per year; this effect is mostly driven by a reduced contribution of the giants to global output (direct effects). The indirect effects—spillovers to other countries through changing trade patterns and world prices—have only minor impacts on real GDP. The main reason for this result is that the growth process is determined by accumulation of labour and capital, and TFP improvements. Slower growth in China and India does not have an impact on labour force growth or capital accumulation in other countries, and affects TFP only marginally through reduced openness.12 However, effects on consumption are more pronounced (Figure 11). In 2030, global consumption is one per cent lower relative to baseline, although most of the decline is accounted by the large losses in China and India. If the two giants are removed from the global aggregate, consumption losses are reduced to 0.2 per cent. In relative terms, consumption in developing countries (excluding China and India) and high-income countries declines by the same amount (0.2 per cent), but the aggregate losses are much more pronounced in high-income countries where consumption in 2030 is lower by US$66 billion. There are two factors responsible for fall in global consumption outside of China and India: on the one hand, consumers in the rest of the world must now pay higher prices for Chinese and Indian products 12 The model incorporates a feedback mechanism from increases in exports-to-GDP ratio to total factor
productivity. Slower growth in China and India leads to lower volumes of global trade, which reduces the positive productivity spillovers from openness.
15
(which are produced using less efficient technologies), and on other hand, producers in these countries receive lower prices for the products they sell to China and India due to reduced global demand.
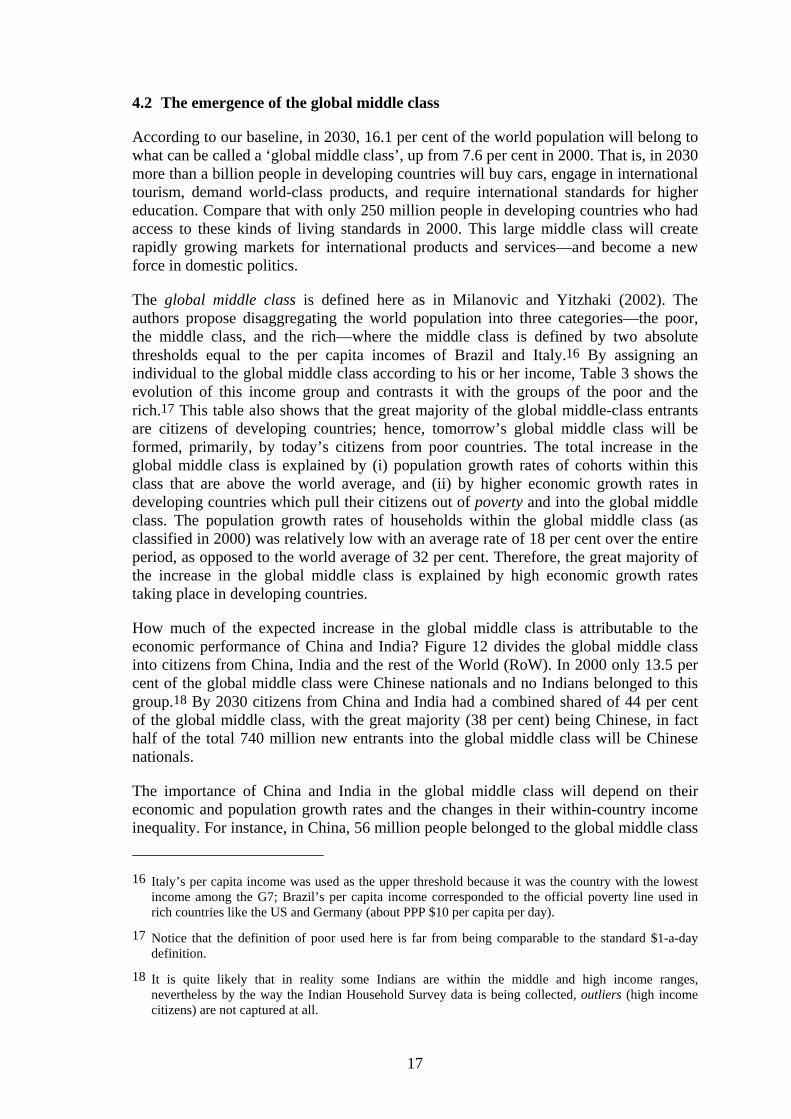
Figure 11 Global consumption declines, and high-income countries lose more
Source: World Bank simulation using the LINKAGE model.
4 Global income distribution: China, India and the middle class
As briefly described in the methodology section, the demographic shifts and economic changes simulated with the CGE model are used to ‘shock’ individual household incomes and a new counterfactual global income distribution for 2030 is estimated.13 By comparing the simulated and the initial global income distributions, one can infer the importance of China and India in explaining some of the key changes in the global distribution as the reduction of global inequality and the emergence of a global middle class.
4.1 Global income inequality
If the world were a single country, it would be one of the worst distributed,14 with a Gini coefficient of 0.68 (see Table 2), well above the world’s simple average of 0.39 and the population-weighted average of 0.35. The fact that global inequality is higher than the inequality level within most countries is explained by disparities in average incomes between countries. This is also clear from the results of two different
13 It is worth noticing that the results of our model are not a forecast of future income distribution; the
GIDD creates, within a global CGE-microsimulation framework, a hypothetical income distribution accommodating assumptions regarding the future rate of population growth, human capital accumulation, sectoral allocation and GDP growth (see Bussolo et al. 2007).
14 Only Haiti with a Gini coefficient of 0.71 showed more inequality than the world as a whole in 2000.
Losses in real consumption in 2030 relative to baseline (%)
-10 -8 -6 -4 -2 0
China
India
East Asia ex. China
Eastern Europe
Latin America
Middle East
South Asia ex. India
SSA
Developing ex. China, India High income
World
16
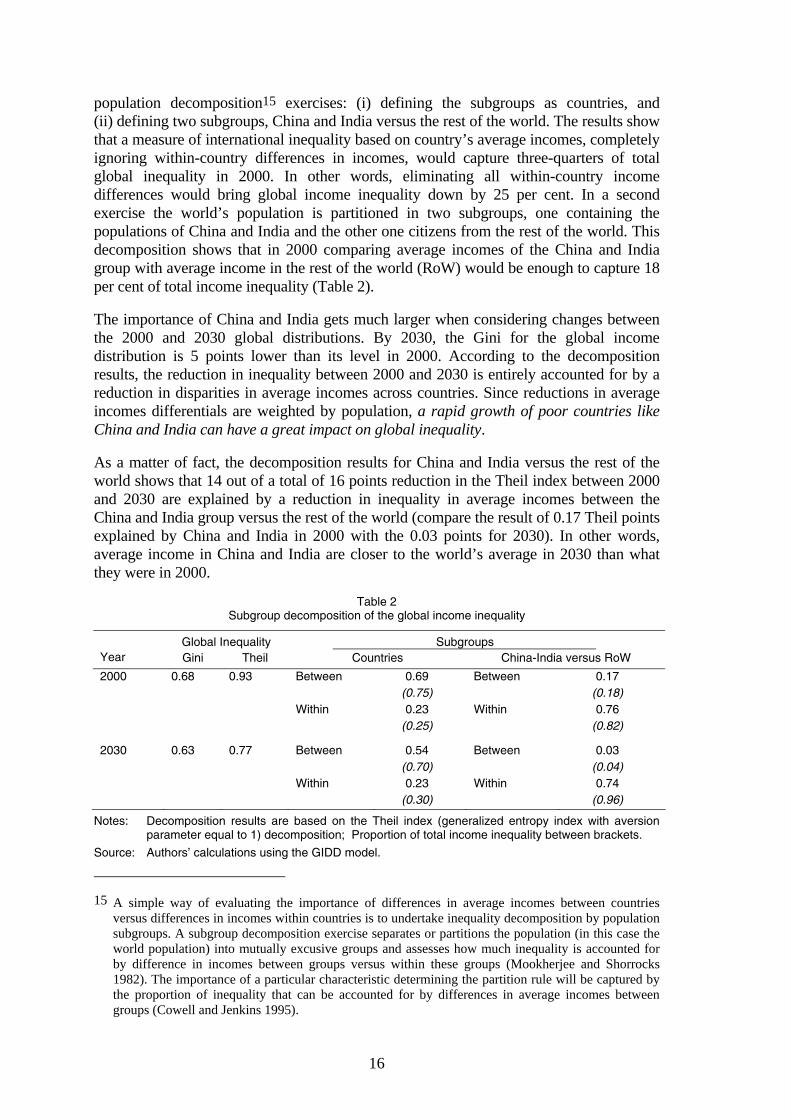
population decomposition15 exercises: (i) defining the subgroups as countries, and (ii) defining two subgroups, China and India versus the rest of the world. The results show that a measure of international inequality based on country’s average incomes, completely ignoring within-country differences in incomes, would capture three-quarters of total global inequality in 2000. In other words, eliminating all within-country income differences would bring global income inequality down by 25 per cent. In a second exercise the world’s population is partitioned in two subgroups, one containing the populations of China and India and the other one citizens from the rest of the world. This decomposition shows that in 2000 comparing average incomes of the China and India group with average income in the rest of the world (RoW) would be enough to capture 18 per cent of total income inequality (Table 2).
The importance of China and India gets much larger when considering changes between the 2000 and 2030 global distributions. By 2030, the Gini for the global income distribution is 5 points lower than its level in 2000. According to the decomposition results, the reduction in inequality between 2000 and 2030 is entirely accounted for by a reduction in disparities in average incomes across countries. Since reductions in average incomes differentials are weighted by population, a rapid growth of poor countries like China and India can have a great impact on global inequality.
As a matter of fact, the decomposition results for China and India versus the rest of the world shows that 14 out of a total of 16 points reduction in the Theil index between 2000 and 2030 are explained by a reduction in inequality in average incomes between the China and India group versus the rest of the world (compare the result of 0.17 Theil points explained by China and India in 2000 with the 0.03 points for 2030). In other words, average income in China and India are closer to the world’s average in 2030 than what they were in 2000.
Table 2 Subgroup decomposition of the global income inequality
Global Inequality Subgroups Year Gini Theil Countries China-India versus RoW
2000 0.68 0.93 Between 0.69 Between 0.17 (0.75) (0.18) Within 0.23 Within 0.76 (0.25) (0.82) 2030 0.63 0.77 Between 0.54 Between 0.03 (0.70) (0.04) Within 0.23 Within 0.74 (0.30) (0.96)
Notes: Decomposition results are based on the Theil index (generalized entropy index with aversion parameter equal to 1) decomposition; Proportion of total income inequality between brackets.
Source: Authors’ calculations using the GIDD model.
15 A simple way of evaluating the importance of differences in average incomes between countries
versus differences in incomes within countries is to undertake inequality decomposition by population subgroups. A subgroup decomposition exercise separates or partitions the population (in this case the world population) into mutually excusive groups and assesses how much inequality is accounted for by difference in incomes between groups versus within these groups (Mookherjee and Shorrocks 1982). The importance of a particular characteristic determining the partition rule will be captured by the proportion of inequality that can be accounted for by differences in average incomes between groups (Cowell and Jenkins 1995).
17
4.2 The emergence of the global middle class
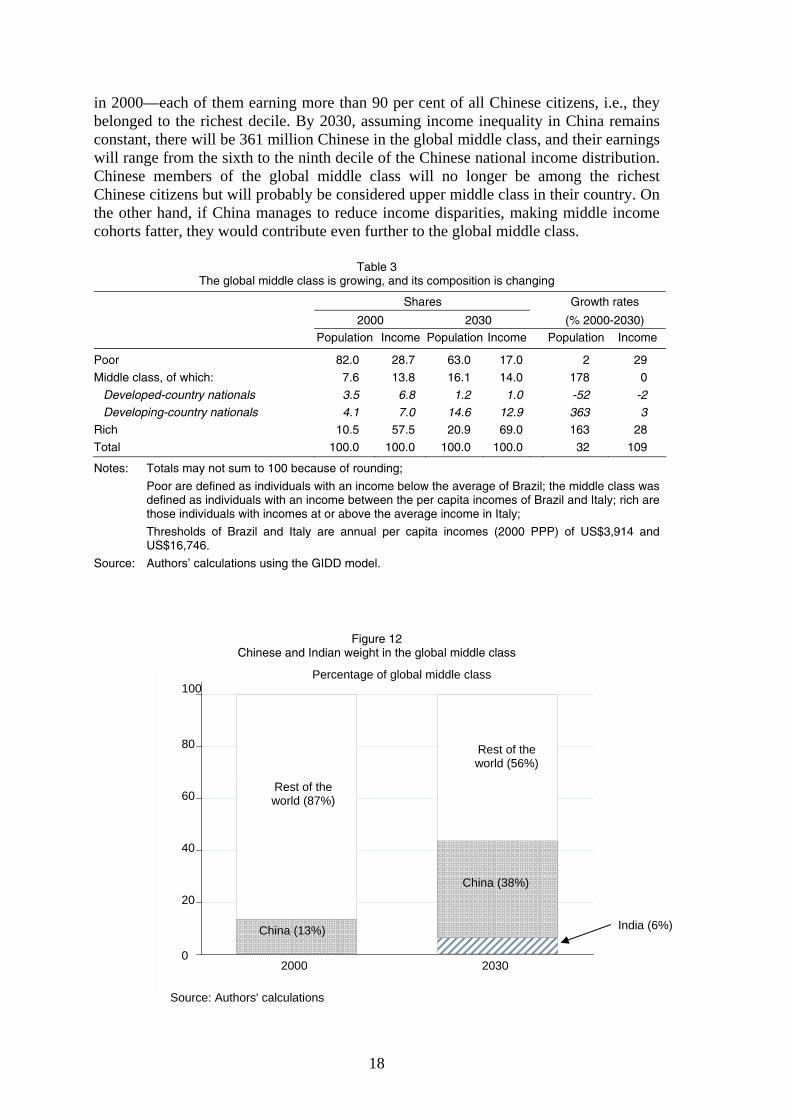
According to our baseline, in 2030, 16.1 per cent of the world population will belong to what can be called a ‘global middle class’, up from 7.6 per cent in 2000. That is, in 2030 more than a billion people in developing countries will buy cars, engage in international tourism, demand world-class products, and require international standards for higher education. Compare that with only 250 million people in developing countries who had access to these kinds of living standards in 2000. This large middle class will create rapidly growing markets for international products and services—and become a new force in domestic politics.
The global middle class is defined here as in Milanovic and Yitzhaki (2002). The authors propose disaggregating the world population into three categories—the poor, the middle class, and the rich—where the middle class is defined by two absolute thresholds equal to the per capita incomes of Brazil and Italy.16 By assigning an individual to the global middle class according to his or her income, Table 3 shows the evolution of this income group and contrasts it with the groups of the poor and the rich.17 This table also shows that the great majority of the global middle-class entrants are citizens of developing countries; hence, tomorrow’s global middle class will be formed, primarily, by today’s citizens from poor countries. The total increase in the global middle class is explained by (i) population growth rates of cohorts within this class that are above the world average, and (ii) by higher economic growth rates in developing countries which pull their citizens out of poverty and into the global middle class. The population growth rates of households within the global middle class (as classified in 2000) was relatively low with an average rate of 18 per cent over the entire period, as opposed to the world average of 32 per cent. Therefore, the great majority of the increase in the global middle class is explained by high economic growth rates taking place in developing countries.
How much of the expected increase in the global middle class is attributable to the economic performance of China and India? Figure 12 divides the global middle class into citizens from China, India and the rest of the World (RoW). In 2000 only 13.5 per cent of the global middle class were Chinese nationals and no Indians belonged to this group.18 By 2030 citizens from China and India had a combined shared of 44 per cent of the global middle class, with the great majority (38 per cent) being Chinese, in fact half of the total 740 million new entrants into the global middle class will be Chinese nationals.
The importance of China and India in the global middle class will depend on their economic and population growth rates and the changes in their within-country income inequality. For instance, in China, 56 million people belonged to the global middle class
16 Italy’s per capita income was used as the upper threshold because it was the country with the lowest
income among the G7; Brazil’s per capita income corresponded to the official poverty line used in rich countries like the US and Germany (about PPP $10 per capita per day).
17 Notice that the definition of poor used here is far from being comparable to the standard $1-a-day definition.
18 It is quite likely that in reality some Indians are within the middle and high income ranges, nevertheless by the way the Indian Household Survey data is being collected, outliers (high income citizens) are not captured at all.
18
in 2000—each of them earning more than 90 per cent of all Chinese citizens, i.e., they belonged to the richest decile. By 2030, assuming income inequality in China remains constant, there will be 361 million Chinese in the global middle class, and their earnings will range from the sixth to the ninth decile of the Chinese national income distribution. Chinese members of the global middle class will no longer be among the richest Chinese citizens but will probably be considered upper middle class in their country. On the other hand, if China manages to reduce income disparities, making middle income cohorts fatter, they would contribute even further to the global middle class.
Table 3 The global middle class is growing, and its composition is changing
Shares Growth rates
2000 2030 (% 2000-2030) Population Income Population Income Population Income
Poor 82.0 28.7 63.0 17.0 2 29
Middle class, of which: 7.6 13.8 16.1 14.0 178 0
Developed-country nationals 3.5 6.8 1.2 1.0 -52 -2
Developing-country nationals 4.1 7.0 14.6 12.9 363 3
Rich 10.5 57.5 20.9 69.0 163 28
Total 100.0 100.0 100.0 100.0 32 109
Notes: Totals may not sum to 100 because of rounding;
Poor are defined as individuals with an income below the average of Brazil; the middle class was defined as individuals with an income between the per capita incomes of Brazil and Italy; rich are those individuals with incomes at or above the average income in Italy;
Thresholds of Brazil and Italy are annual per capita incomes (2000 PPP) of US$3,914 and US$16,746.
Source: Authors’ calculations using the GIDD model.
Figure 12 Chinese and Indian weight in the global middle class
0
20
40
60
80
100
2000 2030
Source: Authors' calculations
Percentage of global middle class
China (13%)
China (38%)
India (6%)
Rest of the world (87%)
Rest of the world (56%)
19
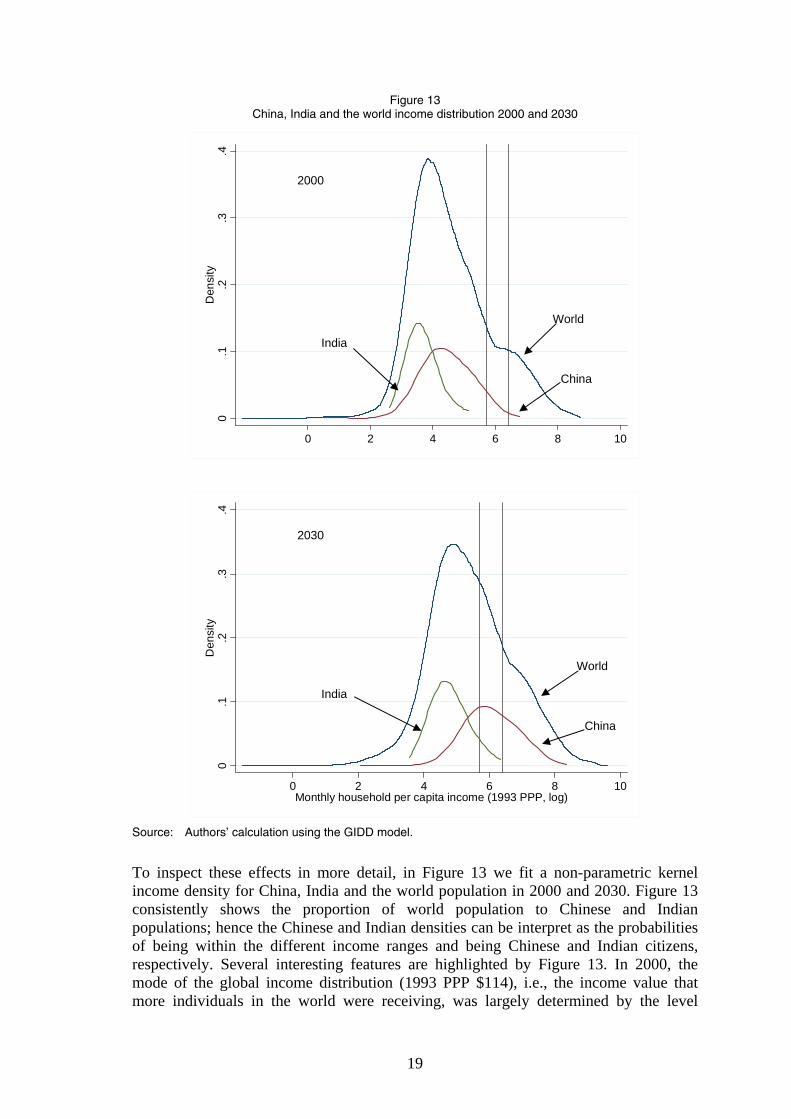
Figure 13 China, India and the world income distribution 2000 and 2030
0.1
.2.3
.4D
ensi
ty
0 2 4 6 8 10
0.1
.2.3
.4D
ensi
ty
0 2 4 6 8 10Monthly household per capita income (1993 PPP, log)
Source: Authors’ calculation using the GIDD model.
To inspect these effects in more detail, in Figure 13 we fit a non-parametric kernel income density for China, India and the world population in 2000 and 2030. Figure 13 consistently shows the proportion of world population to Chinese and Indian populations; hence the Chinese and Indian densities can be interpret as the probabilities of being within the different income ranges and being Chinese and Indian citizens, respectively. Several interesting features are highlighted by Figure 13. In 2000, the mode of the global income distribution (1993 PPP $114), i.e., the income value that more individuals in the world were receiving, was largely determined by the level
India
China
World
India
World
China
2000
2030
20
earned by a high proportion of Indian upper middle-class citizens and members of the Chinese lower middle-class (overlapping of the Chinese and Indian income densities in Figure 13). Focusing on the country-specific distributions, we can see that in 2000 incomes were less skewed in India compared with China (India’s distribution had a larger density around the mean); in 2000, the Gini coefficient for India was equal to 0.29 compared with a value of 0.42 in China. In fact, due to the relatively unequal distribution in China, its richest citizens could be part of the global middle class in 2000. By year 2030, after several years of growth rates higher than the world average, China becomes the country that accounted for more global middle-class members, hence reshaping the global distribution.
Growth in China causes a decrease in the global density around the mode and an increase in the probability of being in income ranges above it. Although India will experience growth rates in per capita incomes above world average, the differential is not large enough to make this country significantly move along the global distribution. Nevertheless, given that the thresholds defining the global middle class are absolute values, India’s growth also results in an increase in the global middle class. India’s entrance into the global middle class is also partly explained by an increase in India’s income inequality, expanding the upper tail of its distribution further to the right along the global density.19 This increase in income dispersion helps the richest 5 per cent Indian citizens enter the global middle class. Growth in China and India and, to a lesser extent, changes in their within-country inequality will have as an effect a tremendous increase in the global middle class resulting in a substantial improvement in global income inequality.
4.3 The consequences of a growing global middle class
The ascent of hundreds of millions of Chinese, Indians and nationals from other developing countries into the global middle class will produce a large group of people in the developing world who can afford, and will demand access to, the standards of living that were previously reserved mainly for the residents of high-income countries. This may have two major implications: the demand for international goods and services will rise, and pressures for policies that favour global integration will increase.
Much of the effect of the middle-class expansion on the world economy will be realized through a changing demand for goods. The fact that the middle class will be growing at a much faster rate than the overall population (Table 3) implies that multinational enterprises will be able to market their products to a much larger audience in 2030 than they do today. Furthermore, the rules of this new global marketplace will be increasingly determined by the tastes and preferences of the developing world, particularly the desires of consumers in China and, to a lesser extent, India. Therefore, while most of the world’s purchasing power will continue to be concentrated in the OECD countries, the global economic influence of those countries will vastly diminish. By 2030 marketing to the developing world will be a much more important strategy for multinationals than it is today.
19 India’s inequality passes from a Gini of 0.29 in 2000 to 0.32 in 2030.
21
The rise of the global middle class will also affect demand for services. For example, given the strong correlation between income and determinants of human capital accumulation like health and education levels, the growing middle class is likely to demand more and better health and education. Therefore the increased emphasis on health and education among the middle class will deepen the human capital stocks hence establishing the foundations for continued growth in the developing countries. However, the increasing demand for education and health is likely to put pressure on the budgets of developing-country governments and will require heightened policy attention in the future.
Today the median voter in most developing countries is unlikely to be a member of the global middle class; by 2030 the middle class members in developing countries will constitute a significant share of their home population, increasing the likelihood of finding the median voter among them. In China, for example, the median and mode earner will be members of the global middle class in 2030 (Figure 14). These changes are likely to have an impact on the domestic policy arena. Some evidence points to a correlation between rising incomes and a shift in demand towards more globalization-supportive policies. Other policy goals—among them improved transparency, intensified anticorruption efforts, and demand for a more open society and cleaner environment—are also likely to move to the forefront of the policy agenda with the expansion in the size of the middle class.
5 Conclusions
This paper analysed, in an ex ante fashion, the effects that economic expansion in China and India will have on global growth and the global income distribution. The results under the baseline scenario show that, between 2005 and 2030, global GDP more than doubles, with China and India accounting for a significant share (18 per cent) of global expansion. In terms of income per capita, in 2005 the average Chinese had an income one-fifth of what the average citizen of a high-income country would earn and, by 2030, this gap narrows to almost one-half. Due to faster population growth and more measured expansion in real GDP, per capita incomes in India are likely to rise much more slowly than in China, catching up from one-tenth of average incomes in rich countries in 2005 to less than one-sixth in 2030. This strong economic expansion of China and India also explains two key features of the evolution of the global income distribution in the next 25 years: (i) a reduction of global inequality and (ii) the emergence of a large ‘global’ middle class. According to our simulations, 4.3 of the 5 points reduction of the global Gini are due to the decline in income differences between Chinese and Indian citizens and the rest of the world. Besides, China, by itself, will account for almost half of the total increase in the ‘global’ middle class (310 million out of the total 740 million new entrants).
These results highlight the fact that aggregate indicators of inequality of the global distribution of income depend heavily on changes between countries and much less on changes within countries. From a global inequality perspective, this is certainly true in a situation where very populous and initially poor countries (China and India) are growing at a rate above that of rich countries. In an era of globalization, global inequality has become more policy relevant. Through easier international movement and communication, citizens in individual countries are more aware of the (economic)
22
situation in other countries and this enhanced awareness is behind emerging political demands (for a more equal global income distribution). Consider for instance the case of multilateral trade negotiations. As illustrated by the impasse in the Doha negotiations, the progress toward freer trade is currently stymied and will take a major effort among the rich and poor countries together to realize even its limited progress. However even though changes between countries explain a lot of the change in the aggregate index, a lot is also happening within countries. These changes of income distribution at the national level are still crucial for domestic policy and growth prospects of individual countries. Indeed, one of the main novelties of the GIDD framework consists of its modelling of within country income distribution. Although not explicitly analysed here, behind the aggregate (global) results reported in the main section of this paper, are changes in the distribution of income within all of the 64 countries for which individual data are available. In fact, increases of inequality within many countries contrast with the reported decrease of the global inequality; however, a thorough analysis of these individual countries’ trends is beyond the scope for this paper and more information can be found in Bussolo, De Hoyos, and Medvedev (2007) and World Bank (2007).
References
Atkinson, A. B., and A. Brandolini (2004). ‘Global World Inequality: Absolute, Relative or Intermediate’. Paper prepared for the 28th Conference of the International Association for Research in Income and Wealth, 22-28 August. Cork.
Bosworth, B. P., and S. M. Collins (2003). ‘The Empirics of Growth: An Update’. Brookings Paper on Economic Activity, 2: 113-206.
Bourguignon, F., and C. Morrison (2002). ‘Inequality among World Citizens: 1890-1992’. American Economic Review, 92 (4): 727-44.
Bourguignon, F., and L. Pereira da Silva (eds) (2003). The Impact of Economic Policies on Poverty and Income Distribution: Evaluation Techniques and Tools. New York: Oxford University Press for the World Bank.
Bussolo, M., J. Lay, and D. van der Mensbrugghe (2006). ‘Structural Change and Poverty Reduction in Brazil: The Impact of the Doha Round’. WB Policy Research Working Paper 3833. Washington, DC: World Bank.
Bussolo, M., R. E. De Hoyos, and D. Medvedev (2007). ‘Demographic Change, Economic Growth, and Income Distribution: An Empirical Analysis Using ex-ante Microsimulations’. Background paper for Global Economic Prospects 2007: Confronting Challenges of the Coming Globalization. Washington, DC: World Bank.
Bryant, R. C. (2004). ‘Cross-Border Macroeconomic Implications of Demographic Change’. Brookings Discussion Paper 166. Washington, DC: Brookings Institution. Available at: www.brookings.edu/views/papers/200409_bdpie166.pdf
Chaudhuri, S., and M. Ravallion (2006). ‘Partially Awakened Giants: Uneven Growth in China and India’. Washington, DC: World Bank. Mimeo.
Chen, S., and M. Ravallion (2003). ‘Household Welfare Impacts of China’s Accession to the World Trade Organization’. WB Policy Research Working Paper 3040. Washington, DC: World Bank.
23
Cowell F. A., and S. P. Jenkins (1995). ‘How Much Inequality Can We Explain? A Methodology and an Application to the United States’. The Economic Journal, 105 (429): 421-30.
David, P. A. (1990). ‘The Dynamo and the Computer: An Historical Perspective on the Modern Productivity Paradox’. The American Economic Review, 80 (2): 355-62.
Ferreira, F. H. G., and P. G. Leite (2003). ‘Meeting the Millennium Development Goals in Brazil: Can Microsimulations Help?’. Economía, 3 (2): 235-79.
Ferreira, F. H. G., and P. G. Leite (2004). ‘Educational Expansion and Income Distribution: A Microsimulation for Ceará’. In A. Shorrocks and R. van der Hoeven (eds), Growth, Inequality and Poverty. Oxford: Oxford University Press for UNU-WIDER.
Gordon, R. J. (2000). ‘Does the “New Economy” Measure Up to the Great Inventions of the Past?’. Journal of Economic Perspectives, 14 (4): 49-74.
Helliwell, J. F. 2004. ‘Demographic Changes and International Factor Mobility’. NBER Research Working Paper 10945. Cambridge, MA: National Bureau of Economic Research.
McKibbin, W. J. (2005). ‘The Global Macroeconomic Consequences of a Demographic Transition’. Sydney: Centre for Applied Macroeconomic Analysis, Australian National University. Processed.
Milanovic, B. (2002). ‘True World Income Distribution, 1988 and 1993: First Calculation Based on Household Surveys Alone’. Economic Journal, 112 (476): 51-92.
Milanovic, B. (2006). ‘Global Income Inequality: What it is and Why it Matters’. WB Working Paper Series 3865. Washington, DC: World Bank.
Milanovic, B., and S. Yitzhaki (2002). ‘Decomposing World Income Distribution: Does the World Have a Middle Class?’. Review of Income and Wealth, 48 (2): 155-78.
Mookherjee, D., and A. Shorrocks (1982). ‘A Decomposition Analysis of the Trend in UK Income Inequality’. The Economic Journal, 92 (368): 886-902.
Quah, D. T. (1996). ‘Twin Peaks: Growth and Convergence in Models of Distribution Dynamics’. Economic Journal, 106 (437): 1045-55.
Tyers, R., and Q. Shi (2005). ‘Global Demographic Change, Labour Force Growth and Economic Performance’. Canberra: Faculty of Economics and Commerce, Australian National University. Processed. June.
van der Mensbrugghe, D. (2005). ‘The LINKAGE Model Technical Documentation’. Washington, DC: World Bank.
Winters, L. A., and S. Yusuf (2006). Dancing with Giants: China, India and the Global Economy. Washington, DC: World Bank; Singapore: Institute of Policy Studies
World Bank (2006). Global Economic Prospects 2007: Confronting Challenges of the Coming Globalization. New York: Oxford University Press for the World Bank.
24
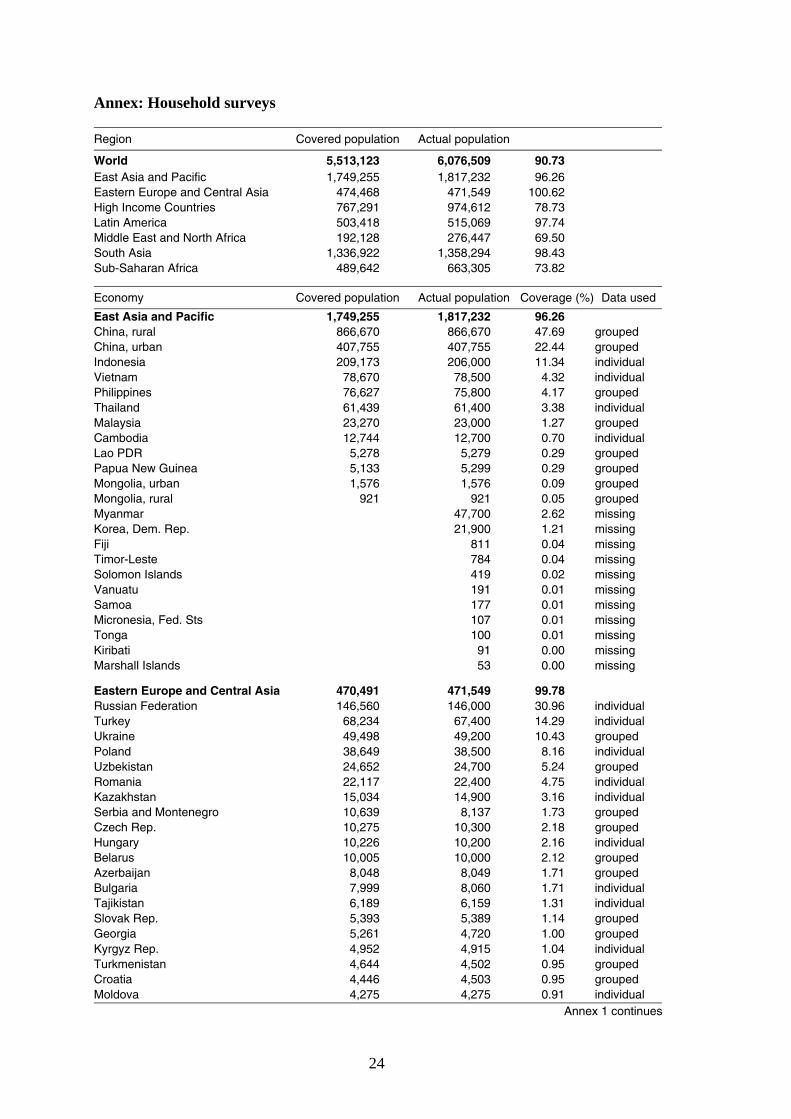
Annex: Household surveys
Region Covered population Actual population
World 5,513,123 6,076,509 90.73 East Asia and Pacific 1,749,255 1,817,232 96.26 Eastern Europe and Central Asia 474,468 471,549 100.62 High Income Countries 767,291 974,612 78.73 Latin America 503,418 515,069 97.74 Middle East and North Africa 192,128 276,447 69.50 South Asia 1,336,922 1,358,294 98.43 Sub-Saharan Africa 489,642 663,305 73.82
Economy Covered population Actual population Coverage (%) Data used
East Asia and Pacific 1,749,255 1,817,232 96.26 China, rural 866,670 866,670 47.69 grouped China, urban 407,755 407,755 22.44 grouped Indonesia 209,173 206,000 11.34 individual Vietnam 78,670 78,500 4.32 individual Philippines 76,627 75,800 4.17 grouped Thailand 61,439 61,400 3.38 individual Malaysia 23,270 23,000 1.27 grouped Cambodia 12,744 12,700 0.70 individual Lao PDR 5,278 5,279 0.29 grouped Papua New Guinea 5,133 5,299 0.29 grouped Mongolia, urban 1,576 1,576 0.09 grouped Mongolia, rural 921 921 0.05 grouped Myanmar 47,700 2.62 missing Korea, Dem. Rep. 21,900 1.21 missing Fiji 811 0.04 missing Timor-Leste 784 0.04 missing Solomon Islands 419 0.02 missing Vanuatu 191 0.01 missing Samoa 177 0.01 missing Micronesia, Fed. Sts 107 0.01 missing Tonga 100 0.01 missing Kiribati 91 0.00 missing Marshall Islands 53 0.00 missing Eastern Europe and Central Asia 470,491 471,549 99.78 Russian Federation 146,560 146,000 30.96 individual Turkey 68,234 67,400 14.29 individual Ukraine 49,498 49,200 10.43 grouped Poland 38,649 38,500 8.16 individual Uzbekistan 24,652 24,700 5.24 grouped Romania 22,117 22,400 4.75 individual Kazakhstan 15,034 14,900 3.16 individual Serbia and Montenegro 10,639 8,137 1.73 grouped Czech Rep. 10,275 10,300 2.18 grouped Hungary 10,226 10,200 2.16 individual Belarus 10,005 10,000 2.12 grouped Azerbaijan 8,048 8,049 1.71 grouped Bulgaria 7,999 8,060 1.71 individual Tajikistan 6,189 6,159 1.31 individual Slovak Rep. 5,393 5,389 1.14 grouped Georgia 5,261 4,720 1.00 grouped Kyrgyz Rep. 4,952 4,915 1.04 individual Turkmenistan 4,644 4,502 0.95 grouped Croatia 4,446 4,503 0.95 grouped Moldova 4,275 4,275 0.91 individual Annex 1 continues
25
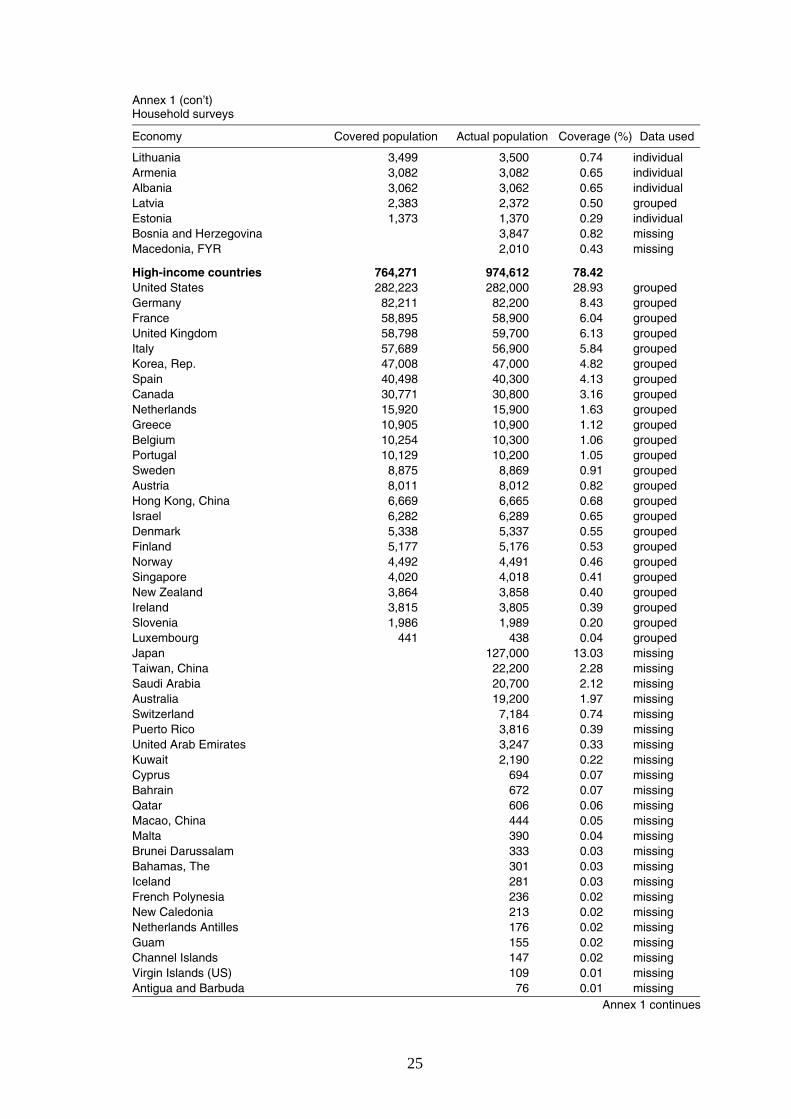
Annex 1 (con’t) Household surveys
Economy Covered population Actual population Coverage (%) Data used
Lithuania 3,499 3,500 0.74 individual Armenia 3,082 3,082 0.65 individual Albania 3,062 3,062 0.65 individual Latvia 2,383 2,372 0.50 grouped Estonia 1,373 1,370 0.29 individual Bosnia and Herzegovina 3,847 0.82 missing Macedonia, FYR 2,010 0.43 missing High-income countries 764,271 974,612 78.42 United States 282,223 282,000 28.93 grouped Germany 82,211 82,200 8.43 grouped France 58,895 58,900 6.04 grouped United Kingdom 58,798 59,700 6.13 grouped Italy 57,689 56,900 5.84 grouped Korea, Rep. 47,008 47,000 4.82 grouped Spain 40,498 40,300 4.13 grouped Canada 30,771 30,800 3.16 grouped Netherlands 15,920 15,900 1.63 grouped Greece 10,905 10,900 1.12 grouped Belgium 10,254 10,300 1.06 grouped Portugal 10,129 10,200 1.05 grouped Sweden 8,875 8,869 0.91 grouped Austria 8,011 8,012 0.82 grouped Hong Kong, China 6,669 6,665 0.68 grouped Israel 6,282 6,289 0.65 grouped Denmark 5,338 5,337 0.55 grouped Finland 5,177 5,176 0.53 grouped Norway 4,492 4,491 0.46 grouped Singapore 4,020 4,018 0.41 grouped New Zealand 3,864 3,858 0.40 grouped Ireland 3,815 3,805 0.39 grouped Slovenia 1,986 1,989 0.20 grouped Luxembourg 441 438 0.04 grouped Japan 127,000 13.03 missing Taiwan, China 22,200 2.28 missing Saudi Arabia 20,700 2.12 missing Australia 19,200 1.97 missing Switzerland 7,184 0.74 missing Puerto Rico 3,816 0.39 missing United Arab Emirates 3,247 0.33 missing Kuwait 2,190 0.22 missing Cyprus 694 0.07 missing Bahrain 672 0.07 missing Qatar 606 0.06 missing Macao, China 444 0.05 missing Malta 390 0.04 missing Brunei Darussalam 333 0.03 missing Bahamas, The 301 0.03 missing Iceland 281 0.03 missing French Polynesia 236 0.02 missing New Caledonia 213 0.02 missing Netherlands Antilles 176 0.02 missing Guam 155 0.02 missing Channel Islands 147 0.02 missing Virgin Islands (US) 109 0.01 missing Antigua and Barbuda 76 0.01 missing Annex 1 continues
26
Annex 1 (con’t) Household surveys
Economy Covered population Actual population Coverage (%) Data used
Isle of Man 76 0.01 missing Bermuda 62 0.01 missing Greenland 56 0.01 missing Latin America 503,418 515,069 97.74 Brazil 173,860 174,000 33.78 individual Mexico 100,088 98,000 19.03 individual Colombia 42,120 42,100 8.17 individual Argentina 36,897 36,900 7.16 individual Peru 25,953 26,000 5.05 individual Venezuela, RB 24,418 24,300 4.72 individual Chile 15,412 15,400 2.99 individual Ecuador 12,306 12,300 2.39 individual Guatemala 11,166 11,200 2.17 individual Bolivia 8,318 8,317 1.61 individual Dominican Rep. 8,265 8,265 1.60 individual Haiti 7,941 7,939 1.54 individual Honduras 6,423 6,424 1.25 individual El Salvador 6,281 6,280 1.22 individual Paraguay 5,468 5,346 1.04 individual Nicaragua 4,958 4,920 0.96 individual Costa Rica 3,928 3,929 0.76 individual Uruguay 3,343 3,342 0.65 individual Panama 2,949 2,950 0.57 individual Jamaica 2,585 2,589 0.50 grouped Guyana 744 744 0.14 individual Cuba 11,100 2.16 missing Trinidad and Tobago 1,285 0.25 missing Suriname 434 0.08 missing Barbados 266 0.05 missing Belize 250 0.05 missing St Lucia 156 0.03 missing St Vincent and the Grenadines 116 0.02 missing Grenada 101 0.02 missing Dominica 71 0.01 missing St Kitts and Nevis 44 0.01 missing Middle East and North Africa 192,128 276,447 69.50 Egypt, Arab Rep. 67,288 67,300 24.34 individual Iran, Islamic Rep. 63,661 63,700 23.04 grouped Morocco 28,706 27,800 10.06 grouped Yemen, Rep. 17,936 17,900 6.48 individual Tunisia 9,565 9,564 3.46 grouped Jordan 4,973 4,857 1.76 individual Algeria 30,500 11.03 missing Iraq 23,200 8.39 missing Syrian Arab Rep. 16,800 6.08 missing Libya 5,306 1.92 missing Lebanon 3,398 1.23 missing West Bank and Gaza 2,966 1.07 missing Oman 2,442 0.88 missing Djibouti 715 0.26 missing South Asia 1,336,922 1,358,294 98.43 India 1,021,082 1,020,000 75.09 individual Pakistan 142,650 138,000 10.16 individual Bangladesh 128,914 129,000 9.50 individual Annex 1 continues
27
Annex 1 (con’t) Household surveys
Economy Covered population Actual population Coverage (%) Data used
Nepal 24,430 24,400 1.80 individual Sri Lanka 19,847 19,400 1.43 individual Afghanistan 26,600 1.96 missing Bhutan 604 0.04 missing Maldives 290 0.02 missing Sub-Saharan Africa 489,088 663,305 73.73 Nigeria 117,608 118,000 17.79 individual Ethiopia 68,527 64,300 9.69 individual South Africa 45,610 44,000 6.63 individual Tanzania 34,761 34,800 5.25 individual Kenya 30,094 30,700 4.63 grouped Uganda 24,309 24,300 3.66 individual Ghana 19,593 19,900 3.00 grouped Côte d'Ivoire 16,734 16,700 2.52 individual Madagascar 16,196 16,200 2.44 individual Cameroon 14,855 14,900 2.25 individual Zimbabwe 12,649 12,600 1.90 grouped Zambia 12,594 10,700 1.61 individual Niger 11,781 11,800 1.78 individual Burkina Faso 11,291 11,300 1.70 individual Senegal 10,342 10,300 1.55 individual Malawi 10,308 11,500 1.73 grouped Guinea 8,433 8,434 1.27 individual Rwanda 8,024 8,025 1.21 individual Burundi 6,488 6,486 0.98 individual Sierra Leone 4,509 4,509 0.68 individual Mauritania 2,643 2,645 0.40 individual Lesotho 1,743 1,788 0.27 grouped Congo, Dem. Rep. 50,100 7.55 missing Sudan 32,900 4.96 missing Mozambique 17,900 2.70 missing Angola 13,800 2.08 missing Mali 11,600 1.75 missing Chad 8,216 1.24 missing Benin 7,197 1.09 missing Somalia 7,012 1.06 missing Togo 5,364 0.81 missing Central African Rep. 3,777 0.57 missing Eritrea 3,557 0.54 missing Congo, Rep. 3,438 0.52 missing Liberia 3,065 0.46 missing Namibia 1,894 0.29 missing Botswana 1,754 0.26 missing Guinea-Bissau 1,366 0.21 missing Gambia, The 1,316 0.20 missing Gabon 1,272 0.19 missing Mauritius 1,187 0.18 missing Swaziland 1,045 0.16 missing Comoros 540 0.08 missing Cape Verde 451 0.07 missing Equatorial Guinea 449 0.07 missing São Tomé and Principe 140 0.02 missing Seychelles 81 0.01 missing
28
Table A2 Structure of production, consumption, exports, and imports (% of total)
Agriculture Processed
foods Fossil fuels Manufacturing
Services
2005 2030 2005 2030 2005 2030 2005 2030 2005 2030
Production China 7 3 4 3 1 1 49 46 38 47 India 17 12 3 2 1 1 29 28 50 57 East Asia ex. China 9 6 5 4 3 2 42 43 41 44 Eastern Europe 10 7 6 5 4 3 33 31 46 54 Latin America 8 6 6 5 2 2 27 24 57 63 Middle East 8 5 3 2 12 9 19 23 58 61 South Asia ex. India 21 15 4 3 1 0 26 29 48 52 Sub-Saharan Africa 12 9 7 5 6 6 25 23 50 57 Developing 9 6 5 4 3 2 34 35 48 54 High income 3 4 3 3 0 0 26 19 68 74 Exports China 5 0 3 2 0 0 88 97 4 0 India 4 2 4 3 0 0 76 92 16 3 East Asia 3 2 4 4 4 3 79 90 9 1 Eastern Europe 3 1 3 3 10 7 71 86 13 3 Latin America 12 8 6 5 7 6 64 80 11 1 Middle East 2 1 1 1 40 26 42 70 15 3 South Asia 7 6 3 3 1 1 77 88 12 2 SSA 8 6 5 4 24 22 54 67 10 1 Developing 5 2 4 3 10 6 71 87 10 2 High income 4 7 2 2 1 1 68 57 24 33 Imports China 15 20 0 0 2 4 71 53 12 23 India 3 3 2 2 14 14 60 54 20 28 East Asia 4 3 4 2 3 2 70 70 20 23 Eastern Europe 6 8 4 2 6 5 67 62 17 21 Latin America 6 6 3 2 2 2 68 67 21 23 Middle East 7 7 4 4 1 1 65 61 23 28 South Asia 7 4 4 3 4 3 61 62 23 29 Sub-Saharan Africa 6 5 4 3 2 2 58 54 29 36 Developing 8 10 3 2 3 3 67 61 18 24 High income 3 2 3 3 4 4 70 77 19 14 Private consumption China 28 17 13 9 0 0 23 18 36 55 India 33 22 7 6 0 0 13 13 46 58 East Asia 17 13 12 10 0 0 20 18 51 59 Eastern Europe 15 11 12 9 1 1 19 17 53 62 Latin America 10 8 11 10 0 0 19 18 61 64 Middle East 16 13 9 8 0 0 17 17 58 63 South Asia 35 27 10 8 0 0 14 14 42 51 SSA 21 17 17 15 0 0 17 16 45 52 Developing 18 14 11 9 0 0 19 17 52 60 High income 4 3 6 5 0 0 15 15 75 76
Related Documents