Global Greenhouse Gas Emissions Preeti Dasari, Aneesha Wagh and Julia Yun MTH 291-01

Global Greenhouse Gas Emissions Preeti Dasari, Aneesha Wagh and Julia Yun MTH 291-01.
Dec 22, 2015
Welcome message from author
This document is posted to help you gain knowledge. Please leave a comment to let me know what you think about it! Share it to your friends and learn new things together.
Transcript

Global Greenhouse Gas EmissionsPreeti Dasari, Aneesha Wagh and Julia YunMTH 291-01

Introduction
CO2 Emissions:“those stemming from the burning of fossil fuels and the
manufacture of cement. They include carbon dioxide produced during consumption of solid, liquid, and gas fuels and gas flaring.”
- World Bank
Purpose of Study:- climate change and environmental issues- effect over the years
Pitch SOS CO2 emissions. (n.d.). Retrieved April 29, 2015, from http://www.cartoonmovement.com/cartoon/10261

Goals
1. Determining factors that affect CO2 gas emissions2. Comparing country groups and time periods
a. High Income (gdp per capita > 12616)b. Middle Income (12616 < gdp per capita < 1035)
c. Low Income (gdp per capita < 1035)
3. Cross-validation of year 2000 data with year 2010 model
Data Source: World Bank Climate Change Database

VariablesResponse Variable- CO2 Gas Emissions (kt)
Explanatory Variables- GDP per capita (US$)
- Energy Use (kt of oil equivalent)
- Access to Electricity (ATE) (% of total population)
- Electricity Production (kWh)
- Agricultural Land (% of land area)
- Forest Land (% of land area)
- Population in urban agglomerations of more than 1 million (% of total population)
- Time: year 2010 and year 2000

Data / Missing Data
● 429 observations● approximately 42% of data missing ● regression model used to impute data for all variables

Transformations

Final Model (year 2010)
log(CO2emission) = βo + β1*log(energy.use) + β2*log(electprod) + β3*(ATE^2) + β4*forest.land + β5*agri.land + ε

Diagnostic Plots
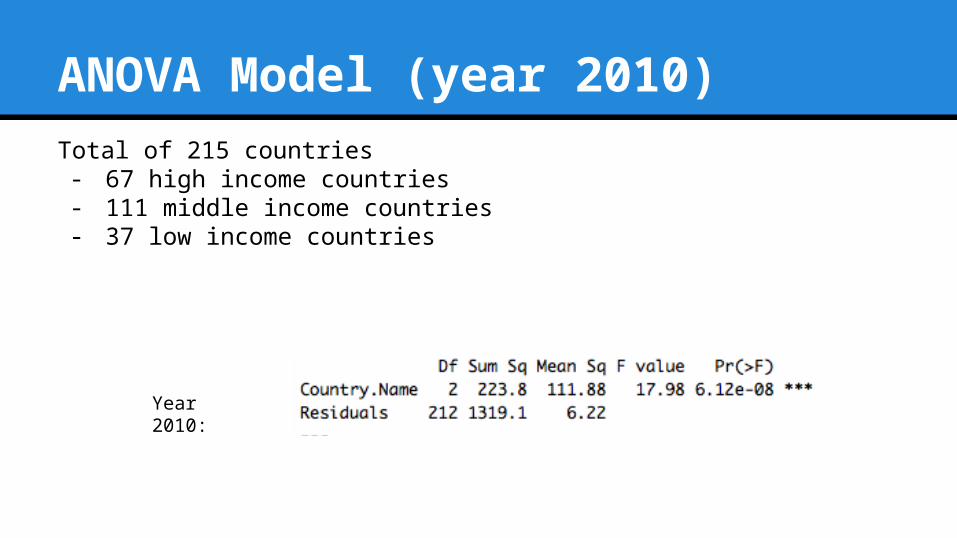
ANOVA Model (year 2010)
Total of 215 countries- 67 high income countries- 111 middle income countries- 37 low income countries
Year 2010:

ANOVA Model (year 2010)
Density Plot
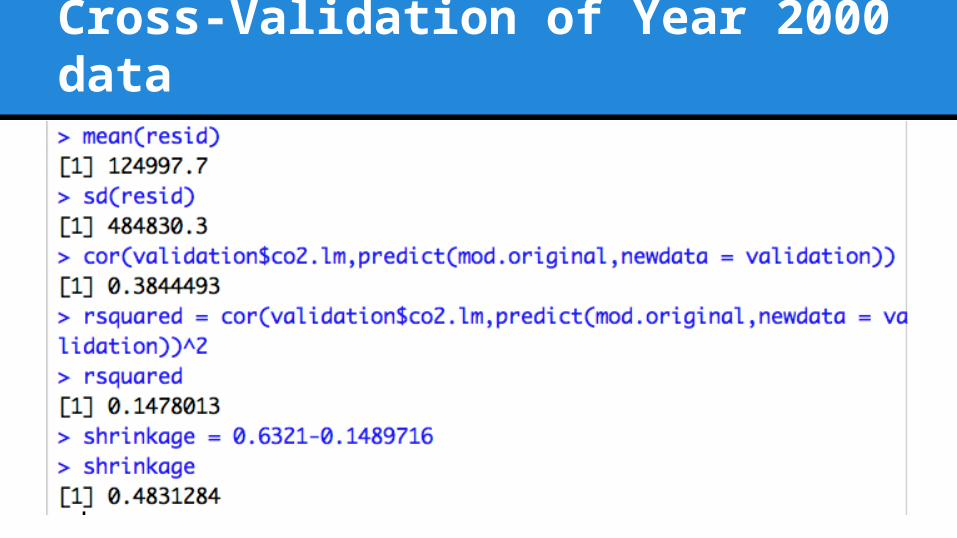
Cross-Validation of Year 2000 data

2000 vs 2010
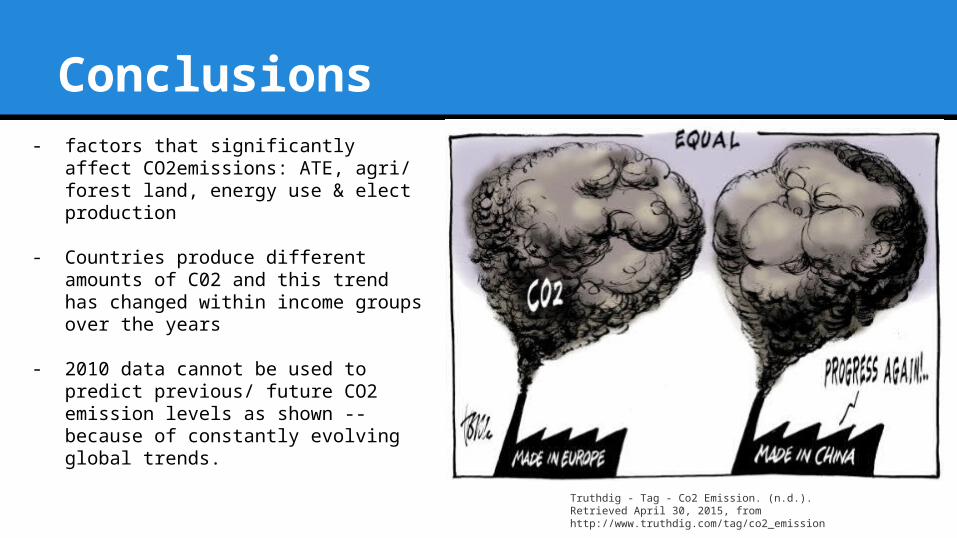
Conclusions- factors that significantly affect
CO2emissions: ATE, agri/ forest land, energy use & elect production
- Countries produce different amounts of C02 and this trend has changed within income groups over the years
- 2010 data cannot be used to predict previous/ future CO2 emission levels as shown -- because of constantly evolving global trends.
Truthdig - Tag - Co2 Emission. (n.d.). Retrieved April 30, 2015, from http://www.truthdig.com/tag/co2_emission
Related Documents