BioMed Central Page 1 of 19 (page number not for citation purposes) BMC Cancer Open Access Research article Global gene expression analysis in time series following N-acetyl L-cysteine induced epithelial differentiation of human normal and cancer cells in vitro Anna C Gustafsson 1 , Ilya Kupershmidt 1,2 , Esther Edlundh-Rose 1 , Giulia Greco 3 , Annalucia Serafino 3 , Eva K Krasnowska 3 , Thomas Lundeberg 4 , Luisa Bracci-Laudiero 5 , Maria-Concetta Romano 5 , Tiziana Parasassi 3 and Joakim Lundeberg* 1 Address: 1 Royal Institute of Technology, AlbaNova University Center, Department of Biotechnology, Roslagstullsbacken 21, SE-106 91 Stockholm, Sweden, 2 Silicon Genetics, 2601 Spring Street, Redwood City, California 94063, USA, 3 Istituto di Neurobiologia e Medicina Molecolare, CNR, Viale Marx 15-43, 00137 Roma, Italy, 4 Rehabilitation Medicine, Karolinska University Hospital, 117 76 Stockholm, Sweden and 5 Associazione Italiana Iniziativa Medicina Sociale, Corso Trieste 16, 00185 Roma, Italy Email: Anna C Gustafsson - [email protected]; Ilya Kupershmidt - [email protected]; Esther Edlundh-Rose - esther.edlundh- [email protected]; Giulia Greco - [email protected]; Annalucia Serafino - [email protected]; Eva K Krasnowska - [email protected]; Thomas Lundeberg - [email protected]; Luisa Bracci-Laudiero - [email protected]; Maria-Concetta Romano - [email protected]; Tiziana Parasassi - [email protected]; Joakim Lundeberg* - [email protected] * Corresponding author Abstract Background: Cancer prevention trials using different types of antioxidant supplements have been carried out at several occasions and one of the investigated compounds has been the antioxidant N-acetyl-L-cysteine (NAC). Studies at the cellular level have previously demonstrated that a single supplementation of NAC induces a ten-fold more rapid differentiation in normal primary human keratinocytes as well as a reversion of a colon carcinoma cell line from neoplastic proliferation to apical-basolateral differentiation [1]. The investigated cells showed an early change in the organization of the cytoskeleton, several newly established adherens junctions with E-cadherin/β- catenin complexes and increased focal adhesions, all features characterizing the differentiation process. Methods: In order to investigate the molecular mechanisms underlying the proliferation arrest and accelerated differentiation induced by NAC treatment of NHEK and Caco-2 cells in vitro, we performed global gene expression analysis of NAC treated cells in a time series (1, 12 and 24 hours post NAC treatment) using the Affymetrix GeneChip™ Human Genome U95Av2 chip, which contains approximately 12,000 previously characterized sequences. The treated samples were compared to the corresponding untreated culture at the same time point. Results: Microarray data analysis revealed an increasing number of differentially expressed transcripts over time upon NAC treatment. The early response (1 hour) was transient, while a constitutive trend was commonly found among genes differentially regulated at later time points (12 and 24 hours). Connections to the induction of differentiation and inhibition of growth were identified for a majority of up- and down-regulated genes. All of the observed transcriptional Published: 07 July 2005 BMC Cancer 2005, 5:75 doi:10.1186/1471-2407-5-75 Received: 12 August 2004 Accepted: 07 July 2005 This article is available from: http://www.biomedcentral.com/1471-2407/5/75 © 2005 Gustafsson et al; licensee BioMed Central Ltd. This is an Open Access article distributed under the terms of the Creative Commons Attribution License (http://creativecommons.org/licenses/by/2.0 ), which permits unrestricted use, distribution, and reproduction in any medium, provided the original work is properly cited.

Welcome message from author
This document is posted to help you gain knowledge. Please leave a comment to let me know what you think about it! Share it to your friends and learn new things together.
Transcript

BioMed CentralBMC Cancer
ss
Open AcceResearch articleGlobal gene expression analysis in time series following N-acetyl L-cysteine induced epithelial differentiation of human normal and cancer cells in vitroAnna C Gustafsson1, Ilya Kupershmidt1,2, Esther Edlundh-Rose1, Giulia Greco3, Annalucia Serafino3, Eva K Krasnowska3, Thomas Lundeberg4, Luisa Bracci-Laudiero5, Maria-Concetta Romano5, Tiziana Parasassi3 and Joakim Lundeberg*1Address: 1Royal Institute of Technology, AlbaNova University Center, Department of Biotechnology, Roslagstullsbacken 21, SE-106 91 Stockholm, Sweden, 2Silicon Genetics, 2601 Spring Street, Redwood City, California 94063, USA, 3Istituto di Neurobiologia e Medicina Molecolare, CNR, Viale Marx 15-43, 00137 Roma, Italy, 4Rehabilitation Medicine, Karolinska University Hospital, 117 76 Stockholm, Sweden and 5Associazione Italiana Iniziativa Medicina Sociale, Corso Trieste 16, 00185 Roma, Italy
Email: Anna C Gustafsson - [email protected]; Ilya Kupershmidt - [email protected]; Esther Edlundh-Rose - [email protected]; Giulia Greco - [email protected]; Annalucia Serafino - [email protected]; Eva K Krasnowska - [email protected]; Thomas Lundeberg - [email protected]; Luisa Bracci-Laudiero - [email protected]; Maria-Concetta Romano - [email protected]; Tiziana Parasassi - [email protected]; Joakim Lundeberg* - [email protected]
* Corresponding author
AbstractBackground: Cancer prevention trials using different types of antioxidant supplements have beencarried out at several occasions and one of the investigated compounds has been the antioxidantN-acetyl-L-cysteine (NAC). Studies at the cellular level have previously demonstrated that a singlesupplementation of NAC induces a ten-fold more rapid differentiation in normal primary humankeratinocytes as well as a reversion of a colon carcinoma cell line from neoplastic proliferation toapical-basolateral differentiation [1]. The investigated cells showed an early change in theorganization of the cytoskeleton, several newly established adherens junctions with E-cadherin/β-catenin complexes and increased focal adhesions, all features characterizing the differentiationprocess.
Methods: In order to investigate the molecular mechanisms underlying the proliferation arrest andaccelerated differentiation induced by NAC treatment of NHEK and Caco-2 cells in vitro, weperformed global gene expression analysis of NAC treated cells in a time series (1, 12 and 24 hourspost NAC treatment) using the Affymetrix GeneChip™ Human Genome U95Av2 chip, whichcontains approximately 12,000 previously characterized sequences. The treated samples werecompared to the corresponding untreated culture at the same time point.
Results: Microarray data analysis revealed an increasing number of differentially expressedtranscripts over time upon NAC treatment. The early response (1 hour) was transient, while aconstitutive trend was commonly found among genes differentially regulated at later time points(12 and 24 hours). Connections to the induction of differentiation and inhibition of growth wereidentified for a majority of up- and down-regulated genes. All of the observed transcriptional
Published: 07 July 2005
BMC Cancer 2005, 5:75 doi:10.1186/1471-2407-5-75
Received: 12 August 2004Accepted: 07 July 2005
This article is available from: http://www.biomedcentral.com/1471-2407/5/75
© 2005 Gustafsson et al; licensee BioMed Central Ltd. This is an Open Access article distributed under the terms of the Creative Commons Attribution License (http://creativecommons.org/licenses/by/2.0), which permits unrestricted use, distribution, and reproduction in any medium, provided the original work is properly cited.
Page 1 of 19(page number not for citation purposes)

BMC Cancer 2005, 5:75 http://www.biomedcentral.com/1471-2407/5/75
changes, except for seven genes, were unique to either cell line. Only one gene, ID-1, was mutuallyregulated at 1 hour post treatment and might represent a common mediator of early NAC action.
The detection of several genes that previously have been identified as stimulated or repressedduring the differentiation of NHEK and Caco-2 provided validation of results. In addition, real-timekinetic PCR analysis of selected genes also verified the differential regulation as identified by themicroarray platform.
Conclusion: NAC induces a limited and transient early response followed by a more consistentand extensively different expression at later time points in both the normal and cancer cell linesinvestigated. The responses are largely related to inhibition of proliferation and stimulation ofdifferentiation in both cell types but are almost completely lineage specific. ID-1 is indicated as anearly mediator of NAC action.
BackgroundMost human cancers arise in epithelial cells, underliningthe importance of understanding the molecular biology ofcancer and the complex balance of proliferation and dif-ferentiation in this cell type. Increased knowledge of theseprocesses may provide unique targets for the future devel-opment of pharmacotherapy aiming at halting or revers-ing metastasis and cancer growth.
N-acetyl-L-cysteine (NAC) is a membrane permeable ami-nothiol that functions as a nucleophilic ROS scavengerand antioxidant as well as a precursor of intracellularcysteine and glutathione (GSH). The reduced cysteine rep-resents the active form, as opposed to the inactive oxi-dized cystine dimer. To date, NAC is used as a mucolyticand as acute treatment of fulminant hepatic failure fol-lowing paracetamol poisoning. However, cancer prevent-ing and therapeutic effects have also been suggested. Inparticular, NAC has been demonstrated to induce anti-proliferative and differentiating effects in normal humanepidermal keratinocytes (NHEK), as well as in the epithe-lial colon cancer cell line Caco-2 [1]. Primary normalhuman epidermal keratinocytes (NHEK) undergo sponta-neous terminal differentiation over 30 days in culture.However, if supplemented with 2 mM NAC 24 hrs afterseeding, an accelerated differentiation process can beobserved. Three days post NAC exposure, differentiationof NHEK is demonstrated by an increased number ofintercellular junctions, basal localization of cytokeratinand apical localization of actin determined by scanningelectron micrographs of cells and sub-structures and highresolution confocal fluorescence immuno micrographs offor example β-catenin, E-cadherin, actin and cytokeratins.Furthermore ceased proliferation can be demonstrated by3H thymidine incorporation without accompanyingapoptosis experimentally verified by properdium iodidelabelling and flow cytometry. Interestingly, an epithelialcolon cancer cell line responded in analogy with the nor-mal epithelial cells. Caco-2 differentiate spontaneouslyover a period of around 25–30 days in culture [2]. How-
ever, when a single supplement of 10 mM NAC was givento Caco-2 cells 24 hrs after seeding, the proliferationdecreased and the cells progressed to a differentiated statein three days without any sign of apoptosis [1]. Here thedifferences in gene expression was studied overtime forboth NHEK and Caco-2 cells using microarray technologywith subsequent confirmation of a selected set of genes.The results are discussed from the perspective of acceler-ated differentiation and growth arrest.
MethodsCell culturesNormal human epidermal keratinocytes, NHEK (Cam-brex, San Diego, CA), plated at a density of 8 × 10³ cells/cm2, were grown in KGM® medium plus KGM® Sin-gleQuots® (Cambrex). The Caco-2 human colon carci-noma cells were seeded at a density of 9 × 10³ cells/cm2,grown in Dulbecco's modified Eagle minimum essentialmedium (DMEM, GIBCO Labs, Grand Island, N.Y.), sup-plemented with 10% (v/v) heat-inactivated fetal calfserum (GIBCO Labs), L-glutamine (2 mM), penicillin (50IU/ml) and streptomycin (50 mg/ml). The N-acetyl-L-cysteine (NAC, Sigma Chem. Co., St Louis, MO) stocksolution (20 mM in KGM and 100 mM in DMEM) wasstored at 4°C in the dark and used within 1 week frompreparation. Twenty-four hrs after seeding, filter sterilizedNAC solution was added to the cell cultures to a final con-centration of 2 mM and 10 mM in NHEK and Caco-2respectively. The concentrations were selected after per-forming a dose-dependent inhibition analysis for each ofthe two cell types [1].
Scanning electron microscopyCells grown on coverslips were fixed with 2.5% glutharal-dehyde in 0.1 M Millonig's phosphate buffer (MPB) at4°C for 1 hr. After washing in MPB, cells were post-fixedwith 1% OsO4 in the same buffer for 1 hr at 4°C and dehy-drated in increasing acetone concentrations. The speci-mens were critical-point dried using liquid CO2 andsputter-coated with gold before examination on a
Page 2 of 19(page number not for citation purposes)

BMC Cancer 2005, 5:75 http://www.biomedcentral.com/1471-2407/5/75
Stereoscan 240 scanning electron microscope (CambridgeInstr., Cambridge, UK).
Experimental set upFrom the normal (NHEK) cells, RNA was obtained fromcultures grown for 1, 12 and 24 hrs after NAC treatmentas well as from untreated cells at the same time points.Replicates at the level of individually performed cDNAsynthesis were used for hybridisation in duplicate for the1, 12 and 24 h time points except for one fall out of a 24hrs post NAC treated sample. RNA was extracted fromboth treated and non-treated cancer (Caco-2) cell culturesat 1, 12 and 24 hrs. Biological replicates were used forhybridisation in a duplicate fashion for both treated andnon-treated samples.
RNA extraction, purification and quality controlThe total RNA was extracted from cell cultures using Trizol(Gibco BRL, NY, USA) according to the manufacturersinstructions. Thereafter mRNA was extracted by oligo dTDynabeads (Dynal, Oslo, Norway) and the quality ofmRNA was validated using the Bioanalyzer 2100 (Agilenttechnologies, Waldbrunn, Germany).
Target preparation and hybridisationA total of 8 micrograms of mRNA from each sample wasused to perform cDNA synthesis. Following in vitro tran-scription, the biotin labelled cRNA was fragmented and atotal of 15 micrograms were subsequently hybridised andanalysed on the Affymetrix GeneChip™, all according tothe manufacturers instructions (Affymetrix, Santa Clara,USA) with scanning performed on the GeneArray 2500AScanner (Affymetrix, Santa Clara, USA).
Data analysisThe MAS 5.0 software package (Affymetrix Inc.) was usedto compute cell intensity files (.cel) for each chip. For thepurpose of inspection of parameters important to qualitycontrol, chip files (.chp) were also generated for each chipusing the statistical expression algorithm. Next, individualprobeset intensity values were computed based on the cellintensity files using the RMA algorithm within the Biocon-ductor package. All data was analysed in three separatebatches (2 separate sample preparation batches for theCaco-2 cell line and one for NHEK cell line. Each batchalso included RNA samples obtained from 30 min, 3 hrsand 48 hrs treated and untreated cell cultures which arenot presented in this manuscript). The RMA backgroundcorrection, quantile normalization, only PM probe correc-tion and a median polishing were applied. Next, dataprobeset intensities from each sample were converted to abiological fold ratio between the treated and control sam-ple. To generate the ratio, signal intensities of each treatedsample were divided by the control sample intensities foreach corresponding time point, separately within each
RMA batch. Because of a missing 24 hrs control for NHEKcell line due to fallout, time point 12 hrs control was usedinstead (detailed investigation showed that control sam-ples at each time point were extremely similar to eachother, rationalizing this choice). The average of replicatesfor each time point in two cell lines was used in the down-stream analysis. Due to the quality control issues encoun-tered with time point 24 hrs NHEK cell line, only onereplicate was used. The standard deviation statistics wascalculated using the Global Error Model based on devia-tion from one (GeneSpring, Silicon Genetics). A final totalof 6 conditions were generated (1, 12, 24 hrs time pointsfor NHEK and Caco-2). The MIAME compatible dataset ismade available at the ArrayExpress expression data repos-itory at EMBL.
In order to identify genes that show significant changesduring treatment we searched for genes that show signifi-cant up- or down-regulation in treatment relative to thecontrol, in at least one of the time point for one of the celllines (filtering was done using the t-test p-value < 0.01,indicating significant deviation from the control value orfrom the ratio of 1). Two-way hierarchical clustering ofgenes and conditions was performed using the set of pre-filtered genes (2054) and Standard correlation. In order toidentify genes with significant NAC treatment response ateach time point for each cell line we applied a two-step fil-tering based on the t-test p-value of less than 0.1 (indicat-ing statistically significant changes from the controlvalue), and a biological fold cut-off of 1.5 fold (up ordown). A total of 6 genelists (3 for each cell line) was pro-duced and visualized graphically for common distinctpatterns. Data filtering and visualization was performedusing GeneSpring (Silicon Genetics). To assess the over-representation of functional groups, according to GeneOntology, the publicly available tool EASE (v2.0) wasused [3].
Real-time kinetic PCRValidation of microarray results was performed by quanti-fying relative mRNA expression levels of several genes ofinterest. Two RT-PCR formats were used for the investi-gated genes. The first relied on primers and TaqManprobes obtained from Applied Biosystems and theirAssay-on-demand system and the second approach wasbased on in-house designed primers and SYBR greendetection. The assays used either the glyceraldehyde-3-phosphate dehydrogenase (GAPDH) or the transferrinreceptor (TFR) as the endogenous internal reference gene.
For the first method, cDNA synthesis was performed usingSuperScript™ III (Invitrogen) in a 20 µl reaction contain-ing: 1x first strand buffer, 5 mM DDT, 40 U RNasin(Promega), 5 µg total RNA, 200 U SuperScript™ III, 250mM oligo(dT)20 primer, 0,5 mM dNTP each dATP, dGTP,
Page 3 of 19(page number not for citation purposes)

BMC Cancer 2005, 5:75 http://www.biomedcentral.com/1471-2407/5/75
dCTP, dTTP. Primer, total RNA and nucleotides wereheated to 65°C for 5 min and subsequently cooled on icefor 1 min. After addition of the other reagents the sampleswere incubated at 50°C for approximately 60 min.Finally, the reaction was inactivated by heating to 70°Cfor 15 min. Assays-on-Demand (Applied Biosystems),containing gene specific primers and probes labelled with6-carboxyfluorescein (FAM) at the 5' end and with 6-car-boxytetramethylrhodamine (TAMRA) at the 3' end for thefollowing genes: GAPDH (Genbank nb. BC029618),MMP9 (J05070), AKR1C3 (D17793), AQP3 (N74607),PLAT (M15518), HBP1 (AF019214), PTGS2 (U04636),ERBB3 (M34309) and PNRC1 (U03105) (see Table 3),were used together with TaqMan Universal PCR MasterMix (Applied Biosystems) in the TaqMan real time PCRreaction as described by the manufacturer. 25 µl reactionswere done in 96-well plates. Amplification and detectionwas carried out using the iCycler iQ Multicolor Real-TimePCR Detection System (Bio-Rad Laboratories, Hercules,CA, USA). All samples were run in triplicate.
For the second method, in-house designed gene-specificprimers for six human transcripts (Transferrin receptor(TFR): NM_003234 (5'-TCCCTAGGAGGCCGTTTCC-3'and 5'-GCCTACCCATTCGTGGTGAT-3), COX-2:NM_000963 (5'-GCATTGGAAACATCGACAGTGT-3'and5'-TGACGTCTTTTTACTTGAATTTCAACTTATAT-3);NDRG1: NM_006096 (5'-CCAGTGCGGCTGCCAG-3'and5'-TTCCTATGAGAAAATCCACGGTG-3); TP53:NM_000546 (5'-CCTTGAGGGTGCCTGTTCC-3'and 5'-CCCTCTACCTAACCAGCTGCC-3');CDH1: NM_004360('5'-TGAAGACCTTTAATGGCTTCCC-3'and 5'-CACACT-TACTCAGAACAAGTCACTGG-3'); HSPB1: NM_001540)(5'-AAAATCCGATGAGACTGCCG-3' and 5'-GCACAGCCAGTGGCGG-3') were designed using thePrimer Express software (Applied Biosystems, Foster City,CA, USA). Real time RT-PCR analysis was performed intriplicate using ds cDNA synthesized from mRNAobtained from the investigated cells. All PCRs were per-formed at 60°C annealing temperature and the TFR genewas used as internal standard. A PCR mastermixture wasprepared using the SYBRGreen PCR Core Reagents(Applied Biosystems, Foster City, USA) and aliquoted intomicroplate wells together with 1 µl template and 5 pmolof each primer for a final volume of 25 µl per reaction. TheiCycler (Bio-Rad) was used for PCR and detection of fluo-rescent signals. Standard curves (CT versus log concentra-tion) were generated for each primer pair using duplicatecDNA samples in a series of consecutive 5-fold dilutions.Efficiency calculations (E=(10^(-1/amplificationslope)-1) were performed to validate compatibility of investi-gated genes with the internal control. The compatibility ofall pair-wise compared amplification efficiencies wereconfirmed with a maximal deviation of 10% (data notshown). The specificity of all individual amplification
reactions was confirmed by meltcurve analysis (data notshown).
The relative mRNA expression levels of the target genes ineach sample were calculated using the comparative CTmethod. The CT value was defined as the number of PCRcycles required for the fluorescence signal to exceed thethreshold value. CT values were defined as the absolutevalue of the difference between the CT of the target RNAand the Ct of the housekeeping gene RNA for each sam-ple. The level of significance was set to a 2-fold relative dif-ference between samples, i.e. significant fold change 0.5 <2-∆∆C
T > 2 for down- and up-regulated genes respectively.
ResultsExperimental overviewThe aim of this work was to study the molecular effects ofthe antioxidant N-actetyl- cysteine (NAC) on proliferatingcells, by gene expression analysis using the AffymetrixGeneChip platform. Previous studies on cell culture sys-tems, demonstrated mainly by morphological and bio-chemical data, have indicated that NAC additionstimulates proliferating cells to go into differentiationphase [1]. Figure 1 displays a scanning electro micrographimage of the cell types tested and demonstrates the mor-phological shift from proliferating to differentiating cellsafter addition of NAC. We have performed a microarray-based gene expression analysis of the human colon carci-noma cell line (Caco-2) and normal human epidermalkeratinocytes (NHEK) over time (1, 12, and 24 hrs) afteraddition of NAC, compared to untreated, control samplesat the same time points. Data obtained from GeneChipanalysis were processed using the RMA analysis approachand samples were normalized to their corresponding con-trols. Filtering was done based on two criteria (p-value <0.1 and >1.5 fold up-or down-regulation) for each timepoint. The labelling and hybridisation was done in dupli-cate, except at 24 hrs NAC treatment of NHEK, where asingle measurement was made.
AnalysisGene lists of up- and down-regulated genes at each timepoint for NHEK and Caco-2 (1, 12, 24 hrs) were gener-
Table 1: Number of genes induced/repressed at each time point.
Time points Caco-2 NHEK
1 hr (repressed) 8 1612 hrs (repressed) 54 1024 hrs (repressed) 86 171
1 hrs (induced) 1 2612 hrs (induced) 69 2824 hrs (induced) 35 163
Page 4 of 19(page number not for citation purposes)

BMC Cancer 2005, 5:75 http://www.biomedcentral.com/1471-2407/5/75
Scanning electron micrographs showing the effect of NAC treatment on the morphology of NHEK (A) and Caco-2 (B) cellsFigure 1Scanning electron micrographs showing the effect of NAC treatment on the morphology of NHEK (A) and Caco-2 (B) cells. A1) NHEK untreated controls show a heterogeneous polygonal morphology, with a villous surface and rel-atively broad intercellular space; A2) After 72 h with 2 mM NAC cells grow flat in a thin monolayer with a regular polygonal morphology and a smooth surface with loss of the fine microvillous structure, also showing dramatically reduced intercellular space. B1) Proliferating Caco-2 cells display an irregular morphology with scarce microvillous structures and large intercellular space; B2) After 72 h with 2 mM NAC Caco-2 cells had the morphology of end-stage differentiated cells, with a regularly polyg-onal and about three times thicker than controls, with a relevant number of brush border microvilli at the cell surface (black arrows) as well as a dramatically reduced intercellular space (white arrows). Bars: 20 µm
Page 5 of 19(page number not for citation purposes)

BMC Cancer 2005, 5:75 http://www.biomedcentral.com/1471-2407/5/75
ated. In addition, time points within each cell type wereanalysed to identify similarities/differences among earlyand late time-point responses. Any results that producedzero genes were skipped. A summary of the top ten differ-entially expressed genes in Caco-2 and NHEK, at all timepoints, is depicted in additional files 1 and 2. The com-plete lists of differentially expressed genes are accessible asadditional datafiles 3 and 4 or at http://biobase.biotech.kth.se/NACmicroarray.
There were no general differences in the number of tran-scripts detected in treated as compared to untreated sam-ples in any of the cell lines. Following NAC induceddifferentiation in Caco-2 and NHEK, 253 and 414 targets,respectively, were significantly differentially expressedacross the time series, according to above statistical crite-ria (Table 1). Generally, for both cell types, the amount ofsignificantly up/down-regulated genes is limited to < 200genes after consideration of multiple appearances. InCaco-2, a tendency towards more down-regulated geneswas identified, while in NHEK, the numbers of genesinduced was approximately equal to those repressed(Table 1).
Both Caco-2 and NHEK exhibit a relatively limited earlyresponse at 1 hr, followed by an increasingly strongerresponse at 12 and 24 hrs. The initial response could becharacterized as transient, since most of the genesinduced/repressed initially either changed in the oppositedirection later on, or simply went back to normal expres-sion levels.
The induced/repressed genes in the two cell types are gen-erally quite different despite their morphological similar-ities after NAC treatment. This is for exampledemonstrated in that most of the genes induced/repressedin Caco-2 show no change in expression levels in NHEKand vice versa (see below). A direct comparison of the cor-responding differentially expressed genes is also provided.
Caco-2 analysisThe general trends for Caco-2 cells are depicted in Figure2 based on the collection of genes that passed the setcriteria.
The graph shows the behaviour of genes induced/repressed in Caco-2 across the time courses in both celltypes (signal represents the fold difference between eachtreatment and the average of corresponding controls). Asindicated above, there is a small transient change at 1 hr,and a more significant change, taking place at later timepoints. In particular, it is observed that the majority ofgenes repressed at 12 hrs continue their trend at 24 hrs(blue lines correspond to 12 hrs genes, dark green line cor-responds to 24 hrs genes only). Similarly, many genes up-
regulated at 12 hrs continue the trend at 24 hrs (red line12 hrs genes, orange line 24 hrs genes only). (Gene listsshowing multiple appearances in the same cell type, Caco-2, at more than one time point can be found in additionalfile 4 or at http://biobase.biotech.kth.se/NACmicroarray).The expression pattern of the corresponding genes in theother cell system NHEK shows weak or no correlation.
Table 1 represents the number of genes induced/repressedat each time point for Caco-2 cells and NHEK cells,including those with changes across multiple time points.Again, it is evident that early activity (1 hr) is limited andquite different from the activity at later time points andthat few genes induced/repressed early on (1 hr) continuetheir trend at later time points (Figure 2). This has alsobeen observed after 24 and 48 hrs using another microar-ray platform based on spotted cDNA arrays (data notshown).
NHEK analysisThe NHEK cells were analysed in a similar manner (seeadditional file 3 or http://biobase.biotech.kth.se/NACmicroarray). The t-test p-value for NHEK 24 hrs is notincluded, since there were no treatment replicates; anerror model was used instead. However, some of the val-ues in the error model do not correspond, in this case, toother t-test p-values and are therefore not included.
A similar trend to that described for Caco-2 takes place inthese cells, with early transient response at 1 hr, followedby a more extensive response at later time points (12, 24hrs) as demonstrated in Figure 3. Again, the genes activeat 1 hr do not appear to be active at later time points(except for a few genes in each case). On the other hand,genes active at 12 hrs also appear active in the same direc-tion at 24 hrs. Table 1 includes the exact numbers ofinduced/repressed genes.
NHEK vs. Caco-2 analysisComparisons of NAC treated Caco-2 and NHEK show thatthe responses are very different. Only a few genes were reg-ulated similarly in both cells (Table 2).
Even if we consider that statistical considerations (filter-ing etc.) inaccurately prevented a number of genes fromoverlapping in analysis of two cells, the clustering in Fig-ure 4 show that the responses are indeed very different.The hierarchical clustering is based on filtered genes (sig-nificant change in at least one time point) for all timepoints and each cell type. At the time point 1 h after treat-ment, there is no cell-specific clustering. Actually, bothcell types are in the same cluster for 1 hr. It is in the latertime points, with much stronger and distinct response,that the cell-specific clusters form (blue = NHEK, green =Caco-2).
Page 6 of 19(page number not for citation purposes)

BMC Cancer 2005, 5:75 http://www.biomedcentral.com/1471-2407/5/75
Matrix view of significantly affected genesFigure 2Matrix view of significantly affected genes. Genes induced/repressed in Caco-2 relative to control and their correspond-ing expression profiles in NHEK. The color is specific for genelist of affected genes at each time point (unless these are the same genes as from one of the earlier time points). Clearly, the early response at 1 hr is very limited (1,8 genes in Caco-2). There are also almost no genes induced/repressed at 1 hr that continue the trend at later time points – indicating an early tran-sient response. This is markedly different for 12 hr and 24 hr time points that show many common genes. It is also clear that many genes affected by NAC treatment in one cell line don't show the same response in the other cell line.
Page 7 of 19(page number not for citation purposes)

BMC Cancer 2005, 5:75 http://www.biomedcentral.com/1471-2407/5/75
Matrix view of significantly affected genesFigure 3Matrix view of significantly affected genes. Genes induced/repressed in NHEK relative to control. The color is specific for genelist of affected genes at each time point (unless these are the same genes as from one of the earlier time points). Also in these cells, quite a limited early response is observed at 1 hr (16 and 26 genes in NHEK). There are almost no genes induced/repressed at 1 hr that continue the trend at later time points -indicating an early transient response. This is markedly different for 12 hrs and 24 hrs treatments that show many common genes. It is also clear that many genes affected by NAC treatment in one cell line don't show the same response in the other cell line.
Page 8 of 19(page number not for citation purposes)

BMC Cancer 2005, 5:75 http://www.biomedcentral.com/1471-2407/5/75
A set of genes indicated to be differentially expressed werechosen to validate the analysis (Table 3). Additional timepoints were also used in this analysis. The genes repre-sented both markers of proliferation and motility as wellas new candidates in these and other related processes andin many of these cases the differential gene expressioncould be confirmed.
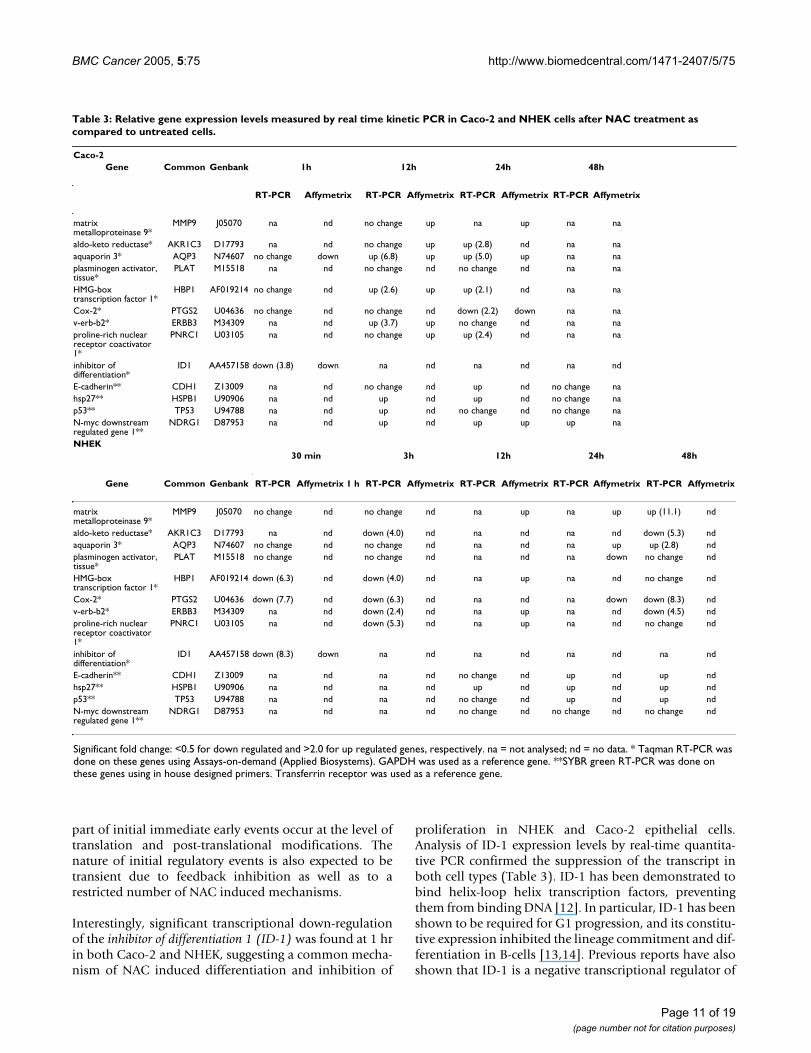
Gene ontology analysis of Caco-2 and NHEKIn order to perform Gene Ontology analysis of signifi-cantly regulated genes in Caco-2 and NHEK we createdcombined lists of genes up- and down-regulated at any ofthe three time points. In order to statistically assess theoverrepresentation of each category we used the publiclyavailable tool EASE. For each cell line, the down-regulatedgenes were assessed for gene ontology enrichment relativeto the up-regulated genes in the same cell line, within theuniverse of all genes being the Affymetrix U95aVer2 probeset. The final table of gene ontology groups was selectedbased on the number of overlapping genes, EASE score,illustrating common biological mechanisms or pathways(e.g. motility, cell division).
The results of analysis in both cell lines indicate a strongtendency towards differentiation by halting cell prolifera-tion and related processes, Table 4 (NHEK) and Table 5(Caco-2). However, the mechanisms inhibiting cell prolif-eration in NHEK and Caco-2 cell lines appear to differsignificantly. As seen from the two tables, genes responsi-ble for proliferation are shut down in both cell lines, withNHEK showing a stronger direct proliferation effect (moregenes are shut down). This effect, however, can beexplained by a considerably higher number ofsignificantly regulated genes identified in NHEK vs. Caco-2. Furthermore, the mechanism of inhibiting prolifera-tion in NHEK appears to be directly related to the shutdown of processes such as nuclear division, mitosis, cyto-kinesis etc. – all required for cells to divide and proliferate.In Caco-2, on the other hand, the mechanism appears toinvolve cell structure inhibition, through the shut downof genes involved in adhesion and cytoskeleton changes.
Finally, the motility processes critical to Caco-2 inhibitionof proliferation are affected in NHEK, while cell divisionseems to be affected to a lesser degree in Caco-2.
DiscussionDeregulation of proliferation is a characteristic of tumori-genesis and therapeutic approaches for cancer treatmenttargets apoptosis, cell cycle arrest and differentiation. NAChas been shown to induce a multitude of molecularchanges related to tumorigenesis [4]. Recently, NAC hasbeen demonstrated to inhibit apoptosis [5,6], possessanti-inflammatory activities [7] and inhibit proliferation[8].
Here, we have monitored the reflection in global geneexpression profiles of the transition from proliferation toa differentiated state in normal and cancer cells in vitro, asinduced by NAC. Two out of three previous studies of theglobal gene expression that accompanies the spontaneousdifferentiation of Caco-2 report a general down-regula-tion of gene expression in differentiated cells as comparedto the proliferating counterpart [9-11]. A similar, but notas pronounced, trend is reflected in the number of genesdifferentially expressed following NAC induced differenti-ation in Caco-2.
The expression level of 253 targets in Caco-2 and 414 inNHEK were statistically differentially expressed at differ-ent time points. Multiple appearances of differentially reg-ulated transcripts were common, resulting in detection oftotally less than 200 unique genes, respectively. This isfewer than expected in comparison to previous reports ondifferential regulation during spontaneous Caco-2differentiation and probably due to the difference in strin-gency of the algorithms used for data analyses (MAS 4.0 vsRMA), rather than related to functional biologicaldiscrepancies.
Initial responseIn both data sets, the early responses were relatively lim-ited and appeared to be transient, indicating that a large
Table 2: Genes common in both Caco-2 and NHEK at the different time points.
Time point Regulation Probe ID Gene
1 hr repressed 36618_g_at Inhibitor of DNA binding 1, dominant negative helix-loop-helix protein12 hrs repressed none24 hrs repressed 33720_at 1069_at Putatative 28 kDa protein, Human cyclooxygenase-2 (hCox-2) gene, complete cds1 hr induced none12 hrs induced 39809_at 36980_at 1585_at HMG-box transcription factor 1 proline-rich nuclear receptor coactivator 1 v-erb-b2
erythroblastic leukemia viral oncogene homolog 3 (avian)24hrs induced 39248_at Aquaporin 3
Page 9 of 19(page number not for citation purposes)

BMC Cancer 2005, 5:75 http://www.biomedcentral.com/1471-2407/5/75
Hierarchical clustering diagram at 1, 12 and 24 hrsFigure 4Hierarchical clustering diagram at 1, 12 and 24 hrs. A set of 2054 genes which show significant changes in expression in at least one of the time points in either of the two cell line clustered using the standard correlation. Cluster of the correspond-ing time points for each cell line indicates very close similarity of NHEK and Caco-2 at time point 1 hr, at which the NAC effect is not yet pronounced (both cell lines form a tight separate cluster at 1 hr). However, during the later time points the changes are much more significant and the differences between Caco-2 and NHEK become very pronounced as well (each cell line forms a separate cluster that includes both 12 and 24 hrs time points).
Page 10 of 19(page number not for citation purposes)
BMC Cancer 2005, 5:75 http://www.biomedcentral.com/1471-2407/5/75
part of initial immediate early events occur at the level oftranslation and post-translational modifications. Thenature of initial regulatory events is also expected to betransient due to feedback inhibition as well as to arestricted number of NAC induced mechanisms.
Interestingly, significant transcriptional down-regulationof the inhibitor of differentiation 1 (ID-1) was found at 1 hrin both Caco-2 and NHEK, suggesting a common mecha-nism of NAC induced differentiation and inhibition of
proliferation in NHEK and Caco-2 epithelial cells.Analysis of ID-1 expression levels by real-time quantita-tive PCR confirmed the suppression of the transcript inboth cell types (Table 3). ID-1 has been demonstrated tobind helix-loop helix transcription factors, preventingthem from binding DNA [12]. In particular, ID-1 has beenshown to be required for G1 progression, and its constitu-tive expression inhibited the lineage commitment and dif-ferentiation in B-cells [13,14]. Previous reports have alsoshown that ID-1 is a negative transcriptional regulator of
Table 3: Relative gene expression levels measured by real time kinetic PCR in Caco-2 and NHEK cells after NAC treatment as compared to untreated cells.
Caco-2Gene Common Genbank 1h 12h 24h 48h
RT-PCR Affymetrix RT-PCR Affymetrix RT-PCR Affymetrix RT-PCR Affymetrix
matrix metalloproteinase 9*
MMP9 J05070 na nd no change up na up na na
aldo-keto reductase* AKR1C3 D17793 na nd no change up up (2.8) nd na naaquaporin 3* AQP3 N74607 no change down up (6.8) up up (5.0) up na naplasminogen activator, tissue*
PLAT M15518 na nd no change nd no change nd na na
HMG-box transcription factor 1*
HBP1 AF019214 no change nd up (2.6) up up (2.1) nd na na
Cox-2* PTGS2 U04636 no change nd no change nd down (2.2) down na nav-erb-b2* ERBB3 M34309 na nd up (3.7) up no change nd na naproline-rich nuclear receptor coactivator 1*
PNRC1 U03105 na nd no change up up (2.4) nd na na
inhibitor of differentiation*
ID1 AA457158 down (3.8) down na nd na nd na nd
E-cadherin** CDH1 Z13009 na nd no change nd up nd no change nahsp27** HSPB1 U90906 na nd up nd up nd no change nap53** TP53 U94788 na nd up nd no change nd no change naN-myc downstream regulated gene 1**
NDRG1 D87953 na nd up nd up up up na
NHEK30 min 3h 12h 24h 48h
Gene Common Genbank RT-PCR Affymetrix 1 h RT-PCR Affymetrix RT-PCR Affymetrix RT-PCR Affymetrix RT-PCR Affymetrix
matrix metalloproteinase 9*
MMP9 J05070 no change nd no change nd na up na up up (11.1) nd
aldo-keto reductase* AKR1C3 D17793 na nd down (4.0) nd na nd na nd down (5.3) ndaquaporin 3* AQP3 N74607 no change nd no change nd na nd na up up (2.8) ndplasminogen activator, tissue*
PLAT M15518 no change nd no change nd na nd na down no change nd
HMG-box transcription factor 1*
HBP1 AF019214 down (6.3) nd down (4.0) nd na up na nd no change nd
Cox-2* PTGS2 U04636 down (7.7) nd down (6.3) nd na nd na down down (8.3) ndv-erb-b2* ERBB3 M34309 na nd down (2.4) nd na up na nd down (4.5) ndproline-rich nuclear receptor coactivator 1*
PNRC1 U03105 na nd down (5.3) nd na up na nd no change nd
inhibitor of differentiation*
ID1 AA457158 down (8.3) down na nd na nd na nd na nd
E-cadherin** CDH1 Z13009 na nd na nd no change nd up nd up ndhsp27** HSPB1 U90906 na nd na nd up nd up nd up ndp53** TP53 U94788 na nd na nd no change nd up nd up ndN-myc downstream regulated gene 1**
NDRG1 D87953 na nd na nd no change nd no change nd no change nd
Significant fold change: <0.5 for down regulated and >2.0 for up regulated genes, respectively. na = not analysed; nd = no data. * Taqman RT-PCR was done on these genes using Assays-on-demand (Applied Biosystems). GAPDH was used as a reference gene. **SYBR green RT-PCR was done on these genes using in house designed primers. Transferrin receptor was used as a reference gene.
Page 11 of 19(page number not for citation purposes)

BMC Cancer 2005, 5:75 http://www.biomedcentral.com/1471-2407/5/75
CDKN2A (p16/p14/p19), which induces G1 arrest throughthe inhibition of Rb phosphorylation by cdk -4 and -6[15]. Overexpression of ID-1 was also reported in psori-atic involved skin [16]. Inhibitors of histone deacetylaseactivity are emerging as a potentially important new classof anticancer agents. The cell cycle blockade anddifferentiation caused by such a drug, trichostatin A,caused decreased levels of ID-1 consistent with cell cyclesenescence and differentiation of A2780 ovarian cancercells [17]. Vitamin D is also known to promote differenti-ation and was shown by others to down-regulate ID-1through a suppressive vitamin D response sequence in the5'of the gene [18]. The ID-1 expression is regulated by a
protein complex containing the immediate-early responsegene EGR1 [19].
The growth regulatory properties of EGR1 have beenfound to involve coordinated regulation of TGF-β1 andfibronectin (FN1). The resulting proteins are secreted andlead to increased expression of plasminogen activatorinhibitor-1 (PAI1). Both the secreted FN1 and PAI1 func-tions to enhance cell attachment and normal cell growth[20]. We detect the induction of both fibronectin andPAI1 in NHEK cells at both 12 and 24 hrs, suggesting arole of EGR1 pathways in the NAC mediated mechanismat least in this cell type.
Table 4: Gene ontology for differentially expressed genes found in NHEK cells
Gene Category Down (genes) Up (genes) Combined list Affy probes
EASE score
mitotic cell cycle 41 4 49 1.96E-14cell cycle 52 12 76 2.03E-12M phase 22 1 24 7.73E-09DNA replication and chromosome cycle 22 1 24 7.73E-09cell proliferation 56 22 100 0.000000024nuclear division 20 1 22 7.23E-08M phase of mitotic cell cycle 19 1 21 0.000000217DNA replication 19 1 21 0.000000217S phase of mitotic cell cycle 19 1 21 0.000000217mitosis 19 1 21 0.000000217DNA metabolism 29 6 41 0.000000403DNA dependent DNA replication 13 0 13 0.00000641cytokinesis 12 0 12 0.0000199metabolism 100 79 256 0.000126regulation of cell cycle 26 11 48 0.00137cell growth and/or maintenance 79 62 202 0.00241nucleobase\, nucleoside\, nucleotide and nucleic acid metabolism 53 36 124 0.00262biosynthesis 15 5 24 0.00475protein metabolism 43 29 101 0.00992physiological process 132 130 389 0.0103obsolete biological process 17 7 31 0.0125macromolecule biosynthesis 11 4 18 0.0267protein modification 22 14 50 0.0639cytoplasm organization and biogenesis 12 6 23 0.0693cell organization and biogenesis 17 13 42 0.211phosphorus metabolism 16 12 40 0.244phosphate metabolism 16 12 40 0.244protein amino acid phosphorylation 12 9 30 0.326phosphorylation 12 10 32 0.424macromolecule catabolism 10 8 26 0.435protein catabolism 10 8 26 0.435proteolysis and peptidolysis 10 8 26 0.435cell adhesion 4 16 36 1cell motility 2 6 14 0.995
Bold: processes significantly affected in Caco-2 pointing to differentiationItalicized: processes significantly downregulated in NHEK, pointing to differentiationCutoff (EASE score < 5.00E-01)Cutoff (#overlapping genes > 9, larger thanin Caco-2 due to a large initial list size).
Page 12 of 19(page number not for citation purposes)
BMC Cancer 2005, 5:75 http://www.biomedcentral.com/1471-2407/5/75
Other interesting down-regulated genes at 1 h after NACtreatment in NHEK included for example regulated indevelopment and DNA damage response 1 (REDD1), squa-mous cell carcinoma antigen 1 (SCCA1), highly expressed incancer (HEC), s100a9 and kallikrein 7 (also termed stratumcorneum chymotryptic enzyme – SCCE). REDD1 has previ-ously been shown to be down-regulated in differentiatingprimary human keratinocytes and ectopic expressioninhibits in vitro differentiation [21]. The suppression ofSCCA1 has been demonstrated to inhibit tumour growth[22], HEC expression is increased in tumours [23] andS100A9 has been found to be up-regulated in psoriasispatients displaying keratinocyte hyperproliferation andaltered differentiation [24]. SCCE has been suggested toplay a role in desquamation and its up-regulation is asso-ciated with poor prognosis of ovarian and breast cancer[25,26]. A number of interesting up-regulated genes, such
as activin A and WEE1, were also identified in NHEK 1 hrafter NAC treatment. Over expression of WEE1 inhibitscell cycle progression by inactivation of the CDC2/cylin Bcomplex [27], while activin A is a member of the TGF-βfamily of cytokines which is known to promote growtharrest and differentiation in several tissues including intes-tinal epithelia [28,29]. In fact it was first identified as aprotein that exhibits a potent differentiation-inducingactivity [30]. In Caco-2, the proto-oncogene fos and thetranscription factor HNF3A, which have been observed tobe amplified in human malignancies [31], was two of theidentified genes being repressed at 1 hr after NAC treat-ment. A single gene, integrin alpha 2, was found up-regu-lated at this time-point.
It is clear that these data collectively describe molecularchanges associated with the mediation of a differentiated
Table 5: Gene ontology for differentially expressed genes found in Caco-2 cells
Gene Category Down (genes) Up (genes) Combined list Affy probes
EASE score
cell motility 8 1 10 0.0459cytoplasm organization and biogenesis 8 1 10 0.0459muscle development 7 1 9 0.0872morphogenesis 18 7 33 0.0879development 22 10 43 0.107cell adhesion 11 3 18 0.112cell surface receptor linked signal transduction 11 3 18 0.112organelle organization and biogenesis 6 1 8 0.158cytoskeleton organization and biogenesis 6 1 8 0.158cell organization and biogenesis 11 4 19 0.159organogenesis 16 7 31 0.179response to stress 8 3 14 0.282macromolecule biosynthesis 9 4 17 0.331cell-cell signaling 6 2 10 0.346signal transduction 19 5 30 0.0118immune response 9 1 11 0.0233protein metabolism 15 4 23 0.0235cellular process 58 34 126 0.0316defense response 10 2 14 0.0467transcription\, DNA-dependent 17 10 37 0.358transcription 17 10 37 0.358response to biotic stimulus 10 5 20 0.374nucleobase\, nucleoside\, nucleotide and nucleic acid metabolism 24 16 56 0.434regulation of transcription\, DNA-dependent 16 10 36 0.442regulation of transcription 16 10 36 0.442cell cycle 9 5 19 0.486nucleotide metabolism 3 2 7 0.835nuclear division 3 3 9 0.927mitosis 3 3 9 0.927mitotic cell cycle 5 3 11 0.691cytokinesis 2 2 6 0.952
Bold: processes significantly downregulated in NHEK pointing to differentiationItalicized: specific processes significantly downregulated in Caco-2, pointing to differentiationCutoff (EASE score) < 5.00E-01Cutoff (Number of overlapping genes > 5
Page 13 of 19(page number not for citation purposes)

BMC Cancer 2005, 5:75 http://www.biomedcentral.com/1471-2407/5/75
epithelial phenotype. A large part of the differentiallyexpressed genes have clear implications in withdrawal ofmitogenic signals and in promotion of growth arrest. Mul-tiple signalling pathways are suggested to be involved.
Late response (multiple occurrences)Progressively more genes were affected in both cell types,and many showed similar trends in direction, over latertime points. Cluster analysis revealed tightly linked genesbetween the 12 and 24 hrs time points in the same celltype and genes with such multiple appearances are poten-tially more strongly implicated in the differentiationprocess.
In NHEK cells, for example the down-regulated mitogensneuregulin 1 (heregulin) and melanoma growth stimulatoryactivity (MGSA) [32], belong to this group. MGSA belongsto a super family of chemochines, including IL-8, which isinvolved in inflammatory processes. Heregulin is knownto activate the oncogenic ERBB2 receptor [33]. Cdc-6,which are regulated in response to mitogenic signals,binds PCNA and is required for initiation of DNA replica-tion [34], was also repressed at both 12 and 24 hrs afterNAC treatment, implying programs involving withdrawalof mitogenic factors as important mechanisms for NACmediated inhibition of proliferation and increased differ-entiation in NHEK cells. The expression of Topoisomerase II(TOP2) was also repressed, confirming results obtained inNAC treated CHO cells [35]. Topoisomerases control andalter the topologic states of DNA, and the relaxation activ-ity of TOP2 is essential for productive RNA synthesis onnucleosomal DNA [36].
The list of correspondingly important up-regulated genesin NHEK was extensive and included activin A, trans-glutaminase 2 (TGM2), ErbB3 (HER3), matrix metalloprotei-nase 9 (MMP-9), fibronectin (FN!), PAI1 and TGFβ amongothers. Notably, activin A was the only gene found to beup-regulated at all investigated time points, demonstrat-ing a sustained growth inhibitory and differentiation pro-moting signal. TGM2 catalyses cross-linking of proteins,demonstrates G-protein function in receptor signalling[37] and was recently reported to phosphorylate IGFB3[38]. IGFB3 in turn has a major role in regulation of pro-liferation as a growth inhibitor through IGF2 binding andalternative IGF2 independent pathways [39]. Thus impli-cating potential regulatory functions of TGM2 in prolifer-ation and differentiation. Surprisingly, ErbB3, whichpromotes proliferation through the Wnt signalling path-way, was also up-regulated. RT-PCR could confirm theinduction (Caco-2, 12 hrs) and a study investigating spon-taneous Caco-2 differentiation is also in agreement withour data on up-regulation [11]. In contrast, a recent pub-lication reported its up-regulation in breast cancer [40],suggesting a dual role of ERBB3 in cell cycle regulation.
The induction of MMP9, confirmed by RT-PCR (48 hNHEK) is in additional contrast to our observations ofNAC-induced cell differentiation and proliferation.MMP9 has been associated with angiogenesis, tumourprogression and metastasis as mediated throughdegradation of the extracellular matrix (ECM) [41] andstimulation of hyperproliferation [42]. However, tumourswith low levels of MMP9 were found to be less differenti-ated. Thus, although MMP9 stimulates proliferation, it isalso implied in positive regulation of differentiation [42].NAC has been proposed to inhibit activation of latentMMP9 protein in ECM reservoirs by removal of itspropeptide and by competing for the zink ion which isnecessary for enzymatic function [43]. Hence, our datamay imply that post-transcriptional regulation of MMP9prevails over the transcriptional changes as the major con-trol mechanism.
A large number of multiple occurring differentiallyexpressed transcripts were demonstrated in Caco-2,including intestinal trefoilfactor 3 (TFF3) and Aquaporin 3(AQP3) among others. TFF3 has been shown to have acentral role in the maintenance and repair of intestinalmucosa [44] and upregulation is expected during differen-tiation. Aquaporins (AQPs) are water channel proteins,important for the transport of water and other small pro-teins across the cell membrane [45]. AQP1 has previouslybeen shown to be involved in cell cycle control [46], sug-gesting that AQP3 may also have a role in the progressionof cancer. AQP3 has been reported to be highly expressedin several types of stratified epithelial cells in rat, includ-ing the epidermis [47] and the differentiated cells of thegastrointestinal tract [48]. The expression of AQP3 wasreported to be up-regulated in differentiating Caco-2 cells[11], while expression was shown to be down-regulated indifferentiating primary keratinocytes [49]. In this studyAQP appears to have a transient behaviour in Caco-2 cellswith a repressed behaviour at initial time point andinduced pattern at later time points (confirmed by RT-PCR), indicating a remodelling of cell membraneconstituents.
The genes repressed in Caco-2 included for example CyclinD1, Inhibin beta B, BMP-2 and FHL-2. The D1 cyclin isinvolved in β-catenin-TCF signalling and its down-regula-tion induce G1 arrest [50]. FHL-2 has been demonstratedto be a coactivator of β-catenin from cyclin D and IL-8promoters in a colon cell line [51], suggesting that repres-sion of FHL-2 may also repress growth. Inhibin beta andBMP-2 are members of the TGF family of genes. Inhibinbeta is an antagonist of activin A activity and consequentlyrepresses differentiation and promotes growth [52]. BMP-2 on the other hand, has been demonstrated both toinduce apoptosis [53] and growth inhibition/differentia-tion [54]. In contrast, another recent study demonstrated
Page 14 of 19(page number not for citation purposes)

BMC Cancer 2005, 5:75 http://www.biomedcentral.com/1471-2407/5/75
the ability of BMP-2 to enhance the growth of tumours[55].
Late response (single occurrence)A vast number of additional interesting genes with poten-tially important roles in mediation and manifestation ofthe differentiated epithelial phenotype was identified assignificantly induced or repressed in a single time point.
As an example, up-regulation in NHEK after 24 hrs wasseen for transcripts encoding CDKN2B (p15), which isbelieved to be an effector of TGF-β induced G1 arrest andinhibition of proliferation [56], and for CDKN1C, whichis a p21 homologue and negative regulator of cell prolifer-ation [57]. Other up-regulated genes at this time pointwere the transcription factor Jun and BTG1. Jun wasrecently demonstrated to be a regulator of erythroid differ-entiation [58] and Jun B knock out mice have been shownto develop a proliferative disease resembeling humanchronic myeloid leukemia [59]. BTG1 has been proposedto belong to a family of antiproliferative genes [60]. Up-regulation was also found for cadherin 13, a gene withgrowth inhibitory functions that is expressed in normalcells but not in the majority of human tumour cells of epi-thelial origin [61]. While not identified by global tran-script analysis, RT-PCR investigation revealed increasedlevels of E-cadherin in both Caco-2 (24 hrs) and NHEK (24and 48 hrs), this in agreement with the previouslyreported immunohistochemical data [1] that showedincreased staining of E-cadherin in NAC treated cells. InCaco-2 cells, the differentiation-related gene NDRG1,which is expressed during differentiation and down-regu-lated in colorectal neoplasms [62], was up-regulated at 12hrs. This increase was also demonstrated by RT-PCR at 12,24 and 48 hrs after NAC treatment. The induction of Cdx2may also be a functional change, since reduced expressionof Cdx2 has been shown to be important in colon tumor-igenesis [63]. Interestingly, in correlation with the contro-versial results from NHEK, an up-regulation of ErbB3 wasidentified in Caco-2 at 12 hrs. In addition, the oncogenemyc was also up-regulated in contrast to the expecteddecrease. The down-regulation of Cox-2 and BMP-2 wasalso in concordance with NHEK data. In addition, theTGF-β family member BMP-4 was repressed. This corre-lates well with our results on repressed ID-1 expression,since both BMP-2 and -4 up-regulate ID-1 [64,65].
Hence, although induced by the same mechanism (NAC)and yielding the same end-stage of growth inhibition anddifferentiation, the processes in NHEK and Caco-2 are onthe whole quite different. This is demonstrated by genespecific differences that result in lack of correlationbetween cell types at the same time point after treatmentas identified by cluster analysis. This is furthermore sup-ported by the Gene Ontology analysis, tables 4 and 5,
indicating that the two cell lines achieve their differenti-ated states using two distinct mechanisms, this in con-cordance with previously observed effects of NACtreatment on cell morphology and growth arrest [1]. Itshould be noted that apoptosis does not appear to act asa regulating mechanism, since only a very small propor-tion of apoptotic genes are affected in either direction (2to 12 genes out of 317, in either direction). This is alsosupported by the previous study [1], which analysedapoptosis by propidium iodide labelling and flowcytometry.
As additional testimony to the lineage specific differentia-tion programs, only very few genes were identified asbeing similarly regulated in both cell-types. Theseincluded ID-1, AQP3 and ErbB3 (as described above). Cox-2 was also similarly down-regulated in both cell typesafter NAC treatment. When investigating Cox-2 expressionby RT-PCR we could confirm the down-regulation at 24hrs in Caco-2 and identify an additional repression inNHEK at 1, 3 and 48 hrs after NAC treatment.Overexpression of Cox-2 has been shown to promote cellmigration and invasion in Caco-2 cells [66] and to regu-late colon carcinoma induced angiogenesis by productionof angiogenic factors [67]. In addition, epidermal differ-entiation is also affected by Cox-2 over expression. Cox-2seems to prevent entrance into the postmitotic state,which is coupled to the switching on expression of differ-entiation-associated proteins, allowing keratinocytes toproliferate [68]. In correlation with our data, a NAC medi-ated inhibition of Cox-2 expression have previously beendemonstrated in colorectal cancer [69]. Hence, it is likelythat Cox-2 repression is a NAC specific event endorsingdifferentiation/growth arrest in both NHEK and Caco-2.HBP1 was also up-regulated in both Caco-2 and NHEKafter 12 h of NAC treatment and RT-PCR could confirm anincrease in Caco-2 at 12 and 24 hrs. This corresponds toprevious findings, where HBP1 has been seen to have anegative effect on tumours. It has previously been estab-lished that HBP1 is a target of the retinoblastoma path-ways [70,71] and that HBP1 negatively regulates Wnt/β-catenin, thus inhibiting proliferation and suggesting thatHBP1 may have a tumour suppressor function [72]. Twoadditional proteins, putative 28 kDa protein and proline richnuclear receptor coactivator-1 (PNRC1), were also identifiedas differentially expressed in both cell types. RT-PCR anal-ysis was able to confirm an up-regulation of PNRC1 inCaco-2 24 hrs after treatment. However, these genes arenot previously described and potential functions remainunresolved.
A proportion of the differentially expressed transcriptswere not possible to predict as being part of the differen-tiation context. For example, ErbB3, fos, TGFβI and mycwere found to be expressed at higher levels in differenti-
Page 15 of 19(page number not for citation purposes)

BMC Cancer 2005, 5:75 http://www.biomedcentral.com/1471-2407/5/75
ated cells, in contrast to their roles in promotion of prolif-eration. Interestingly, a similar contrasting increase in fosand ErbB3 levels was found in normal colonic cells ascompared to colorectal cancers in a SAGE study [73]. It isimportant to note that spontaneous morphological andfunctional differentiation in Caco-2 have been demon-strated not to be coupled, with independent mosaic pat-terns of proliferating and differentiated cells presentadjacent in the cell culture [74], which may in part explainsome of the contrasting results. However, many of thedetected differentially expressed genes in this study havepreviously been described as altered in differentiated epi-thelial cells. In NHEK cells we could for example confirmthe expected increased expression of SPRR1B andSPRR2A. In Caco-2 the up-regulation of AQP3, NDRG1and TFF3 were among the genes that validated the resultsfrom the global transcription profile analysis.
Interestingly, several genes with major relevance in psoria-sis have been found differentially expressed as a conse-quence of NAC treatment in the particular epithelial cellsincluded in this study, for example S100A9, ID-1 and Cox-2. These findings could give a mechanistic background tothe ongoing clinical studies being carried out based onempirical NAC treatment of patients having psoriasis.
Alternative NAC signalling mechanisms at the level ofproteins and metabolites may also be important. Forinstance the phospholipid modulator, platelet activatingfactor, has been demonstrated to induce differentiationand inhibit proliferation in colon cells [75], and inhibitproliferation in cultured human keratinocytes [76].Accordingly, we are performing supplementary proteomeand metabolome studies. In addition, analyses of addi-tional cell lines for finding a common pathway of molec-ular changes that result from NAC induced differentiationare being considered.
ConclusionOur data demonstrate that NAC stimulated differentia-tion induces a limited and transient early transcriptionalchange, followed by a more constitutive and extensivelydifferent expression at later time points in both NHEKand Caco-2 cells. The genes affected are to a large extentrelated to inhibition of proliferation and stimulation ofdifferentiation, but the responses are almost completelylineage specific. This and further analysis of NAC medi-ated expression changes provide a description of the com-plex molecular mechanisms of sulphydryl reductanttreatment and potential targets for the development ofnew drugs for treatment of proliferation related epithelialdisorders.
List of abbreviationsInhibitor of differentiation 1 (ID-1)
N-acetyl-L-cysteine (NAC)
Normal human epidermal keratinocytes (NHEK)
Glyceraldehyde-3-phosphate dehydrogenase (GAPDH)
Transferrin receptor (TFR)
Fibronectin (FN1)
Plasminogen activator inhibitor-1 (PAI1)
Regulated in development and DNA damage response 1(REDD1),
Squamous cell carcinoma antigen 1 (SCCA1)
Highly expressed in cancer (HEC)
Stratum corneum chymotryptic enzyme (SCCE)
Melanoma growth stimulatory activity (MGSA)
Topoisomerase II (TOP2)
Transglutaminase 2 (TGM2)
Matrix metalloproteinase 9 (MMP-9)
Intestinal trefoilfactor 3 (TFF3)
Aquaporin 3 (AQP3)
Proline rich nuclear receptor coactivator-1 (PNRC1)
Competing interestsThe author(s) declare that they have no competinginterests.
Authors' contributionsACG participated in the design of the study, drafted themanuscript, coordinated and carried out real-time kineticPCR and Affymetrix experiments as well as performed ini-tial data processing and data analysis. IK performed dataprocessing, statistical analysis and data analysis as well asassisted with the manuscript. EER performed real-timekinetic PCRs and assisted in drafting the manuscript. LBL,GG and EKK cultured cells and isolated totRNA. JL, TP, TLand MCR directed the teams that carried out this study.
Page 16 of 19(page number not for citation purposes)

BMC Cancer 2005, 5:75 http://www.biomedcentral.com/1471-2407/5/75
Additional material
AcknowledgementsWe kindly acknowledge The Knut and Alice Wallenberg Foundation, the Swedish Research Council, the Wallenberg Consortium North (WCN) for financial support, and the Nactilus AB, Malmö, Sweden (to LB-L, GG, EKK, TP).
References1. Parasassi T, Brunelli R, Bracci-Laudiero L, Greco G, Gustafsson AC,
Krasnowska EK, Lundeberg J, Lundeberg T, Pittaluga E, Romano MC,Serafino A: Differentiation of normal and cancer cells inducedby sulfhydryl reduction: biochemical and molecularmechanisms. Cell Death Differ 2005.
2. Delie F, Rubas W: A human colonic cell line sharing similaritieswith enterocytes as a model to examine oral absorption:advantages and limitations of the Caco-2 model. Crit Rev TherDrug Carrier Syst 1997, 14:221-286.
3. Hosack DA, Dennis G Jr, Sherman BT, Lane HC, Lempicki RA: Iden-tifying biological themes within lists of genes with EASE.Genome Biol 2003, 4:R70.
4. De Flora S, Izzotti A, D'Agostini F, Balansky RM: Mechanisms of N-acetylcysteine in the prevention of DNA damage and cancer,with special reference to smoking-related end-points. Car-cinogenesis 2001, 22:999-1013.
5. Rosati E, Sabatini R, Ayroldi E, Tabilio A, Bartoli A, Bruscoli S,Simoncelli C, Rossi R, Marconi P: Apoptosis of human primary Blymphocytes is inhibited by N-acetyl-L-cysteine. J Leukoc Biol2004, 76:152-161.
6. Hart AM, Terenghi G, Kellerth JO, Wiberg M: Sensory neuropro-tection, mitochondrial preservation, and therapeutic poten-tial of n-acetyl-cysteine after nerve injury. Neuroscience 2004,125:91-101.
7. Rhoden CR, Lawrence J, Godleski JJ, Gonzalez-Flecha B: N-acetyl-cysteine prevents lung inflammation after short-term inhala-tion exposure to concentrated ambient particles. Toxicol Sci2004, 79:296-303.
8. Estensen RD, Levy M, Klopp SJ, Galbraith AR, Mandel JS, BlomquistJA, Wattenberg LW: N-acetylcysteine suppression of the prolif-erative index in the colon of patients with previous adenom-atous colonic polyps. Cancer Lett 1999, 147:109-114.
9. Tadjali M, Seidelin JB, Olsen J, Troelsen JT: Transcriptomechanges during intestinal cell differentiation. Biochim BiophysActa 2002, 1589:160-167.
10. Mariadason JM, Arango D, Corner GA, Aranes MJ, Hotchkiss KA,Yang W, Augenlicht LH: A gene expression profile that definescolon cell maturation in vitro. Cancer Res 2002, 62:4791-4804.
11. Fleet JC, Wang L, Vitek O, Craig BA, Edenberg HJ: Gene expressionprofiling of Caco-2 BBe cells suggests a role for specific sign-aling pathways during intestinal differentiation. PhysiolGenomics 2003, 13:57-68.
12. Sun XH, Copeland NG, Jenkins NA, Baltimore D: Id proteins Id1and Id2 selectively inhibit DNA binding by one class of helix-loop-helix proteins. Mol Cell Biol 1991, 11:5603-5611.
13. Hara E, Yamaguchi T, Nojima H, Ide T, Campisi J, Okayama H, OdaK: Id-related genes encoding helix-loop-helix proteins arerequired for G1 progression and are repressed in senescenthuman fibroblasts. J Biol Chem 1994, 269:2139-2145.
14. Sun XH: Constitutive expression of the Id1 gene impairsmouse B cell development. Cell 1994, 79:893-900.
15. Ohtani N, Zebedee Z, Huot TJ, Stinson JA, Sugimoto M, Ohashi Y,Sharrocks AD, Peters G, Hara E: Opposing effects of Ets and Idproteins on p16INK4a expression during cellular senescence.Nature 2001, 409:1067-1070.
16. Bjorntorp E, Parsa R, Thornemo M, Wennberg AM, Lindahl A: Thehelix-loop-helix transcription factor Id1 is highly expressedin psoriatic involved skin. Acta Derm Venereol 2003, 83:403-409.
17. Strait KA, Dabbas B, Hammond EH, Warnick CT, Iistrup SJ, Ford CD:Cell cycle blockade and differentiation of ovarian cancer cellsby the histone deacetylase inhibitor trichostatin A are asso-ciated with changes in p21, Rb, and Id proteins. Mol CancerTher 2002, 1:1181-1190.
18. Ezura Y, Tournay O, Nifuji A, Noda M: Identification of a novelsuppressive vitamin D response sequence in the 5'-flankingregion of the murine Id1 gene. J Biol Chem 1997,272:29865-29872.
19. Tournay O, Benezra R: Transcription of the dominant-negativehelix-loop-helix protein Id1 is regulated by a protein com-plex containing the immediate-early response gene Egr-1.Mol Cell Biol 1996, 16:2418-2430.
20. Liu C, Yao J, de Belle I, Huang RP, Adamson E, Mercola D: The tran-scription factor EGR-1 suppresses transformation of humanfibrosarcoma HT1080 cells by coordinated induction oftransforming growth factor-beta1, fibronectin, and plas-minogen activator inhibitor-1. J Biol Chem 1999, 274:4400-4411.
21. Ellisen LW, Ramsayer KD, Johannessen CM, Yang A, Beppu H, MindaK, Oliner JD, McKeon F, Haber DA: REDD1, a developmentallyregulated transcriptional target of p63 and p53, links p63 toregulation of reactive oxygen species. Mol Cell 2002,10:995-1005.
22. Suminami Y, Nagashima S, Murakami A, Nawata S, Gondo T,Hirakawa H, Numa F, Silverman GA, Kato H: Suppression of asquamous cell carcinoma (SCC)-related serpin, SCC anti-gen, inhibits tumor growth with increased intratumor infil-tration of natural killer cells. Cancer Res 2001, 61:1776-1780.
23. Chen Y, Riley DJ, Chen PL, Lee WH: HEC, a novel nuclear pro-tein rich in leucine heptad repeats specifically involved inmitosis. Mol Cell Biol 1997, 17:6049-6056.
24. Semprini S, Capon F, Tacconelli A, Giardina E, Orecchia A, MingarelliR, Gobello T, Zambruno G, Botta A, Fabrizi G, Novelli G: Evidencefor differential S100 gene over-expression in psoriaticpatients from genetically heterogeneous pedigrees. HumGenet 2002, 111:310-313.
25. Yousef GM, Diamandis EP: Tissue kallikreins: new players in nor-mal and abnormal cell growth? Thromb Haemost 2003, 90:7-16.
26. Talieri M, Diamandis EP, Gourgiotis D, Mathioudaki K, Scorilas A:Expression analysis of the human kallikrein 7 (KLK7) inbreast tumors: a new potential biomarker for prognosis ofbreast carcinoma. Thromb Haemost 2004, 91:180-186.
27. McGowan CH, Russell P: Human Wee1 kinase inhibits cell divi-sion by phosphorylating p34cdc2 exclusively on Tyr15. EmboJ 1993, 12:75-85.
Additional File 1Summary of the top 10 differentially expressed genes in Caco-2, at all time points studied.Click here for file[http://www.biomedcentral.com/content/supplementary/1471-2407-5-75-S1.doc]
Additional File 2Summary of the top 10 differentially expressed genes in NHEK, at all time points studied.Click here for file[http://www.biomedcentral.com/content/supplementary/1471-2407-5-75-S2.doc]
Additional File 3All differentially expressed transcripts in NHEK at all time points.Click here for file[http://www.biomedcentral.com/content/supplementary/1471-2407-5-75-S3.xls]
Additional File 4All differentially expressed transcripts in Caco-2 at all time points.Click here for file[http://www.biomedcentral.com/content/supplementary/1471-2407-5-75-S4.xls]
Page 17 of 19(page number not for citation purposes)
http://www.ncbi.nlm.nih.gov/entrez/query.fcgi?cmd=Retrieve&db=PubMed&dopt=Abstract&list_uids=9282267
http://www.ncbi.nlm.nih.gov/entrez/query.fcgi?cmd=Retrieve&db=PubMed&dopt=Abstract&list_uids=9282267
http://www.ncbi.nlm.nih.gov/entrez/query.fcgi?cmd=Retrieve&db=PubMed&dopt=Abstract&list_uids=9282267
http://www.ncbi.nlm.nih.gov/entrez/query.fcgi?cmd=Retrieve&db=PubMed&dopt=Abstract&list_uids=1922066
http://www.ncbi.nlm.nih.gov/entrez/query.fcgi?cmd=Retrieve&db=PubMed&dopt=Abstract&list_uids=1922066
http://www.ncbi.nlm.nih.gov/entrez/query.fcgi?cmd=Retrieve&db=PubMed&dopt=Abstract&list_uids=1922066
http://www.ncbi.nlm.nih.gov/entrez/query.fcgi?cmd=Retrieve&db=PubMed&dopt=Abstract&list_uids=8294468
http://www.ncbi.nlm.nih.gov/entrez/query.fcgi?cmd=Retrieve&db=PubMed&dopt=Abstract&list_uids=8294468
http://www.ncbi.nlm.nih.gov/entrez/query.fcgi?cmd=Retrieve&db=PubMed&dopt=Abstract&list_uids=8294468
http://www.ncbi.nlm.nih.gov/entrez/query.fcgi?cmd=Retrieve&db=PubMed&dopt=Abstract&list_uids=8001126
http://www.ncbi.nlm.nih.gov/entrez/query.fcgi?cmd=Retrieve&db=PubMed&dopt=Abstract&list_uids=8001126
http://www.ncbi.nlm.nih.gov/entrez/query.fcgi?cmd=Retrieve&db=PubMed&dopt=Abstract&list_uids=9368060
http://www.ncbi.nlm.nih.gov/entrez/query.fcgi?cmd=Retrieve&db=PubMed&dopt=Abstract&list_uids=9368060
http://www.ncbi.nlm.nih.gov/entrez/query.fcgi?cmd=Retrieve&db=PubMed&dopt=Abstract&list_uids=9368060
http://www.ncbi.nlm.nih.gov/entrez/query.fcgi?cmd=Retrieve&db=PubMed&dopt=Abstract&list_uids=8628310
http://www.ncbi.nlm.nih.gov/entrez/query.fcgi?cmd=Retrieve&db=PubMed&dopt=Abstract&list_uids=8628310
http://www.ncbi.nlm.nih.gov/entrez/query.fcgi?cmd=Retrieve&db=PubMed&dopt=Abstract&list_uids=9933644
http://www.ncbi.nlm.nih.gov/entrez/query.fcgi?cmd=Retrieve&db=PubMed&dopt=Abstract&list_uids=9933644
http://www.ncbi.nlm.nih.gov/entrez/query.fcgi?cmd=Retrieve&db=PubMed&dopt=Abstract&list_uids=9933644
http://www.ncbi.nlm.nih.gov/entrez/query.fcgi?cmd=Retrieve&db=PubMed&dopt=Abstract&list_uids=9315664
http://www.ncbi.nlm.nih.gov/entrez/query.fcgi?cmd=Retrieve&db=PubMed&dopt=Abstract&list_uids=9315664
http://www.ncbi.nlm.nih.gov/entrez/query.fcgi?cmd=Retrieve&db=PubMed&dopt=Abstract&list_uids=9315664
http://www.ncbi.nlm.nih.gov/entrez/query.fcgi?cmd=Retrieve&db=PubMed&dopt=Abstract&list_uids=8428596

BMC Cancer 2005, 5:75 http://www.biomedcentral.com/1471-2407/5/75
28. Sonoyama K, Rutatip S, Kasai T: Gene expression of activin,activin receptors, and follistatin in intestinal epithelial cells.Am J Physiol Gastrointest Liver Physiol 2000, 278:G89-97.
29. Chen YG, Lui HM, Lin SL, Lee JM, Ying SY: Regulation of cell pro-liferation, apoptosis, and carcinogenesis by activin. Exp BiolMed (Maywood) 2002, 227:75-87.
30. Murata M, Eto Y, Shibai H, Sakai M, Muramatsu M: Erythroid differ-entiation factor is encoded by the same mRNA as that of theinhibin beta A chain. Proc Natl Acad Sci U S A 1988, 85:2434-2438.
31. Lin L, Miller CT, Contreras JI, Prescott MS, Dagenais SL, Wu R, YeeJ, Orringer MB, Misek DE, Hanash SM, et al.: The hepatocytenuclear factor 3 alpha gene, HNF3alpha (FOXA1), on chro-mosome band 14q13 is amplified and overexpressed inesophageal and lung adenocarcinomas. Cancer Res 2002,62:5273-5279.
32. Horuk R, Yansura DG, Reilly D, Spencer S, Bourell J, Henzel W, RiceG, Unemori E: Purification, receptor binding analysis, and bio-logical characterization of human melanoma growth stimu-lating activity (MGSA). Evidence for a novel MGSA receptor.J Biol Chem 1993, 268:541-546.
33. Holmes WE, Sliwkowski MX, Akita RW, Henzel WJ, Lee J, Park JW,Yansura D, Abadi N, Raab H, Lewis GD, et al.: Identification ofheregulin, a specific activator of p185erbB2. Science 1992,256:1205-1210.
34. Yan Z, DeGregori J, Shohet R, Leone G, Stillman B, Nevins JR, Wil-liams RS: Cdc6 is regulated by E2F and is essential for DNAreplication in mammalian cells. Proc Natl Acad Sci U S A 1998,95:3603-3608.
35. Grdina DJ, Murley JS, Roberts JC: Effects of thiols on topoisomer-ase-II alpha activity and cell cycle progression. Cell Prolif 1998,31:217-229.
36. Mondal N, Parvin JD: DNA topoisomerase IIalpha is requiredfor RNA polymerase II transcription on chromatintemplates. Nature 2001, 413:435-438.
37. Fesus L, Piacentini M: Transglutaminase 2: an enigmaticenzyme with diverse functions. Trends Biochem Sci 2002,27:534-539.
38. Mishra S, Murphy LJ: Tissue transglutaminase has intrinsickinase activity: Identification of transglutaminase 2 as aninsulin-like growth factor binding protein-3 kinase. J Biol Chem2004, 279(23):23863-8.
39. Ricort JM, Binoux M: Insulin-like growth factor-binding protein-3 activates a phosphotyrosine phosphatase. Effects on theinsulin-like growth factor signaling pathway. J Biol Chem 2002,277:19448-19454.
40. Perez-Nadales E, Lloyd AC: Essential function for ErbB3 inbreast cancer proliferation. Breast Cancer Res 2004, 6:137-139.
41. Ray JM, Stetler-Stevenson WG: The role of matrix metallopro-teases and their inhibitors in tumour invasion, metastasisand angiogenesis. Eur Respir J 1994, 7:2062-2072.
42. Coussens LM, Werb Z: Matrix metalloproteinases and thedevelopment of cancer. Chem Biol 1996, 3:895-904.
43. Cai T, Fassina G, Morini M, Aluigi MG, Masiello L, Fontanini G, D'Ago-stini F, De Flora S, Noonan DM, Albini A: N-acetylcysteine inhibitsendothelial cell invasion and angiogenesis. Lab Invest 1999,79:1151-1159.
44. Mashimo H, Wu DC, Podolsky DK, Fishman MC: Impaired defenseof intestinal mucosa in mice lacking intestinal trefoil factor.Science 1996, 274:262-265.
45. Agre P, Brown D, Nielsen S: Aquaporin water channels: unan-swered questions and unresolved controversies. Curr Opin CellBiol 1995, 7:472-483.
46. Delporte C, Chen ZJ, Baum BJ: Aquaporin 1 expression duringthe cell cycle in A5 cells. Biochem Biophys Res Commun 1996,228:223-228.
47. Matsuzaki T, Suzuki T, Koyama H, Tanaka S, Takata K: Water chan-nel protein AQP3 is present in epithelia exposed to the envi-ronment of possible water loss. J Histochem Cytochem 1999,47:1275-1286.
48. Koyama Y, Yamamoto T, Tani T, Nihei K, Kondo D, Funaki H, YaoitaE, Kawasaki K, Sato N, Hatakeyama K, Kihara I: Expression andlocalization of aquaporins in rat gastrointestinal tract. Am JPhysiol 1999, 276:C621-627.
49. Zheng X, Bollinger Bollag W: Aquaporin 3 colocates with phos-pholipase d2 in caveolin-rich membrane microdomains and
is downregulated upon keratinocyte differentiation. J InvestDermatol 2003, 121:1487-1495.
50. Heinen CD, Goss KH, Cornelius JR, Babcock GF, Knudsen ES, Kow-alik T, Groden J: The APC tumor suppressor controls entryinto S-phase through its ability to regulate the cyclin D/RBpathway. Gastroenterology 2002, 123:751-763.
51. Wei Y, Renard CA, Labalette C, Wu Y, Levy L, Neuveut C, Prieur X,Flajolet M, Prigent S, Buendia MA: Identification of the LIM pro-tein FHL2 as a coactivator of beta-catenin. J Biol Chem 2003,278:5188-5194.
52. Bernard DJ, Chapman SC, Woodruff TK: Mechanisms of inhibinsignal transduction. Recent Prog Horm Res 2001, 56:417-450.
53. Hallahan AR, Pritchard JI, Chandraratna RA, Ellenbogen RG, Geyer JR,Overland RP, Strand AD, Tapscott SJ, Olson JM: BMP-2 mediatesretinoid-induced apoptosis in medulloblastoma cells througha paracrine effect. Nat Med 2003, 9:1033-1038.
54. Wen XZ, Miyake S, Akiyama Y, Yuasa Y: BMP-2 modulates theproliferation and differentiation of normal and cancerousgastric cells. Biochem Biophys Res Commun 2004, 316:100-106.
55. Langenfeld EM, Calvano SE, Abou-Nukta F, Lowry SF, Amenta P, Lan-genfeld J: The mature bone morphogenetic protein-2 is aber-rantly expressed in non-small cell lung carcinomas andstimulates tumor growth of A549 cells. Carcinogenesis 2003,24:1445-1454.
56. Hannon GJ, Beach D: p15INK4B is a potential effector of TGF-beta-induced cell cycle arrest. Nature 1994, 371:257-261.
57. Lee MH, Reynisdottir I, Massague J: Cloning of p57KIP2, a cyclin-dependent kinase inhibitor with unique domain structureand tissue distribution. Genes Dev 1995, 9:639-649.
58. Jacobs-Helber SM, Abutin RM, Tian C, Bondurant M, Wickrema A,Sawyer ST: Role of JunB in erythroid differentiation. J Biol Chem2002, 277:4859-4866.
59. Passegue E, Jochum W, Schorpp-Kistner M, Mohle-Steinlein U, Wag-ner EF: Chronic myeloid leukemia with increased granulocyteprogenitors in mice lacking junB expression in the myeloidlineage. Cell 2001, 104:21-32.
60. Rouault JP, Rimokh R, Tessa C, Paranhos G, Ffrench M, Duret L,Garoccio M, Germain D, Samarut J, Magaud JP: BTG1, a memberof a new family of antiproliferative genes. Embo J 1992,11:1663-1670.
61. Lee SW: H-cadherin, a novel cadherin with growth inhibitoryfunctions and diminished expression in human breastcancer. Nat Med 1996, 2:776-782.
62. van Belzen N, Dinjens WN, Diesveld MP, Groen NA, van der MadeAC, Nozawa Y, Vlietstra R, Trapman J, Bosman FT: A novel genewhich is up-regulated during colon epithelial cell differentia-tion and down-regulated in colorectal neoplasms. Lab Invest1997, 77:85-92.
63. Aoki K, Tamai Y, Horiike S, Oshima M, Taketo MM: Colonic poly-posis caused by mTOR-mediated chromosomal instability inApc+/Delta716 Cdx2+/- compound mutant mice. Nat Genet2003, 35:323-330.
64. Shepherd TG, Nachtigal MW: Identification of a putative auto-crine bone morphogenetic protein-signaling pathway inhuman ovarian surface epithelium and ovarian cancer cells.Endocrinology 2003, 144:3306-3314.
65. Langenfeld EM, Langenfeld J: Bone morphogenetic protein-2stimulates angiogenesis in developing tumors. Mol Cancer Res2004, 2:141-149.
66. Tsujii M, Kawano S, DuBois RN: Cyclooxygenase-2 expression inhuman colon cancer cells increases metastatic potential.Proc Natl Acad Sci U S A 1997, 94:3336-3340.
67. Tsujii M, Kawano S, Tsuji S, Sawaoka H, Hori M, DuBois RN:Cyclooxygenase regulates angiogenesis induced by coloncancer cells. Cell 1998, 93:705-716.
68. Neufang G, Furstenberger G, Heidt M, Marks F, Muller-Decker K:Abnormal differentiation of epidermis in transgenic miceconstitutively expressing cyclooxygenase-2 in skin. Proc NatlAcad Sci U S A 2001, 98:7629-7634.
69. Chinery R, Beauchamp RD, Shyr Y, Kirkland SC, Coffey RJ, MorrowJD: Antioxidants reduce cyclooxygenase-2 expression, pros-taglandin production, and proliferation in colorectal cancercells. Cancer Res 1998, 58:2323-2327.
70. Lavender P, Vandel L, Bannister AJ, Kouzarides T: The HMG-boxtranscription factor HBP1 is targeted by the pocket proteinsand E1A. Oncogene 1997, 14:2721-2728.
Page 18 of 19(page number not for citation purposes)
http://www.ncbi.nlm.nih.gov/entrez/query.fcgi?cmd=Retrieve&db=PubMed&dopt=Abstract&list_uids=3267209
http://www.ncbi.nlm.nih.gov/entrez/query.fcgi?cmd=Retrieve&db=PubMed&dopt=Abstract&list_uids=3267209
http://www.ncbi.nlm.nih.gov/entrez/query.fcgi?cmd=Retrieve&db=PubMed&dopt=Abstract&list_uids=3267209
http://www.ncbi.nlm.nih.gov/entrez/query.fcgi?cmd=Retrieve&db=PubMed&dopt=Abstract&list_uids=8380167
http://www.ncbi.nlm.nih.gov/entrez/query.fcgi?cmd=Retrieve&db=PubMed&dopt=Abstract&list_uids=8380167
http://www.ncbi.nlm.nih.gov/entrez/query.fcgi?cmd=Retrieve&db=PubMed&dopt=Abstract&list_uids=1350381
http://www.ncbi.nlm.nih.gov/entrez/query.fcgi?cmd=Retrieve&db=PubMed&dopt=Abstract&list_uids=1350381
http://www.ncbi.nlm.nih.gov/entrez/query.fcgi?cmd=Retrieve&db=PubMed&dopt=Abstract&list_uids=9520412
http://www.ncbi.nlm.nih.gov/entrez/query.fcgi?cmd=Retrieve&db=PubMed&dopt=Abstract&list_uids=9520412
http://www.ncbi.nlm.nih.gov/entrez/query.fcgi?cmd=Retrieve&db=PubMed&dopt=Abstract&list_uids=9925989
http://www.ncbi.nlm.nih.gov/entrez/query.fcgi?cmd=Retrieve&db=PubMed&dopt=Abstract&list_uids=9925989
http://www.ncbi.nlm.nih.gov/entrez/query.fcgi?cmd=Retrieve&db=PubMed&dopt=Abstract&list_uids=7533104
http://www.ncbi.nlm.nih.gov/entrez/query.fcgi?cmd=Retrieve&db=PubMed&dopt=Abstract&list_uids=7533104
http://www.ncbi.nlm.nih.gov/entrez/query.fcgi?cmd=Retrieve&db=PubMed&dopt=Abstract&list_uids=7533104
http://www.ncbi.nlm.nih.gov/entrez/query.fcgi?cmd=Retrieve&db=PubMed&dopt=Abstract&list_uids=8939708
http://www.ncbi.nlm.nih.gov/entrez/query.fcgi?cmd=Retrieve&db=PubMed&dopt=Abstract&list_uids=8939708
http://www.ncbi.nlm.nih.gov/entrez/query.fcgi?cmd=Retrieve&db=PubMed&dopt=Abstract&list_uids=8824194
http://www.ncbi.nlm.nih.gov/entrez/query.fcgi?cmd=Retrieve&db=PubMed&dopt=Abstract&list_uids=8824194
http://www.ncbi.nlm.nih.gov/entrez/query.fcgi?cmd=Retrieve&db=PubMed&dopt=Abstract&list_uids=7495566
http://www.ncbi.nlm.nih.gov/entrez/query.fcgi?cmd=Retrieve&db=PubMed&dopt=Abstract&list_uids=7495566
http://www.ncbi.nlm.nih.gov/entrez/query.fcgi?cmd=Retrieve&db=PubMed&dopt=Abstract&list_uids=8920898
http://www.ncbi.nlm.nih.gov/entrez/query.fcgi?cmd=Retrieve&db=PubMed&dopt=Abstract&list_uids=8920898
http://www.ncbi.nlm.nih.gov/entrez/query.fcgi?cmd=Retrieve&db=PubMed&dopt=Abstract&list_uids=8078588
http://www.ncbi.nlm.nih.gov/entrez/query.fcgi?cmd=Retrieve&db=PubMed&dopt=Abstract&list_uids=8078588
http://www.ncbi.nlm.nih.gov/entrez/query.fcgi?cmd=Retrieve&db=PubMed&dopt=Abstract&list_uids=7729683
http://www.ncbi.nlm.nih.gov/entrez/query.fcgi?cmd=Retrieve&db=PubMed&dopt=Abstract&list_uids=7729683
http://www.ncbi.nlm.nih.gov/entrez/query.fcgi?cmd=Retrieve&db=PubMed&dopt=Abstract&list_uids=7729683
http://www.ncbi.nlm.nih.gov/entrez/query.fcgi?cmd=Retrieve&db=PubMed&dopt=Abstract&list_uids=1373383
http://www.ncbi.nlm.nih.gov/entrez/query.fcgi?cmd=Retrieve&db=PubMed&dopt=Abstract&list_uids=1373383
http://www.ncbi.nlm.nih.gov/entrez/query.fcgi?cmd=Retrieve&db=PubMed&dopt=Abstract&list_uids=8673923
http://www.ncbi.nlm.nih.gov/entrez/query.fcgi?cmd=Retrieve&db=PubMed&dopt=Abstract&list_uids=8673923
http://www.ncbi.nlm.nih.gov/entrez/query.fcgi?cmd=Retrieve&db=PubMed&dopt=Abstract&list_uids=8673923
http://www.ncbi.nlm.nih.gov/entrez/query.fcgi?cmd=Retrieve&db=PubMed&dopt=Abstract&list_uids=9251681
http://www.ncbi.nlm.nih.gov/entrez/query.fcgi?cmd=Retrieve&db=PubMed&dopt=Abstract&list_uids=9251681
http://www.ncbi.nlm.nih.gov/entrez/query.fcgi?cmd=Retrieve&db=PubMed&dopt=Abstract&list_uids=9251681
http://www.ncbi.nlm.nih.gov/entrez/query.fcgi?cmd=Retrieve&db=PubMed&dopt=Abstract&list_uids=9096394
http://www.ncbi.nlm.nih.gov/entrez/query.fcgi?cmd=Retrieve&db=PubMed&dopt=Abstract&list_uids=9096394
http://www.ncbi.nlm.nih.gov/entrez/query.fcgi?cmd=Retrieve&db=PubMed&dopt=Abstract&list_uids=9630216
http://www.ncbi.nlm.nih.gov/entrez/query.fcgi?cmd=Retrieve&db=PubMed&dopt=Abstract&list_uids=9630216
http://www.ncbi.nlm.nih.gov/entrez/query.fcgi?cmd=Retrieve&db=PubMed&dopt=Abstract&list_uids=9630216
http://www.ncbi.nlm.nih.gov/entrez/query.fcgi?cmd=Retrieve&db=PubMed&dopt=Abstract&list_uids=9622066
http://www.ncbi.nlm.nih.gov/entrez/query.fcgi?cmd=Retrieve&db=PubMed&dopt=Abstract&list_uids=9622066
http://www.ncbi.nlm.nih.gov/entrez/query.fcgi?cmd=Retrieve&db=PubMed&dopt=Abstract&list_uids=9622066
http://www.ncbi.nlm.nih.gov/entrez/query.fcgi?cmd=Retrieve&db=PubMed&dopt=Abstract&list_uids=9178770
http://www.ncbi.nlm.nih.gov/entrez/query.fcgi?cmd=Retrieve&db=PubMed&dopt=Abstract&list_uids=9178770

BMC Cancer 2005, 5:75 http://www.biomedcentral.com/1471-2407/5/75
Publish with BioMed Central and every scientist can read your work free of charge
"BioMed Central will be the most significant development for disseminating the results of biomedical research in our lifetime."
Sir Paul Nurse, Cancer Research UK
Your research papers will be:
available free of charge to the entire biomedical community
peer reviewed and published immediately upon acceptance
cited in PubMed and archived on PubMed Central
yours — you keep the copyright
Submit your manuscript here:http://www.biomedcentral.com/info/publishing_adv.asp
BioMedcentral
71. Tevosian SG, Shih HH, Mendelson KG, Sheppard KA, Paulson KE, YeeAS: HBP1: a HMG box transcriptional repressor that is tar-geted by the retinoblastoma family. Genes Dev 1997,11:383-396.
72. Sampson EM, Haque ZK, Ku MC, Tevosian SG, Albanese C, PestellRG, Paulson KE, Yee AS: Negative regulation of the Wnt-beta-catenin pathway by the transcriptional repressor HBP1.Embo J 2001, 20:4500-4511.
73. Zhang L, Zhou W, Velculescu VE, Kern SE, Hruban RH, Hamilton SR,Vogelstein B, Kinzler KW: Gene expression profiles in normaland cancer cells. Science 1997, 276:1268-1272.
74. Vachon PH, Beaulieu JF: Transient mosaic patterns of morpho-logical and functional differentiation in the Caco-2 cell line.Gastroenterology 1992, 103:414-423.
75. Wang H, Chakrabarty S: Platelet-activating factor activatesmitogen-activated protein kinases, inhibits proliferation,induces differentiation and suppresses the malignant pheno-type of human colon carcinoma cells. Oncogene 2003,22:2186-2191.
76. Shimada A, Ota Y, Sugiyama Y, Sato S, Kume K, Shimizu T, Inoue S:In situ expression of platelet-activating factor (PAF)-recep-tor gene in rat skin and effects of PAF on proliferation anddifferentiation of cultured human keratinocytes. J InvestDermatol 1998, 110:889-893.
Pre-publication historyThe pre-publication history for this paper can be accessedhere:
http://www.biomedcentral.com/1471-2407/5/75/prepub
Page 19 of 19(page number not for citation purposes)
http://www.ncbi.nlm.nih.gov/entrez/query.fcgi?cmd=Retrieve&db=PubMed&dopt=Abstract&list_uids=9030690
http://www.ncbi.nlm.nih.gov/entrez/query.fcgi?cmd=Retrieve&db=PubMed&dopt=Abstract&list_uids=9030690
http://www.ncbi.nlm.nih.gov/entrez/query.fcgi?cmd=Retrieve&db=PubMed&dopt=Abstract&list_uids=9157888
http://www.ncbi.nlm.nih.gov/entrez/query.fcgi?cmd=Retrieve&db=PubMed&dopt=Abstract&list_uids=9157888
http://www.ncbi.nlm.nih.gov/entrez/query.fcgi?cmd=Retrieve&db=PubMed&dopt=Abstract&list_uids=1634060
http://www.ncbi.nlm.nih.gov/entrez/query.fcgi?cmd=Retrieve&db=PubMed&dopt=Abstract&list_uids=1634060
http://www.ncbi.nlm.nih.gov/entrez/query.fcgi?cmd=Retrieve&db=PubMed&dopt=Abstract&list_uids=9620295
http://www.ncbi.nlm.nih.gov/entrez/query.fcgi?cmd=Retrieve&db=PubMed&dopt=Abstract&list_uids=9620295
Related Documents