Jonathan Brooks OECD Trade and Agriculture Meeting of National Focal Points for PCD – 7 th November 2012 Global Food Security and Policy Coherence Measuring PCD

Welcome message from author
This document is posted to help you gain knowledge. Please leave a comment to let me know what you think about it! Share it to your friends and learn new things together.
Transcript
Jonathan Brooks OECD Trade and Agriculture
Meeting of National Focal Points for PCD – 7th November 2012
Global Food Security and
Policy Coherence Measuring PCD
OECD Trade & Agriculture 2
Aspects of policy coherence
• The spill-over effects of OECD countries’ policies
– Including food and agricultural policies
– Other policies affecting food security indirectly (e.g. consumer waste, over-consumption, innovation)
• Knowledge sharing
– Innovation, effectiveness of different policies
– More about processes than incidence and impact
OECD Trade & Agriculture 3
What can we measure?
1. Identify coherent and incoherent policies
2. Quantify the incidence of policies, or policy effort – using regularly available data (e.g. OECD’s calculations of farm support)
3. Can quantify their impacts on developing countries using ex post (econometric) analysis, or ex ante analysis (simulation models)
4. Can compute indicators of intermediate or final outcomes
Can do 1, 2 and 4 on a regular basis but 3 tends to be more ad hoc
OECD Trade & Agriculture 4
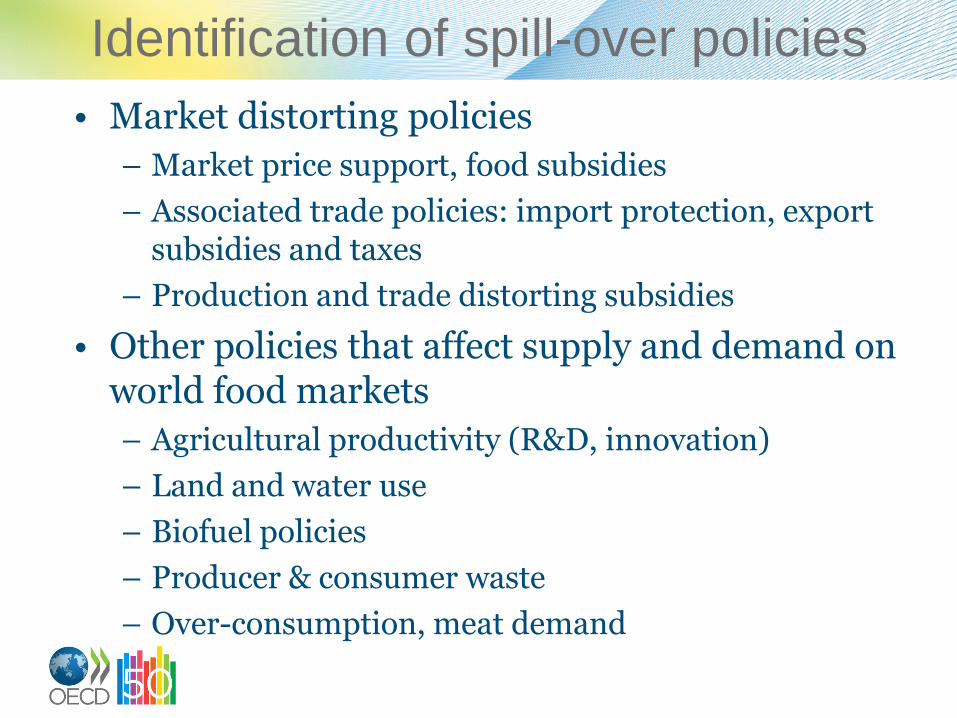
Identification of spill-over policies
• Market distorting policies
– Market price support, food subsidies
– Associated trade policies: import protection, export subsidies and taxes
– Production and trade distorting subsidies
• Other policies that affect supply and demand on world food markets
– Agricultural productivity (R&D, innovation)
– Land and water use
– Biofuel policies
– Producer & consumer waste
– Over-consumption, meat demand
OECD Trade & Agriculture 5
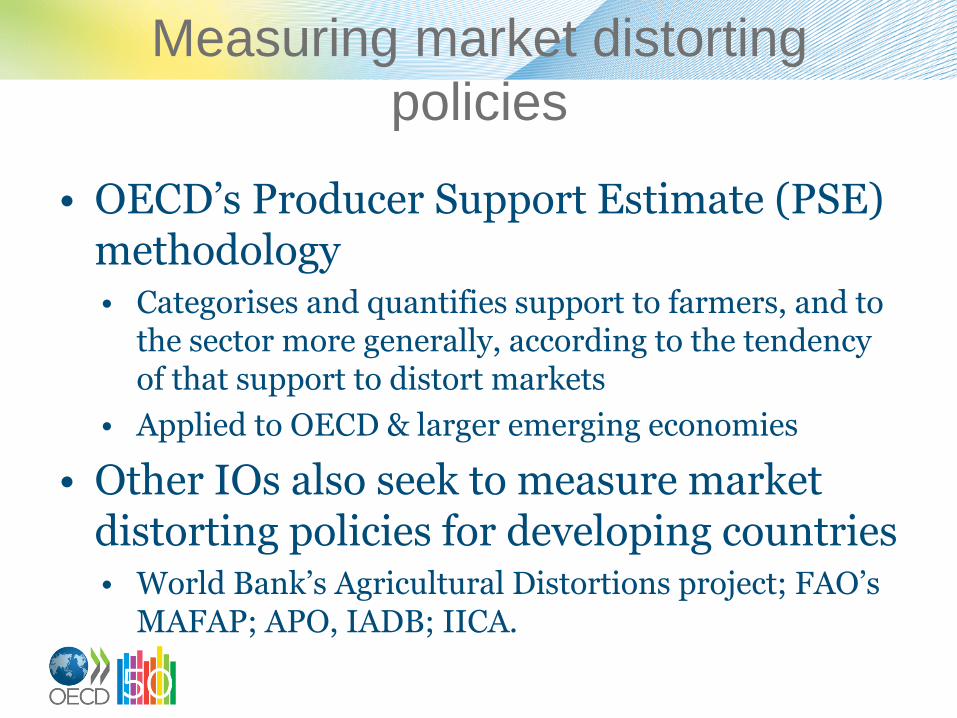
Measuring market distorting
policies
• OECD’s Producer Support Estimate (PSE) methodology • Categorises and quantifies support to farmers, and to
the sector more generally, according to the tendency of that support to distort markets
• Applied to OECD & larger emerging economies
• Other IOs also seek to measure market distorting policies for developing countries • World Bank’s Agricultural Distortions project; FAO’s
MAFAP; APO, IADB; IICA.
OECD Trade & Agriculture 6
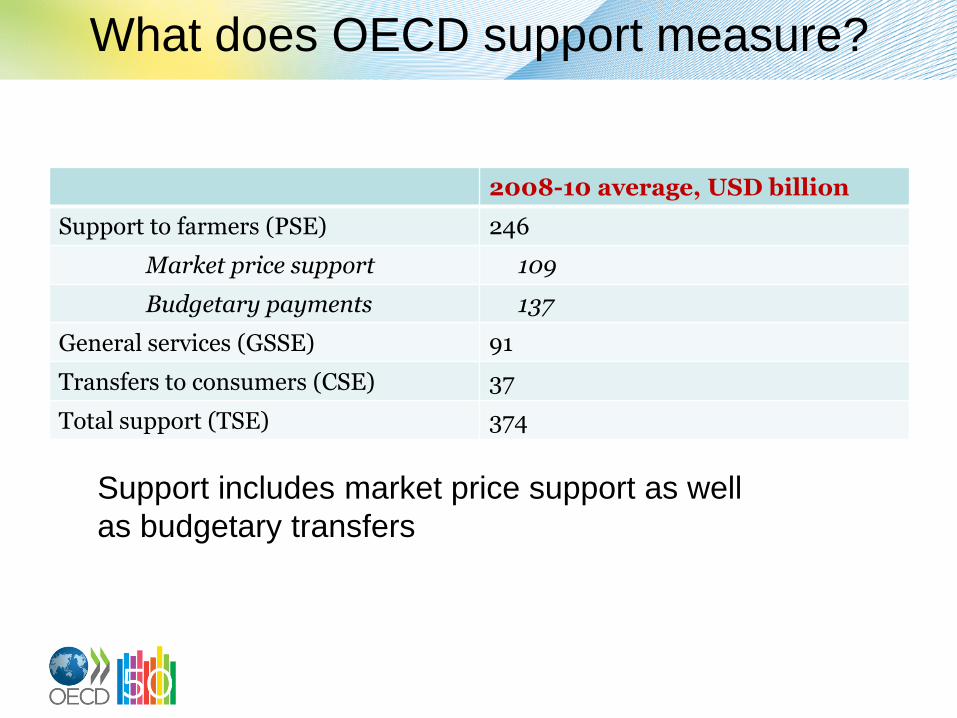
What does OECD support measure?
2008-10 average, USD billion
Support to farmers (PSE) 246
Market price support 109
Budgetary payments 137
General services (GSSE) 91
Transfers to consumers (CSE) 37
Total support (TSE) 374
Support includes market price support as well
as budgetary transfers
OECD Trade & Agriculture 7
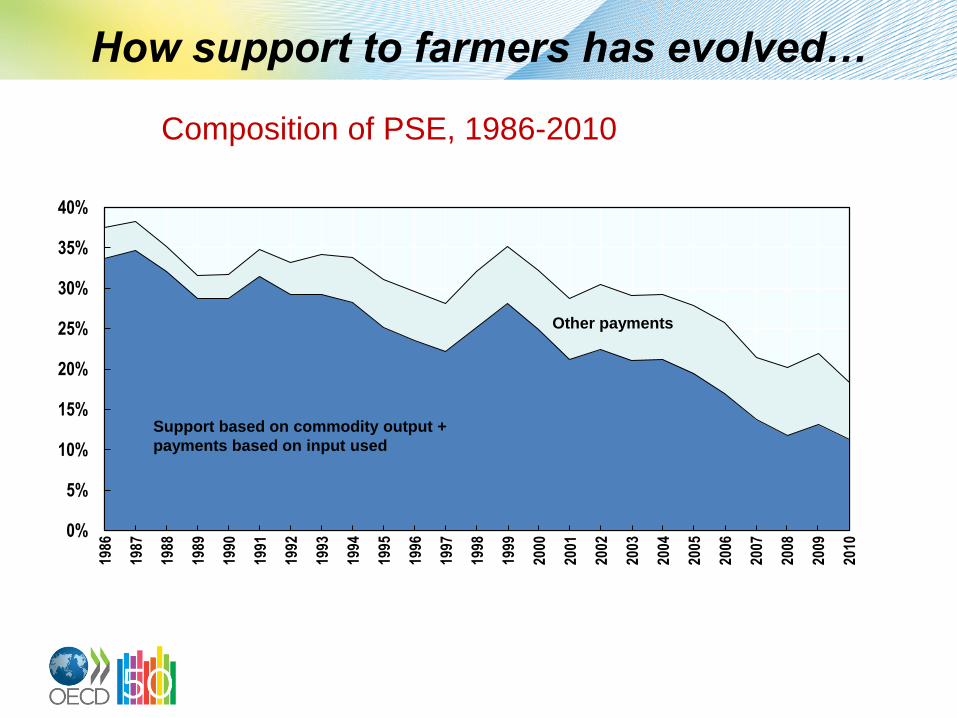
How support to farmers has evolved…
0%
5%
10%
15%
20%
25%
30%
35%
40%
1986
1987
1988
1989
1990
1991
1992
1993
1994
1995
1996
1997
1998
1999
2000
2001
2002
2003
2004
2005
2006
2007
2008
2009
2010
Support based on commodity output +
payments based on input used
Other payments
Composition of PSE, 1986-2010
OECD Trade & Agriculture 8
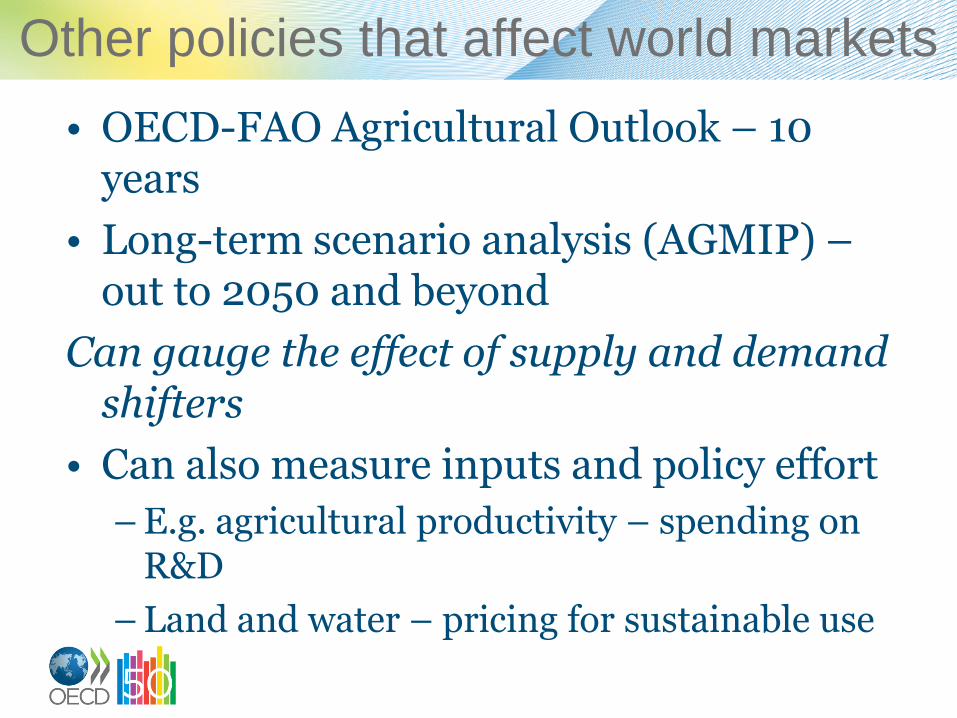
Other policies that affect world markets
• OECD-FAO Agricultural Outlook – 10 years
• Long-term scenario analysis (AGMIP) – out to 2050 and beyond
Can gauge the effect of supply and demand shifters
• Can also measure inputs and policy effort
– E.g. agricultural productivity – spending on R&D
– Land and water – pricing for sustainable use
OECD Trade & Agriculture 9
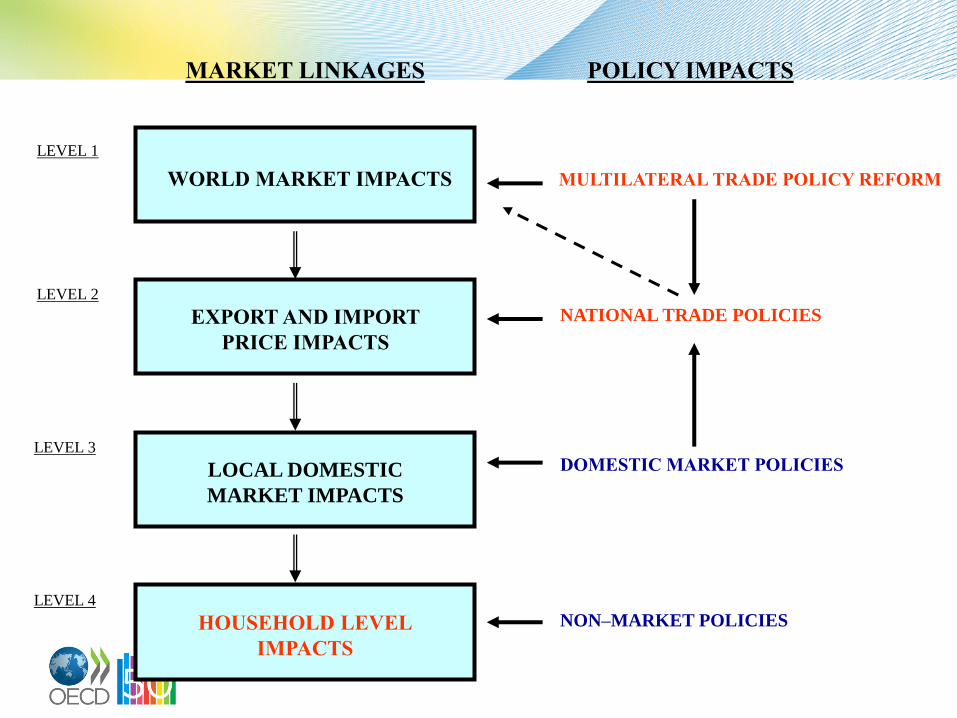
POLICY IMPACTS MARKET LINKAGES
LEVEL 1
LEVEL 2
WORLD MARKET IMPACTS MULTILATERAL TRADE POLICY REFORM
EXPORT AND IMPORT
PRICE IMPACTS
HOUSEHOLD LEVEL
IMPACTS
NON–MARKET POLICIES
LOCAL DOMESTIC
MARKET IMPACTS
DOMESTIC MARKET POLICIES
NATIONAL TRADE POLICIES
LEVEL 3
LEVEL 4
OECD Trade & Agriculture 10
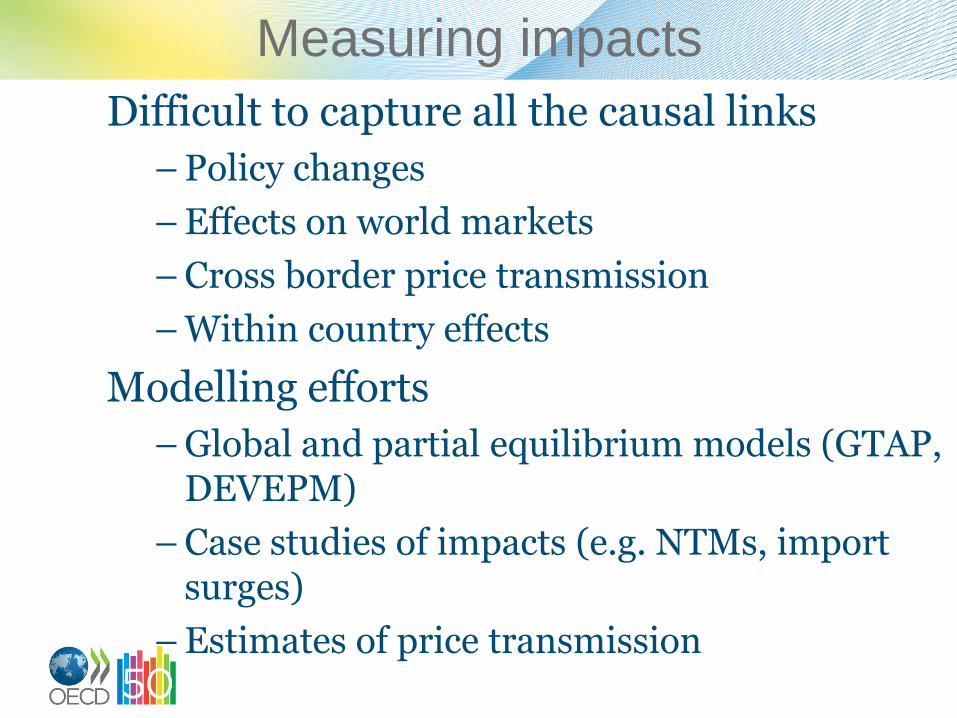
Measuring impacts
Difficult to capture all the causal links
– Policy changes
– Effects on world markets
– Cross border price transmission
– Within country effects
Modelling efforts
– Global and partial equilibrium models (GTAP, DEVEPM)
– Case studies of impacts (e.g. NTMs, import surges)
– Estimates of price transmission
OECD Trade & Agriculture 11
Other indicators
• Inputs
– Public expenditures (PSEs, ASTI etc.)
– Regulatory indices
• Outcomes
– Various measures of and proxies for food security
OECD Trade & Agriculture 12
www.oecd.org/agriculture
Follow us on Twitter: @OECDagriculture
Contact
OECD Trade and Agriculture
Related Documents