GLOBAL FINANCIAL CRISIS AND ITS IMPACT ON INDIAN SECURITIES MARKETS: AN EMPIRICAL STUDY Ashish Kumar Sana * Soumita Mukherjee ** Bibekananda Raychaudhuri *** Vidyasagar University Journal of Commerce Vol. 19, 2014/ISSN 0973-5917 Abstract The paper makes an attempt to analyze the impact of the crisis on Indian securities market with a special reference to the performance of the S&P BSE SENSEX companies. The study is divided into three periods. The first being taken as the pre-crisis period from (2005-2007), second is crisis period (2008-2009) and lastly the post-crisis period from (2010-2013Feb). Keywords: Global financial crisis, securities market, S&P BSE SENSEX, risk and return Introduction A financial crisis is a situation that causes an interruption in the smooth functioning of the financial market, associated with a sudden decline in the value of financial assets or institutions. It also includes other situations like the banking panics, stock market crash, bursting of other financial bubbles, currency crisis and sovereign defaults. Financial crisis in one country becomes global when its contagion effect spreads to the other countries in the world. Global financial crisis is indeed a difficult situation to overcome as the consumers lose confidence in the growth of the economy, thereby spending less, which leads to decrease in demand for goods and services and hence there is a fall in the production level, which ultimately leads to layoff and unemployment. The root cause of the current global financial crisis is attributed to the subprime mortgage crisis originating in US in the year 2007. The subprime mortgage crisis that broke out in 2007 in US market was triggered by the faulty lending process, providing loan at a low interest rate at ease to low income group borrowers, creation of housing bubble and the use of highly volatile complex ‘toxic’ financial instrument the Collateralized Debt Obligations (CDO). Few Indian banks having invested in the CDO’s which had a few underlying entities having subprime exposure was affected by the crisis. The subprime crisis originating in US rapidly spread to other countries and gradually transformed to a global financial crisis. Associate Professor, Department of Commerce, University of Calcutta,e-mail:[email protected] ** Department of Commerce, Charuchandra College,e-mail:[email protected] *** Associate Professor (Retired), Department of Economics, Maharaja Manindra Chandra College and Guest Faculty, Department of Commerce, University of Calcutta, email: [email protected]

Welcome message from author
This document is posted to help you gain knowledge. Please leave a comment to let me know what you think about it! Share it to your friends and learn new things together.
Transcript

GLOBAL FINANCIAL CRISIS AND ITS IMPACT ON INDIANSECURITIES MARKETS: AN EMPIRICAL STUDY
Ashish Kumar Sana*
Soumita Mukherjee**
Bibekananda Raychaudhuri***
Vidyasagar University Journal of CommerceVol. 19, 2014/ISSN 0973-5917
AbstractThe paper makes an attempt to analyze the impact of the crisis on Indiansecurities market with a special reference to the performance of the S&PBSE SENSEX companies. The study is divided into three periods. The firstbeing taken as the pre-crisis period from (2005-2007), second is crisisperiod (2008-2009) and lastly the post-crisis period from (2010-2013Feb).
Keywords: Global financial crisis, securities market, S&P BSE SENSEX,risk and return
Introduction
A financial crisis is a situation that causes an interruption in the smooth functioning of thefinancial market, associated with a sudden decline in the value of financial assets or institutions.It also includes other situations like the banking panics, stock market crash, bursting of otherfinancial bubbles, currency crisis and sovereign defaults. Financial crisis in one country becomesglobal when its contagion effect spreads to the other countries in the world. Global financialcrisis is indeed a difficult situation to overcome as the consumers lose confidence in the growthof the economy, thereby spending less, which leads to decrease in demand for goods andservices and hence there is a fall in the production level, which ultimately leads to layoff andunemployment.
The root cause of the current global financial crisis is attributed to the subprime mortgagecrisis originating in US in the year 2007. The subprime mortgage crisis that broke out in 2007in US market was triggered by the faulty lending process, providing loan at a low interest rateat ease to low income group borrowers, creation of housing bubble and the use of highlyvolatile complex ‘toxic’ financial instrument the Collateralized Debt Obligations (CDO). FewIndian banks having invested in the CDO’s which had a few underlying entities having subprimeexposure was affected by the crisis. The subprime crisis originating in US rapidly spread toother countries and gradually transformed to a global financial crisis.
Associate Professor, Department of Commerce, University of Calcutta,e-mail:[email protected]** Department of Commerce, Charuchandra College,e-mail:[email protected]***Associate Professor (Retired), Department of Economics, Maharaja Manindra Chandra College and GuestFaculty, Department of Commerce, University of Calcutta, email: [email protected]

Sana, Mukherjee & Raychaudhuri
[ 101 ]Vidyasagar University Journal of Commerce
The impact of the crisis has been reflected in the form of falling stock markets, collapse of theinvestments banks, shut down of big industrial firms, falling demand, increasing unemployment.Those having a greater exposure to global financial market were affected more than thosehaving lesser exposure.
Literature ReviewLiterature survey is one of the most vital parts of any research work for the judgment of therelevancy of the research work under consideration. There is no scarcity of works in the areaof global financial crisis. A good number of research works has been done on this topic. Thefollowing are the instances of some notable works in this area.
Reinhart and Rogoff, (2008) examined the relationship between the subprime crisis andfinancial crisis. They stated that the subprime was the main reason of the global financial crisis.Subbarao, (2009) opined that the subprime crisis originating in US rapidly spread to othercountries and permeated from the financial sector into the real economy through differentchannels. Gieve,(2008) identified the three important aspects of financial crisis, viz., (i) theorigination of the crisis, (ii) the policy challenges and (iii) the lessons learnt from the crisis. Heattempted to highlight the causes of the crisis and the necessary policy measures that shouldbe adopted by the affected economies to revive its growth. Finally, he concluded by statingthat both the developed as well as the developing/ emerging economies have been affected bythe global crisis. Rajkumari, Mittal and Singh, (2010) observed that India was not likely tobe affected by the crisis due to its strong fundamentals. Ellis, (2009) examined the causes ofthe financial crisis and its impact particularly in Australia. Nasution, (2010) examined andconcluded that the impact on the economies of Asia Pacific Region was multifold. Bhaskaran,(2009) examined the impact of global crisis on South East Asian economies. He concludedthat the extent of impact on the emerging economy was different in different sectors. Padmasaniand G. Lalitha Kumari (2010) mentioned about the effect of financial crisis on differentsectors of Indian economy. Dawood (2010) examined the impact of the financial crisis on thestock market, corporate sector and forex market. Another research work confirmed the factthat Indian securities market was severely affected by the crisis mainly due to the reversal ofportfolio investments Manimekalai, (2010). Sharma and Ashraf, (2011) opined thatquantification of the impact of crisis on India’s economy is indeed a difficult task but India wasto some extent affected by the spillover effect of the crisis. Arunchalam, (2011) conductedan empirical study to analyze the impact of global financial crisis on Indian economy. He foundthat India was being affected by the crisis but the extent of the impact was different in differentsectors. He further stated that the export oriented sector was affected most in comparison toother sectors. Muthukumar, Senthamil and Palanichamy (2011) found that Indian stockmarket was affected by the crisis. Khandelwal (2011) conducted a study about the impact ofglobal recession on Indian BPO companies. Finally, to conclude, it can be said that Indian

[ 102 ] Vidyasagar University Journal of Commerce
Global Financial Crisis and its Impact on Indian Securities Markets : An Empirical Study
economy was affected by the crisis but the extent of impact was different in different sectors.
Objectives of the Study
The present paper aims to examine the following objectives:-
i) To identify the different reasons for global financial crisis, and
ii) To examine the impact of the global financial crisis on the Indian securities market.
Data Sources and Methodology
The study is both exploratory and empirical in nature. The exploratory part of the study isbased on the current literature available in the market on this particular issue in the form ofbooks, journal articles, research studies and websites. Data are obtained from the websites ofthe Bombay Stock Exchange (BSE) and the National Stock Exchange (NSE), SEBI Handbookof Statistics on Indian Securities Markets, Reserve Bank of India (RBI) Handbook of Statisticson Indian Economy, Investment Company Fact Book, various reports and articles publishedin financial dailies, finance-based magazines and periodicals.
Methodology
For the purpose of analyzing the impact of financial crisis on Indian securities market as perthe stated objective, the equity performance analysis measure of S&P BSE 30 companiesrepresenting SENSEX has been selected. The period of study is for a time frame of 8 years2 months from January 2005 to February 2013. The total study is divided into three periods:(i) Pre-crisis period (2005-2007), (ii) Crisis period (2008-2009) and (iii) the Post crisisperiod (2010 -2013 Feb).
Brief outlines of the various statistical tools that have been used for performance analysis are:
Return: Daily returns of the individual company’s scrip’s opening1, closing2 and weightedaverage price3 (WAP) and SENSEX has been calculated. Daily return indicates the change inthe share price over a particular day (i.e. holding period).After calculating the daily return themaximum, minimum and the averages of the calculated series has been taken as the returnestimating parameter.
Risk: Standard deviation (SD) and Coefficient of Variation (CV) have been calculated forrisk estimation. SD has been calculated to measures the volatility in share/scrip’s price. Itmeasures the dispersion of actual from the expected in absolute terms and CV is a relativemeasure of dispersion calculated to measure the risk in relative terms.
Correlation Coefficient (R)
It has been calculated to measure the degree of association between the individual company’sshare price movements with the SENSEX movement.

Sana, Mukherjee & Raychaudhuri
[ 103 ]Vidyasagar University Journal of Commerce
The rationale behind taking daily data of the share price for performance analysis, rather thanmonthly or yearly is to capture the significant fluctuations in share prices which may not becaptured or reflected if monthly or yearly data is taken, since month or year is a longer timeperiod.
Assigning the Title of Best, Worst and Moderate Performers for PerformanceAnalysis:
In order to make a performance analysis of the select companies, the companies have beenassigned the title of best, worst and moderate performers after making a comparison amongthe companies. Basis for assigning the titles to the select companies are noted below.
Steps Basis of assigning title
Step-1 Maximum/ Highest and Minimum/ Lowest value of the calculated return,risk estimating parameter and the correlation have been taken.
Step-2 Based on that Average has been calculated.
Above Average - Assigned as Best Performers
Below Average - Assigned as Worst Performers
Average - Assigned as Moderate Performers
Step-3 Range has been calculated. Based on the range value dividing it by thenumber of class intervals as mentioned width of the class interval hasbeen found out.
Reasons for the Global Financial Crisis
The US subprime crisis is attributed as the main cause of the current global financial crisis. Themajor factors that contributed to the subprime crisis in US which is attributed as the majorcause of the global financial crisis can be summed up as follows:-
i) The low rate of interest charged by US banks.
ii) Use of highly volatile complex financial instruments as mortgage like the CollateralizedDebt Obligations (CDO) and Credit Default Swaps.
iii) The credit bubble was due to low interest rates and easy borrowing conditions.
iv) The profitability objective of the banks and the other financial institutions to expandthe credit.
Other causes of global financial crisis have been identified are (i) Misperception and under-pricing risk factor (ii) Loose monetary policy of US (iii) Relaxation of lending standards iv)Deregulation of financial system. Now, the subprime crisis transformed to global financial
[ 104 ] Vidyasagar University Journal of Commerce
Global Financial Crisis and its Impact on Indian Securities Markets : An Empirical Study
crisis as the spillover effect of the crisis spread to the other countries rapidly.
Empirical Findings
The impact of global financial crisis on Indian securities market has been studied by analyzingthe equity market performance of the S&P BSE 30 companies representing the SENSEX.The term equity in the trading world refers to stock. Equity market performance refers to thestock market performance.
As stated in methodology for the purpose of empirical analysis, return, risk /volatility of thescripts and the correlation of individual company’s share price movement with Sensex havebeen calculated using certain statistical tools. The logic behind taking 2008 onwards as thecrisis period in the present study, despite knowing the fact that the crisis surfaced in US in2007, is that since the study is limited to Indian context only, it has been observed that theimpact on India’s economy became apparently visible from 2008 onwards, hence 2008onwards has been taken as the crisis period for the present study.
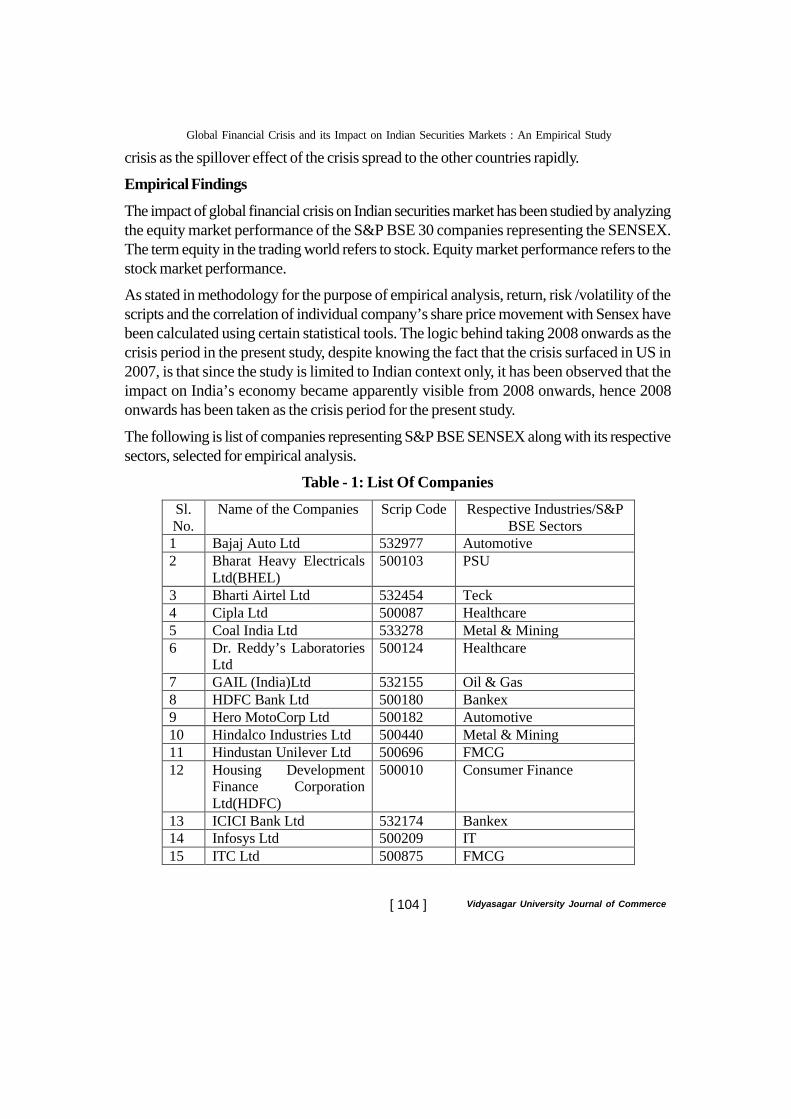
The following is list of companies representing S&P BSE SENSEX along with its respectivesectors, selected for empirical analysis.
Table - 1: List Of Companies
Sl. No.
Name of the Companies Scrip Code Respective Industries/S&P BSE Sectors
1 Bajaj Auto Ltd 532977 Automotive 2 Bharat Heavy Electricals
Ltd(BHEL) 500103 PSU
3 Bharti Airtel Ltd 532454 Teck 4 Cipla Ltd 500087 Healthcare 5 Coal India Ltd 533278 Metal & Mining 6 Dr. Reddy’s Laboratories
Ltd 500124 Healthcare
7 GAIL (India)Ltd 532155 Oil & Gas 8 HDFC Bank Ltd 500180 Bankex 9 Hero MotoCorp Ltd 500182 Automotive 10 Hindalco Industries Ltd 500440 Metal & Mining 11 Hindustan Unilever Ltd 500696 FMCG 12 Housing Development
Finance Corporation Ltd(HDFC)
500010 Consumer Finance
13 ICICI Bank Ltd 532174 Bankex 14 Infosys Ltd 500209 IT 15 ITC Ltd 500875 FMCG

Sana, Mukherjee & Raychaudhuri
[ 105 ]Vidyasagar University Journal of Commerce
* Sesa Goa has replaced Sterlite Industries in the Sensex from August 27, 2013
Source: www.bseindia.com
The empirical analysis results have been outlined below: The following table-2 provides anoverview of the S&P BSE 30 companies that have been identified as the best, moderate andworst performers during pre-crisis period i.e. from 2005 Jan to 2007 as taken in this presentstudy :
Sl. No.
Name of the Companies Scrip Code Respective Industries/S&P BSE Sectors
16 Jindal Steel &Power Ltd 532286 Steel & Power 17 Larsen & Toubro Ltd 500510 Capital Goods 18 Mahindra & Mahindra
Ltd 500520 Automotive
19 Maruti Suzuki India Ltd 532500 Automotive 20 NTPC Ltd 532555 Power 21 Oil & Natural Gas
Corporation Ltd(ONGC) 500312 Oil& Gas
22 Reliance Industries Ltd 500325 Oil & Gas 23 State Bank Of India(SBI) 500112 Bankex 24 Sesa Goa(Sterlite
Industries(India) Ltd*) 500900 Metal
25 Sun Pharmaceutical Industries Ltd
524715 Healthcare
26 Tata Consultancy Service Ltd(TCS)
532540 IT
27 Tata Motors Ltd 500570 Automotive 28 Tata Power Co.Ltd 500400 Power 29 Tata Steel Ltd 500470 Steel
30 Wipro Ltd 507685 IT

[ 106 ] Vidyasagar University Journal of Commerce
Global Financial Crisis and its Impact on Indian Securities Markets : An Empirical StudyTa
ble
- 2: O
verv
iew
of P
erfo
rman
cePr
e C
risi
s Per
iod
(200
5-20
07)
Sour
ce: C
ompu
ted
and
Com
pile
d by
aut
hors
from
the
data
col
lect
ed fr
om B
SE h
isto
rica
l equ
ity p
rice
dat
a ar
chiv
e

Sana, Mukherjee & Raychaudhuri
[ 107 ]Vidyasagar University Journal of Commerce
The key findings during the pre-crisis period are noted below:
Firstly, considering the maximum return, as the return estimating parameter on individualcompanies is concerned, opening, closing and weighted average share prices- the bestperformer during this period is Jindal Steel & Power representing S&P BSE Steel & Powersector. Next top performers are BHEL and GAIL, taking opening prices, Tata power, Dr.Reddy’s Laboratory taking closing price and Tata Power along with the other above mentionedcompanies taking average prices respectively. Sesa Goa , Larsen & Toubro and RIL can beattributed the title of moderate performers considering opening closing and average prices,lastly worst performers are Cipla, Hero Motocorp, Infosys, Sun Pharma, ICICI Bank, HULand Maruti Suzuki considering the return on opening price, closing and average price respectively.
Secondly, taking minimum return as performance evaluation parameter it has been found thatICICI Bank, Sun Pharma, HDFC Bank are the best performers among the others consideringall the three variables : opening, closing and weighted average share price, Hindustan UnileverLimited, Jindal Steel& Power and Hero Motocorp are the next best performers. The moderateperformers are Mahindra & Mahindra; Wipro considering the three variables and the HindalcoIndustries, BHEL, Cipla, ITC, Sesa Goa have been identified as the worst performers.
Thirdly, considering Standard Deviation (SD) as a measure of risk, it can be said the equityperformance of HUL and Sun Pharma on opening, closing and average is the best in comparisonto others, followed by Hero Moto Corp, ICICI, NTPC and RIL, then the moderate performersare BHEL, Jindal Steel, Cipla and worst performer is Sterlite Industries (Sesa Goa), havingthe higher standard deviation, followed by ITC Ltd, Hindalco industries.
Fourthly, comparing the Coefficient of Variation (CV) as a relative measure of risk, the conclusionthat has been arrived at is that the best performer among all is Jindal Steel & Power, the nextbest performers are HDFC Ltd , RIL, HUL and the moderate performer is Bharti Airtel andlastly the worst performers are Hindalco Industries, ITC Ltd, TCS, Wipro. Lastly, it is observedfrom the comparison that the Correlation Coefficient (R) of ITC Ltd. with Sensex is lowduring this period. Hence, it can be attributed the title of best performer, the next best performersare Dr. Reddy’s Laboratory and Cipla, the moderate performers considering three variablesare BHEL, GAIL, Sesa Goa and lastly the worst performers are State Bank of India (SBI),ICICI Bank, Infosys, Airtel.
Finally, to conclude from the key findings, the equity performance of Jindal Steel & Powerand Hindalco Industries representing the S&P BSE Steel & Power and Metal & Miningsector are the best and the worst performer respectively during the pre crisis period as selectedin the present study, considering the average return of the scrips as the return estimatingparameter. Taking SD as the measure of individual company’s share’s risk / volatility it isobserved that HUL, Sun Pharma and Hero Moto Corp from the FMCG, Healthcare and

[ 108 ] Vidyasagar University Journal of Commerce
Global Financial Crisis and its Impact on Indian Securities Markets : An Empirical Study
Automotive sector and Sterlite Industries (Sesa Goa) from Metal and Mining sector are thebest and the worst performers respectively.
So it is quite apparent from the above comparison and analysis that the steel and powersector performed well during the pre-crisis period, that is before the time the global financialcrisis visibly started affecting India, whereas considering the risk estimating parameter it isseen that FMCG, Healthcare and the Auto sector companies has a lower standard deviation,thereby indicating lower risk compared to others. Finally, there arises a question whether theperformance of these companies remained at par during the crisis as well as the post crisisperiod also?
The answer to this question can be given by a comparison of the individual company’s pre-period performance with the crisis and post crisis period performances. It is seen that duringcrisis and post crisis period return of Jindal Steel & Power Company further declined andbecomes negative. So, apparently it is seen that Jindal Steel & Power representing steel andpower sector has not been able to maintain its equity performance at par considering thereturn of the scrip. Next, considering the risk factor of the scrip it is seen that it was lower inpre-period but increased during crisis period indicating high volatility and again further re-duced to some extent during post period.
The best, moderate and worst performer companies during crisis period, i.e. , from 2008 to2009 are shown in Table 3 below.

Sana, Mukherjee & Raychaudhuri
[ 109 ]Vidyasagar University Journal of Commerce
Tabl
e 3
- Ove
rvie
w o
f Per
form
ance
Cri
sis P
erio
d (2
008-
2009
)
Sour
ce: C
ompu
ted
and
Com
pile
d by
aut
hors
from
the
data
col
lect
ed fr
om B
SE h
isto
rica
l equ
ity p
rice
dat
a ar
chiv
e.

[ 110 ] Vidyasagar University Journal of Commerce
Global Financial Crisis and its Impact on Indian Securities Markets : An Empirical Study
The key findings during the crisis period are mentioned below
Firstly, considering the maximum return as the return estimating parameter on individualcompanies on opening and closing prices it can be concluded that the best performer duringthis period is Larsen & Toubro Ltd. representing S&P BSE Capital Goods sector and SterliteIndustries (Sesa Goa) considering the weighted average share prices respectively. Next, bestperformers are Bajaj Auto Ltd., Mahindra & Mahindra, Maruti Suzuki, BHEL; RIL, TataMotors respectively considering three variables the moderate performer are HDFC bankLtd, Hero Motocorp, ONGC, NTPC Ltd. respectively considering the opening, closing andaverage price respectively and lastly worst performer is Sun Pharma, Infosys and ITC Ltd.considering the return on opening price, closing and average price respectively.
Secondly, taking minimum return as performance evaluation parameter it is seen that CiplaLtd., Hero Motocorp and HUL are the best performers among the others considering all thethree variables. The next best performers are Sun Pharma, ITC, Infosys, ICICI Bank, Hindalcorespectively. Next Jindal Steel and power has been identified as the worst performer. Themoderate performers are L&T, Airtel.
Thirdly, after considering average return of the BSE 30 companies it is seen that Bajaj AutoLtd. is the best performer among all, next best are Maruti Suzuki, Dr. Reddy’s Laboratory,Cipla, Maruti, Hero Moto Corp and lastly Jindal Steel and Power followed by Airtel, RIL arethe worst performer among all. Next HDFC Ltd, Tata Motors, Wipro are the moderateperformers.
Fourthly, considering Standard Deviation (SD) as a measure of risk, it can be said the equityperformance of HUL on opening, closing and average is the best in comparison to others;next bests are Cipla, Hero moto corp, ITC Ltd, Dr. Reddy’s Labroratory and lastly worstperformers are Jindal Steel & Power, Sesa Goa and TCS. ICICI Bank has been identified asmoderate performers.
Fifthly, comparing the Coefficient of Variation (CV) as a relative measure of risk the conclusionthat has been arrived at is that the best performer among all is Hero Moto Corp, the next bestperformers are Bajaj Auto Ltd, Cipla Ltd. and lastly the worst performer is Jindal Steel &Power. The moderate performer is Airtel. Lastly, it is observed from the comparison that theCorrelation of Coefficient (R) of Sun Pharma Ltd. with Sensex is low during this periodthereby implying lesser fluctuation in prices hence it can be attributed the title of best performer,the next best performer are Dr. Reddy’s Laboratory, Bajaj Auto, Hero Moto Corp, HULrespectively and lastly the worst performer is ICICI Bank, moderate performers are Maruti,ITC, GAIL Ltd.
Finally to conclude from the key findings it can be stated that equity performance of Bajajauto Ltd and Jindal Steel & Power representing the S&P BSE Auto and Steel & Power

Sana, Mukherjee & Raychaudhuri
[ 111 ]Vidyasagar University Journal of Commerce
sector are the best and the worst respectively during the crisis period as selected in the presentstudy, considering the average return of the scrip’s as the return estimating parameter. Next,taking SD as the measure of individual share’s risk / volatility it is observed that HUL, andJindal Steel & Power from the FMCG and steel and power sector are the best and the worstperformers respectively.
The best, moderate and worst performer companies during post crisis period, i.e., from 2010to 2013 Feb are shown in Table 4 below.
TABLE - 4 : OVERVIEW OF PERFORMANCEPost Crisis Period (2010-2013 Feb)
Source : Computed and Compiled by authors from the data collected from BSE historicalequity price data archive.
Opening price Closing price Average price Parameters/ Prices Best Performers
(Top 3 to 5) Moderate
Performers (1 to 2)
Worst Performers
(Bottom 3 to 5)
Best Performers (Top 3 to 5)
Moderate Performers
(1 to 2)
Worst Performers (Bottom 3
to 5)
Best Performers (Top 3 to 5)
Moderate Performers
(1 to 2)
Worst Performers
(Bottom 3 to 5)
Max Return Hero Moto Corp Tata Steel, ONGC Ltd, Coal India Ltd
Larsen & Toubro Ltd
Dr. Reddy’s Laboratory, RIL, Sunpharma.
HeroMoto Corp Infosys TCS
Coal India Ltd
HDFC BankLtd RIL, Sunpharma
HeroMoto Corp, Infosys, Tata Motors
Coal India Ltd
Wipro, RIL, Sunpharma
Min Return
NTPC Ltd Coal India Ltd ICICI Bank
ITC Ltd Tata Power, BHEL, Sesa Goa
NTPC Ltd, Coal India Ltd, Hindalco Industries.
Mahindra& Mahindra
Tata Power, BHEL, Sesa Goa.
NTPC Ltd, Coal India Ltd, SBI.
GAIL (India) Ltd.
Tata Power, ,BHEL, Sesa Goa.
Average Return
State Bank of India(SBI), Dr. Reddy’s Laboratory, Bajaj Auto Ltd
TCS BHEL, Sesa Goa, Tata Power.
State Bank of India(SBI), Dr. Reddy’s Laboratory, Bajaj Auto Ltd.
TCS BHEL, Sesa Goa, Tata Power
State Bank of India(SBI), Dr.Reddy’s Laboratory Bajaj Auto Ltd
TCS BHEL, Sesa Goa, Tata Power
SD SBI,NTPC Ltd Hindustan Unilever Ltd Dr. Reddy’s Laboratory
Maruti Suzuki Tata Motors, Tata Power, Sesa Goa
SBI, Dr. Reddy’s Laboratory NTPC Ltd Hindustan Unilever Ltd
Bharti Airtel Tata Motors, Tata Power, Sesa Goa
SBI,NTPC Ltd, Dr. Reddy’s Laboratory Hindustan Unilever Ltd
Tata Steel Tata Motors, Tata Power, Sesa Goa
CV Tata Consultancy Services(TCS) Hindustan Unilever Ltd Dr. Reddy’s Laboratory
Mahindra& Mahindra
HDFC Bank, RIL, GAIL
Tata Consultancy Services(TCS) Hindustan Unilever Ltd Dr. Reddy’s Laboratory
Mahindra& Mahindra
Maruti Suzuki RIL, GAIL
Tata Consultancy Services(TCS), Hindustan Unilever Ltd, Dr. Reddy’s Laboratory
Mahindra& Mahindra
HDFC Bank RIL, GAIL
R Sun Pharma,ONGCLtd, HeroMoto Corp
TCSICICI, RIL,SBI. TCS TCS
Sun Pharma,Tata Power,ONGC Ltd,HindustanUnilever Ltd,Dr.Reddy'sLaboratory
ICICIBank,RIL, SBI
SunPharma,ITC,Tata Power.
ICICIBank,RIL, SBI

[ 112 ] Vidyasagar University Journal of Commerce
Global Financial Crisis and its Impact on Indian Securities Markets : An Empirical Study
The key findings during the post-crisis period are noted below.
Firstly, considering the maximum return as the return estimating parameter on individualcompanies opening, closing and weighted average share prices it can be concluded that thebest performer during this period is Hero Moto Corp representing S&P BSE Auto sector.Next, best performers are Tata Steel, Coal India, TCS, Tata Motors and Infosys Ltdrespectively, lastly, the worst performers are Sun Pharma, Dr. Reddy’s Laboratory, HDFCLtd. and Wipro considering the return on opening price, closing and average price respectively.L&T and Coal India are the moderate performers.
Secondly, taking minimum return as performance evaluation parameter it is seen that NTPCLtd. is the best performer among the others considering all the three variables. The next bestperformers are Coal India Limited, ICICI, Hindalco, State Bank of India (SBI) and lastlyTata Power Company has been identified as the worst performer. The moderate performersare ITC, Mahindra & Mahindra, GAIL (India) Ltd.
Thirdly, after considering the average return of the BSE 30 companies taking all the threeprices – opening, closing and average price- it is seen that State Bank of India (SBI) is thebest performer among all, next best performers are Dr. Reddy’s Laboratory, TCS and Bajajauto Ltd. considering the three variables, lastly BHEL, Sesa Goa, Tata Power are the worstperformers among all.TCS has been identified as moderate performer.
Fourthly, considering Standard Deviation(SD) as a measure of risk, it can be said the equityperformance of SBI on opening, closing and average is the best in comparison to others, nextto this the best performer are HUL, NTPC Ltd , Dr. Reddy’s Laboratory and lastly TataMotors, Tata Power, Sesa Goa have been identified as worst performer. Maruti, Airtel, TataSteel has been identified as moderate performers. Fifthly, comparing the Coefficient of Variation(CV) as a relative measure of risk the conclusion that has been arrived at is that the bestperformer among all is Tata Consultancy Services (TCS), the next best performers consideringopening, closing and average price are HUL, Dr. Reddy’s Laboratory and finally the worstperformer is HDFC Bank, followed by RIL, GAIL, Maruti Suzuki. The moderate performeris Mahindra & Mahindra.
Lastly, it is observed from the comparison that the Correlation Coefficient (R) of Sun Pharmawith Sensex is low during this period hence it can be attributed the title of best performer, thenext best performers are ONGC, ITC Ltd., Tata power, Hero Moto Corp considering opening,closing and average price and the worst performer is ICICI Bank followed by SBI, RILthereby indicating a high correlation with Sensex movement. TCS has been identified asmoderate performer.
Finally, to conclude from the key findings it can be stated that equity performance of SBI and
Sana, Mukherjee & Raychaudhuri
[ 113 ]Vidyasagar University Journal of Commerce
HDFC Bank representing the S&P BSE banking sector is the best and the worst performerrespectively during post crisis period as selected in the present study, considering the averagereturn of the scrip’s as the return estimating parameter. Next, taking SD as the measure ofindividual share’s risk / volatility it is observed that SBI, NTPC Ltd. and Tata Motors frompower and auto sector are the best and the worst performers respectively.
Conclusion
It is observed from the above analysis the Indian securities market was affected by the globalfinancial crisis. The performance of some select companies, namely, Jindal Steel and Power,HDFC Bank, Cipla Ltd, BHEL, Sun Pharma, Tata Motors, GAIL (India) Ltd, ICICI Bank,NTPC Ltd, ONGC Ltd, Sesa Goa, Reliance Industries, Tata Power Co, Tata Steel Ltd,Wipro, is better in the pre-crisis period than in the post crisis period, whereas the performancesof the companies viz. HUL, SBI declined further during crisis period as compared to precrisis period. But from the comparative study it is seen that they are being able to revive itsgrowth during post crisis period and some companies namely, Bajaj Auto Ltd, TCS havebeen able to maintain a consistent performance level in post crisis period in comparison to theperformance of others. The IT sector which has been affected by the spillover effect of thecrisis is being able to recover to some extent, whereas the performance of the banking sectorcompanies was relatively better in the pre-crisis period than in the post-crisis period, theHealthcare and the FMCG sector also recovered to some extent.
Some companies like Jindal Steel are better performers, in pre-crisis period but its performancedeclined during the crisis period and are gradually recovering during post-crisis period whereasin case of Sun Pharma Ltd. it has been seen that its performance declined during crisis periodbut considering the risk factor the performance of the company further declined to someextent during post period. It is also seen that performance of HUL improved during post-crisis period considering the risk and return parameters. While in case of NTPC Ltd.representing the power sector, the performance of this company improved during post-crisisperiod as compared to that it was in pre and crisis period considering the risk parameter.Considering the risk estimating parameter it is seen that Healthcare (Dr. Reddy’s Laboratory)and the Power (NTPC Ltd) sector companies has a lower standard deviation thereby indicatinglower risk compared to others in post crisis period.
The results obtained from the data analysis and the comparison reveals that the performanceof each of these companies has been different during different time period. To arrive at thesummary of the findings and to identify the best, worst and the moderate performers duringthe three periods the average returns and standard deviation has been taken as the return andrisk estimating parameter. The rationale behind selecting average return and standard deviationfor performance measurement is that the average is a better and consistent measure forestimating the return of the scripts and standard deviation – the absolute measure of risk gives

[ 114 ] Vidyasagar University Journal of Commerce
Global Financial Crisis and its Impact on Indian Securities Markets : An Empirical Study
a better picture of individual share’s risk/ volatility.
Finally, it may be stated that the Indian economy was affected by the financial crunches morespecifically referring to the Indian securities market in the present context. The performancesof the select companies were different during the different period of time. Equity performancesof the most of the companies selected in the present study declined during crisis period butmost of them are regaining their performance level as before .Whereas for some companies itis seen that their pre-crisis period performances are better compared than those in post period.
However, the study is restricted to the application of risk, return and correlation as a measureof equity performance analysis but if certain other advanced econometric tools would havebeen used preferably it would have given a better picture. Other variables that affected shareprices have not been considered in this study.
Notes and References
1. The open price is the price at which the first share was traded for the current tradingday.
2. The final price at which a security is traded on a given trading day. The closing pricerepresents the most up-to-date valuation of a security until trading commences againon the next trading day.
3. Weighted price is obtained by dividing total value of the shares by the number ofshares traded/exchanged
ReferencesBooks:l Gupta, K.R.(2009). Global Financial Crisis (Volume-I). New Delhi: Atlantic
Publishers & Distributors (P) Ltd.l Reddy, Y.V.(2009). India and the Global Financial Crisis Managing Money and
Finance. New Delhi: Orient Blackswan Private Limited.l Saini, Nitu. & Varshney, Indu.(2011). Financial crisis and its impact on Indian
Economy (pp.69-71). New Delhi: Kunal Books Publicationsl S, Asokkumar.(2010). Global Recession and Indian Economic Development. New
Delhi, India:New Century Publications.l S, Asokkumar.(2010).Global Financial Crisis and the Indian Economy. New Delhi,
India: New Century Publications.l Sethi, Nandita., & Bala Krishna,A.V.(2010). Global Meltdown Regional Impact.
New Delhi: New Century Publications

Sana, Mukherjee & Raychaudhuri
[ 115 ]Vidyasagar University Journal of Commerce
l Vijayakumar, A.(2010).Global Financial Crisis and Indian Economy. New Delhi:New Century Publications.
Journal Articles:l A, Prasad., & Reddy, C. Panduranga.(2009), “Global Financial Crisis and Its Impact
on India”, Soc Sci, 21(1), 1-5.l Bhanumurthy, N.R. (2009), “Impact of Global Economic Crisis on the Indian
Economy”, China Report, Retrieved from http://chr.sagepub.com/content/45/2/163.l Bhanumurthy, N.R., & Kumawat, Lokendra.(2009), “Global Economic Crisis and
Indian Economy”, Review of Market Integration. Retrieved fromhttp://rmi.sagepub.com/content/1/2/123.
l Dattels, Peter., an & Miyajima. Ken.(2009), “Will Emerging Markets RemainResilient to Global Stress?”,Global Journal of Emerging Market Economies.Retrieved from http://eme.sagepub.com/content/1/1/5.
l Joseph, Mathew. (2009), “Global Crisis: India’s Response”, Review of MarketIntegration, 199-202. Retrieved from http://rmi.sagepub.com/content/1/2/199.
l Roy Chowdhury ,Sahana.(2011), “Impact of Global Crisis on Small and MediumEnterprises”, Global Business Review, 377-379.Retrieved from http://gbr.sagepub.com/content/12/3/377.
l Sen Gupta, Abhijit.(2009), “India’s Tryst with the Global financial Crisis”. Review ofMarket Integration, 171, Retrieved from http://rmi.sagepub.com/content/1/2/171.
l Srinivasa, Rao, Gangadharan., & C,A, Yoonus, “Global Financial Crisis and StockMarket Integration”, Asia-Pacific Journal of Management Research andInnovation, Retrieved from http://abr.sagepub.com/content/8/2/101.
l T, Muthukumaran.,A,Senthamil, Raja., & P,Palanichamy. (2011), “Impact of GlobalFinancial Crisis on Indian Stock Market – An Analytical Study”, Asia Pacific BusinessReview, 5-7, Retrieved from http://abr.sagepub.com/content/7/2/5.
l Walia ,Suraj.(2012), “Impact of Global Economic Crisis on Indian Economy: AnAnalysis”, International Journal of Latest Trends in Engineering and Technology,Vol.1, Issue 2, 31.
Websites Consultedl http://www.google.co.inl http://www.bseindia.coml http://www.nseindia.coml http://www.sebi.gov.inl http://www.sagepub.coml http://www.rbi.org.inl http://www.enwikipedia.org

Related Documents