Connect with Vanguard > vanguard.com • Equities not domiciled in the United States accounted for 51% of the global equity market as of December 31, 2013, 1 reflecting a significant opportunity for portfolio diversification. • Despite the size of non-U.S. markets, U.S. mutual fund investors held, on average, only 27% of their total equity allocation in non-U.S.-domiciled funds as of year-end 2013, according to Morningstar. • This paper concludes that although no one answer fits all investors, empirical and practical considerations suggest a reasonable starting allocation to non-U.S. stocks of 20%, with an upper limit based on global market capitalization, subject to the investor’s perspective on the short- and long-term trade-offs. Vanguard research February 2014 Note: This paper is an update of a paper by the same author published in 2012 and titled Considerations for investing in non-U.S. equities. 1 Sources: Thomson Reuters Datastream and MSCI, as of December 31, 2013. Global equities: Balancing home bias and diversification Author Christopher B. Philips, CFA

Welcome message from author
This document is posted to help you gain knowledge. Please leave a comment to let me know what you think about it! Share it to your friends and learn new things together.
Transcript

Connect with Vanguard > vanguard.com
• EquitiesnotdomiciledintheUnitedStatesaccountedfor51%oftheglobalequitymarketasofDecember31,2013,1reflectingasignificantopportunityforportfoliodiversification.
• Despitethesizeofnon-U.S.markets,U.S.mutualfundinvestorsheld,onaverage,only27%oftheirtotalequityallocationinnon-U.S.-domiciledfundsasofyear-end2013,accordingtoMorningstar.
• Thispaperconcludesthatalthoughnooneanswerfitsallinvestors,empiricalandpracticalconsiderationssuggestareasonablestartingallocationtonon-U.S.stocksof20%,withanupperlimitbasedonglobalmarketcapitalization,subjecttotheinvestor’sperspectiveon theshort-andlong-termtrade-offs.
Vanguard research February 2014
Note: This paper is an update of a paper by the same author published in 2012 and titled Considerations for investing in non-U.S. equities.
1 Sources: Thomson Reuters Datastream and MSCI, as of December 31, 2013.
Globalequities:Balancinghomebiasanddiversification
Author
Christopher B. Philips, CFA

2
AsofDecember31,2013,U.S.equitiesaccountedfor49%oftheglobalequitymarket.Non-U.S.equities,includingthoseofdevelopedcountriessuchasGermany,Japan,andtheUnitedKingdom,plusthoseofemergingcountriessuchasBrazil,India,andChina,accountedfortheremaining51%.AsshowninFigure 1,the2013U.S.marketcapitalizationwasbelowtherecenthighof55%oftheglobalequitymarket,reachedinMarch2003,butremainedsignificantlyabovetheall-timelowof29%,reachedatthepeakoftheJapanesestockmarketruninthelate1980s.AportfolioinvestingsolelywithintheU.S.stockmarketthusautomaticallyexcludesoverone-halfoftheglobalopportunityset.
The case for investing in non-U.S. stocks
Beyondtheopportunitytoinvestacrossabroadermarket,non-U.S.equitieshavediversifiedthe returnsofU.S.equities,onaverage,acrosstime.Therationalefordiversificationisclear—U.S.stocksareexposedtoU.S.economicandmarketforces,whilestocksdomiciledoutsideoftheUnitedStatesofferexposuretoawiderarrayofeconomicand
marketforces.Thesedifferingeconomiesandmarketsproducereturnsthatcanvaryfromthose ofU.S.stocks.Figure 2a,onpage4,showsthat, allelsebeingequal,aU.S.investorshouldrealize adiversificationbenefitfrominvestinggloballybecausetheequitymarketsofotherdevelopedeconomiesareless-than-perfectlycorrelatedwith theU.S.equitymarket.
Atahighlevel,thebenefitofglobaldiversificationcanbeshownbycomparingthevolatilityofaglobalindexwiththatofindexesfocusedoneithertheU.S.marketornon-U.S.marketsinisolation.InFigure 2b,onpage4,thebenefitofdiversificationisclear:AlthougheachindividualcountryhasexperiencedgreatervolatilitythanthatoftheUnitedStates,thebroadMSCIWorldIndexexUSA,whichfocusesondevelopedmarkets,hasexperiencedvolatilitymoresimilartothatoftheUnitedStates.Andwhentakenonestepfurther,thebroadestglobalindex—representingthecombinedMSCIUSAIndex,thedevelopedmarketsindex,andtheMSCIEmergingMarketsIndex—hasrealizedthelowestaveragevolatility.
Notesonrisk:Allinvestmentsaresubjecttorisk,includingpossiblelossofprincipal.Diversificationdoesnotensureaprofitorprotectagainstalossinadecliningmarket.Investmentsinsecuritiesissuedby non-U.S.companiesaresubjecttorisksincludingcountry/regionalriskandcurrencyrisk.Theserisksareespeciallyhighinemergingmarkets.
Past performance is not a guarantee of future results. The performance of an index is not an exact representation of any particular investment, as you cannot invest directly in an index.

3
Figure 1. Historical mix of global equity market capitalization
Notes: U.S. market represented by MSCI USA Index; non-U.S. market represented by MSCI World Index ex USA from 1969 through 1987 and MSCI All Country World Index ex USA thereafter. Data as of December 31, 2013.
Sources: Thomson Reuters Datastream and MSCI.
Mar
ket
capi
taliz
atio
n
0
20
40
60
80
100%
U.S. market
Non-U.S. market
1969 1973 1977 1981 1985 1989 1993 1997 2001 2005 2009 2013
Can multinational corporations provide enough exposure?
Onecommonquestionregardingexposureto non-U.S.stocksiswhetherenoughcoverage offoreignmarketsisembeddedintheprices ofU.S.-domiciledmultinationalcompaniessuch asMcDonald’s,Amazon.com,orExxonMobil. Thethinkinggoesthatbecausemanylargefirmsgenerateasignificantportionoftheirrevenuefromforeignoperations,thediversificationbenefitsofglobalinvestingarealreadyreflectedinthepricesandperformanceoflargeU.S.firms.
Whilethisaspectofglobalizationcannotbeignored(andcertainlycanhaveanimpactoninvestors’portfolios),webelieveitstillmakessenseforinvestorstoholdnon-U.S.-domiciledinvestments,forseveralreasons.First,simplyfocusingonU.S.-domiciledcompaniesmeansan
investorhasnostakeinleading,globalcompaniesthataredomiciledinothercountriessuchasSamsung,Toyota,orNestlé.Second,manyfirmsseektohedgeawaycurrencyfluctuationsoftheirforeignoperations.Althoughthiscanhelptosmoothrevenuestreams,foreignexchange canbeadiversifierforU.S.investors.Lastly,aportfoliomadeupsolelyofU.S.firms,whicharemoreconcentratedinbiotechnology,computerequipment,informationtechnologyandITservices,andsoftware,wouldbeunderweightedin“oldworld”industriessuchaselectricalequipment,durablehouseholdgoods,andautomobiles.Inotherwords,anall-U.S.portfoliowouldlosenotjustinvestmentopportunitiesbutalsothediversificationbenefitsofaportfoliothat’smoreevenlydistributedacrossindustries.

4
Given global exposure, how much?
Thedecisiontoinvestgloballyisonlythefirst step.Thenextstepistodetermineanappropriateallocation.Thestandardfinancial-theoryapproach,whetherforallocatinggloballyorwithinaspecificcountryormarket,istoinvestproportionallyaccordingtomarketcapitalization.Thismethodassumesthatmarketsarereasonablyefficientandthatstockpricesreflectalltheavailableinformation,investmentpositions,andexpectationsoftheinvestingcommunity.AsshowninFigure1,U.S.equitiescurrentlymakeupapproximately49%of theglobalmarket.Accordingtothistheory,then,U.S.investorswouldcurrentlyhave51%oftheirequityportfolioinnon-U.S.equities,andthisweightwouldfluctuatewithmarketperformance.However,fewinvestorsfollowthisapproachtotheletter;instead,theymoreoftenchooseasetallocation andthenperiodicallyrebalancetothatlevel.
Formanyinvestorssuchanapproachrepresents areasonabletrade-offbetweentheopportunity fordiversificationandtherealitiesoftheglobalequitymarkets.Forexample,despiteincreasingefficiencies,globalmarketsarenotyetfullyandseamlesslyintegrated.Thefactremainsthat costssuchasexpenseratios,bid-askspreads,frictionalcosts,andevenmarket-impactcostscontinuetobehigherformarketsoutside oftheUnitedStates.
Inaddition,localinvestorsacrosstheworld (includingintheUnitedStates)areinfluencedbyembeddedhomebiases,probablyaresultboth ofregulatoryconstraints,suchasexplicitlimitsonpublicpensionfunds’allocations,andbehavioraltendencies.Forexample,accordingtoPhilips,Kinniry,andDonaldson(2012),U.S.investorsmaintainedanallocationtoU.S.stocksthat wasapproximately1.7xthemarketcapof
Figure 2.
a. Correlations of returns in foreign equity markets with U.S. equity markets
Correlations and volatility of equity returns of countries and regions
Notes: Country returns represented by MSCI country indexes; emerging markets represented by MSCI Emerging Markets Index; developed markets represented by MSCI World Index ex USA; global market, including both developed and emerging markets, represented by MSCI All Country World Index. Emerging market data begin in 1988; all data through December 31, 2013.
Sources: Vanguard, Thomson Reuters Datastream, and MSCI.
b. Volatility of returns for country and regional indexes
Cor
rela
tion
coef
ficie
nt
0
0.2
0.4
0.6
0.8
1
Aus
tral
iaA
ustr
iaB
elgi
umC
anad
aD
enm
ark
Fran
ceG
erm
any
Ital
yJa
pan
Net
herla
nds
Nor
way
Spa
inSw
eden
Switz
erla
ndU
.K.
Em
ergi
ng m
arke
ts
Ave
rage
Hon
g Ko
ng
Uni
ted
Sta
tes
Aus
tral
iaA
ustr
iaB
elgi
umC
anad
aD
enm
ark
Fran
ce
Ital
yH
ong
Kong
Japa
nN
ethe
rland
sN
orw
ayS
pain
Em
ergi
ng m
arke
tsD
evel
oped
mar
kets
Swed
enSw
itzer
land
U.K
.
Glo
bal
mar
ket
Ger
man
y
0
10
20
30
40%
Ann
ualiz
ed s
tand
ard
devi
atio
n
5
U.S.stocks,whilethenext-closestinvestorsintermsofbiastohomemarketcapwerethoseintheUnitedKingdom,whomaintainedarelativehomebiasofabout6.25xthemarketcapofU.K.stocks.Whatevertheunderlyingdriver,thelocalhomebiasesofinvestorsineachcountryaggregatetoformaglobalmarketthatisnotfullyrepresentativeofthetheoreticalfree-floatinginvestorexperience,whichwouldbetheobjectiveofafullymarket-proportionalportfolio.Asaresult,acasecouldbemadeforadedicatedallocationtonon-U.S.stocksthatdiffersfromtheglobalmarket-weightedportfoliosimplybasedonawarenessoflocalandglobalbiases(whetherjustifiedornot).
Historical minimum-variance analysis
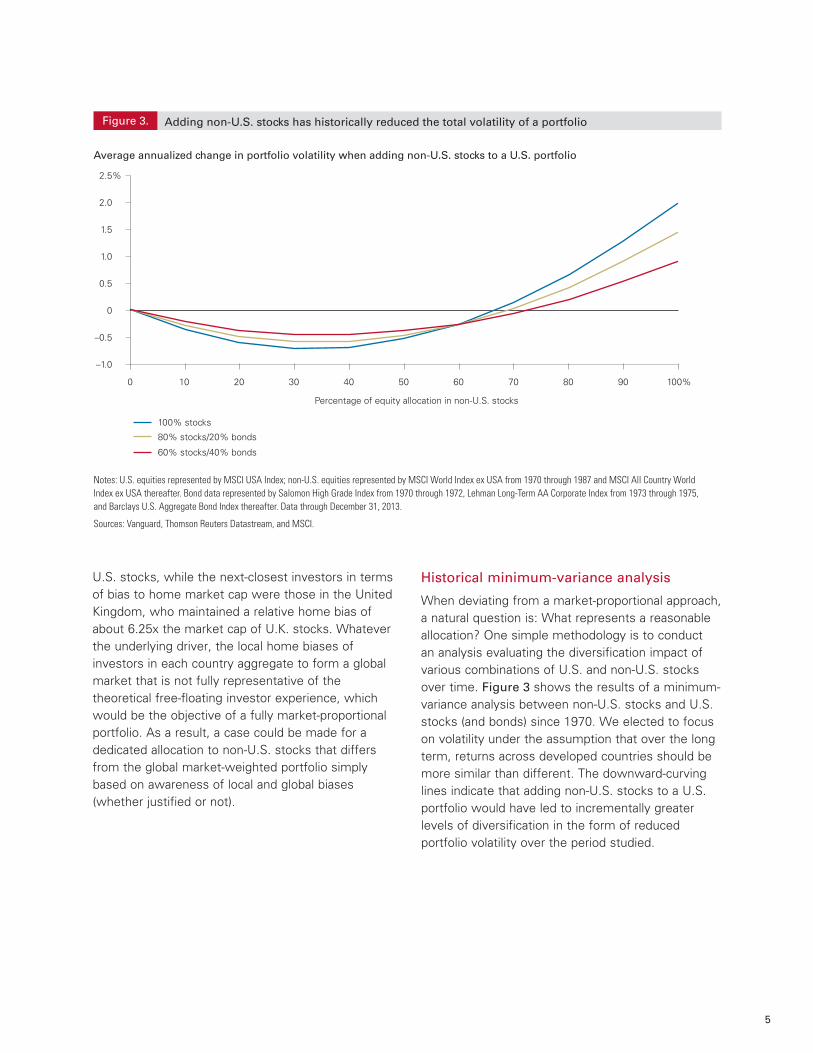
Whendeviatingfromamarket-proportionalapproach,anaturalquestionis:Whatrepresentsareasonableallocation?Onesimplemethodologyistoconduct ananalysisevaluatingthediversificationimpactofvariouscombinationsofU.S.andnon-U.S.stocksovertime.Figure 3showstheresultsofaminimum-varianceanalysisbetweennon-U.S.stocksandU.S.stocks(andbonds)since1970.Weelectedtofocusonvolatilityundertheassumptionthatoverthelongterm,returnsacrossdevelopedcountriesshouldbemoresimilarthandifferent.Thedownward-curvinglinesindicatethataddingnon-U.S.stockstoaU.S.portfoliowouldhaveledtoincrementallygreaterlevelsofdiversificationintheformofreducedportfoliovolatilityovertheperiodstudied.
Figure 3.
Average annualized change in portfolio volatility when adding non-U.S. stocks to a U.S. portfolio
Adding non-U.S. stocks has historically reduced the total volatility of a portfolio
Notes: U.S. equities represented by MSCI USA Index; non-U.S. equities represented by MSCI World Index ex USA from 1970 through 1987 and MSCI All Country WorldIndex ex USA thereafter. Bond data represented by Salomon High Grade Index from 1970 through 1972, Lehman Long-Term AA Corporate Index from 1973 through 1975, and Barclays U.S. Aggregate Bond Index thereafter. Data through December 31, 2013.
Sources: Vanguard, Thomson Reuters Datastream, and MSCI.
100% stocks
80% stocks/20% bonds
60% stocks/40% bonds
0 10 30 40 50 60 8070 90 100%20
Percentage of equity allocation in non-U.S. stocks
–1.0
–0.5
0
0.5
1.0
1.5
2.0
2.5%

6
What’sstrikingaboutFigure3isthatU.S.investorswouldhaveobtainedsubstantial(relative)diversi-ficationbenefitsfromallocationstonon-U.S.stocksfarshortofthecurrentmarket-proportionalportfolio(nowabout51%andhistoricallyapproximately50%,onaverage).Infact,whenreferringbacktoFigure2,thenetimpactofafullygloballymarket-proportionalportfolioacrosshistoryhasbeenapproximately35basispointsinlowerannualvolatilityrelativetoa100%U.S.equityportfolio(representedinFigure3bythex-axis)—thesameimpactasa10%staticallocationtonon-U.S.stocks.Lookingattheblue lineinFigure3,whichrepresentsaportfoliocomposedentirelyofequities,themaximumhistoricaldiversificationbenefitwouldhavebeenachievedbyallocatingapproximately30%ofanequityportfoliotonon-U.S.equities(althoughthedifferencebetween30%non-U.S.and40%non-U.S.iswithin0.02%),withanetreductioninvolatilityof71basispoints.Allocating20%ofanequityportfoliotonon-U.S.stockswouldhavecaptured60ofthose71basispoints,orabout85%ofthemaximumpossiblebenefit.Forinvestorsinterestedindeviatingfromtheglobalmarketcap,it’shelpfultounderstandthathistoricallyithasbeenpossibletoobtainsimilardiversificationbenefitswhilemitigatingtheimpact ofhighercostsandsomeofthebehavioralhurdlesoflargerglobalallocations.
Althoughsuchoptimizationcanserveasareferencepoint,asignificantweaknessofthisanalysisisthat itisbackward-lookingandparticularlydependentonthetimeperiodexamined.Forexample,atdifferentobservationdates,the“optimal”allocationtonon-U.Sstockshasbeenaslowas20%orashighas70%.Asrecentlyasyear-end2005,thebottomofthe“U”patterninFigure3fellbetween40%and50%;throughbothyear-end2008andyear-end2013,however,thecurveclearlybottomedoutbetween30%and40%.Andevenmorerecentlyovershortertimeperiods,wehaveseennon-U.S.stocksfailtoreducethevolatilityofaportfolioat anyallocation.Further,whenevaluatingportfoliosdiversifiedacrossmultipleassetclasses,theresults
mayalsochange.Forexample,theminimum-volatilityportfolioinFigure3,givena40%allocationtobonds,hasdifferedfromanequity-onlyallocation.Thisisthereasonwedonotfocussolelyonsuchoptimizationtechniquestoformportfolios,butinsteadcombineanevaluationoftheinvestmenttrade-offswithfactorssuchascostandbehavioralrealities.
Qualitative considerations
Real-worldconsiderationsmayfurthersupport alowerallocationtonon-U.S.equitiesthanthatrecommendedbymarketproportions.Broadly, suchconsiderationsinvolvebarrierstoinvestment,suchaslimitationsontherepatriationofinvestmentincomeandhighertransactionandfrictioncosts (forinstance,commissions,opportunitycosts, andmarket-impactcosts).
Althoughbarrierstocross-borderinvestment havebeenfallingovertime,transactionandinvestmentcostsgenerallyremainproportionallyhigherinforeignmarketsthanintheUnitedStates.Thisisprimarilyaresultofliquiditydifferencesandrelativelylowermarketparticipation.Forexample,bid-askspreadstendtobewider,andmanagementfeesandfrictioncoststendtobehigher,for foreignmarkets.
Finally,ourempiricalanalysisreliesonmonthlyreturndatafordevelopedmarketsthatextendbacktoonly1970anddataforemergingmarketsthatextendto1985.Alongertimeseriesofreturns, ifitexisted,mightprovidemorerobustempiricalresultsbecauseitwouldspanmorefinancial,economic,andpoliticalcycles.However,investorsmightalsoconsidermorerecentexperiencestobemorerepresentativeofthefutureasglobalmarketsbecomemoreintegratedandinformationflowsmoreseamlessly.Wediscusstheimplicationsofsuchaviewinthenextseveralsections.

7
Ever-changing impact of global diversification
AlthoughFigure3showstheimpactofdiversificationovertheentire1970–2013period,fewinvestorsactuallyrealizesuchanextendedtimehorizonwithoutmakingchangestotheirportfolios.Therefore,itmakessensetoevaluatethediversificationimpact ofcombiningU.S.andnon-U.S.equitiesovershortertimewindows.Figure 4showstheproportionofthemaximumpossiblediversificationbenefitachieved atvariousallocationstonon-U.S.stocksoverrollingten-yearwindows.Forexample,overthetenyearsendedDecember1979,a10%allocationtonon-U.S.equitieswouldhaveprovided39%ofthemaximumpossiblediversificationbenefit.A30%allocationtointernationalequitieswouldhaveprovided90%ofthemaximumdiversificationbenefit.
However,it’simportanttonotehowtheimpactofdiversificationcanchangeovertimeasthereturns,volatilities,andcorrelationsbetweenU.S.andnon-
U.S.stockschange.Forexample, Figure4showsthatduringseveralperiods,oneormoreofthelinesbumpupagainstthetopofthechart—atthe100%limit.Overtheseperiods,investorswouldhave beenbetteroffholdingalowerallocationtonon-U.S.stocks(assumingloweraveragevolatilitywastheirprimarymotivationforholdingnon-U.S.equities). Forinstance,forthetenyearsendedDecember31,1997,a20%allocationwouldhaveprovidedthemaximumdiversificationbenefit,meaningthoseinvestorswhoheldallocationsgreaterthan20%wouldhavefoundthemselvesonthebacksideof theUpatterninFigure3—withastillloweraveragevolatilitythanaportfolioof100%U.S.equities,butwithgreatervolatilitythanthatofaportfoliowitha20%allocationtonon-U.S.equities.Ontheotherhand,a40%allocationwouldhaveprovidedaround90%ofthemaximumvolatilityreductionfortheten-yearperiodsendedintheearly2000s,buta60%allocationwouldhavebeenrequiredtoreapthemaximumvolatilityreduction.
Figure 4.
Proportion of maximum volatility reduction achieved by including non-U.S. stocks
On average, dedicating 30% of equities to non-U.S. stocks has provided most of the maximum possible diversification benefit
Notes: U.S. equities represented by MSCI USA Index; non-U.S. equities represented by MSCI World Index ex USA from 1970 through 1987 and MSCI All Country World Index ex USA thereafter. Data through December 31, 2013.
Sources: Vanguard, Thomson Reuters Datastream, and MSCI.
10% international
20% international
30% international
40% international
Tota
l per
cent
age
ofm
axim
um v
olat
ility
red
uctio
n
0
20
40
60
80
100% Since the ten yearsended 10/31/2008, any allocation to non-U.S. stocks has increased average volatility.
1980 1983 1986 1989 1992 1995 1998 2001 2004 2007 20132010
Ten years ended December 31:

2 That said, international equity correlations should remain less than perfect. Consider, for instance, that several studies (e.g., Stock and Watson, 2003) have found minimal evidence of increased international synchronization of business cycles, despite increases in international trade flows, developed-market integration, and the introduction of the euro.
8
Althoughtherehasbeensignificantdisparityin theincrementalbenefitdeliveredbyallocationstonon-U.S.stocksovertime,Figure4showsthat,onaverage,a20%allocationofadomesticportfoliotonon-U.S.equitieshasprovided70%ofthemaximumdiversificationbenefit.Aninvestorwhoallocated30%tonon-U.S.equitieshasaveraged90%ofthemaximumdiversificationbenefitacrossallperiods.Theseresultsindicatethatinvestorscanbenefitsubstantiallyfromexposuretonon-U.S.equitieswhileremainingsensitivetothepotentiallyhighercostsandrisksofaportfoliowhoseallocationsarebasedonglobalmarketcapitalizationacrossmanydifferenttimeperiods.
Finally,it’simportanttonotethatinrecentperiodsdiversifyingintonon-U.S.stockshasnotreducedvolatilityinanequityportfolio.Weillustratethis ontherightportionofFigure4,whereeventhe 10%allocationlinemergeswiththetopofthe chart.Infact,sincethetenyearsendedOctober31, 2008,investorswouldhaverealizedlowervolatilitybybeinginvestedsolelyinU.S.stocks.Ofcourse,becauseFigure4onlyaccountsforvolatilityimpact,returndifferentialsarenotevaluated,whichisanotherpotentialmotivationfordiversification andsomethingweaddressinalatersection.
Challenges facing investors today
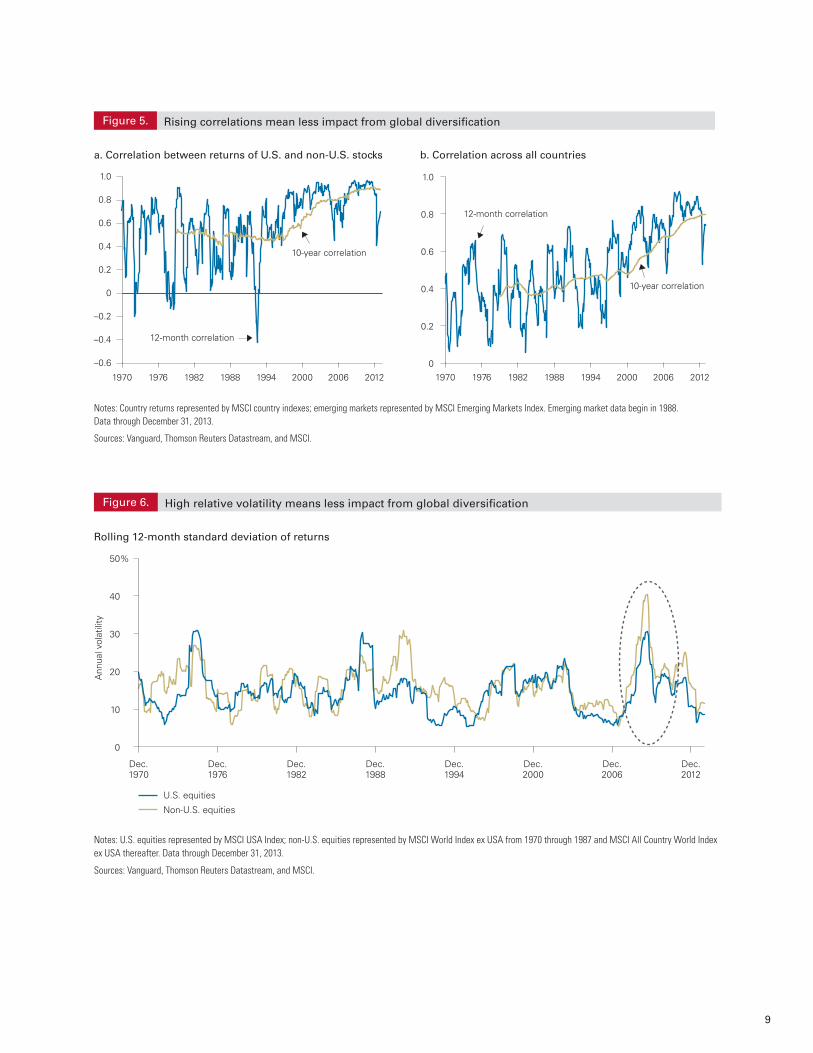
Therearetwoprimarydriversofthisrecentdivergencefromlong-termhistory.Thefirstdriverhasbeenhigheraveragecorrelationsacrossglobalequitymarkets.Figure 5ashowsthatthecorrelationbetweenU.S.andnon-U.S.stockshasincreasedovertime,andnotablysosincethemid-1990s.Infact,althoughlonger-termcorrelationswerestablethroughthe1980sandearly1990s,recentyearshaveshownasignificantrise.Onefactorfortheincreasedcorrelationhasbeenthesteadydecline intheimportanceofthePacificregionsince1989.Historically,EuropeanmarketshavebeenmorecloselycorrelatedtoU.S.marketsthanPacificmarketshavebeentoU.S.markets.Inother words,Pacificmarkets,andespeciallyJapan,
havehistoricallybeenasignificantsourceofdiversificationforglobalportfolios.But,sincethe1980s,Europe’smarketcapitalizationhasdoubled, attheexpenseofthePacificregion.Asaresult, thestrongdiversifyingeffectofthePacificregionhasdiminished.
Inaddition,individualmarketsacrosstheworldhavebecomemoresynchronized.AsshowninFigure 5b,correlationsacrossindividualcountrieshavealsoincreasedsignificantly,fromapproximately0.35inthe1980sto0.77asof2013.Whetherthesetrendswillcontinueisopenfordebate;however,itisnotunreasonabletoanticipatethatthefuturecorrelationbetweennon-U.S.andU.S.equitieswillmorecloselyresemblethatoftherecentpast,ratherthanthe1970sand1980s,particularlygiventhatcorrelationtrendsareslowtoshift.2
Theseconddriverforthereversalindiversificationbenefitswasasignificantspikeinrelativevolatilityfornon-U.S.stockssince2007.Figure 6showsthetrailing12-monthstandarddeviationofreturnsforbothU.S.andnon-U.S.stocks.ItisnotablethatthespikeinvolatilityfromSeptember2007through2011actuallyincreasedthelong-termaveragevolatilityofnon-U.S.marketsbynearlyafullpercentagepoint,from16.47%to17.27%.Thehighervolatility,combinedwithrisingcorrelations,servedtomutetheimpactofagloballydiversifiedportfolio.Itisinterestingthattherehavebeenpriorperiodsinwhichnon-U.S.stockshaveexperiencedsignificantlyhighervolatilitythanU.S.stocks—forexample,1990–91and1972–74.However,thekeydifferenceinthoseperiodswasthatcorrelationsacrossglobalmarketswerelowerthantheyhavebeenrecently.Ofcourse,despiteperiodicspikesinrelativevolatility,moreoftenthannot,U.S.andnon-U.S.stockshaveexperiencedsimilarvolatility.Assuch,wewouldnotexpectthehighrelativevolatilityobservedinrecentperiodstopersistindefinitely. Allelsebeingequal,lowerrelativevolatilityfor non-U.S.stockswouldincreasethediversificationbenefitsofglobalequityallocations.
9
a. Correlation between returns of U.S. and non-U.S. stocks
Figure 5.
b. Correlation across all countries
Rising correlations mean less impact from global diversification
Notes: Country returns represented by MSCI country indexes; emerging markets represented by MSCI Emerging Markets Index. Emerging market data begin in 1988. Data through December 31, 2013.
Sources: Vanguard, Thomson Reuters Datastream, and MSCI.
–0.6
–0.4
–0.2
0
0.2
0.4
0.6
0.8
1.0
1970 1976 1982 1988 1994 2000 2006 2012
12-month correlation
10-year correlation
0
0.2
0.4
0.6
0.8
1.0
1970 1976 1982 1988 1994 2000 2006 2012
12-month correlation
10-year correlation
12-month correlation
10-year correlation
12-month correlation
10-year correlation
Figure 6.
Rolling 12-month standard deviation of returns
High relative volatility means less impact from global diversi�cation
Notes: U.S. equities represented by MSCI USA Index; non-U.S. equities represented by MSCI World Index ex USA from 1970 through 1987 and MSCI All Country World Index ex USA thereafter. Data through December 31, 2013.
Sources: Vanguard, Thomson Reuters Datastream, and MSCI.
0
10
20
30
40
50%
Ann
ual v
olat
ility
U.S. equities
Non-U.S. equities
Dec.1970
Dec.1976
Dec.1988
Dec.1994
Dec.2000
Dec.2006
Dec.2012
Dec.1982
10
Correlations and volatility: Scenario analysis
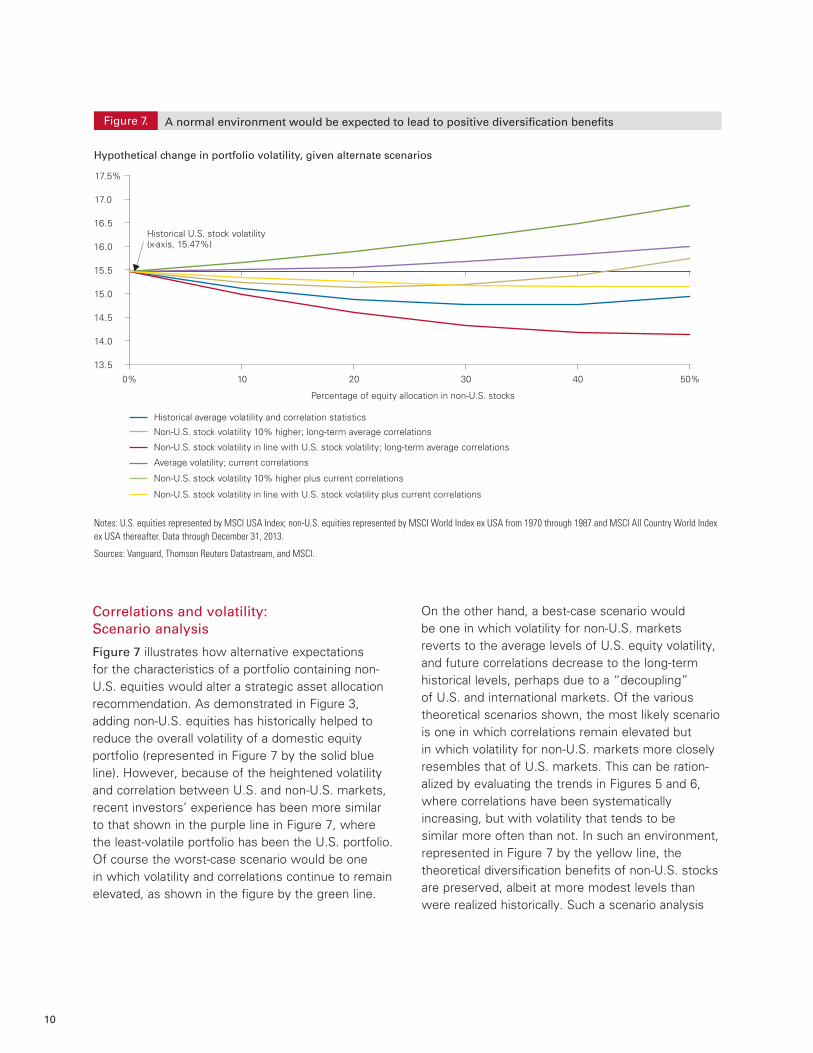
Figure 7illustrateshowalternativeexpectations forthecharacteristicsofaportfoliocontainingnon-U.S.equitieswouldalterastrategicassetallocationrecommendation.AsdemonstratedinFigure3,addingnon-U.S.equitieshashistoricallyhelpedtoreducetheoverallvolatilityofadomesticequityportfolio(representedinFigure7bythesolidblueline).However,becauseoftheheightenedvolatilityandcorrelationbetweenU.S.andnon-U.S.markets,recentinvestors’experiencehasbeenmoresimilartothatshowninthepurplelineinFigure7,wheretheleast-volatileportfoliohasbeentheU.S.portfolio.Ofcoursetheworst-casescenariowouldbeone inwhichvolatilityandcorrelationscontinuetoremainelevated,asshowninthefigurebythegreenline.
Ontheotherhand,abest-casescenariowould beoneinwhichvolatilityfornon-U.S.marketsrevertstotheaveragelevelsofU.S.equityvolatility,andfuturecorrelationsdecreasetothelong-termhistoricallevels,perhapsduetoa“decoupling” ofU.S.andinternationalmarkets.Ofthevarioustheoreticalscenariosshown,themostlikelyscenarioisoneinwhichcorrelationsremainelevatedbut inwhichvolatilityfornon-U.S.marketsmorecloselyresemblesthatofU.S.markets.Thiscanberation-alizedbyevaluatingthetrendsinFigures5and6,wherecorrelationshavebeensystematicallyincreasing,butwithvolatilitythattendstobe similarmoreoftenthannot.Insuchanenvironment,representedinFigure7bytheyellowline,thetheoreticaldiversificationbenefitsofnon-U.S.stocksarepreserved,albeitatmoremodestlevelsthanwererealizedhistorically.Suchascenarioanalysis
Figure 7.
Hypothetical change in portfolio volatility, given alternate scenarios
A normal environment would be expected to lead to positive diversification benefits
Notes: U.S. equities represented by MSCI USA Index; non-U.S. equities represented by MSCI World Index ex USA from 1970 through 1987 and MSCI All Country World Index ex USA thereafter. Data through December 31, 2013.
Sources: Vanguard, Thomson Reuters Datastream, and MSCI.
13.5
14.0
14.5
15.0
15.5
16.0
16.5
17.0
17.5%
0% 10 20 30 40 50%
Percentage of equity allocation in non-U.S. stocks
Historical average volatility and correlation statistics
Non-U.S. stock volatility 10% higher; long-term average correlations
Non-U.S. stock volatility in line with U.S. stock volatility; long-term average correlations
Average volatility; current correlations
Non-U.S. stock volatility 10% higher plus current correlations
Non-U.S. stock volatility in line with U.S. stock volatility plus current correlations
Historical U.S. stock volatility(x-axis, 15.47%)
11
canhelpinvestorsquantifyfutureexpectations andassessthepotentialimpactthatarangeofallocationstointernationalequitieswouldhave ontheirportfolios.Foradditionalperspectiveoncorrelationsduringrecessions,seeDavisand Aliaga-Díaz(2009).
Diversification of return opportunities
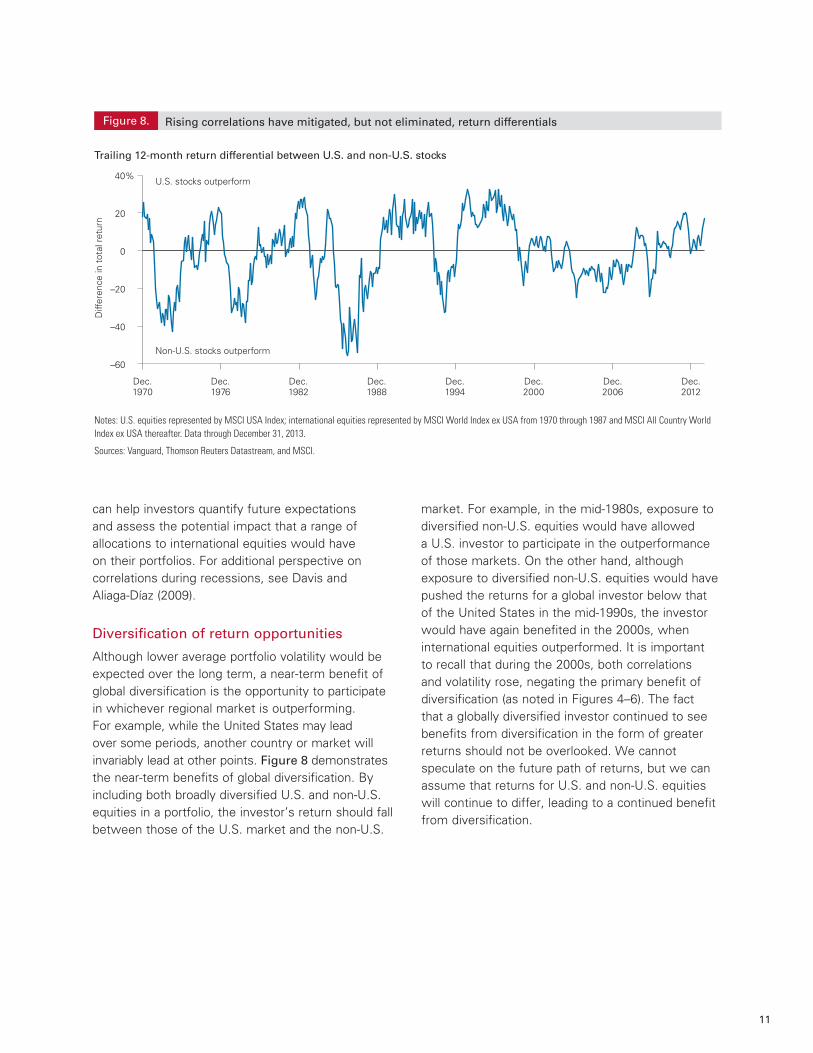
Althoughloweraverageportfoliovolatilitywouldbeexpectedoverthelongterm,anear-termbenefitofglobaldiversificationistheopportunitytoparticipateinwhicheverregionalmarketisoutperforming. Forexample,whiletheUnitedStatesmaylead oversomeperiods,anothercountryormarketwillinvariablyleadatotherpoints.Figure 8 demonstratesthenear-termbenefitsofglobaldiversification.ByincludingbothbroadlydiversifiedU.S.andnon-U.S.equitiesinaportfolio,theinvestor’sreturnshouldfallbetweenthoseoftheU.S.marketandthenon-U.S.
market.Forexample,inthemid-1980s,exposuretodiversifiednon-U.S.equitieswouldhaveallowed aU.S.investortoparticipateintheoutperformanceofthosemarkets.Ontheotherhand,althoughexposuretodiversifiednon-U.S.equitieswouldhavepushedthereturnsforaglobalinvestorbelowthatoftheUnitedStatesinthemid-1990s,theinvestorwouldhaveagainbenefitedinthe2000s,wheninternationalequitiesoutperformed.Itisimportant torecallthatduringthe2000s,bothcorrelations andvolatilityrose,negatingtheprimarybenefitofdiversification(asnotedinFigures4–6).Thefact thatagloballydiversifiedinvestorcontinuedtoseebenefitsfromdiversificationintheformofgreaterreturnsshouldnotbeoverlooked.Wecannotspeculateonthefuturepathofreturns,butwecanassumethatreturnsforU.S.andnon-U.S.equitieswillcontinuetodiffer,leadingtoacontinuedbenefitfromdiversification.
Figure 8.
Trailing 12-month return differential between U.S. and non-U.S. stocks
Rising correlations have mitigated, but not eliminated, return differentials
Notes: U.S. equities represented by MSCI USA Index; international equities represented by MSCI World Index ex USA from 1970 through 1987 and MSCI All Country World Index ex USA thereafter. Data through December 31, 2013.
Sources: Vanguard, Thomson Reuters Datastream, and MSCI.
Diff
eren
ce in
tot
al r
etur
n
–60
–40
–20
0
20
40% U.S. stocks outperform
Non-U.S. stocks outperform
Dec.1970
Dec.1976
Dec.1988
Dec.1994
Dec.2000
Dec.2006
Dec.2012
Dec.1982

12
Impact of currency exposure
Investmentsinforeignmarketsareexposedtofluctuationsinforeignexchangerates.Figure 9 illustratesthatcurrencyfluctuationshaveperiodicallyaddedtoorsubtractedfromthereturnforU.S.investorsofinternationalinvestments.Forexample,currencymovementssubtracted17%fromthe12-monthreturnsofinternationalstocksin1984 andthenadded35%in1986.3
Althoughcurrencymovementstendtobeunpredictableandcanbelarge,theyhavehistoricallybeenuncorrelatedtomovementsinstockprices.4 Asaresult,overtime,currencymovementshavehelpedtoreducethecorrelationbetweennon-U.S.
equitiesandU.S.equities,thuscontributingto thediversificationbenefitsofforeignholdings. Forexample,since1970,thecorrelationofforeignstocksdenominatedintheirlocalcurrencyto U.S.stockswas0.71,higherthanthecorrelation offoreignstocksdenominatedinU.S.dollarsto U.S.stocks(0.64).However,currencymovementsalsoincreasedthevolatilityofnon-U.S.equitiesbyapproximately2.7percentagepointsfrom1970through2013(from14.6%to17.3%).Allelsebeingequal,wewouldexpectcurrencytocontinueto beadiversifierfornon-U.S.investmentsfrom thestandpointthatcurrencymovementsdirectlyinfluencethereturndifferentialsshowninFigure8,alongwiththecorrelationpropertiesamongcountries.
3 The theory of purchasing-power parity states that real returns will be the same across countries, as exchange-rate movements and inflation differentials should be identical. Interest rate parity is based on the notion that the interest rate differential between the home and foreign markets will determine the change in the exchange rate. There is considerable empirical support for these theories in the long run, but substantial research documents significant departures from a currency’s “fair value” in the short run.
4 Of course, although this statement is generally true, there are cases in which commodity-based economies such as those of Australia and Canada have had a positive correlation with foreign stock prices—see, for example, LaBarge (2010).
Figure 9.
Annualized contribution of U.S. dollar to non-U.S. equity returns
Exposure to currency can further affect return differentials
Cur
renc
y re
turn
Notes: Contribution of the U.S. dollar calculated by subtracting the returns of non-U.S. stocks denominated in local currency from the returns of non-U.S. stocks denominated in U.S. dollars. Non-U.S. equities represented by MSCI World Index ex USA from 1970 through 1987 and MSCI All Country World Index ex USA thereafter. Data through December 31, 2013.
Sources: Vanguard, Thomson Reuters Datastream, and MSCI.
–20
–10
0
10
20
30
40%
Dec.1970
Dec.1976
Dec.1988
Dec.1994
Dec.2000
Dec.2006
Dec.2012
Dec.1982

13
Role of emerging markets
Emergingmarketsareeconomiesormarketsthatarejustenteringtheglobalarenaordonotmeetcriteriatobeconsidereddevelopedeconomies. Forexample,theWorldBankclassifiesemergingmarketsaseconomiesbelowtheupper-middle-incomethreshold.5MSCI,FTSE,andotherbenchmarkprovidersmayconsideradditional criteriasuchasthematurityoffinancialmarkets, thestructureoftransactionsettlement,andthefreedomofcapital,amongothers.Manycountries(amongthebetter-knownonesareChina,India,Brazil,andRussia)maymeetoneormoreofthesecriteriabutnotall.Thosethatsuccessfullydevelopeconomically,politically,andfinancially(suchastheUnitedStatesfromthe1800sthroughthe1900s)wouldbeexpectedtoenjoystronglong-termreturns.However,thosethatdonotdevelopmayseetheirfinancialmarketslanguish.
Becauseofhighlyspecializedpolitical,economic, andfinancialrisks,investinginindividualemerging-marketcountriescanbeextremelyrisky.However,becauseindividualemergingmarketsarerelativelyuncorrelatedamongeachother,theriskofinvestingacrossallcountriesismuchless.Inaddition,theuniquedevelopmentpatternsoftheseemergingmarketshelpthemtodiversifythereturnsofdevelopedinternationalmarketsandU.S.markets—correlationsbetweendevelopedmarketsandemergingmarketshaveaveraged0.66since1985.Andemergingmarketshavedeliveredhigheraveragereturns—withcommensuratelyhighervolatility—thanthoseofdevelopedmarkets.From1985through2013,emergingmarketsproduced anaverageannualreturnof12.7%withanaveragevolatilityof24.0%,versusaverageannualreturns fordevelopedmarketsoverthesameperiodof 9.9%withanaveragevolatilityof17.6%.This overallpatternofrelativeperformancemighthavebeenexpected,giventheoverallcharacteristicsof
emergingeconomiesormarkets.Thecombination ofhigherexpectedreturns,higherexpectedvolatility,andmoderatecorrelationsbetweenemerginganddevelopedmarketssuggeststhatamodestallocationtoemergingmarketsiswarranted.Formostinvestors,amarket-weightedallocationviaafund orexchange-tradedfundthatisinvestedacross allnon-U.S.marketsisthebestwaytoincludeemergingmarketsinadiversifiedportfolio.Such anallocationwouldensureconstantinvestmentatthemarketweighting,andwouldhelptoinsulateinvestorsfromemergingmarkets’potentiallysevereswingsinperformance.
Conclusion
Inlightofquantitativeanalysisandqualitativeconsiderations,wehavedemonstratedthat domesticinvestorsshouldconsiderallocating partoftheirportfoliostointernationalsecurities, andthata20%allocationmaybeareasonablestartingpoint.Althoughfinancetheorydictates thatanupperassetallocationlimitshouldbebasedontheglobalmarketcapitalizationforinternationalequities(currentlyapproximately51%),wehavedemonstratedthatinternationalallocationsexceeding40%havenothistoricallyaddedsignificantadditionaldiversificationbenefits,particularlyaccountingforcosts.Formanyinvestors,anallocationbetween20%and40%shouldbeconsideredreasonable,giventhehistoricalbenefitsofdiversification.Allocationscloserto40%maybesuitablefor thoseinvestorsseekingtobeclosertoamarket-proportionalweightingorforthosewhoarehopingtoobtainpotentiallygreaterdiversificationbenefitsandarelessconcernedwiththepotentialrisksandhighercosts.Ontheotherhand,allocationscloser to20%maybeviewedasofferingagreaterbalanceamongthebenefitsofdiversification,therisksofcurrencyvolatilityandhigherU.S.tonon-U.S.stockcorrelations,investorpreferences,andcosts.
5 Countries are ranked by the World Bank each July and divided into four income groups (based on gross national income per capita). The groups are: low income, $1,005 or less; lower middle income, $1,006–$3,975; upper middle income, $3,976–$12,275; and high income, $12,276 or more.
14
References
Davis,JosephH.,andRogerAliaga-Díaz,2009. The Global Recession and International Investing. ValleyForge,Pa.:TheVanguardGroup.
LaBarge,KarinPeterson,2010.Currency Management: Considerations for the Equity Hedging Decision.ValleyForge,Pa.: TheVanguardGroup.
Philips,ChristopherB.,FrancisM.KinniryJr.,andScottJ.Donaldson,2012.The Role of Home Bias in Global Asset Allocation Decisions.ValleyForge,Pa.:TheVanguardGroup.
Stock,JamesH.,andMarkW.Watson,2003.Understanding Changes in International Business Cycle Dynamics.NBERWorkingPaperNo.9859.Cambridge,Mass.:NationalBureauofEconomicResearch.
Vanguard research > Vanguard Center for Retirement Research Vanguard Investment Strategy Group
E-mail > [email protected]
For more information about Vanguard funds, visit vanguard.com, or call 800-662-2739, to obtain a prospectus. Investment objectives, risks, charges, expenses, and other important information about a fund are contained in the prospectus; read and consider it carefully before investing.
CFA® is a trademark owned by CFA Institute.
P.O.Box2600 ValleyForge,PA19482-2600
© 2014 The Vanguard Group, Inc. All rights reserved. Vanguard Marketing Corporation, Distributor.
ISGGEB 022014
Connect with Vanguard® > vanguard.com
Related Documents