www.cnb.cz Global Economic Outlook ——— September 2021 Czech National Bank ——— Global Economic Outlook ——— September 2021

Welcome message from author
This document is posted to help you gain knowledge. Please leave a comment to let me know what you think about it! Share it to your friends and learn new things together.
Transcript

www.cnb.cz
Global Economic Outlook
——— September 2021
Czech
Nation
al B
ank —
——
Glo
bal E
conom
ic O
utlook —
——
Se
pte
mb
er
20
21
Czech National Bank ——— Global Economic Outook ——— September 2021
1
I. Introduction 2
II. Economic outlook in selected territories 3
II.1 Euro area 3 II.2 The euro area in the spotlight – France 4 II.3 United States 5 II.4 United Kingdom 6 II.5 Japan 6 II.6 China 7 II.7 Russia 7 II.8 Poland 8 II.9 Hungary 8 II.10 Argentina 9
III. Leading indicators and outlook of exchange rates 10
IV. Commodity market developments 11
IV.1 Oil 11 IV.2 Other commodities 12
V. Focus… 13
Modelling the impacts of climate change on the global economy: Stagflationary shock looming 13
A. Annexes 23
A1. Change in predictions for 2021 23 A2. Change in predictions for 2022 23 A3. GDP growth and inflation outlooks in the euro area countries 24 A4. GDP growth and inflation in the individual euro area countries 24 A5. GDP growth and inflation in other selected countries 31 A6. List of abbreviations 32
Cut-off date for data17 September 2021
CF survey date13 September 2021
GEO publication date24 September 2021
Notes to chartsECB, Fed, BoE and BoJ: midpoint of the range of forecasts.
Leading indicators are taken from Bloomberg and Refinitiv Datastream.
AuthorsLuboš Komárek Editor-in-chief, I. Introduction
Petr Polák Editor, II.3 United States, II.10 Argentina
Soňa Benecká II.1 Euro area, II.2 France
Michaela Ryšavá II.4 United Kingdom
Martin Kábrt II.5 Japan
Martin Motl II.6 China, V. Focus
Oxana Babecká II.7 Russia
Jaromír Tonner II.8 Poland, II.9 Hungary, V. Focus
Jan Hošek IV.1 Oil, IV.2 Other commodities
Forecasts for EURIBOR and LIBOR rates are based on implied rates from interbank market yield curve (FRA rates are used from 4M to 15M and
adjusted IRS rates for longer horizons). Forecasts for German and US government bond yields (10Y Bund and 10Y Treasury) are taken from CF.
The arrows in the GDP and inflation outlooks indicate the direction of revisions compared to the last GEO. If no arrow is shown, no new forecast is
available. Asterisks indicate first published forecasts for given year. Historical data are taken from CF, with exception of MT and LU, for which they
come from EIU.
I. —— Introduction
Czech National Bank ——— Global Economic Outook ——— September 2021
2
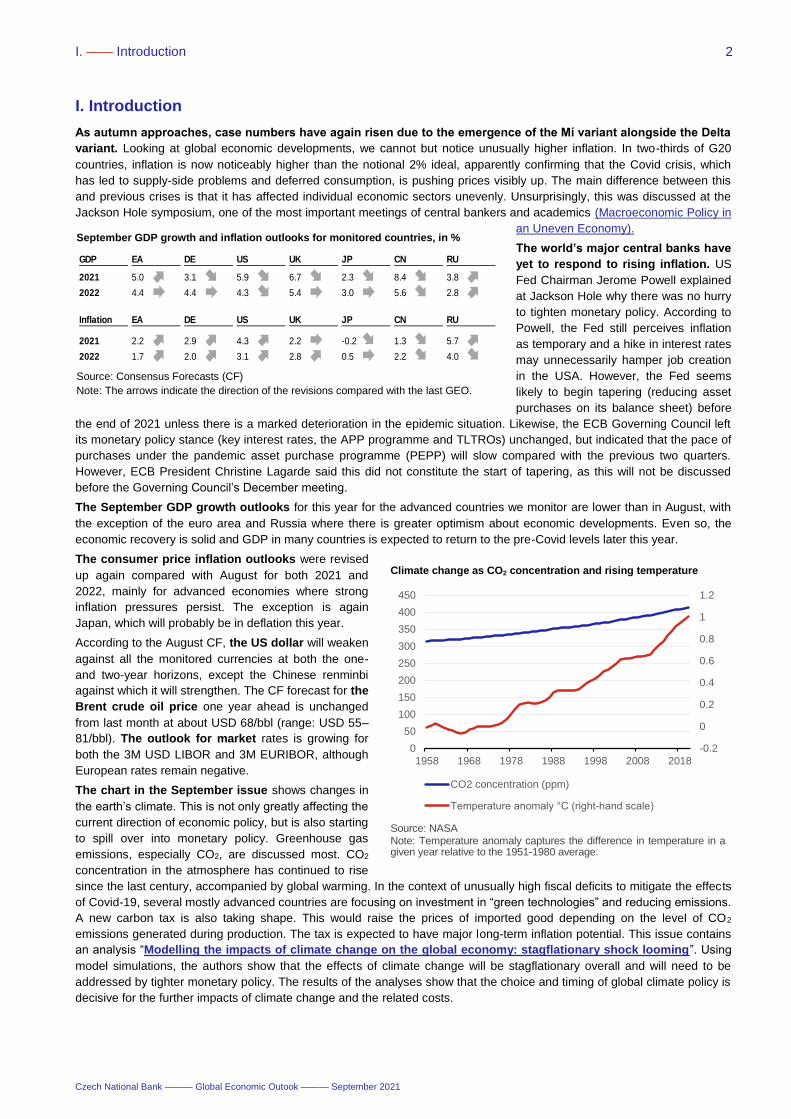
September GDP growth and inflation outlooks for monitored countries, in %
Source: Consensus Forecasts (CF)
Note: The arrows indicate the direction of the revisions compared with the last GEO.
GDP EA DE US UK JP CN RU
2021 5.0 3.1 5.9 6.7 2.3 8.4 3.8
2022 4.4 4.4 4.3 5.4 3.0 5.6 2.8
Inflation EA DE US UK JP CN RU
2021 2.2 2.9 4.3 2.2 -0.2 1.3 5.7
2022 1.7 2.0 3.1 2.8 0.5 2.2 4.0
I. Introduction
As autumn approaches, case numbers have again risen due to the emergence of the Mí variant alongside the Delta
variant. Looking at global economic developments, we cannot but notice unusually higher inflation. In two-thirds of G20
countries, inflation is now noticeably higher than the notional 2% ideal, apparently confirming that the Covid crisis, which
has led to supply-side problems and deferred consumption, is pushing prices visibly up. The main difference between this
and previous crises is that it has affected individual economic sectors unevenly. Unsurprisingly, this was discussed at the
Jackson Hole symposium, one of the most important meetings of central bankers and academics (Macroeconomic Policy in
an Uneven Economy).
The world’s major central banks have
yet to respond to rising inflation. US
Fed Chairman Jerome Powell explained
at Jackson Hole why there was no hurry
to tighten monetary policy. According to
Powell, the Fed still perceives inflation
as temporary and a hike in interest rates
may unnecessarily hamper job creation
in the USA. However, the Fed seems
likely to begin tapering (reducing asset
purchases on its balance sheet) before
the end of 2021 unless there is a marked deterioration in the epidemic situation. Likewise, the ECB Governing Council left
its monetary policy stance (key interest rates, the APP programme and TLTROs) unchanged, but indicated that the pace of
purchases under the pandemic asset purchase programme (PEPP) will slow compared with the previous two quarters.
However, ECB President Christine Lagarde said this did not constitute the start of tapering, as this will not be discussed
before the Governing Council’s December meeting.
The September GDP growth outlooks for this year for the advanced countries we monitor are lower than in August, with
the exception of the euro area and Russia where there is greater optimism about economic developments. Even so, the
economic recovery is solid and GDP in many countries is expected to return to the pre-Covid levels later this year.
The consumer price inflation outlooks were revised
up again compared with August for both 2021 and
2022, mainly for advanced economies where strong
inflation pressures persist. The exception is again
Japan, which will probably be in deflation this year.
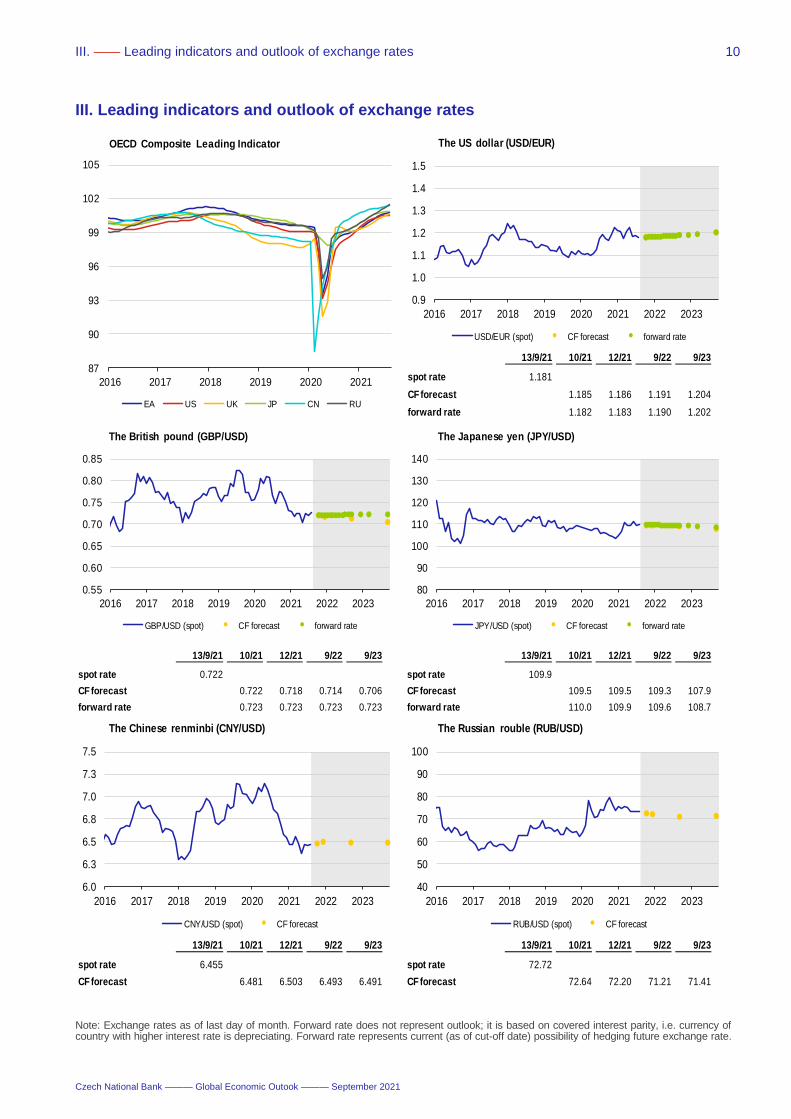
According to the August CF, the US dollar will weaken
against all the monitored currencies at both the one-
and two-year horizons, except the Chinese renminbi
against which it will strengthen. The CF forecast for the
Brent crude oil price one year ahead is unchanged
from last month at about USD 68/bbl (range: USD 55–
81/bbl). The outlook for market rates is growing for
both the 3M USD LIBOR and 3M EURIBOR, although
European rates remain negative.
The chart in the September issue shows changes in
the earth’s climate. This is not only greatly affecting the
current direction of economic policy, but is also starting
to spill over into monetary policy. Greenhouse gas
emissions, especially CO2, are discussed most. CO2
concentration in the atmosphere has continued to rise
since the last century, accompanied by global warming. In the context of unusually high fiscal deficits to mitigate the effects
of Covid-19, several mostly advanced countries are focusing on investment in “green technologies” and reducing emissions.
A new carbon tax is also taking shape. This would raise the prices of imported good depending on the level of CO2
emissions generated during production. The tax is expected to have major long-term inflation potential. This issue contains
an analysis “Modelling the impacts of climate change on the global economy: stagflationary shock looming”. Using
model simulations, the authors show that the effects of climate change will be stagflationary overall and will need to be
addressed by tighter monetary policy. The results of the analyses show that the choice and timing of global climate policy is
decisive for the further impacts of climate change and the related costs.
Climate change as CO2 concentration and rising temperature
Source: NASA Note: Temperature anomaly captures the difference in temperature in a given year relative to the 1951-1980 average.
-0.2
0
0.2
0.4
0.6
0.8
1
1.2
0
50
100
150
200
250
300
350
400
450
1958 1968 1978 1988 1998 2008 2018
CO2 concentration (ppm)
Temperature anomaly °C (right-hand scale)
II. —— Economic outlook in selected territories
Czech National Bank ——— Global Economic Outook ——— September 2021
3
II.1 Euro area
The Delta variant of the coronavirus spread in all euro area countries during the summer but high vaccination
coverage is slowing the increase in case numbers. Large euro area economies are reporting a vaccination rate of over
70% of the adult population as of mid-September, with Spain and France leading the vaccination race. Uncertainty
regarding the emergence of this variant is being reflected in worse consumer sentiment but demand remains very robust.
Growth has been driven by the services sector after a lifting of the anti-pandemic restrictions. In addition to hotels and
restaurants, tourism in Europe also saw an easing of restrictions. By contrast, problems with the supply of materials and
components are still affecting industry. Retail sales in the euro area lost momentum in July, due mainly to floods in
Germany. By contrast, industrial production grew month on month after repeated declines, the main surprise being the
consumer goods segment. The number of cases may rise again in autumn, although broad-based shutdowns are not
expected due to high vaccination coverage. Demand may cool slightly, relieving heavily overloaded supply chains.
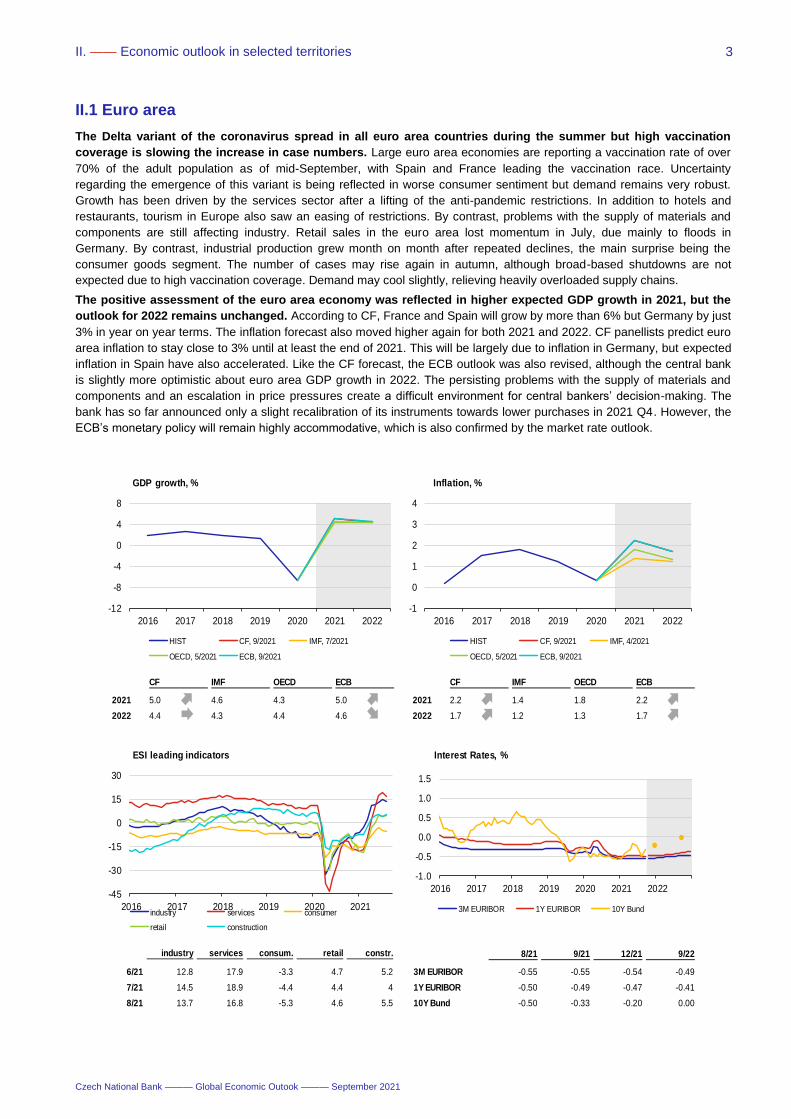
The positive assessment of the euro area economy was reflected in higher expected GDP growth in 2021, but the
outlook for 2022 remains unchanged. According to CF, France and Spain will grow by more than 6% but Germany by just
3% in year on year terms. The inflation forecast also moved higher again for both 2021 and 2022. CF panellists predict euro
area inflation to stay close to 3% until at least the end of 2021. This will be largely due to inflation in Germany, but expected
inflation in Spain have also accelerated. Like the CF forecast, the ECB outlook was also revised, although the central bank
is slightly more optimistic about euro area GDP growth in 2022. The persisting problems with the supply of materials and
components and an escalation in price pressures create a difficult environment for central bankers’ decision-making. The
bank has so far announced only a slight recalibration of its instruments towards lower purchases in 2021 Q4. However, the
ECB’s monetary policy will remain highly accommodative, which is also confirmed by the market rate outlook.
CF IMF OECD ECB CF IMF OECD ECB
2021 5.0 4.6 4.3 5.0 2021 2.2 1.4 1.8 2.2
2022 4.4 4.3 4.4 4.6 2022 1.7 1.2 1.3 1.7
-12
-8
-4
0
4
8
2016 2017 2018 2019 2020 2021 2022
GDP growth, %
HIST CF, 9/2021 IMF, 7/2021
OECD, 5/2021 ECB, 9/2021
-1
0
1
2
3
4
2016 2017 2018 2019 2020 2021 2022
Inflation, %
HIST CF, 9/2021 IMF, 4/2021
OECD, 5/2021 ECB, 9/2021
industry services consum. retail constr.
6/21 12.8 17.9 -3.3 4.7 5.2
7/21 14.5 18.9 -4.4 4.4 4
8/21 13.7 16.8 -5.3 4.6 5.5
-45
-30
-15
0
15
30
2016 2017 2018 2019 2020 2021
ESI leading indicators
industry services consumer
retail construction
8/21 9/21 12/21 9/22
3M EURIBOR -0.55 -0.55 -0.54 -0.49
1Y EURIBOR -0.50 -0.49 -0.47 -0.41
10Y Bund -0.50 -0.33 -0.20 0.00
-1.0
-0.5
0.0
0.5
1.0
1.5
2016 2017 2018 2019 2020 2021 2022
Interest Rates, %
3M EURIBOR 1Y EURIBOR 10Y Bund
II. —— Economic outlook in selected territories
Czech National Bank ——— Global Economic Outook ——— September 2021
4
II.2 The euro area in the spotlight – France
Unlike the other euro area members, France recorded no marked drop in cases during the second wave of the
pandemic. Moreover, the short-term spring shutdown did not have much of an effect on its economic performance
either. GDP grew only slightly quarter on quarter (by 1.1% after revision) after the lifting of the last measures in Q2, but the
economy is still 3% lower compared to the pre-pandemic period. In addition to household consumption, a marked rise in
investment was recorded, counteracted by the negative contribution of change in inventories. Although French producers
also have to interrupt production due to missing components, the share of industry in France’s gross value added is smaller
than in other large economies. Shutdowns mainly affected French car producers and the situation did not improve much in
Q3 either, according to available reports. The PMI survey also confirms the loss of upward momentum in industry, although
demand and orders remain high. Firms still report a willingness to hire new staff and create larger inventories to protect
against supply shortfalls. The imbalance between demand and supply has put further upward pressure on prices. However,
firms are more concerned about further developments when delayed supplies and higher prices could take their toll. This
notwithstanding, consumer confidence remains positive. In addition to very high vaccination coverage, sentiment is also
being favourably affected by the government’s very strict approach to anti-epidemic measures – from strict Covid certificate
requirements to pressure on health care workers to get vaccinated.
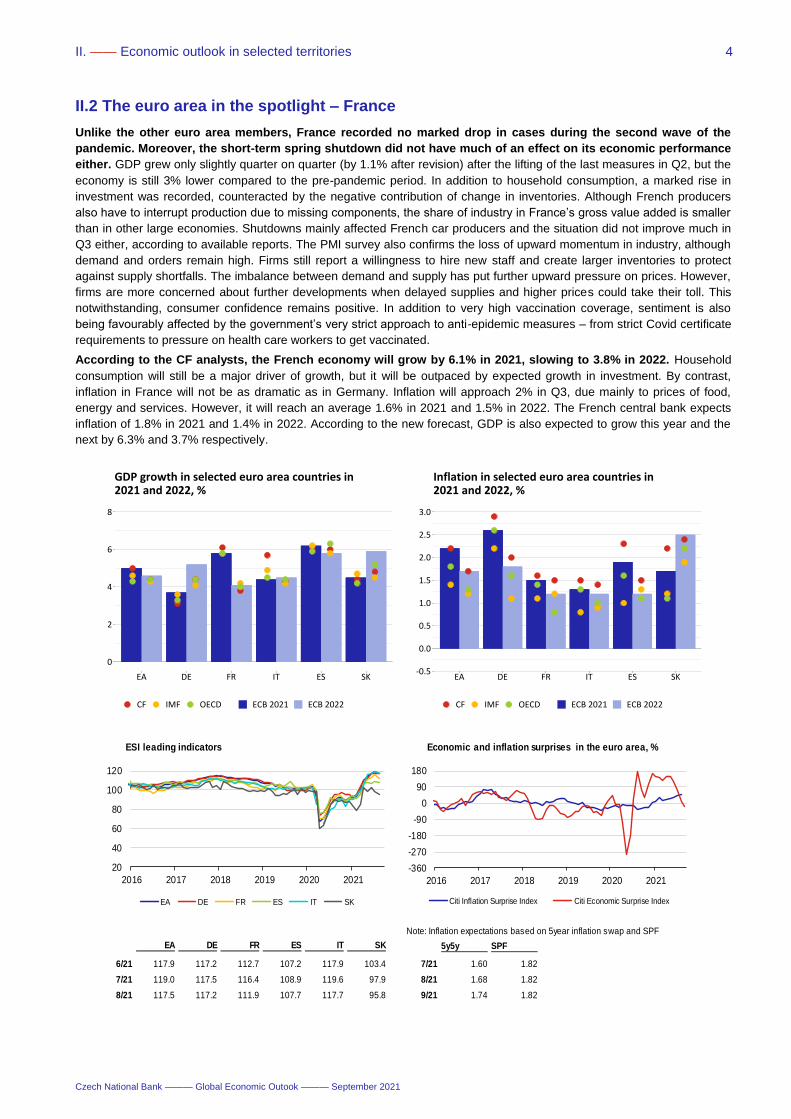
According to the CF analysts, the French economy will grow by 6.1% in 2021, slowing to 3.8% in 2022. Household
consumption will still be a major driver of growth, but it will be outpaced by expected growth in investment. By contrast,
inflation in France will not be as dramatic as in Germany. Inflation will approach 2% in Q3, due mainly to prices of food,
energy and services. However, it will reach an average 1.6% in 2021 and 1.5% in 2022. The French central bank expects
inflation of 1.8% in 2021 and 1.4% in 2022. According to the new forecast, GDP is also expected to grow this year and the
next by 6.3% and 3.7% respectively.
0
2
4
6
8
EA DE FR IT ES SK
CF IMF OECD ECB 2021 ECB 2022
GDP growth in selected euro area countries in2021 and 2022, %
-0.5
0.0
0.5
1.0
1.5
2.0
2.5
3.0
EA DE FR IT ES SK
CF IMF OECD ECB 2021 ECB 2022
Inflation in selected euro area countries in2021 and 2022, %
EA DE FR ES IT SK
6/21 117.9 117.2 112.7 107.2 117.9 103.4
7/21 119.0 117.5 116.4 108.9 119.6 97.9
8/21 117.5 117.2 111.9 107.7 117.7 95.8
20
40
60
80
100
120
2016 2017 2018 2019 2020 2021
ESI leading indicators
EA DE FR ES IT SK
Note: Inflation expectations based on 5year inflation swap and SPF
5y5y SPF
7/21 1.60 1.82
8/21 1.68 1.82
9/21 1.74 1.82
-360
-270
-180
-90
0
90
180
2016 2017 2018 2019 2020 2021
Economic and inflation surprises in the euro area, %
Citi Inflation Surprise Index Citi Economic Surprise Index
II. —— Economic outlook in selected territories
Czech National Bank ——— Global Economic Outook ——— September 2021
5
II.3 United States
The USA has entered into a new security pact with the United Kingdom and Australia aimed at strengthening
security in the Indo-Pacific region. President Joe Biden is still facing criticism due to developments in Afghanistan. The
implementation of Biden’s investment plans, which will be discussed in the Congress in the weeks to come, will also be
crucial.
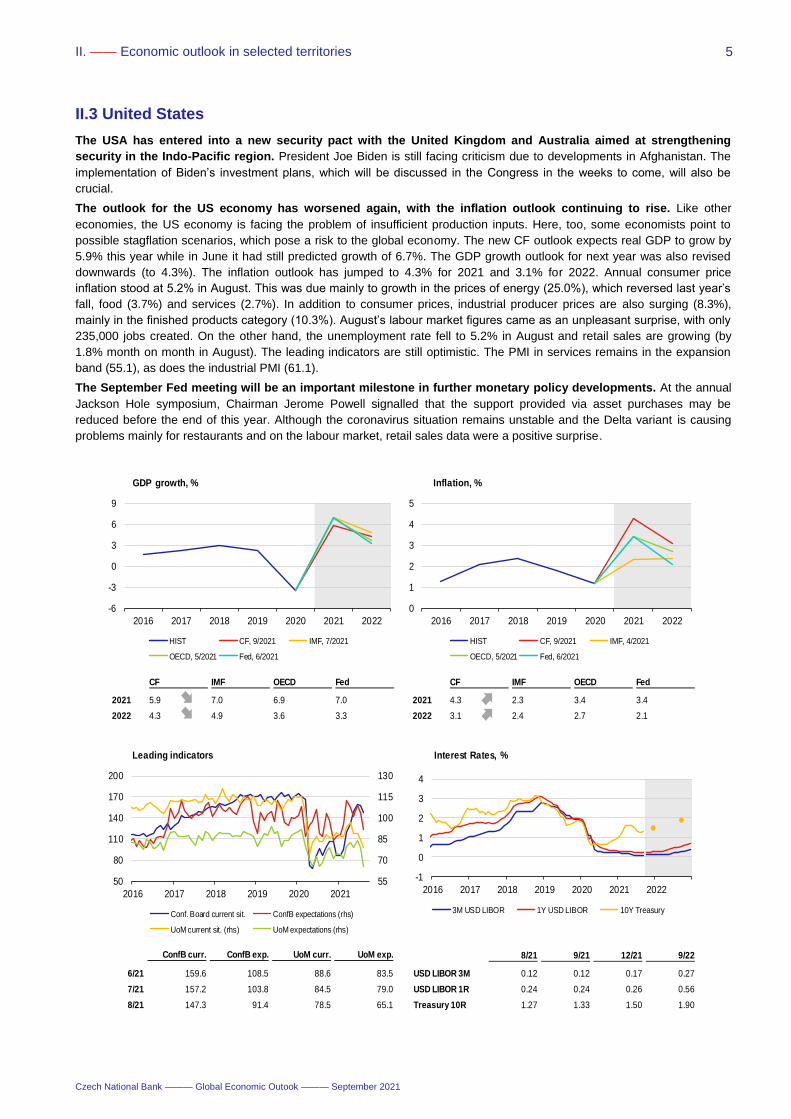
The outlook for the US economy has worsened again, with the inflation outlook continuing to rise. Like other
economies, the US economy is facing the problem of insufficient production inputs. Here, too, some economists point to
possible stagflation scenarios, which pose a risk to the global economy. The new CF outlook expects real GDP to grow by
5.9% this year while in June it had still predicted growth of 6.7%. The GDP growth outlook for next year was also revised
downwards (to 4.3%). The inflation outlook has jumped to 4.3% for 2021 and 3.1% for 2022. Annual consumer price
inflation stood at 5.2% in August. This was due mainly to growth in the prices of energy (25.0%), which reversed last year’s
fall, food (3.7%) and services (2.7%). In addition to consumer prices, industrial producer prices are also surging (8.3%),
mainly in the finished products category (10.3%). August’s labour market figures came as an unpleasant surprise, with only
235,000 jobs created. On the other hand, the unemployment rate fell to 5.2% in August and retail sales are growing (by
1.8% month on month in August). The leading indicators are still optimistic. The PMI in services remains in the expansion
band (55.1), as does the industrial PMI (61.1).
The September Fed meeting will be an important milestone in further monetary policy developments. At the annual
Jackson Hole symposium, Chairman Jerome Powell signalled that the support provided via asset purchases may be
reduced before the end of this year. Although the coronavirus situation remains unstable and the Delta variant is causing
problems mainly for restaurants and on the labour market, retail sales data were a positive surprise.
CF IMF OECD Fed CF IMF OECD Fed
2021 5.9 7.0 6.9 7.0 2021 4.3 2.3 3.4 3.4
2022 4.3 4.9 3.6 3.3 2022 3.1 2.4 2.7 2.1
-6
-3
0
3
6
9
2016 2017 2018 2019 2020 2021 2022
GDP growth, %
HIST CF, 9/2021 IMF, 7/2021
OECD, 5/2021 Fed, 6/2021
0
1
2
3
4
5
2016 2017 2018 2019 2020 2021 2022
Inflation, %
HIST CF, 9/2021 IMF, 4/2021
OECD, 5/2021 Fed, 6/2021
ConfB curr. ConfB exp. UoM curr. UoM exp.
6/21 159.6 108.5 88.6 83.5
7/21 157.2 103.8 84.5 79.0
8/21 147.3 91.4 78.5 65.1
55
70
85
100
115
130
50
80
110
140
170
200
2016 2017 2018 2019 2020 2021
Leading indicators
Conf. Board current sit. ConfB expectations (rhs)
UoM current sit. (rhs) UoM expectations (rhs)
8/21 9/21 12/21 9/22
USD LIBOR 3M 0.12 0.12 0.17 0.27
USD LIBOR 1R 0.24 0.24 0.26 0.56
Treasury 10R 1.27 1.33 1.50 1.90
-1
0
1
2
3
4
2016 2017 2018 2019 2020 2021 2022
Interest Rates, %
3M USD LIBOR 1Y USD LIBOR 10Y Treasury
II. —— Economic outlook in selected territories
Czech National Bank ——— Global Economic Outook ——— September 2021
6
II.4 United Kingdom
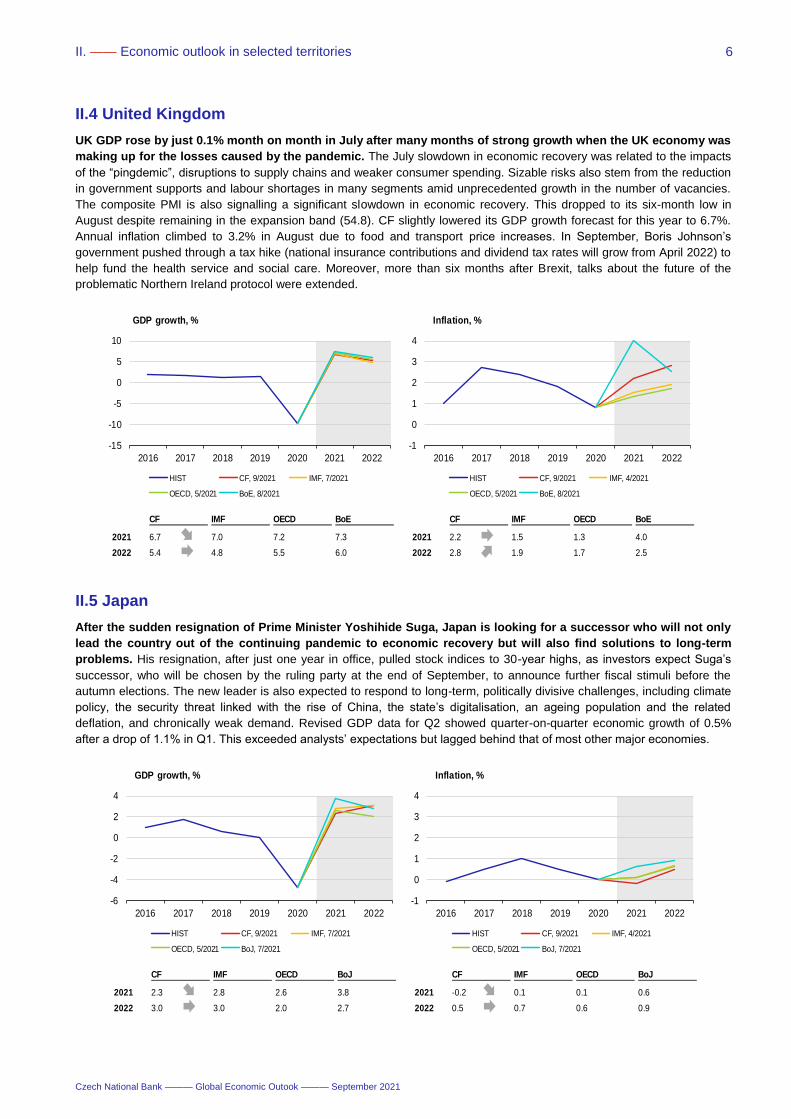
UK GDP rose by just 0.1% month on month in July after many months of strong growth when the UK economy was
making up for the losses caused by the pandemic. The July slowdown in economic recovery was related to the impacts
of the “pingdemic”, disruptions to supply chains and weaker consumer spending. Sizable risks also stem from the reduction
in government supports and labour shortages in many segments amid unprecedented growth in the number of vacancies.
The composite PMI is also signalling a significant slowdown in economic recovery. This dropped to its six-month low in
August despite remaining in the expansion band (54.8). CF slightly lowered its GDP growth forecast for this year to 6.7%.
Annual inflation climbed to 3.2% in August due to food and transport price increases. In September, Boris Johnson’s
government pushed through a tax hike (national insurance contributions and dividend tax rates will grow from April 2022) to
help fund the health service and social care. Moreover, more than six months after Brexit, talks about the future of the
problematic Northern Ireland protocol were extended.
II.5 Japan
After the sudden resignation of Prime Minister Yoshihide Suga, Japan is looking for a successor who will not only
lead the country out of the continuing pandemic to economic recovery but will also find solutions to long-term
problems. His resignation, after just one year in office, pulled stock indices to 30-year highs, as investors expect Suga’s
successor, who will be chosen by the ruling party at the end of September, to announce further fiscal stimuli before the
autumn elections. The new leader is also expected to respond to long-term, politically divisive challenges, including climate
policy, the security threat linked with the rise of China, the state’s digitalisation, an ageing population and the related
deflation, and chronically weak demand. Revised GDP data for Q2 showed quarter-on-quarter economic growth of 0.5%
after a drop of 1.1% in Q1. This exceeded analysts’ expectations but lagged behind that of most other major economies.
CF IMF OECD BoE CF IMF OECD BoE
2021 6.7 7.0 7.2 7.3 2021 2.2 1.5 1.3 4.0
2022 5.4 4.8 5.5 6.0 2022 2.8 1.9 1.7 2.5
-15
-10
-5
0
5
10
2016 2017 2018 2019 2020 2021 2022
GDP growth, %
HIST CF, 9/2021 IMF, 7/2021
OECD, 5/2021 BoE, 8/2021
-1
0
1
2
3
4
2016 2017 2018 2019 2020 2021 2022
Inflation, %
HIST CF, 9/2021 IMF, 4/2021
OECD, 5/2021 BoE, 8/2021
CF IMF OECD BoJ CF IMF OECD BoJ
2021 2.3 2.8 2.6 3.8 2021 -0.2 0.1 0.1 0.6
2022 3.0 3.0 2.0 2.7 2022 0.5 0.7 0.6 0.9
-6
-4
-2
0
2
4
2016 2017 2018 2019 2020 2021 2022
GDP growth, %
HIST CF, 9/2021 IMF, 7/2021
OECD, 5/2021 BoJ, 7/2021
-1
0
1
2
3
4
2016 2017 2018 2019 2020 2021 2022
Inflation, %
HIST CF, 9/2021 IMF, 4/2021
OECD, 5/2021 BoJ, 7/2021
II. —— Economic outlook in selected territories
Czech National Bank ——— Global Economic Outook ——— September 2021
7
II.6 China
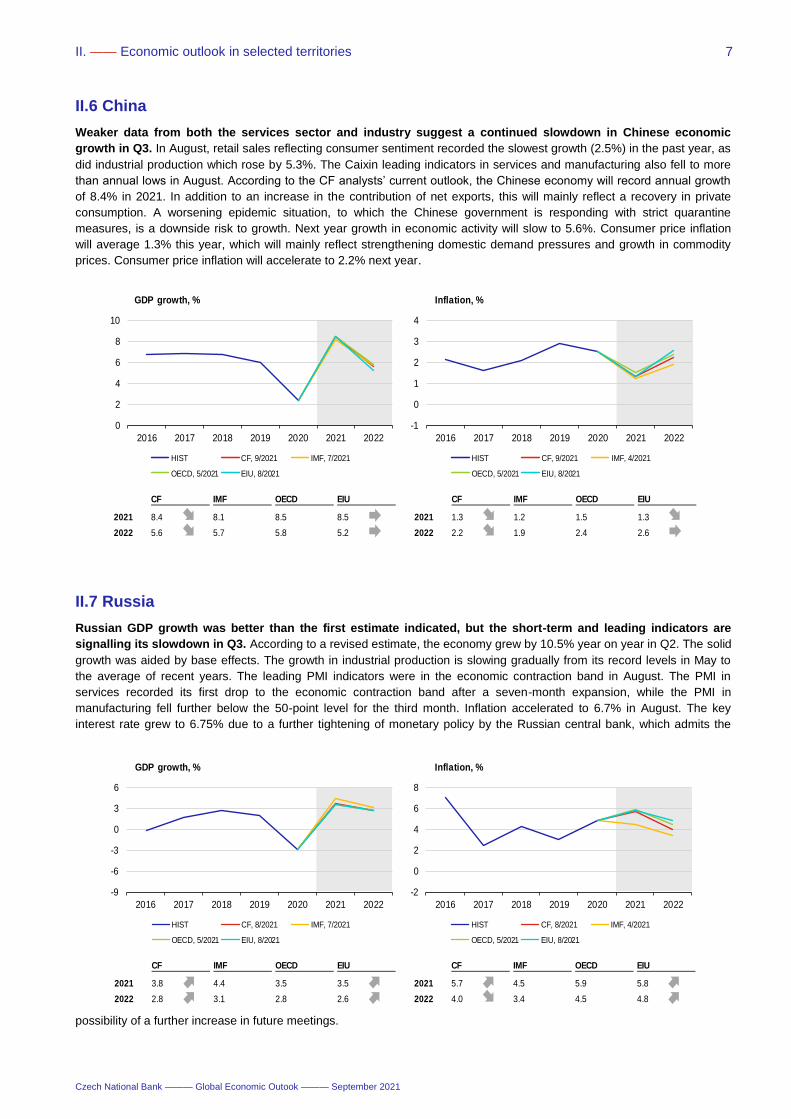
Weaker data from both the services sector and industry suggest a continued slowdown in Chinese economic
growth in Q3. In August, retail sales reflecting consumer sentiment recorded the slowest growth (2.5%) in the past year, as
did industrial production which rose by 5.3%. The Caixin leading indicators in services and manufacturing also fell to more
than annual lows in August. According to the CF analysts’ current outlook, the Chinese economy will record annual growth
of 8.4% in 2021. In addition to an increase in the contribution of net exports, this will mainly reflect a recovery in private
consumption. A worsening epidemic situation, to which the Chinese government is responding with strict quarantine
measures, is a downside risk to growth. Next year growth in economic activity will slow to 5.6%. Consumer price inflation
will average 1.3% this year, which will mainly reflect strengthening domestic demand pressures and growth in commodity
prices. Consumer price inflation will accelerate to 2.2% next year.
II.7 Russia
Russian GDP growth was better than the first estimate indicated, but the short-term and leading indicators are
signalling its slowdown in Q3. According to a revised estimate, the economy grew by 10.5% year on year in Q2. The solid
growth was aided by base effects. The growth in industrial production is slowing gradually from its record levels in May to
the average of recent years. The leading PMI indicators were in the economic contraction band in August. The PMI in
services recorded its first drop to the economic contraction band after a seven-month expansion, while the PMI in
manufacturing fell further below the 50-point level for the third month. Inflation accelerated to 6.7% in August. The key
interest rate grew to 6.75% due to a further tightening of monetary policy by the Russian central bank, which admits the
possibility of a further increase in future meetings.
CF IMF OECD EIU CF IMF OECD EIU
2021 8.4 8.1 8.5 8.5 2021 1.3 1.2 1.5 1.3
2022 5.6 5.7 5.8 5.2 2022 2.2 1.9 2.4 2.6
0
2
4
6
8
10
2016 2017 2018 2019 2020 2021 2022
GDP growth, %
HIST CF, 9/2021 IMF, 7/2021
OECD, 5/2021 EIU, 8/2021
-1
0
1
2
3
4
2016 2017 2018 2019 2020 2021 2022
Inflation, %
HIST CF, 9/2021 IMF, 4/2021
OECD, 5/2021 EIU, 8/2021
CF IMF OECD EIU CF IMF OECD EIU
2021 3.8 4.4 3.5 3.5 2021 5.7 4.5 5.9 5.8
2022 2.8 3.1 2.8 2.6 2022 4.0 3.4 4.5 4.8
-9
-6
-3
0
3
6
2016 2017 2018 2019 2020 2021 2022
GDP growth, %
HIST CF, 8/2021 IMF, 7/2021
OECD, 5/2021 EIU, 8/2021
-2
0
2
4
6
8
2016 2017 2018 2019 2020 2021 2022
Inflation, %
HIST CF, 8/2021 IMF, 4/2021
OECD, 5/2021 EIU, 8/2021
II. —— Economic outlook in selected territories
Czech National Bank ——— Global Economic Outook ——— September 2021
8
II.8 Poland
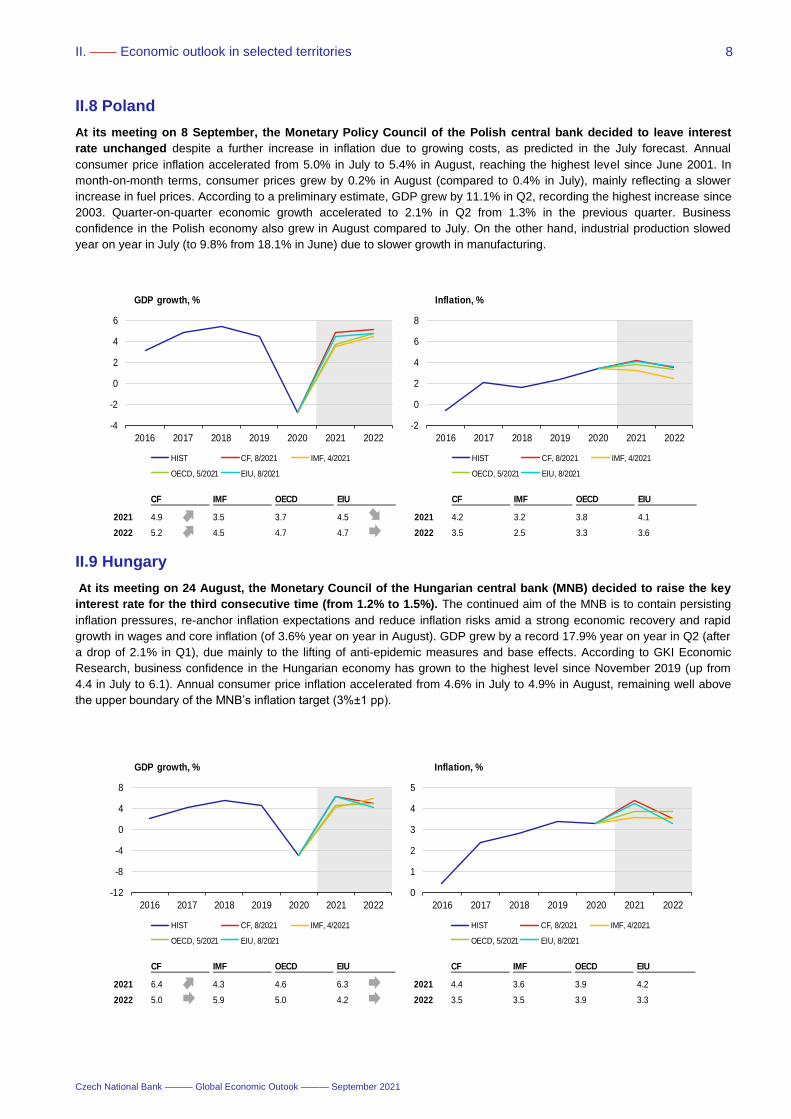
At its meeting on 8 September, the Monetary Policy Council of the Polish central bank decided to leave interest
rate unchanged despite a further increase in inflation due to growing costs, as predicted in the July forecast. Annual
consumer price inflation accelerated from 5.0% in July to 5.4% in August, reaching the highest level since June 2001. In
month-on-month terms, consumer prices grew by 0.2% in August (compared to 0.4% in July), mainly reflecting a slower
increase in fuel prices. According to a preliminary estimate, GDP grew by 11.1% in Q2, recording the highest increase since
2003. Quarter-on-quarter economic growth accelerated to 2.1% in Q2 from 1.3% in the previous quarter. Business
confidence in the Polish economy also grew in August compared to July. On the other hand, industrial production slowed
year on year in July (to 9.8% from 18.1% in June) due to slower growth in manufacturing.
II.9 Hungary
At its meeting on 24 August, the Monetary Council of the Hungarian central bank (MNB) decided to raise the key
interest rate for the third consecutive time (from 1.2% to 1.5%). The continued aim of the MNB is to contain persisting
inflation pressures, re-anchor inflation expectations and reduce inflation risks amid a strong economic recovery and rapid
growth in wages and core inflation (of 3.6% year on year in August). GDP grew by a record 17.9% year on year in Q2 (after
a drop of 2.1% in Q1), due mainly to the lifting of anti-epidemic measures and base effects. According to GKI Economic
Research, business confidence in the Hungarian economy has grown to the highest level since November 2019 (up from
4.4 in July to 6.1). Annual consumer price inflation accelerated from 4.6% in July to 4.9% in August, remaining well above
the upper boundary of the MNB’s inflation target (3%±1 pp).
CF IMF OECD EIU CF IMF OECD EIU
2021 6.4 4.3 4.6 6.3 2021 4.4 3.6 3.9 4.2
2022 5.0 5.9 5.0 4.2 2022 3.5 3.5 3.9 3.3
-12
-8
-4
0
4
8
2016 2017 2018 2019 2020 2021 2022
GDP growth, %
HIST CF, 8/2021 IMF, 4/2021
OECD, 5/2021 EIU, 8/2021
0
1
2
3
4
5
2016 2017 2018 2019 2020 2021 2022
Inflation, %
HIST CF, 8/2021 IMF, 4/2021
OECD, 5/2021 EIU, 8/2021
CF IMF OECD EIU CF IMF OECD EIU
2021 4.9 3.5 3.7 4.5 2021 4.2 3.2 3.8 4.1
2022 5.2 4.5 4.7 4.7 2022 3.5 2.5 3.3 3.6
-4
-2
0
2
4
6
2016 2017 2018 2019 2020 2021 2022
GDP growth, %
HIST CF, 8/2021 IMF, 4/2021
OECD, 5/2021 EIU, 8/2021
-2
0
2
4
6
8
2016 2017 2018 2019 2020 2021 2022
Inflation, %
HIST CF, 8/2021 IMF, 4/2021
OECD, 5/2021 EIU, 8/2021
II. —— Economic outlook in selected territories
Czech National Bank ——— Global Economic Outook ——— September 2021
9
II.10 Argentina
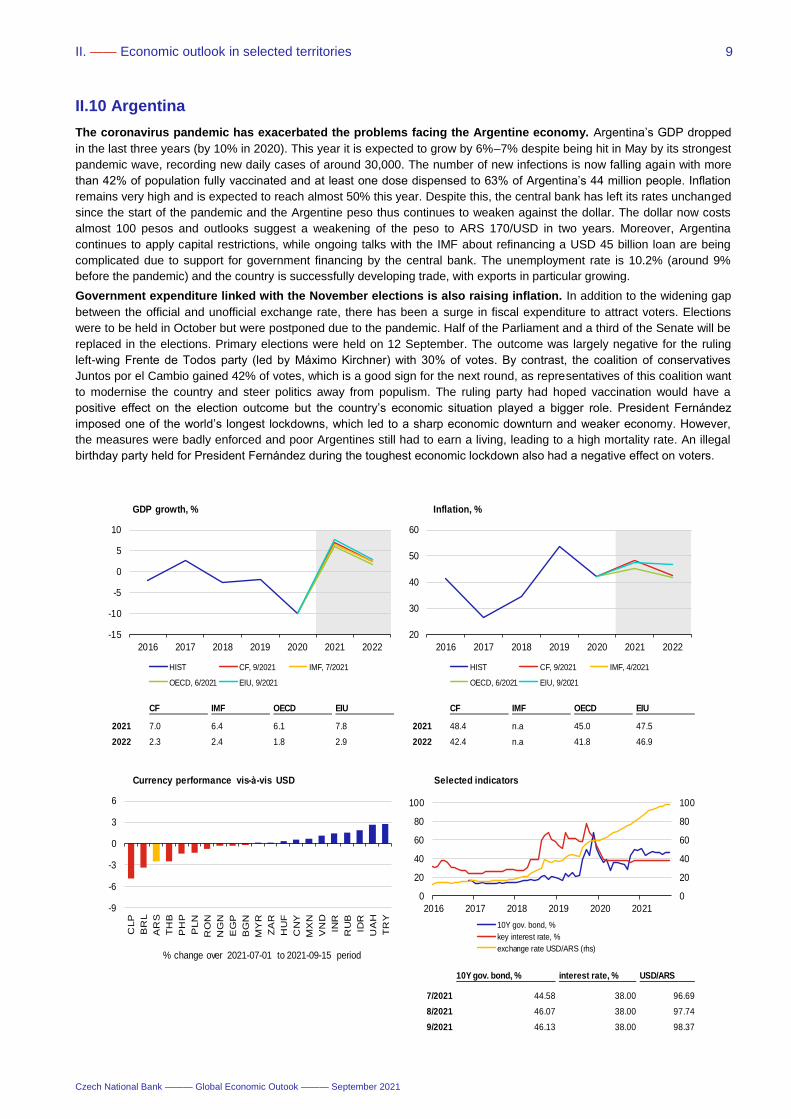
The coronavirus pandemic has exacerbated the problems facing the Argentine economy. Argentina’s GDP dropped
in the last three years (by 10% in 2020). This year it is expected to grow by 6%–7% despite being hit in May by its strongest
pandemic wave, recording new daily cases of around 30,000. The number of new infections is now falling again with more
than 42% of population fully vaccinated and at least one dose dispensed to 63% of Argentina’s 44 million people. Inflation
remains very high and is expected to reach almost 50% this year. Despite this, the central bank has left its rates unchanged
since the start of the pandemic and the Argentine peso thus continues to weaken against the dollar. The dollar now costs
almost 100 pesos and outlooks suggest a weakening of the peso to ARS 170/USD in two years. Moreover, Argentina
continues to apply capital restrictions, while ongoing talks with the IMF about refinancing a USD 45 billion loan are being
complicated due to support for government financing by the central bank. The unemployment rate is 10.2% (around 9%
before the pandemic) and the country is successfully developing trade, with exports in particular growing.
Government expenditure linked with the November elections is also raising inflation. In addition to the widening gap
between the official and unofficial exchange rate, there has been a surge in fiscal expenditure to attract voters. Elections
were to be held in October but were postponed due to the pandemic. Half of the Parliament and a third of the Senate will be
replaced in the elections. Primary elections were held on 12 September. The outcome was largely negative for the ruling
left-wing Frente de Todos party (led by Máximo Kirchner) with 30% of votes. By contrast, the coalition of conservatives
Juntos por el Cambio gained 42% of votes, which is a good sign for the next round, as representatives of this coalition want
to modernise the country and steer politics away from populism. The ruling party had hoped vaccination would have a
positive effect on the election outcome but the country’s economic situation played a bigger role. President Fernández
imposed one of the world’s longest lockdowns, which led to a sharp economic downturn and weaker economy. However,
the measures were badly enforced and poor Argentines still had to earn a living, leading to a high mortality rate. An illegal
birthday party held for President Fernández during the toughest economic lockdown also had a negative effect on voters.
CF IMF OECD EIU CF IMF OECD EIU
2021 7.0 6.4 6.1 7.8 2021 48.4 n.a 45.0 47.5
2022 2.3 2.4 1.8 2.9 2022 42.4 n.a 41.8 46.9
-15
-10
-5
0
5
10
2016 2017 2018 2019 2020 2021 2022
GDP growth, %
HIST CF, 9/2021 IMF, 7/2021
OECD, 6/2021 EIU, 9/2021
20
30
40
50
60
2016 2017 2018 2019 2020 2021 2022
Inflation, %
HIST CF, 9/2021 IMF, 4/2021
OECD, 6/2021 EIU, 9/2021
1/1900
1/1900
1/1900 0.0 0.0
01/00 01/00
0.0 0.0
0.0 0.0
-9
-6
-3
0
3
6
CLP
BR
L
AR
S
TH
B
PH
P
PLN
RO
N
NG
N
EG
P
BG
N
MY
R
ZA
R
HU
F
CN
Y
MX
N
VN
D
INR
RU
B
IDR
UA
H
TR
Y
% change over 2021-07-01 to 2021-09-15 period
Currency performance vis-à-vis USD
10Y gov. bond, % interest rate, % USD/ARS
7/2021 44.58 38.00 96.69
8/2021 46.07 38.00 97.74
9/2021 46.13 38.00 98.37
0
20
40
60
80
100
0
20
40
60
80
100
2016 2017 2018 2019 2020 2021
Selected indicators
10Y gov. bond, %
key interest rate, %
exchange rate USD/ARS (rhs)
III. —— Leading indicators and outlook of exchange rates
Czech National Bank ——— Global Economic Outook ——— September 2021
10
III. Leading indicators and outlook of exchange rates
Note: Exchange rates as of last day of month. Forward rate does not represent outlook; it is based on covered interest parity, i.e. currency of country with higher interest rate is depreciating. Forward rate represents current (as of cut-off date) possibility of hedging future exchange rate.
87
90
93
96
99
102
105
2016 2017 2018 2019 2020 2021
OECD Composite Leading Indicator
EA US UK JP CN RU
13/9/21 10/21 12/21 9/22 9/23
spot rate 1.181
CF forecast 1.185 1.186 1.191 1.204
forward rate 1.182 1.183 1.190 1.202
0.9
1.0
1.1
1.2
1.3
1.4
1.5
2016 2017 2018 2019 2020 2021 2022 2023
The US dollar (USD/EUR)
USD/EUR (spot) CF forecast forward rate
13/9/21 10/21 12/21 9/22 9/23 13/9/21 10/21 12/21 9/22 9/23
spot rate 0.722 spot rate 109.9
CF forecast 0.722 0.718 0.714 0.706 CF forecast 109.5 109.5 109.3 107.9
forward rate 0.723 0.723 0.723 0.723 forward rate 110.0 109.9 109.6 108.7
0.55
0.60
0.65
0.70
0.75
0.80
0.85
2016 2017 2018 2019 2020 2021 2022 2023
The British pound (GBP/USD)
GBP/USD (spot) CF forecast forward rate
80
90
100
110
120
130
140
2016 2017 2018 2019 2020 2021 2022 2023
The Japanese yen (JPY/USD)
JPY/USD (spot) CF forecast forward rate
13/9/21 10/21 12/21 9/22 9/23 13/9/21 10/21 12/21 9/22 9/23
spot rate 6.455 spot rate 72.72
CF forecast 6.481 6.503 6.493 6.491 CF forecast 72.64 72.20 71.21 71.41
6.0
6.3
6.5
6.8
7.0
7.3
7.5
2016 2017 2018 2019 2020 2021 2022 2023
The Chinese renminbi (CNY/USD)
CNY/USD (spot) CF forecast
40
50
60
70
80
90
100
2016 2017 2018 2019 2020 2021 2022 2023
The Russian rouble (RUB/USD)
RUB/USD (spot) CF forecast
IV. —— Commodity market developments
Czech National Bank ——— Global Economic Outook ——— September 2021
11
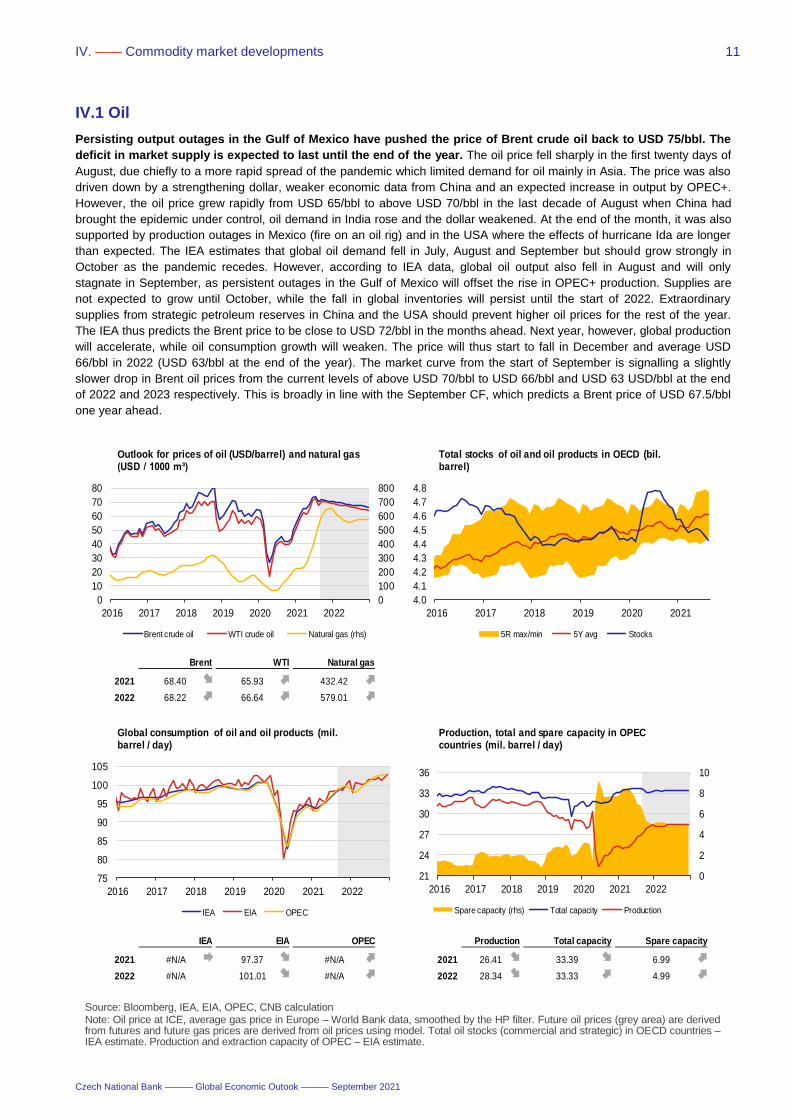
IV.1 Oil
Persisting output outages in the Gulf of Mexico have pushed the price of Brent crude oil back to USD 75/bbl. The
deficit in market supply is expected to last until the end of the year. The oil price fell sharply in the first twenty days of
August, due chiefly to a more rapid spread of the pandemic which limited demand for oil mainly in Asia. The price was also
driven down by a strengthening dollar, weaker economic data from China and an expected increase in output by OPEC+.
However, the oil price grew rapidly from USD 65/bbl to above USD 70/bbl in the last decade of August when China had
brought the epidemic under control, oil demand in India rose and the dollar weakened. At the end of the month, it was also
supported by production outages in Mexico (fire on an oil rig) and in the USA where the effects of hurricane Ida are longer
than expected. The IEA estimates that global oil demand fell in July, August and September but should grow strongly in
October as the pandemic recedes. However, according to IEA data, global oil output also fell in August and will only
stagnate in September, as persistent outages in the Gulf of Mexico will offset the rise in OPEC+ production. Supplies are
not expected to grow until October, while the fall in global inventories will persist until the start of 2022. Extraordinary
supplies from strategic petroleum reserves in China and the USA should prevent higher oil prices for the rest of the year.
The IEA thus predicts the Brent price to be close to USD 72/bbl in the months ahead. Next year, however, global production
will accelerate, while oil consumption growth will weaken. The price will thus start to fall in December and average USD
66/bbl in 2022 (USD 63/bbl at the end of the year). The market curve from the start of September is signalling a slightly
slower drop in Brent oil prices from the current levels of above USD 70/bbl to USD 66/bbl and USD 63 USD/bbl at the end
of 2022 and 2023 respectively. This is broadly in line with the September CF, which predicts a Brent price of USD 67.5/bbl
one year ahead.
Source: Bloomberg, IEA, EIA, OPEC, CNB calculation Note: Oil price at ICE, average gas price in Europe – World Bank data, smoothed by the HP filter. Future oil prices (grey area) are derived from futures and future gas prices are derived from oil prices using model. Total oil stocks (commercial and strategic) in OECD countries – IEA estimate. Production and extraction capacity of OPEC – EIA estimate.
Brent WTI Natural gas
2021 68.40 65.93 432.42
2022 68.22 66.64 579.01
IEA EIA OPEC Production Total capacity Spare capacity
2021 #N/A 97.37 #N/A 2021 26.41 33.39 6.99
2022 #N/A 101.01 #N/A 2022 28.34 33.33 4.99
0
100
200
300
400
500
600
700
800
0
10
20
30
40
50
60
70
80
2016 2017 2018 2019 2020 2021 2022
Outlook for prices of oil (USD/barrel) and natural gas (USD / 1000 m³)
Brent crude oil WTI crude oil Natural gas (rhs)
4.0
4.1
4.2
4.3
4.4
4.5
4.6
4.7
4.8
2016 2017 2018 2019 2020 2021
Total stocks of oil and oil products in OECD (bil. barrel)
5R max/min 5Y avg Stocks
75
80
85
90
95
100
105
2016 2017 2018 2019 2020 2021 2022
Global consumption of oil and oil products (mil. barrel / day)
IEA EIA OPEC
0
2
4
6
8
10
21
24
27
30
33
36
2016 2017 2018 2019 2020 2021 2022
Production, total and spare capacity in OPEC countries (mil. barrel / day)
Spare capacity (rhs) Total capacity Production
IV. —— Commodity market developments
Czech National Bank ——— Global Economic Outook ——— September 2021
12
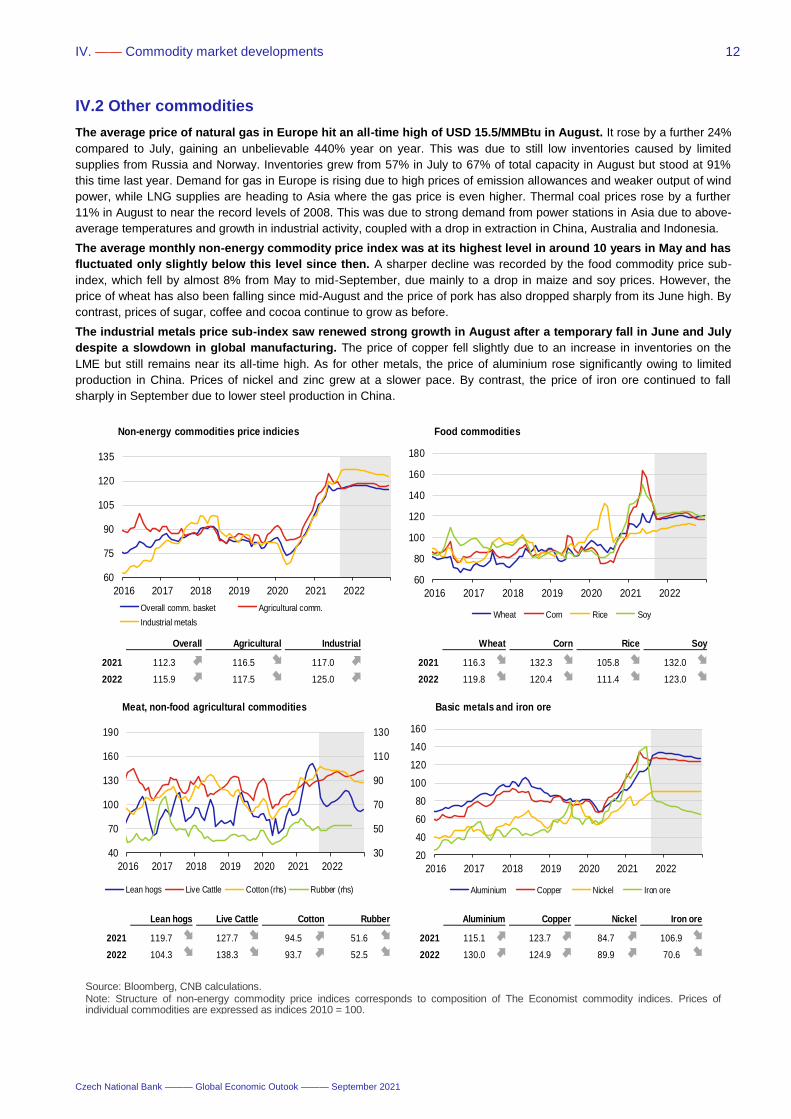
IV.2 Other commodities
The average price of natural gas in Europe hit an all-time high of USD 15.5/MMBtu in August. It rose by a further 24%
compared to July, gaining an unbelievable 440% year on year. This was due to still low inventories caused by limited
supplies from Russia and Norway. Inventories grew from 57% in July to 67% of total capacity in August but stood at 91%
this time last year. Demand for gas in Europe is rising due to high prices of emission allowances and weaker output of wind
power, while LNG supplies are heading to Asia where the gas price is even higher. Thermal coal prices rose by a further
11% in August to near the record levels of 2008. This was due to strong demand from power stations in Asia due to above-
average temperatures and growth in industrial activity, coupled with a drop in extraction in China, Australia and Indonesia.
The average monthly non-energy commodity price index was at its highest level in around 10 years in May and has
fluctuated only slightly below this level since then. A sharper decline was recorded by the food commodity price sub-
index, which fell by almost 8% from May to mid-September, due mainly to a drop in maize and soy prices. However, the
price of wheat has also been falling since mid-August and the price of pork has also dropped sharply from its June high. By
contrast, prices of sugar, coffee and cocoa continue to grow as before.
The industrial metals price sub-index saw renewed strong growth in August after a temporary fall in June and July
despite a slowdown in global manufacturing. The price of copper fell slightly due to an increase in inventories on the
LME but still remains near its all-time high. As for other metals, the price of aluminium rose significantly owing to limited
production in China. Prices of nickel and zinc grew at a slower pace. By contrast, the price of iron ore continued to fall
sharply in September due to lower steel production in China.
Source: Bloomberg, CNB calculations. Note: Structure of non-energy commodity price indices corresponds to composition of The Economist commodity indices. Prices of individual commodities are expressed as indices 2010 = 100.
Overall Agricultural Industrial Wheat Corn Rice Soy
2021 112.3 116.5 117.0 2021 116.3 132.3 105.8 132.0
2022 115.9 117.5 125.0 2022 119.8 120.4 111.4 123.0
60
75
90
105
120
135
2016 2017 2018 2019 2020 2021 2022
Non-energy commodities price indicies
Overall comm. basket Agricultural comm.
Industrial metals
60
80
100
120
140
160
180
2016 2017 2018 2019 2020 2021 2022
Food commodities
Wheat Corn Rice Soy
Lean hogs Live Cattle Cotton Rubber
2021 119.7 127.7 94.5 51.6
2022 104.3 138.3 93.7 52.5
30
50
70
90
110
130
40
70
100
130
160
190
2016 2017 2018 2019 2020 2021 2022
Meat, non-food agricultural commodities
Lean hogs Live Cattle Cotton (rhs) Rubber (rhs)
Aluminium Copper Nickel Iron ore
2021 115.1 123.7 84.7 106.9
2022 130.0 124.9 89.9 70.6
20
40
60
80
100
120
140
160
2016 2017 2018 2019 2020 2021 2022
Basic metals and iron ore
Aluminium Copper Nickel Iron ore
V. —— Focus
Czech National Bank ——— Global Economic Outook ——— September 2021
13
Modelling the impacts of climate change on the global economy: Stagflationary shock
looming 1
In terms of the frequency and scale of global natural disasters, the stormy summer of 2021 is once again proof that climate
change is an indisputable reality. The question is how strong the impacts of climate change will be on individual economies,
how these effects will be spread over time and how central banks should respond. The currently available views of central
banks, international institutions and other research institutions indicate that these institutions have yet to reach a clear
conclusion. Our aim is to use our own model simulations of selected climate scenarios to contribute to the answer. These
simulations show that the effects of climate change will be stagflationary overall and will need to be addressed by tighter
monetary policy. Furthermore, the results of our analyses demonstrate that the choice and timing of global climate policy is
decisive for the further development of the impacts of climate change and its associated costs. In the case of timely
implementation of global climate policy, a more significant decline in real economic activity can be avoided at the cost of
higher inflation in the short term. We also conclude that policymakers need to prepare for the ever increasing effects of
climate change. This will mainly involve building a sufficiently broad analytical framework in the form of modelling tools
which are capable of capturing the risks arising from climate change.
Motivation and goal
There is a global consensus that climate change is accelerating and that we need to start preparing for its impacts.
Climate change reflects an increase in the average temperature due to the accumulation of mainly carbon dioxide in the
atmosphere, which arises from the combustion of fossil fuels (coal, natural gas, oil). This leads, among other things, to
changes in weather, with a dramatic increase in the frequency and severity of global natural disasters, such as long periods
of drought, floods, cyclones and hurricanes. Climate change therefore presents a very significant global societal risk. So far,
government and central bank representatives disagree on the level of action that should be taken to combat climate
change. Available studies on the macroeconomic impacts of climate change do not yet provide a clear conclusion on the
overall effects of the shock. On the other hand, there is fairly broad consensus that the effects of climate change need to be
captured using analytical tools so that they can be incorporated into decision-making processes, for example, when
deciding on monetary policy settings.
This article aims to provide an overview and description of the climate change modelling instruments currently
available to central banks, including the quantification of the impact of climate change on the global economy. As
part of their monetary policy strategy reviews, central banks are newly focusing on the effects of climate change on the
economy and the related implications for monetary policy and financial stability. This also includes macroeconomic
modelling, which will provide a formal framework. In this context, we present our own simulations of three hypothetical
climate scenarios and their impacts on the global economy, including the implications for monetary policy quantified using
the NiGEM model.2
Economic impacts of climate change and climate protection policies
The risks arising from the impacts of climate change can be divided into “physical” risks, related to extreme
weather events, and “transition” risks, reflecting changes in climate policy. Physical risks include different types of
natural disasters as well as the negative effects of high temperatures on human health, which may further lead to mass
migration and geopolitical conflicts, see Brzoska and Fröhlich (2015) and Rigaud et al. (2018). All these risks will affect
aggregate supply and demand. On the supply side, rising average temperatures may, like devastating natural disasters and
related forced migration, reduce productivity and labour availability. Extreme events may also physically destroy capital and
redirect investment from expanding production to reconstructing capital. Shortfalls in the production factors of labour and
capital, along with frequent disruptions to global supply chains and the division of labour, will thus reduce the potential and
production capacity of the world’s economies. From the demand perspective, physical risks will affect the preferences and
behaviour patterns of economic agents, and increased uncertainty will have an adverse effect on private consumption
(precautionary savings) and on firms (deferred investment). Physical risks will also have a negative impact on asset prices
and the financial sector in general, leading to increasing problems with securing loans, including major challenges, for
example, in the insurance sector. Transition risks represent the economic costs of the gradual move towards low-emission
economies. They arise as a result of changes in climate policy, unavoidable technological changes that will require major
investment, and changes in consumers preferences and habits due to adapting to new conditions. This may involve, for
example, new forms of taxation and regulatory restrictions, increases in emission allowance prices, carbon tax, etc. This
can trigger a decline in the value of certain corporate assets as well as a decline in corporate profitability in some sectors.
1 Authors: Martin Motl and Jaromír Tonner. The views expressed in this article are those of the authors and do not necessarily reflect the official
position of the Czech National Bank. The authors would like to thank Ian Hurst (NIESR) for valuable discussions on the model simulations.
2 This is a global econometric model that captures the interconnectedness of all territories of the global economy in detail. For further details on
the NiGEM model and its structure, see Hantzsche, Lopresto and Young (2020). The economic impacts of climate change and global climate
policy were simulated by extending the NiGEM model to include a climate block.
V. —— Focus
Czech National Bank ——— Global Economic Outook ——— September 2021
14
These changes therefore also pose risks to the financial system, with further impacts on the real economy. A gradual
increase in global temperatures will lead to some of the resources from production and innovation being redirected towards
climate change adaptation activities. For example, agricultural commodity prices may increase due to lower supply, as part
of agricultural land will be used to grow energy crops, leaving less land for the cultivation of agricultural crops.
Climate change from a monetary policy perspective
There is a consensus in recent literature3 that the effects of climate change on monetary policy settings will be
significant. In general, the effects of climate change can be divided into long-term and short-term. In the long term, studies
more or less agree that repeated and more frequent natural disasters will lead to lower global economic growth and
reduced demand due to higher precautionary savings and hence to a lower long-term natural real interest rate. In turn,
weakening demand will mean the need for lower interest rates or the use of unconventional instruments if the zero lower
bound is reached. In the short term, both physical and transition risks can also affect inflation in either direction, depending
on whether supply or demand effects are predominant (Batten et al. 2020)). We can draw a certain parallel with the
coronavirus pandemic where the initial assessment of the effects of the pandemic as anti-inflationary (demand) proved too
one-sided. The inflation pressures observed in 2021 are certainly, but not only, the consequence of the “supply-side” nature
of the pandemic crisis which provides a clear message for a restrictive monetary policy response, see e.g. Brůha, Motl and
Tonner (2021).
However, when it comes to describing the specific direction of the monetary policy response to the effects of
climate change in the literature, a high level of caution and ambiguity is exercised. Climate change will affect price
stability through its impact on macroeconomic indicators such as inflation, output, employment, interest rates, investment
and productivity (ECB (2021)). Furthermore, fiscal policy measures aimed at mitigating the effects of climate change will
need to be considered, as they also influence the monetary policy settings. Climate change will also affect the value and
risk profile of assets, potentially leading to an undesirable accumulation of financial risks, see NGFS (2019a). Disruptions to
financial markets and the associated repricing of climate risks may significantly reduce the price of some assets in the
transition to a low-carbon economy. This will result in financial market corrections with spillovers into the real economy and
implications for monetary policy settings. The significant effects of climate change on global demand may also increase the
likelihood of reaching the effective lower bound on nominal interest rates (NGFS (2019b)). Further studies, such as NGFS
(2020a) and Bylund (2020), confirm the above conclusions, although they point out that the scope and spillovers of these
impacts remain highly uncertain. These studies highlight that the primary objective of central banks is mostly to ensure low
and stable inflation, while other objectives (for example, in the area of climate policy) can only be achieved as long as they
are in line with price stability, as central banks cannot arbitrarily broaden their mandate.
Macroeconomic modelling of climate change
Research work4 on climate change indicates a need to rethink and expand the modelling system of central banks.
Allen et al. (2020), for example, address in a study the economic impacts of climate change using different approaches,
including a semi-structural global macroeconomic model (NiGEM), a multisector general equilibrium model and a financial
micro model (with the reporting of financial ratios and the probability of default at company level). The results of this study
show that climate change will reduce GDP in the European Union by 1.0 – 5.0% between 2030 and 2040 (as opposed to
the baseline scenario of a “managed” transition to zero emissions in 2050). The study predicts that some sectors, such as
oil processing, agriculture and mining, will be significantly affected by climate change.
Many studies5 call for a stronger policy response to the threat of climate change, including more ambitious efforts
to mitigate the causes and impacts of climate change. A theoretical growth model, combining variations in climate
variables from their historical averages with labour productivity and long-term economic growth, is being developed as part
of the IMF’s research presented in Kahn et al. (2019). The main idea is to separate the long-term and short-term effects of
climate change on growth, which is essential for designing appropriate mitigation and adaptation policies. As a result of this
distinction, the estimated impacts of climate change are significantly higher than in the literature. An increase in the average
temperature compared with its historical average of 0.04 degrees a year will reduce global real GDP per capita by 7% by
2100. Without climate change adaptation or mitigation policies, the loss of real GDP per capita will therefore be large,
although this will differ significantly from country to country, ranging from 2% to 15% by 2100. Climate change will reduce
labour productivity in the long term, slow investment and harm human health.
The impacts on individual sectors can be estimated using multi-regional input and output models. Hebbink et al.
(2018) use this type of model to calculate the price impacts of carbon tax on individual sectors, also taking into account the
price effects of substitution between energy and primary inputs (capital and labour), as well as substitution between
different types of energy. An annual carbon tax increase of EUR 50 per tonne would not have a major impact for the
3 See Batten et al. (2020), Bylund (2020), Cantelmo (2020), ECB (2021), Economides and Xepapadeas (2018), NGFS (2019b, 2020a).
4 See Aguilar et al. (2021), Allen et al. (2020), Budnik et al. (2020), Cantelmo (2020), Donadelli et al. (2019), Economides and Xepapadeas
(2018), Hebbink et al. (2018), Kahn et al. (2019), Karydas and Xepapadeas (2019).
5 See ECB (2021), Kahn et al. (2019), NGFS (2019a, 2019b, 2020a).
V. —— Focus
Czech National Bank ——— Global Economic Outook ——— September 2021
15
economy as a whole, leading to a decline in GDP of about 1% over a five-year horizon. However, this tax would have a
major impact on a number of carbon-intensive industries. The largest increase in costs would occur in the chemical, metal
processing and mining and quarrying sectors, which would greatly reduce their international competitiveness. Estimates of
the input-output model suggest that the mitigating effects of energy substitution will only be limited.
The incorporation of a climate block into New Keynesian models may contribute to the study of the effects of
climate change on monetary policy. One possible extension of a New Keynesian model is to introduce energy as a
production factor into a production function, as in Economides and Xepapadeas (2018). In this model, energy consumption
generates emissions that increase the concentration of greenhouse gases in the atmosphere and lead to global warming.
Furthermore, the production function is adjusted by a variable in the form of temperature deviation from the pre-industrial
period in order to monitor the negative effects of climate change on production. In the model, businesses face two opposing
effects: first, higher energy consumption increases economic growth; second, higher energy consumption increases
temperature, which leads to more greenhouse gases. Under these assumptions, climate change acts as a new source of
shocks to productivity, which increases the persistence of shocks and strengthens the business cycle. The main conclusion
of the study is that climate change and the use of instruments to mitigate its effects significantly affect monetary policy
settings. In addition, it found that carbon taxes can actually increase economic growth.
Another possible extension of a New Keynesian model is the addition of natural disaster shocks to assess their
impact on monetary policy. Cantelmo (2020) contributes to the ongoing debate on the ex ante and ex post
macroeconomic effects of natural disasters on the natural real interest rate and inflation. Ex ante, a greater risk of natural
disasters increases downward pressure on the natural real interest rate and inflation because of the negative expectations
of economic agents. These effects are substantial and non-linear if extreme natural disasters become more frequent. As a
result, the natural real interest rate shifts to very low levels and inflation falls well below the target. If a disaster occurs, the
effects on the natural real interest rate and inflation may run in both directions depending on whether supply or demand
effects are predominant. From the perspective of the central bank, a variety of responses is therefore needed to keep
inflation at the target. If supply effects are predominant, the natural real interest rate and inflation pick up temporarily and
the central bank raises the monetary policy interest rate. However, if natural disasters have sufficiently strong negative
effects on demand, the natural real interest rate and inflation fall and output losses rise. This contribution thus shows the
importance of integrating the risk of climate change and natural disasters into the analytical tools used by central banks.
Further research work analyses the impact of carbon taxes, subsidies and the possible uses of budget revenue
from carbon taxes. For example, Aguilar et al. (2021) analysed the use of carbon tax revenue as additional government
revenue. Their analysis shows that, if used to reduce income taxes, it may have a positive impact on labour supply and
ultimately have a positive impact on growth in real GDP and employment. Other studies examine the effect of a suitable
combination of carbon tax, subsidies on green energy and asset purchases by central banks on carbon dioxide emissions
and economic activity. A combination of measures appears to be important, as carbon taxes alone may have significant
effects on economic growth due to higher production costs.
Implications of climate change for financial stability
From a financial stability perspective, there seems to be a consensus6 on the consequences of climate change in
the form of risk accumulation in “dirty” high carbon sectors. This will put downward pressure on asset prices, result in
a higher bankruptcy rate, and slow economic growth in these sectors. It will also lead to greater demands and
responsibilities for supervisory authorities in the area of financial stability. At the same time, there is a broad consensus that,
in the future, central banks should also carry out stress tests which allow for the risks associated with climate change.
The risks associated with climate change are already being reflected in asset prices, and will increase the risk
premium and substantially reduce participation in carbon-intensive asset markets. This is the conclusion reached in
Karydas and Xepapadeas (2019), which puts forward a theoretical model for two asset types and for macroeconomic and
environmental shocks. It first separates “brown assets” (which are related to carbon-intensive activities) and “green assets”
(the rest). Furthermore, the model assumes that policy measures are positively correlated with the intensity of
environmental disasters. Climate shocks are caused by emissions resulting from the consumption of brown assets, and
investors’ decisions take into account the fact that portfolios of assets with higher emissions harm the economy.
Risks associated with climate change will lead to a gradual repricing of assets and the value of firms operating in
“dirty” industries in favour of firms operating in “clean” sectors. For example, the main assumption of Donadelli et al.
(2019) is that “dirty” firms are negatively affected by environmental policies. First, a risk awareness index is created by
monitoring the occurrence of the term “climate change risk” both in the literature and on the internet. The results suggest
that growing awareness of climate change-related risks since 2005 has led to a decline in the value of firms that rely heavily
on fossil fuels compared with other firms in the economy. Furthermore, the economic model examines the consequences of
transition risks on asset valuation. In this model, the environmental regulator imposes a carbon tax on the “dirty” sector. The
production of “dirty” goods results in greenhouse gas emissions, increases global temperature and harms the production of
6 See Donadelli et al. (2019), ECB (2021), Karydas and Xepapadeas (2019), NGFS (2019a, 2019b).
V. —— Focus
Czech National Bank ——— Global Economic Outook ——— September 2021
16
“clean” firms. The model suggests that the transition to a higher carbon tax will harm the “dirty” sector but will ultimately
benefit “clean” sectors. Moreover, the model’s asset price predictions are consistent with empirical results – “dirty” firms
decrease in value in the transition period, while “clean” firms increase in value.
Climate risks must be included in bank stress tests. If transition risks translate into deteriorating macroeconomic
conditions, market risk in the form of bank asset repricing and credit risk in the form of deteriorating asset quality must be
assumed. These risks constitute separate shock amplification channels. The ECB developed the BEAST macro-micro
model described in Budnik et al. (2020) to analyse the impact of these risks. This semistructural model contains a very
detailed structure of banks’ financial accounts with their reaction functions depending on the balance of the accounts. The
macro block consists of a structural panel VAR that identifies structural shocks.
Model scenarios of the economic impacts of climate change
As part of model simulations of the impacts of climate change on the global economy, three hypothetical scenarios
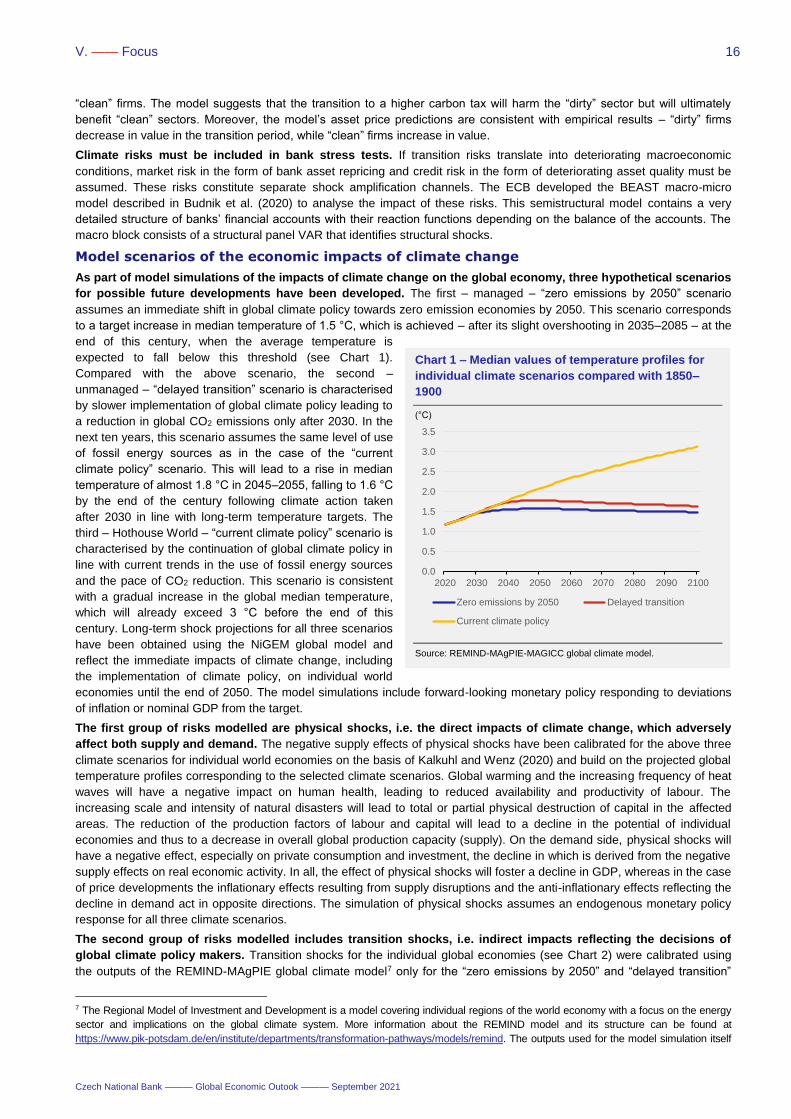
for possible future developments have been developed. The first – managed – “zero emissions by 2050” scenario
assumes an immediate shift in global climate policy towards zero emission economies by 2050. This scenario corresponds
to a target increase in median temperature of 1.5 °C, which is achieved – after its slight overshooting in 2035–2085 – at the
end of this century, when the average temperature is
expected to fall below this threshold (see Chart 1).
Compared with the above scenario, the second –
unmanaged – “delayed transition” scenario is characterised
by slower implementation of global climate policy leading to
a reduction in global CO2 emissions only after 2030. In the
next ten years, this scenario assumes the same level of use
of fossil energy sources as in the case of the “current
climate policy” scenario. This will lead to a rise in median
temperature of almost 1.8 °C in 2045–2055, falling to 1.6 °C
by the end of the century following climate action taken
after 2030 in line with long-term temperature targets. The
third – Hothouse World – “current climate policy” scenario is
characterised by the continuation of global climate policy in
line with current trends in the use of fossil energy sources
and the pace of CO2 reduction. This scenario is consistent
with a gradual increase in the global median temperature,
which will already exceed 3 °C before the end of this
century. Long-term shock projections for all three scenarios
have been obtained using the NiGEM global model and
reflect the immediate impacts of climate change, including
the implementation of climate policy, on individual world
economies until the end of 2050. The model simulations include forward-looking monetary policy responding to deviations
of inflation or nominal GDP from the target.
The first group of risks modelled are physical shocks, i.e. the direct impacts of climate change, which adversely
affect both supply and demand. The negative supply effects of physical shocks have been calibrated for the above three
climate scenarios for individual world economies on the basis of Kalkuhl and Wenz (2020) and build on the projected global
temperature profiles corresponding to the selected climate scenarios. Global warming and the increasing frequency of heat
waves will have a negative impact on human health, leading to reduced availability and productivity of labour. The
increasing scale and intensity of natural disasters will lead to total or partial physical destruction of capital in the affected
areas. The reduction of the production factors of labour and capital will lead to a decline in the potential of individual
economies and thus to a decrease in overall global production capacity (supply). On the demand side, physical shocks will
have a negative effect, especially on private consumption and investment, the decline in which is derived from the negative
supply effects on real economic activity. In all, the effect of physical shocks will foster a decline in GDP, whereas in the case
of price developments the inflationary effects resulting from supply disruptions and the anti-inflationary effects reflecting the
decline in demand act in opposite directions. The simulation of physical shocks assumes an endogenous monetary policy
response for all three climate scenarios.
The second group of risks modelled includes transition shocks, i.e. indirect impacts reflecting the decisions of
global climate policy makers. Transition shocks for the individual global economies (see Chart 2) were calibrated using
the outputs of the REMIND-MAgPIE global climate model7 only for the “zero emissions by 2050” and “delayed transition”
7 The Regional Model of Investment and Development is a model covering individual regions of the world economy with a focus on the energy
sector and implications on the global climate system. More information about the REMIND model and its structure can be found at
https://www.pik-potsdam.de/en/institute/departments/transformation-pathways/models/remind. The outputs used for the model simulation itself
Chart 1 – Median values of temperature profiles for
individual climate scenarios compared with 1850–
1900
(°C)
Source: REMIND-MAgPIE-MAGICC global climate model.
0.0
0.5
1.0
1.5
2.0
2.5
3.0
3.5
2020 2030 2040 2050 2060 2070 2080 2090 2100
Zero emissions by 2050 Delayed transition
Current climate policy
V. —— Focus
Czech National Bank ——— Global Economic Outook ——— September 2021
17
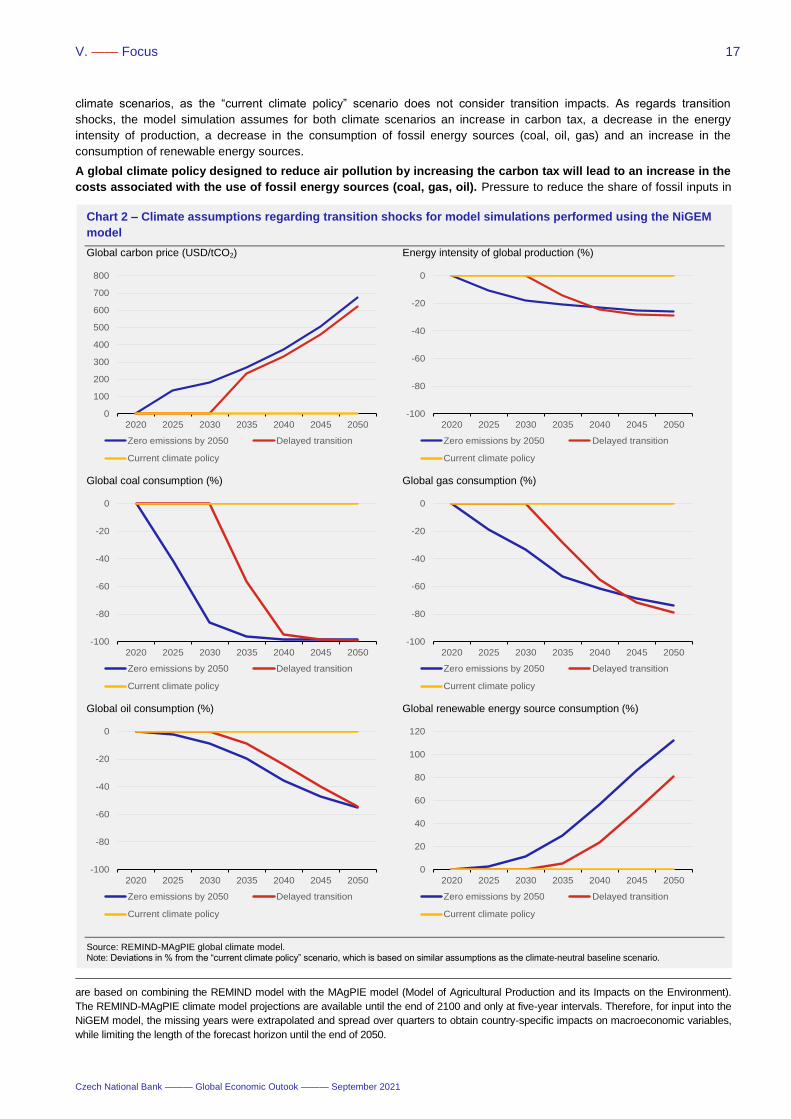
climate scenarios, as the “current climate policy” scenario does not consider transition impacts. As regards transition
shocks, the model simulation assumes for both climate scenarios an increase in carbon tax, a decrease in the energy
intensity of production, a decrease in the consumption of fossil energy sources (coal, oil, gas) and an increase in the
consumption of renewable energy sources.
A global climate policy designed to reduce air pollution by increasing the carbon tax will lead to an increase in the
costs associated with the use of fossil energy sources (coal, gas, oil). Pressure to reduce the share of fossil inputs in
are based on combining the REMIND model with the MAgPIE model (Model of Agricultural Production and its Impacts on the Environment).
The REMIND-MAgPIE climate model projections are available until the end of 2100 and only at five-year intervals. Therefore, for input into the
NiGEM model, the missing years were extrapolated and spread over quarters to obtain country-specific impacts on macroeconomic variables,
while limiting the length of the forecast horizon until the end of 2050.
Chart 2 – Climate assumptions regarding transition shocks for model simulations performed using the NiGEM
model
Global carbon price (USD/tCO2) Energy intensity of global production (%)
Global coal consumption (%) Global gas consumption (%)
Global oil consumption (%) Global renewable energy source consumption (%)
Source: REMIND-MAgPIE global climate model. Note: Deviations in % from the “current climate policy” scenario, which is based on similar assumptions as the climate-neutral baseline scenario.
0
100
200
300
400
500
600
700
800
2020 2025 2030 2035 2040 2045 2050
Zero emissions by 2050 Delayed transition
Current climate policy
-100
-80
-60
-40
-20
0
2020 2025 2030 2035 2040 2045 2050
Zero emissions by 2050 Delayed transition
Current climate policy
-100
-80
-60
-40
-20
0
2020 2025 2030 2035 2040 2045 2050
Zero emissions by 2050 Delayed transition
Current climate policy
-100
-80
-60
-40
-20
0
2020 2025 2030 2035 2040 2045 2050
Zero emissions by 2050 Delayed transition
Current climate policy
-100
-80
-60
-40
-20
0
2020 2025 2030 2035 2040 2045 2050
Zero emissions by 2050 Delayed transition
Current climate policy
0
20
40
60
80
100
120
2020 2025 2030 2035 2040 2045 2050
Zero emissions by 2050 Delayed transition
Current climate policy
V. —— Focus
Czech National Bank ——— Global Economic Outook ——— September 2021
18
production will result in lower productivity (a negative supply shock) and will therefore be an additional inflationary factor. A
fall in consumption and fossil commodity prices will have the opposite effect on inflation, while the consumption of
renewable energy sources preferred by global climate policy will grow over time. Carbon tax revenue will have a positive
effect on national public budgets in the form of an additional source of revenue. The simulation of transition shocks for the
“zero emissions by 2050” and “delayed transition” scenarios envisages an endogenous monetary policy response, which is,
overall, an inflationary mix of cost and negative supply shocks with negative effects on GDP in both cases. However, in the
next step, the assumptions of the two scenarios already diverge, as the model simulation of the “zero emissions by 2050”
climate scenario assumes that fifty per cent of the revenues generated by the carbon tax increase from the start of the
forecast horizon will be reinvested in the economy by governments. Furthermore, this simulation assumes that the central
bank does not react to this partial positive demand shock by tightening monetary policy so as to avoid implementing
contradictory economic policies in response to the inflationary effects of government expansionary fiscal policy. The
remaining half of the revenue from the carbon tax will be used to reduce government debt. In the “delayed transition”
climate scenario, which involves a ten-year delay in the carbon tax increase and slower growth in the tax in subsequent
years and thus lower revenue compared with the previous scenario, the additional revenue goes directly to national
government budgets via endogenous modelling mechanisms. This additional budgetary revenue will lead, among other
things, to a gradual adjustment of income tax and its reduction depending on the target debt levels of individual economies.
Furthermore, after 2030 this positive demand shock is be dampened over the subsequent five years by negative sentiment
of households and firms, which is shaken by the sudden change in the direction of climate policy. The delays in the
implementation of climate policy will result in lower willingness of households to consume and an increase in precautionary
savings. The increased uncertainty caused by the rapid introduction of new regulatory measures will also foster an increase
in the risk premium and a decline in business investment activity.
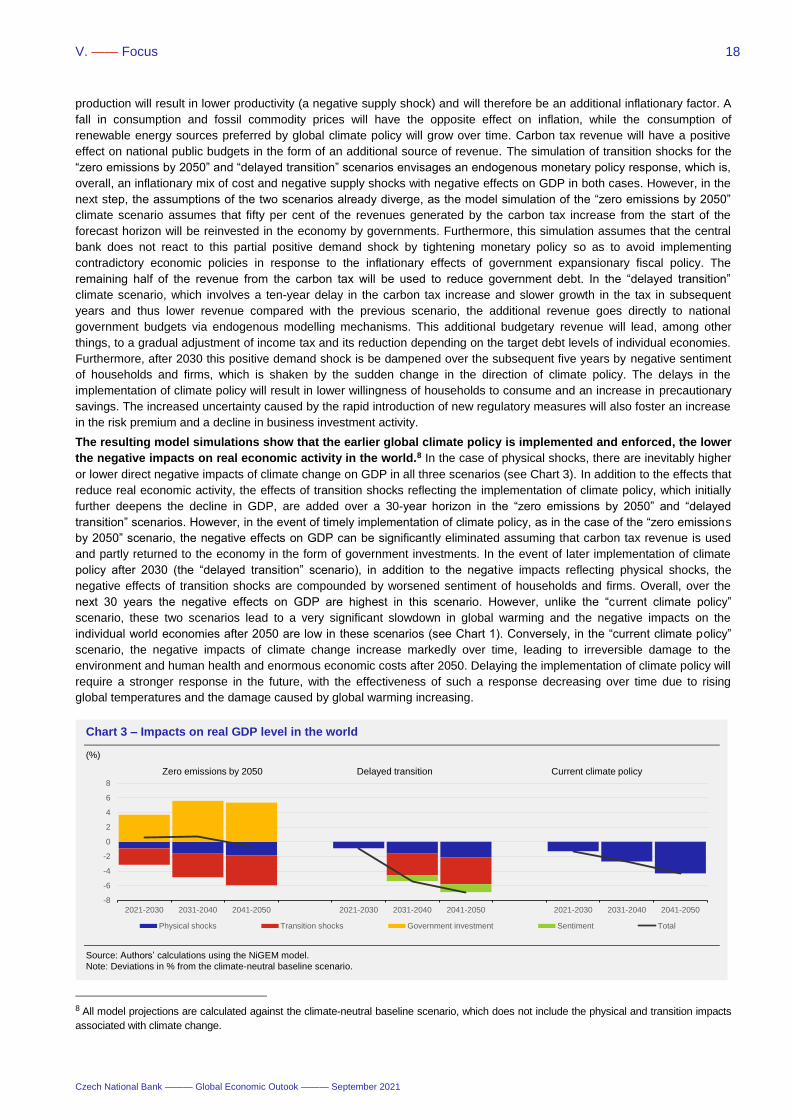
The resulting model simulations show that the earlier global climate policy is implemented and enforced, the lower
the negative impacts on real economic activity in the world.8 In the case of physical shocks, there are inevitably higher
or lower direct negative impacts of climate change on GDP in all three scenarios (see Chart 3). In addition to the effects that
reduce real economic activity, the effects of transition shocks reflecting the implementation of climate policy, which initially
further deepens the decline in GDP, are added over a 30-year horizon in the “zero emissions by 2050” and “delayed
transition” scenarios. However, in the event of timely implementation of climate policy, as in the case of the “zero emissions
by 2050” scenario, the negative effects on GDP can be significantly eliminated assuming that carbon tax revenue is used
and partly returned to the economy in the form of government investments. In the event of later implementation of climate
policy after 2030 (the “delayed transition” scenario), in addition to the negative impacts reflecting physical shocks, the
negative effects of transition shocks are compounded by worsened sentiment of households and firms. Overall, over the
next 30 years the negative effects on GDP are highest in this scenario. However, unlike the “current climate policy”
scenario, these two scenarios lead to a very significant slowdown in global warming and the negative impacts on the
individual world economies after 2050 are low in these scenarios (see Chart 1). Conversely, in the “current climate policy”
scenario, the negative impacts of climate change increase markedly over time, leading to irreversible damage to the
environment and human health and enormous economic costs after 2050. Delaying the implementation of climate policy will
require a stronger response in the future, with the effectiveness of such a response decreasing over time due to rising
global temperatures and the damage caused by global warming increasing.
8 All model projections are calculated against the climate-neutral baseline scenario, which does not include the physical and transition impacts
associated with climate change.
Chart 3 – Impacts on real GDP level in the world
(%)
Source: Authors’ calculations using the NiGEM model.
Note: Deviations in % from the climate-neutral baseline scenario.
-8
-6
-4
-2
0
2
4
6
8
2021-2030 2031-2040 2041-2050 2021-2030 2031-2040 2041-2050 2021-2030 2031-2040 2041-2050
Physical shocks Transition shocks Government investment Sentiment Total
Zero emissions by 2050 Delayed transition Current climate policy
V. —— Focus
Czech National Bank ——— Global Economic Outook ——— September 2021
19
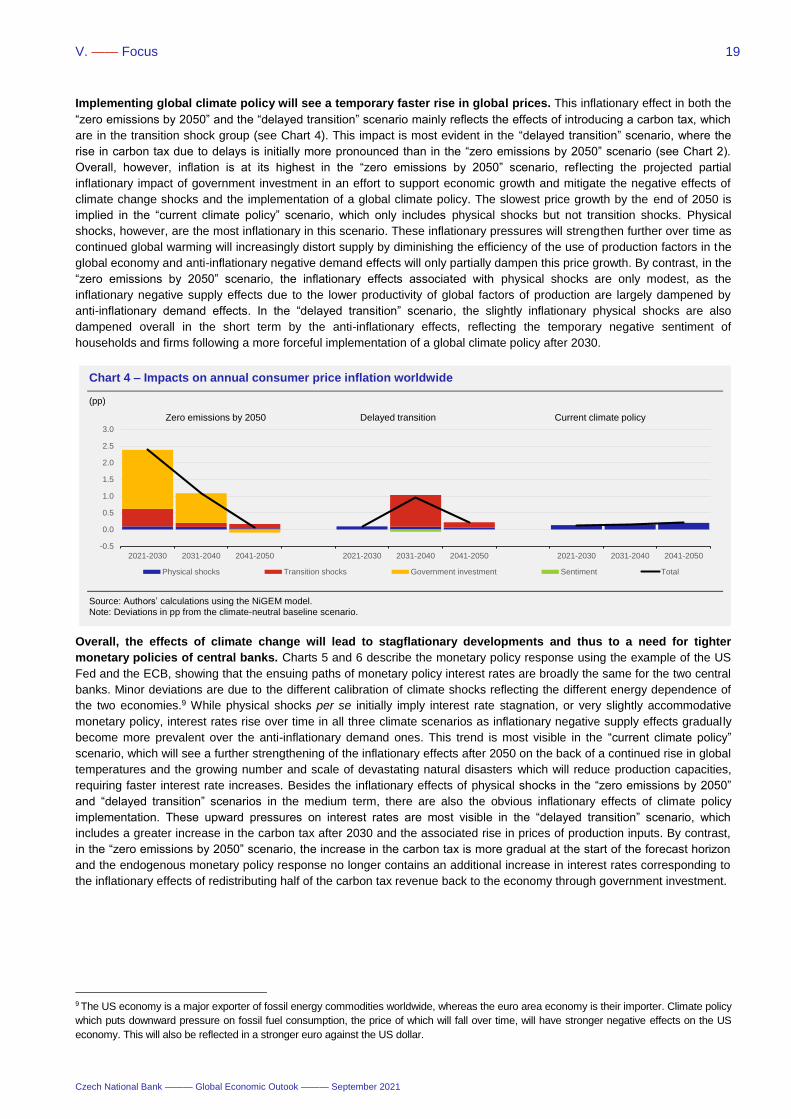
Implementing global climate policy will see a temporary faster rise in global prices. This inflationary effect in both the
“zero emissions by 2050” and the “delayed transition” scenario mainly reflects the effects of introducing a carbon tax, which
are in the transition shock group (see Chart 4). This impact is most evident in the “delayed transition” scenario, where the
rise in carbon tax due to delays is initially more pronounced than in the “zero emissions by 2050” scenario (see Chart 2).
Overall, however, inflation is at its highest in the “zero emissions by 2050” scenario, reflecting the projected partial
inflationary impact of government investment in an effort to support economic growth and mitigate the negative effects of
climate change shocks and the implementation of a global climate policy. The slowest price growth by the end of 2050 is
implied in the “current climate policy” scenario, which only includes physical shocks but not transition shocks. Physical
shocks, however, are the most inflationary in this scenario. These inflationary pressures will strengthen further over time as
continued global warming will increasingly distort supply by diminishing the efficiency of the use of production factors in the
global economy and anti-inflationary negative demand effects will only partially dampen this price growth. By contrast, in the
“zero emissions by 2050” scenario, the inflationary effects associated with physical shocks are only modest, as the
inflationary negative supply effects due to the lower productivity of global factors of production are largely dampened by
anti-inflationary demand effects. In the “delayed transition” scenario, the slightly inflationary physical shocks are also
dampened overall in the short term by the anti-inflationary effects, reflecting the temporary negative sentiment of
households and firms following a more forceful implementation of a global climate policy after 2030.
Overall, the effects of climate change will lead to stagflationary developments and thus to a need for tighter
monetary policies of central banks. Charts 5 and 6 describe the monetary policy response using the example of the US
Fed and the ECB, showing that the ensuing paths of monetary policy interest rates are broadly the same for the two central
banks. Minor deviations are due to the different calibration of climate shocks reflecting the different energy dependence of
the two economies.9 While physical shocks per se initially imply interest rate stagnation, or very slightly accommodative
monetary policy, interest rates rise over time in all three climate scenarios as inflationary negative supply effects gradually
become more prevalent over the anti-inflationary demand ones. This trend is most visible in the “current climate policy”
scenario, which will see a further strengthening of the inflationary effects after 2050 on the back of a continued rise in global
temperatures and the growing number and scale of devastating natural disasters which will reduce production capacities,
requiring faster interest rate increases. Besides the inflationary effects of physical shocks in the “zero emissions by 2050”
and “delayed transition” scenarios in the medium term, there are also the obvious inflationary effects of climate policy
implementation. These upward pressures on interest rates are most visible in the “delayed transition” scenario, which
includes a greater increase in the carbon tax after 2030 and the associated rise in prices of production inputs. By contrast,
in the “zero emissions by 2050” scenario, the increase in the carbon tax is more gradual at the start of the forecast horizon
and the endogenous monetary policy response no longer contains an additional increase in interest rates corresponding to
the inflationary effects of redistributing half of the carbon tax revenue back to the economy through government investment.
9 The US economy is a major exporter of fossil energy commodities worldwide, whereas the euro area economy is their importer. Climate policy
which puts downward pressure on fossil fuel consumption, the price of which will fall over time, will have stronger negative effects on the US
economy. This will also be reflected in a stronger euro against the US dollar.
Chart 4 – Impacts on annual consumer price inflation worldwide
(pp)
Source: Authors’ calculations using the NiGEM model. Note: Deviations in pp from the climate-neutral baseline scenario.
-0.5
0.0
0.5
1.0
1.5
2.0
2.5
3.0
2021-2030 2031-2040 2041-2050 2021-2030 2031-2040 2041-2050 2021-2030 2031-2040 2041-2050
Physical shocks Transition shocks Government investment Sentiment Total
Zero emissions by 2050 Delayed transition Current climate policy
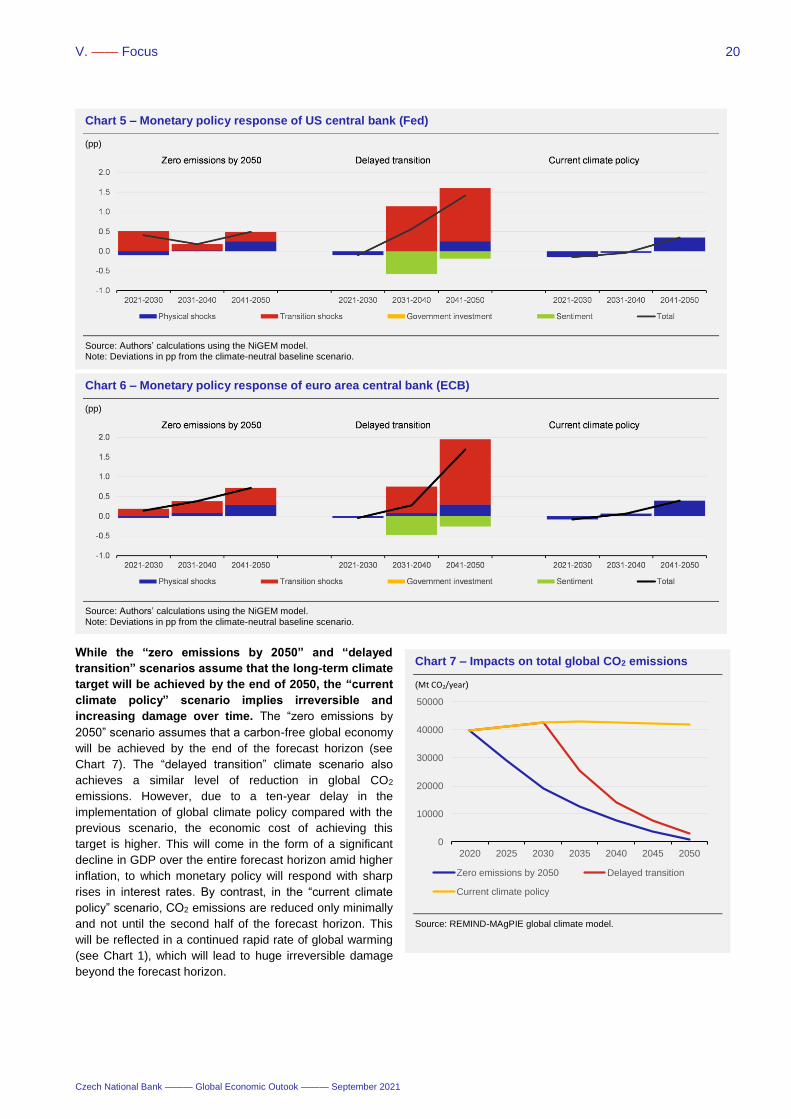
V. —— Focus
Czech National Bank ——— Global Economic Outook ——— September 2021
20
While the “zero emissions by 2050” and “delayed
transition” scenarios assume that the long-term climate
target will be achieved by the end of 2050, the “current
climate policy” scenario implies irreversible and
increasing damage over time. The “zero emissions by
2050” scenario assumes that a carbon-free global economy
will be achieved by the end of the forecast horizon (see
Chart 7). The “delayed transition” climate scenario also
achieves a similar level of reduction in global CO2
emissions. However, due to a ten-year delay in the
implementation of global climate policy compared with the
previous scenario, the economic cost of achieving this
target is higher. This will come in the form of a significant
decline in GDP over the entire forecast horizon amid higher
inflation, to which monetary policy will respond with sharp
rises in interest rates. By contrast, in the “current climate
policy” scenario, CO2 emissions are reduced only minimally
and not until the second half of the forecast horizon. This
will be reflected in a continued rapid rate of global warming
(see Chart 1), which will lead to huge irreversible damage
beyond the forecast horizon.
Chart 7 – Impacts on total global CO2 emissions
(Mt CO2/year)
Source: REMIND-MAgPIE global climate model.
0
10000
20000
30000
40000
50000
2020 2025 2030 2035 2040 2045 2050
Zero emissions by 2050 Delayed transition
Current climate policy
Chart 5 – Monetary policy response of US central bank (Fed)
(pp)
Source: Authors’ calculations using the NiGEM model. Note: Deviations in pp from the climate-neutral baseline scenario.
Chart 6 – Monetary policy response of euro area central bank (ECB)
(pp)
Source: Authors’ calculations using the NiGEM model. Note: Deviations in pp from the climate-neutral baseline scenario.
V. —— Focus
Czech National Bank ——— Global Economic Outook ——— September 2021
21
Conclusion
Current research suggests a need to reassess and expand central banks’ analytical systems to include models
capturing the economic impacts of climate change. Climate change and the transition to low carbon emission
economies will increasingly influence price stability through its impacts on macroeconomic indicators such as real economic
activity, output, employment, interest rates, investment and productivity. We can also expect climate change to affect the
area of financial stability and monetary policy. Models including climate change variables may be an example of a possible
expansion of the analytical portfolio (see the NiGEM model). Central banks should also carry out financial sector stress
tests with both transition shocks and sudden and unexpected physical shocks.
Model simulations show that climate change will have global stagflationary effects overall. This long-term and
intensifying partial shock beyond the normal business cycle will foster higher inflation and slower economic growth. This is
illustrated by analyses carried out using the NiGEM global model and three hypothetical climate scenarios, i.e. the “zero
emissions by 2050”, “delayed transition” and “current climate policy” scenarios. The simulations include the direct effects of
climate change (physical shocks) which lead overall to a decline in GDP and rising prices, as the inflationary effects
resulting from supply disruptions outweigh the anti-inflationary effects reflecting lower demand. On the supply side, global
warming and the associated rising frequency and scale of devastating natural disasters will be reflected in a reduction in the
production factors of labour and capital, leading to a decline in the potential of individual economies and thus to a reduction
in overall global production capacity. The negative demand impacts will be felt in a decline in private consumption and
investment. The “zero emissions by 2050” and “delayed transition” simulations include additional risks (transition shocks)
which take into account shocks reflecting the impacts of global climate policy, i.e. an increase in carbon tax, a decrease in
the energy intensity of production, a decrease in the consumption of fossil energy sources (coal, oil, gas) and an increase in
the consumption of renewable energy sources. Overall, these additional factors will also manifest themselves as an
inflationary cost shock and a negative supply shock with negative effects on GDP.
Climate change and the associated economic effects bring about a need for tighter monetary policy globally. This
conclusion based on model simulations is demonstrated using the example of Fed and ECB monetary policy. While
physical shocks imply interest rate stagnation in the short term, or a very slightly accommodative monetary policy, the
strengthening inflationary effect of the negative supply-side effects will lead to interest rate growth in all three climate
scenarios over the forecast horizon. The clear inflationary effects of global climate policy implementation in the context of
transition shocks add to the slight inflationary effects of physical shocks in the “zero emissions by 2050” and “delayed
transition” scenarios.
The climate scenarios assume that postponing the implementation of global climate policy will lead not only to
higher economic costs, but mainly to irreversible damage to the environment and human health. The results of the
analyses show that, in the event of timely implementation of global climate policy (see the “zero emissions by 2050”
scenario), a more pronounced decline in real economic activity can be avoided at the cost of higher inflation in the short
term. This scenario means a long-term sustainable temperature profile reflecting the transition towards a carbon-free global
economy by the end of 2050. A similar level of reduction of CO2 emissions is achieved in the “delayed transition” scenario,
but at higher economic costs. By contrast, the “current climate policy” scenario, which has a minimal impact on reducing
CO2 emissions, would lead to long-term growth in the global temperature profile coupled with huge and lasting damage.
References
Aguilar, P., González, B., Hurtado, S. (2021). The design of macroeconomic scenarios for climate change stress tests.
Financial Stability Review, Issue 40, Banco de Espaňa, p. 191, Spring 2021, 0_FSR_40_Spring_2021.pdf (bde.es).
Allen, T., Dees, S., Boissinot J., Graciano, C., Chouard, V. , Clerc, L. , Gaye, A., Devulder, A., Diot, S., Lisack, N.,
Pegoraro, F., Rabaté, M., Svartzman, R., Vernetet, L. (2020). Climate-Related Scenarios for Financial Stability Assessment:
an Application to France. BdF Working Paper 774, July 2020, wp774.pdf (banque-france.fr).
Batten, S., Sowerbutts, R., Tanaka, M. (2020). Climate change: Macroeconomic impact and implications for monetary
policy. Book chapter in: Ecological, Societal, and Technological Risks and the Financial Sector, July 2020, Batten-
Sowerbutts-Tanaka-Climate-change-Macroeconomic-impact-and-implications-for-monetary-policy.pdf (frbsf.org).
Brůha, J., Motl, M., Tonner, J. (2021). Assessment of the impacts of the pandemic on the world’s major economies: A crisis
of supply or demand? Global Economic Outlook, Czech National Bank, May.
Brzoska, M., Fröhlich, C. (2015). Climate Change, Migration and Violent Conflict: Vulnerabilities, Pathways and Adaptation
Strategies. Migration and Development 5 (2): 190–210. March 2015.Budnik, K., Balatti, M., Dimitrov, I., Groß, J., Kleemann,
M., Reichenbachas, T., Sanna, F., Sarychev, A., Siņenko, N., Volk, M. (2020). Banking euro area stress test model. ECB
Working Paper, No 2469, September 2020, Macroprudential stress test of the euro area banking system (econstor.eu).
Bylund, E., Jonsson, M. (2020). How does climate change affect the long-run real interest rate? Economic Commentaries,
Sveriges Riksbank, No. 11, 2020, How does climate change affect the long run real interest rate (riksbank.se).
Cantelmo, A. (2020). Rare disasters, the natural interest rate and monetary policy. Banca d’Italia Working Paper, 1309,
December 2020, en_tema_1309.pdf (bancaditalia.it).
V. —— Focus
Czech National Bank ——— Global Economic Outook ——— September 2021
22
Donadelli, M., Grüning, P., Hitzemann, S. (2019). Understanding Macro and Asset Price Dynamics During the Climate
Transition. Lietuvos Bankas Discussion Paper Series, 18 (2019), December 2019, Discussion Paper Series No 18 (lb.lt).
ECB (2021). ECB presents action plan to include climate change considerations in its monetary policy strategy. Press
Release, 8 July 2021, ECB presents action plan to include climate change considerations in its monetary policy strategy
(europa.eu).
Economides, G., Xepapadeas, A. (2018). Monetary policy under climate change. Bank of Greece Working Paper, 247, May
2018, Paper2018247.pdf (bankofgreece.gr).
Hantzsche, A., Lopresto, M., Young, G. (2020). Using NiGEM in uncertain times: Introduction and overview of NiGEM.
Cambridge University Press, January 2020.
Hebbink, G., Berkvens, L., Bun, M., van Kerkhoff, H., Koistinen, J., Schotten, G., Stokman, A. (2018). The price of transition
an analysis of the economic implications of carbon taxing, Occasional Studies, Volume 16 – 8, De Nederlandsche Bank,
2018, OS The price of transition (dnb.nl).
Kahn, M. E., Mohaddes, K., Ng, R. N. C. ; Pesaran, M. H., Raissi, M., Yang, J. (2019). Long-Term Macroeconomic Effects
of Climate Change: A Cross-Country Analysis. IMF Working Paper No. 19/215, October 2019,
https://www.imf.org/en/Publications/WP/Issues/2019/10/11/Long-Term-Macroeconomic-Effects-of-Climate-Change-A-
Cross-Country-Analysis-48691 Kalkuhl, M., Wenz, L. (2020). The impact of climate conditions on economic production.
Evidence from a global panel of regions. Journal of Environmental Economics and Management, 103, 102360, The impact
of climate conditions on economic production. Evidence from a global panel of regions - ScienceDirect.
Karydas, C., Xepapadeas, A. (2019). Climate change financial risks: pricing and portfolio allocation. ETH Zurich Working
Paper, November 2019, WP-19-327.pdf (ethz.ch).
NGFS (2019a). A call for action: Climate change as a source of financial risk. First Comprehensive report, Network for
Greening the Financial System, Paris, France. synthese_ngfs-2019_-_17042019_0.pdf.
NGFS (2019b). Macroeconomic and financial stability: Implications of climate change. Technical supplement to the First
NGFS Comprehensive Report, Network for Greening the Financial System, Paris, France,
ngfs_research_priorities_final.pdf.
NGFS (2020a). Climate Change and Monetary Policy: Initial takeaways. Network for Greening the Financial System,
prepared by the workstream of the NGFS, chaired by Sabine Mauderer from the Deutsche Bundesbank. Climate Change
and Monetary Policy Initial takeaways (bundesbank.de).
Rigaud, K. K., De Sherbinin, A., Jones, B., Bergmann, J., Clement, V., Ober, K., Schewe, J., Adamo, S., McCusker, B.,
Heuser, S., Midgley, A. (2018). Groundswell: Preparing for Internal Climate Migration. World Bank, Washington, DC.
Keywords
climate change, monetary policy, macroeconomic modelling
JEL Classification
E2, E37, E4, E58, G11, G12, G21, G28, Q43, O44, Q51, Q54
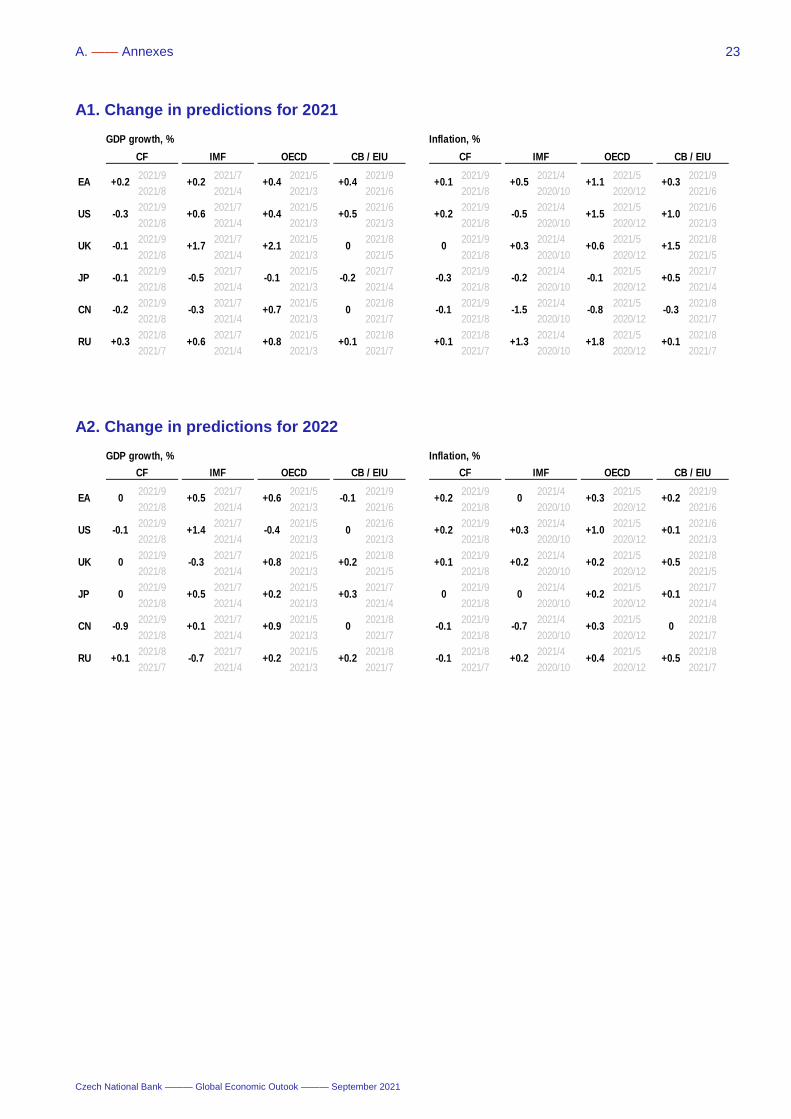
A. —— Annexes
Czech National Bank ——— Global Economic Outook ——— September 2021
23
A1. Change in predictions for 2021
A2. Change in predictions for 2022
GDP growth, % Inflation, %
2021/9 2021/7 2021/5 2021/9 2021/9 2021/4 2021/5 2021/9
2021/8 2021/4 2021/3 2021/6 2021/8 2020/10 2020/12 2021/6
2021/9 2021/7 2021/5 2021/6 2021/9 2021/4 2021/5 2021/6
2021/8 2021/4 2021/3 2021/3 2021/8 2020/10 2020/12 2021/3
2021/9 2021/7 2021/5 2021/8 2021/9 2021/4 2021/5 2021/8
2021/8 2021/4 2021/3 2021/5 2021/8 2020/10 2020/12 2021/5
2021/9 2021/7 2021/5 2021/7 2021/9 2021/4 2021/5 2021/7
2021/8 2021/4 2021/3 2021/4 2021/8 2020/10 2020/12 2021/4
2021/9 2021/7 2021/5 2021/8 2021/9 2021/4 2021/5 2021/8
2021/8 2021/4 2021/3 2021/7 2021/8 2020/10 2020/12 2021/7
2021/8 2021/7 2021/5 2021/8 2021/8 2021/4 2021/5 2021/8
2021/7 2021/4 2021/3 2021/7 2021/7 2020/10 2020/12 2021/7RU +0.3
-0.2CN
+1.7
-0.5
-0.1 +2.1 0
-0.3 +0.7 0 -0.3
+1.3 +1.8 +0.1
+0.3 +0.6 +1.5
+0.1+0.6
OECD CB / EIU
+0.4 +0.4EA +0.2
-0.3 +0.4
+0.2
+0.6 +0.5US
CF IMF
+0.1
+0.2
0
+0.8
-0.1 -0.2-0.1JP
UK
+0.1
-0.2 -0.1 +0.5-0.3
-0.1 -1.5 -0.8
CF IMF OECD CB / EIU
+0.5 +1.1 +0.3
-0.5 +1.5 +1.0
GDP growth, % Inflation, %
2021/9 2021/7 2021/5 2021/9 2021/9 2021/4 2021/5 2021/9
2021/8 2021/4 2021/3 2021/6 2021/8 2020/10 2020/12 2021/6
2021/9 2021/7 2021/5 2021/6 2021/9 2021/4 2021/5 2021/6
2021/8 2021/4 2021/3 2021/3 2021/8 2020/10 2020/12 2021/3
2021/9 2021/7 2021/5 2021/8 2021/9 2021/4 2021/5 2021/8
2021/8 2021/4 2021/3 2021/5 2021/8 2020/10 2020/12 2021/5
2021/9 2021/7 2021/5 2021/7 2021/9 2021/4 2021/5 2021/7
2021/8 2021/4 2021/3 2021/4 2021/8 2020/10 2020/12 2021/4
2021/9 2021/7 2021/5 2021/8 2021/9 2021/4 2021/5 2021/8
2021/8 2021/4 2021/3 2021/7 2021/8 2020/10 2020/12 2021/7
2021/8 2021/7 2021/5 2021/8 2021/8 2021/4 2021/5 2021/8
2021/7 2021/4 2021/3 2021/7 2021/7 2020/10 2020/12 2021/7
-0.1 -0.7 +0.3 0
-0.1 +0.2 +0.4 +0.5
+0.1 +0.2 +0.2 +0.5
0 0 +0.2 +0.1
+0.2 +0.3 +1.0 +0.1
CF IMF OECD CB / EIU
+0.2 0 +0.3 +0.2-0.1+0.5 +0.6
CF IMF
-0.7 +0.2 +0.2
+0.2
-0.4+1.4
+0.30 +0.5 +0.2
-0.9 +0.1 +0.9 0
0
RU
JP
CN
UK
-0.1
EA 0
0
US
OECD CB / EIU
-0.3 +0.8
+0.1
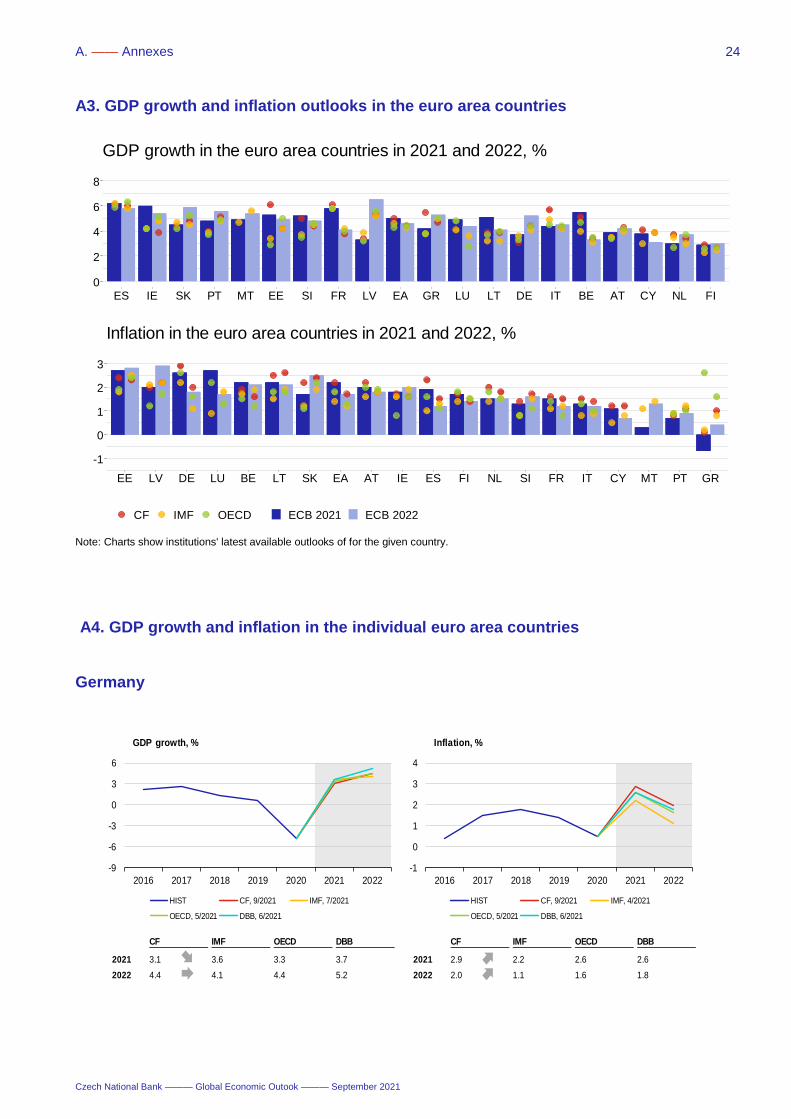
A. —— Annexes
Czech National Bank ——— Global Economic Outook ——— September 2021
24
A3. GDP growth and inflation outlooks in the euro area countries
Note: Charts show institutions' latest available outlooks of for the given country.
A4. GDP growth and inflation in the individual euro area countries
Germany
0
2
4
6
8
ES IE SK PT MT EE SI FR LV EA GR LU LT DE IT BE AT CY NL FI
CF IMF OECD ECB 2021 ECB 2022
GDP growth in the euro area countries in 2021 and 2022, %
-1
0
1
2
3
EE LV DE LU BE LT SK EA AT IE ES FI NL SI FR IT CY MT PT GR
CF IMF OECD ECB 2021 ECB 2022
Inflation in the euro area countries in 2021 and 2022, %
CF IMF OECD DBB CF IMF OECD DBB
2021 3.1 3.6 3.3 3.7 2021 2.9 2.2 2.6 2.6
2022 4.4 4.1 4.4 5.2 2022 2.0 1.1 1.6 1.8
-9
-6
-3
0
3
6
2016 2017 2018 2019 2020 2021 2022
GDP growth, %
HIST CF, 9/2021 IMF, 7/2021
OECD, 5/2021 DBB, 6/2021
-1
0
1
2
3
4
2016 2017 2018 2019 2020 2021 2022
Inflation, %
HIST CF, 9/2021 IMF, 4/2021
OECD, 5/2021 DBB, 6/2021
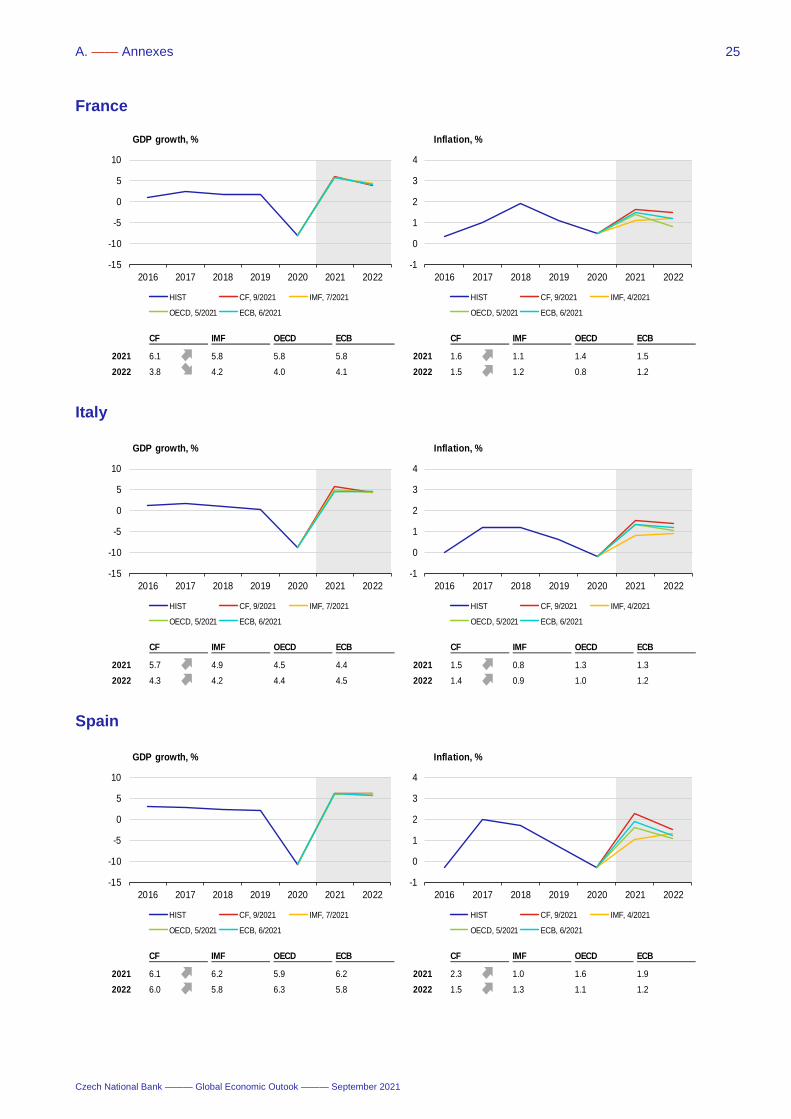
A. —— Annexes
Czech National Bank ——— Global Economic Outook ——— September 2021
25
France
Italy
Spain
CF IMF OECD ECB CF IMF OECD ECB
2021 5.7 4.9 4.5 4.4 2021 1.5 0.8 1.3 1.3
2022 4.3 4.2 4.4 4.5 2022 1.4 0.9 1.0 1.2
-15
-10
-5
0
5
10
2016 2017 2018 2019 2020 2021 2022
GDP growth, %
HIST CF, 9/2021 IMF, 7/2021
OECD, 5/2021 ECB, 6/2021
-1
0
1
2
3
4
2016 2017 2018 2019 2020 2021 2022
Inflation, %
HIST CF, 9/2021 IMF, 4/2021
OECD, 5/2021 ECB, 6/2021
CF IMF OECD ECB CF IMF OECD ECB
2021 6.1 6.2 5.9 6.2 2021 2.3 1.0 1.6 1.9
2022 6.0 5.8 6.3 5.8 2022 1.5 1.3 1.1 1.2
-15
-10
-5
0
5
10
2016 2017 2018 2019 2020 2021 2022
GDP growth, %
HIST CF, 9/2021 IMF, 7/2021
OECD, 5/2021 ECB, 6/2021
-1
0
1
2
3
4
2016 2017 2018 2019 2020 2021 2022
Inflation, %
HIST CF, 9/2021 IMF, 4/2021
OECD, 5/2021 ECB, 6/2021
CF IMF OECD ECB CF IMF OECD ECB
2021 6.1 5.8 5.8 5.8 2021 1.6 1.1 1.4 1.5
2022 3.8 4.2 4.0 4.1 2022 1.5 1.2 0.8 1.2
-15
-10
-5
0
5
10
2016 2017 2018 2019 2020 2021 2022
GDP growth, %
HIST CF, 9/2021 IMF, 7/2021
OECD, 5/2021 ECB, 6/2021
-1
0
1
2
3
4
2016 2017 2018 2019 2020 2021 2022
Inflation, %
HIST CF, 9/2021 IMF, 4/2021
OECD, 5/2021 ECB, 6/2021
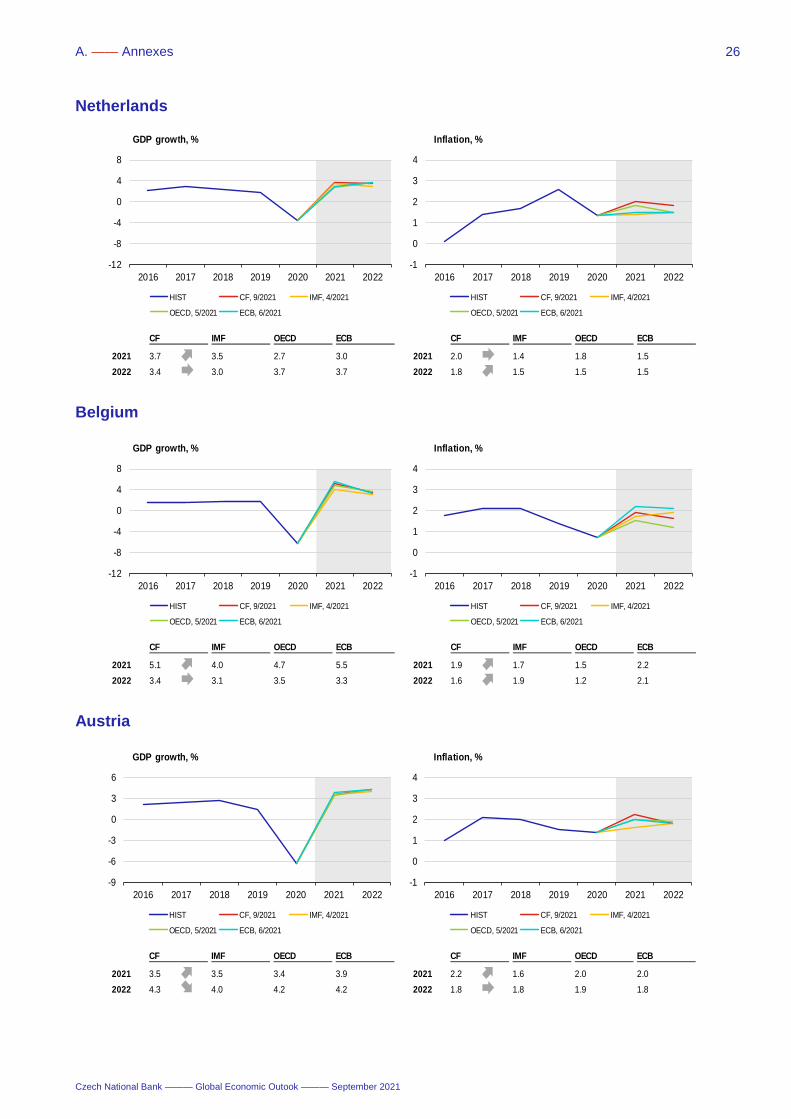
A. —— Annexes
Czech National Bank ——— Global Economic Outook ——— September 2021
26
Netherlands
Belgium
Austria
CF IMF OECD ECB CF IMF OECD ECB
2021 5.1 4.0 4.7 5.5 2021 1.9 1.7 1.5 2.2
2022 3.4 3.1 3.5 3.3 2022 1.6 1.9 1.2 2.1
-12
-8
-4
0
4
8
2016 2017 2018 2019 2020 2021 2022
GDP growth, %
HIST CF, 9/2021 IMF, 4/2021
OECD, 5/2021 ECB, 6/2021
-1
0
1
2
3
4
2016 2017 2018 2019 2020 2021 2022
Inflation, %
HIST CF, 9/2021 IMF, 4/2021
OECD, 5/2021 ECB, 6/2021
CF IMF OECD ECB CF IMF OECD ECB
2021 3.5 3.5 3.4 3.9 2021 2.2 1.6 2.0 2.0
2022 4.3 4.0 4.2 4.2 2022 1.8 1.8 1.9 1.8
-9
-6
-3
0
3
6
2016 2017 2018 2019 2020 2021 2022
GDP growth, %
HIST CF, 9/2021 IMF, 4/2021
OECD, 5/2021 ECB, 6/2021
-1
0
1
2
3
4
2016 2017 2018 2019 2020 2021 2022
Inflation, %
HIST CF, 9/2021 IMF, 4/2021
OECD, 5/2021 ECB, 6/2021
CF IMF OECD ECB CF IMF OECD ECB
2021 3.7 3.5 2.7 3.0 2021 2.0 1.4 1.8 1.5
2022 3.4 3.0 3.7 3.7 2022 1.8 1.5 1.5 1.5
-12
-8
-4
0
4
8
2016 2017 2018 2019 2020 2021 2022
GDP growth, %
HIST CF, 9/2021 IMF, 4/2021
OECD, 5/2021 ECB, 6/2021
-1
0
1
2
3
4
2016 2017 2018 2019 2020 2021 2022
Inflation, %
HIST CF, 9/2021 IMF, 4/2021
OECD, 5/2021 ECB, 6/2021
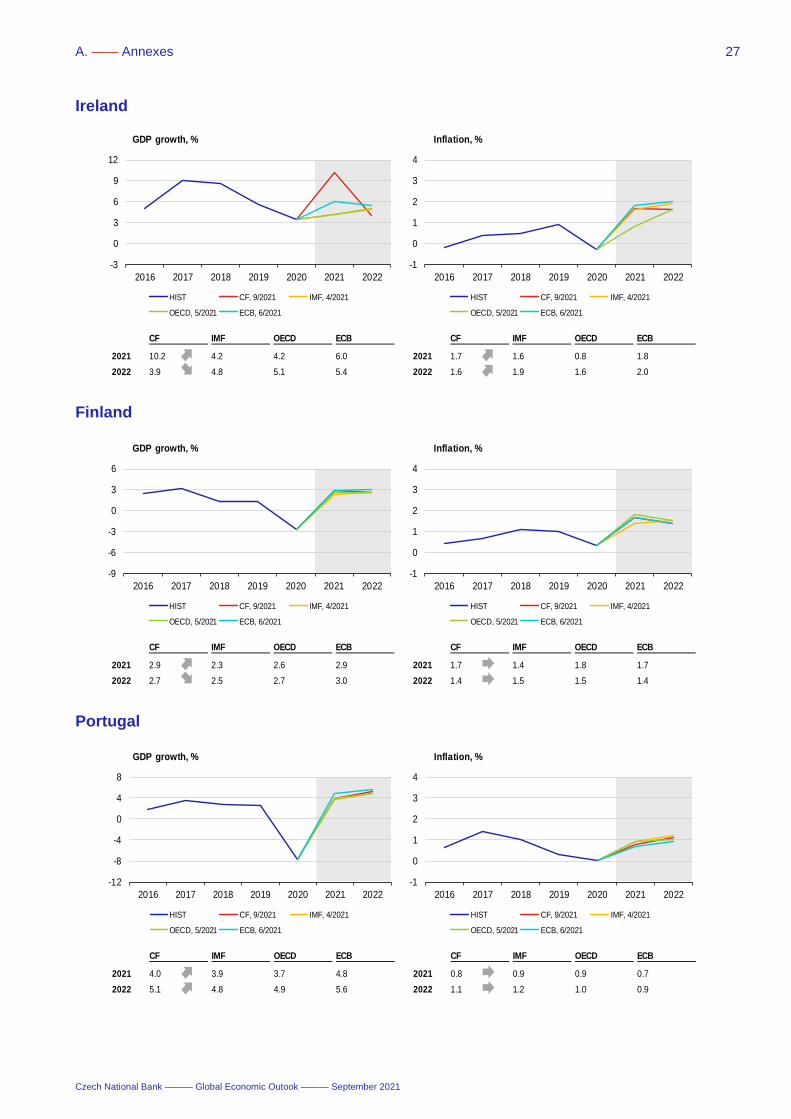
A. —— Annexes
Czech National Bank ——— Global Economic Outook ——— September 2021
27
Ireland
Finland
Portugal
CF IMF OECD ECB CF IMF OECD ECB
2021 2.9 2.3 2.6 2.9 2021 1.7 1.4 1.8 1.7
2022 2.7 2.5 2.7 3.0 2022 1.4 1.5 1.5 1.4
-9
-6
-3
0
3
6
2016 2017 2018 2019 2020 2021 2022
GDP growth, %
HIST CF, 9/2021 IMF, 4/2021
OECD, 5/2021 ECB, 6/2021
-1
0
1
2
3
4
2016 2017 2018 2019 2020 2021 2022
Inflation, %
HIST CF, 9/2021 IMF, 4/2021
OECD, 5/2021 ECB, 6/2021
CF IMF OECD ECB CF IMF OECD ECB
2021 4.0 3.9 3.7 4.8 2021 0.8 0.9 0.9 0.7
2022 5.1 4.8 4.9 5.6 2022 1.1 1.2 1.0 0.9
-12
-8
-4
0
4
8
2016 2017 2018 2019 2020 2021 2022
GDP growth, %
HIST CF, 9/2021 IMF, 4/2021
OECD, 5/2021 ECB, 6/2021
-1
0
1
2
3
4
2016 2017 2018 2019 2020 2021 2022
Inflation, %
HIST CF, 9/2021 IMF, 4/2021
OECD, 5/2021 ECB, 6/2021
CF IMF OECD ECB CF IMF OECD ECB
2021 10.2 4.2 4.2 6.0 2021 1.7 1.6 0.8 1.8
2022 3.9 4.8 5.1 5.4 2022 1.6 1.9 1.6 2.0
-3
0
3
6
9
12
2016 2017 2018 2019 2020 2021 2022
GDP growth, %
HIST CF, 9/2021 IMF, 4/2021
OECD, 5/2021 ECB, 6/2021
-1
0
1
2
3
4
2016 2017 2018 2019 2020 2021 2022
Inflation, %
HIST CF, 9/2021 IMF, 4/2021
OECD, 5/2021 ECB, 6/2021
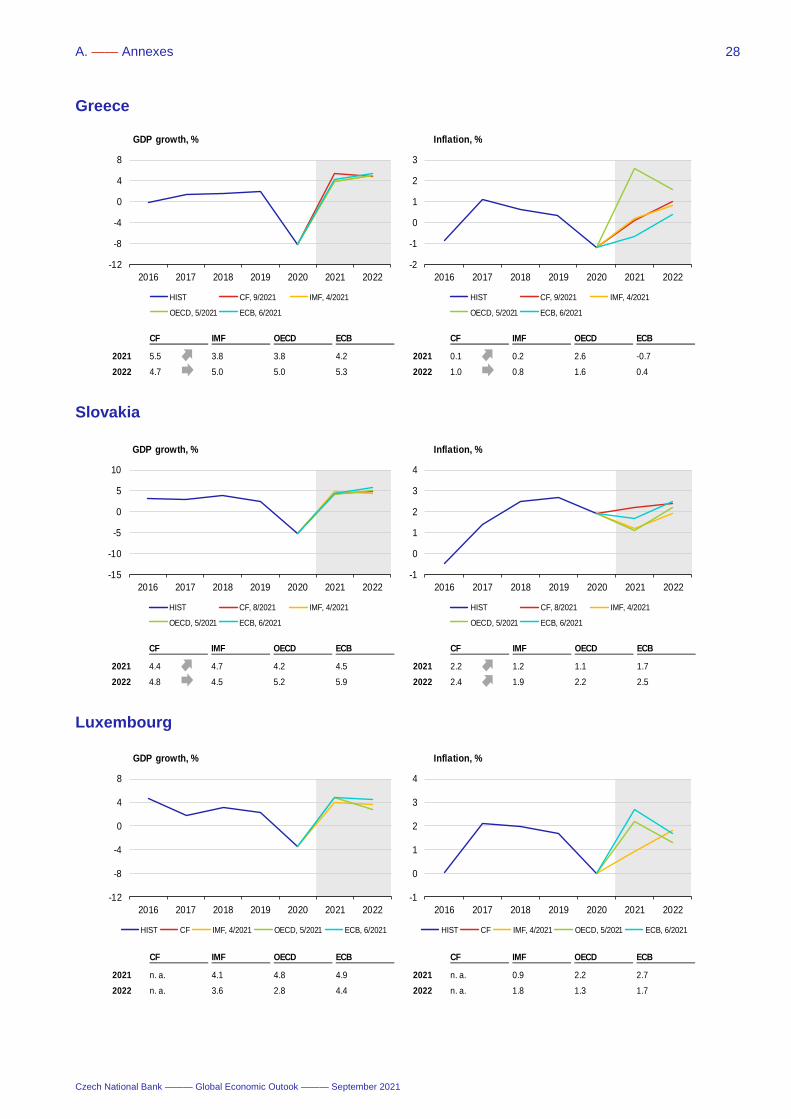
A. —— Annexes
Czech National Bank ——— Global Economic Outook ——— September 2021
28
Greece
Slovakia
Luxembourg
CF IMF OECD ECB CF IMF OECD ECB
2021 4.4 4.7 4.2 4.5 2021 2.2 1.2 1.1 1.7
2022 4.8 4.5 5.2 5.9 2022 2.4 1.9 2.2 2.5
-15
-10
-5
0
5
10
2016 2017 2018 2019 2020 2021 2022
GDP growth, %
HIST CF, 8/2021 IMF, 4/2021
OECD, 5/2021 ECB, 6/2021
-1
0
1
2
3
4
2016 2017 2018 2019 2020 2021 2022
Inflation, %
HIST CF, 8/2021 IMF, 4/2021
OECD, 5/2021 ECB, 6/2021
CF IMF OECD ECB CF IMF OECD ECB
2021 n. a. 4.1 4.8 4.9 2021 n. a. 0.9 2.2 2.7
2022 n. a. 3.6 2.8 4.4 2022 n. a. 1.8 1.3 1.7
-12
-8
-4
0
4
8
2016 2017 2018 2019 2020 2021 2022
GDP growth, %
HIST CF IMF, 4/2021 OECD, 5/2021 ECB, 6/2021
-1
0
1
2
3
4
2016 2017 2018 2019 2020 2021 2022
Inflation, %
HIST CF IMF, 4/2021 OECD, 5/2021 ECB, 6/2021
CF IMF OECD ECB CF IMF OECD ECB
2021 5.5 3.8 3.8 4.2 2021 0.1 0.2 2.6 -0.7
2022 4.7 5.0 5.0 5.3 2022 1.0 0.8 1.6 0.4
-12
-8
-4
0
4
8
2016 2017 2018 2019 2020 2021 2022
GDP growth, %
HIST CF, 9/2021 IMF, 4/2021
OECD, 5/2021 ECB, 6/2021
-2
-1
0
1
2
3
2016 2017 2018 2019 2020 2021 2022
Inflation, %
HIST CF, 9/2021 IMF, 4/2021
OECD, 5/2021 ECB, 6/2021
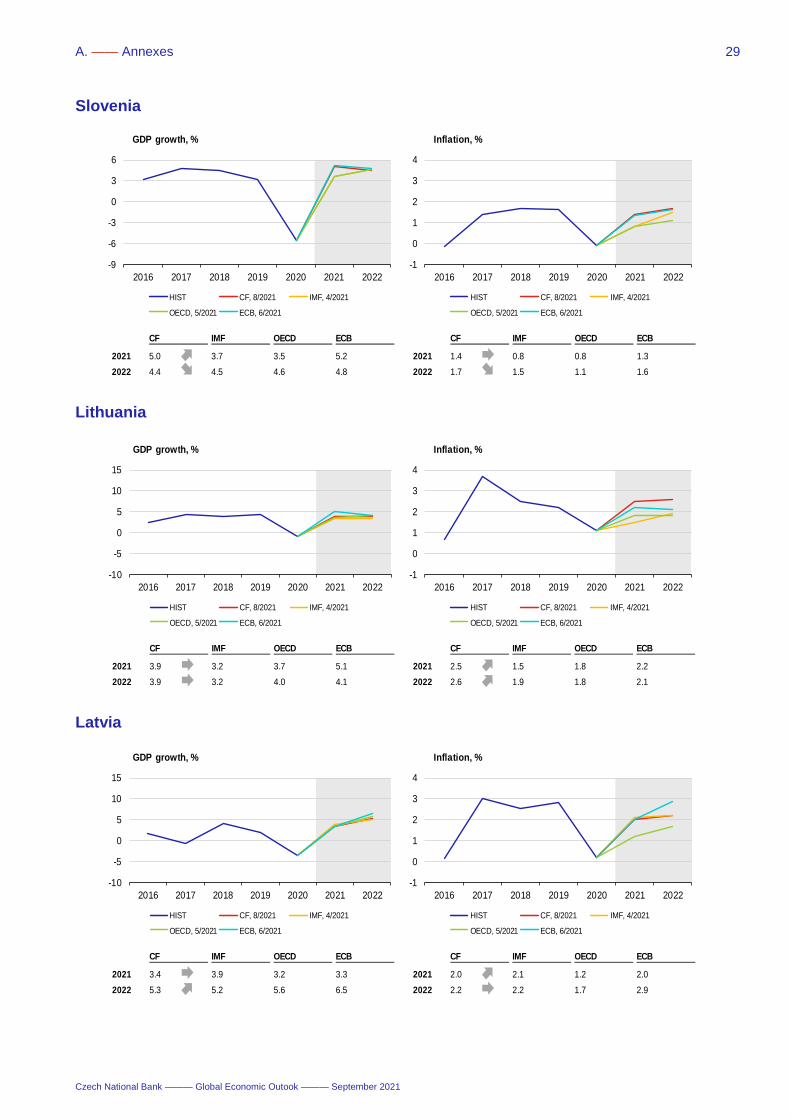
A. —— Annexes
Czech National Bank ——— Global Economic Outook ——— September 2021
29
Slovenia
Lithuania
Latvia
CF IMF OECD ECB CF IMF OECD ECB
2021 3.9 3.2 3.7 5.1 2021 2.5 1.5 1.8 2.2
2022 3.9 3.2 4.0 4.1 2022 2.6 1.9 1.8 2.1
-10
-5
0
5
10
15
2016 2017 2018 2019 2020 2021 2022
GDP growth, %
HIST CF, 8/2021 IMF, 4/2021
OECD, 5/2021 ECB, 6/2021
-1
0
1
2
3
4
2016 2017 2018 2019 2020 2021 2022
Inflation, %
HIST CF, 8/2021 IMF, 4/2021
OECD, 5/2021 ECB, 6/2021
CF IMF OECD ECB CF IMF OECD ECB
2021 3.4 3.9 3.2 3.3 2021 2.0 2.1 1.2 2.0
2022 5.3 5.2 5.6 6.5 2022 2.2 2.2 1.7 2.9
-10
-5
0
5
10
15
2016 2017 2018 2019 2020 2021 2022
GDP growth, %
HIST CF, 8/2021 IMF, 4/2021
OECD, 5/2021 ECB, 6/2021
-1
0
1
2
3
4
2016 2017 2018 2019 2020 2021 2022
Inflation, %
HIST CF, 8/2021 IMF, 4/2021
OECD, 5/2021 ECB, 6/2021
CF IMF OECD ECB CF IMF OECD ECB
2021 5.0 3.7 3.5 5.2 2021 1.4 0.8 0.8 1.3
2022 4.4 4.5 4.6 4.8 2022 1.7 1.5 1.1 1.6
-9
-6
-3
0
3
6
2016 2017 2018 2019 2020 2021 2022
GDP growth, %
HIST CF, 8/2021 IMF, 4/2021
OECD, 5/2021 ECB, 6/2021
-1
0
1
2
3
4
2016 2017 2018 2019 2020 2021 2022
Inflation, %
HIST CF, 8/2021 IMF, 4/2021
OECD, 5/2021 ECB, 6/2021
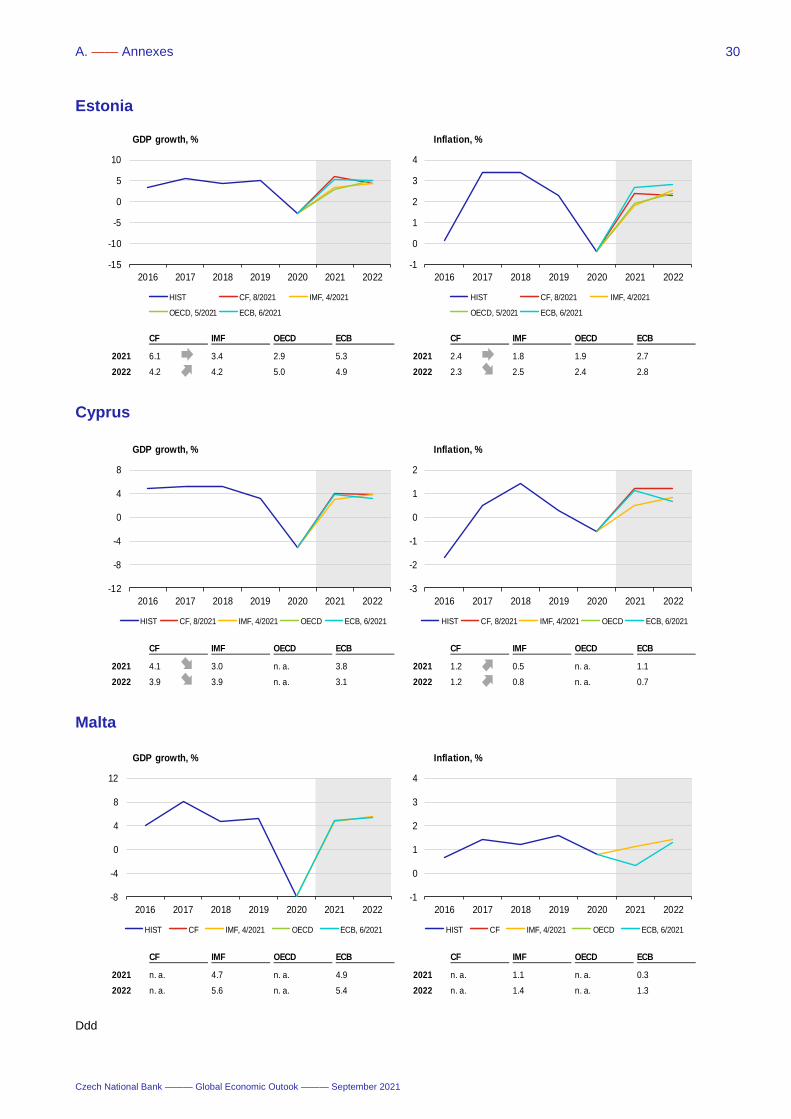
A. —— Annexes
Czech National Bank ——— Global Economic Outook ——— September 2021
30
Estonia
Cyprus
Malta
Ddd
CF IMF OECD ECB CF IMF OECD ECB
2021 4.1 3.0 n. a. 3.8 2021 1.2 0.5 n. a. 1.1
2022 3.9 3.9 n. a. 3.1 2022 1.2 0.8 n. a. 0.7
-12
-8
-4
0
4
8
2016 2017 2018 2019 2020 2021 2022
GDP growth, %
HIST CF, 8/2021 IMF, 4/2021 OECD ECB, 6/2021
-3
-2
-1
0
1
2
2016 2017 2018 2019 2020 2021 2022
Inflation, %
HIST CF, 8/2021 IMF, 4/2021 OECD ECB, 6/2021
CF IMF OECD ECB CF IMF OECD ECB
2021 n. a. 4.7 n. a. 4.9 2021 n. a. 1.1 n. a. 0.3
2022 n. a. 5.6 n. a. 5.4 2022 n. a. 1.4 n. a. 1.3
-8
-4
0
4
8
12
2016 2017 2018 2019 2020 2021 2022
GDP growth, %
HIST CF IMF, 4/2021 OECD ECB, 6/2021
-1
0
1
2
3
4
2016 2017 2018 2019 2020 2021 2022
Inflation, %
HIST CF IMF, 4/2021 OECD ECB, 6/2021
CF IMF OECD ECB CF IMF OECD ECB
2021 6.1 3.4 2.9 5.3 2021 2.4 1.8 1.9 2.7
2022 4.2 4.2 5.0 4.9 2022 2.3 2.5 2.4 2.8
-15
-10
-5
0
5
10
2016 2017 2018 2019 2020 2021 2022
GDP growth, %
HIST CF, 8/2021 IMF, 4/2021
OECD, 5/2021 ECB, 6/2021
-1
0
1
2
3
4
2016 2017 2018 2019 2020 2021 2022
Inflation, %
HIST CF, 8/2021 IMF, 4/2021
OECD, 5/2021 ECB, 6/2021
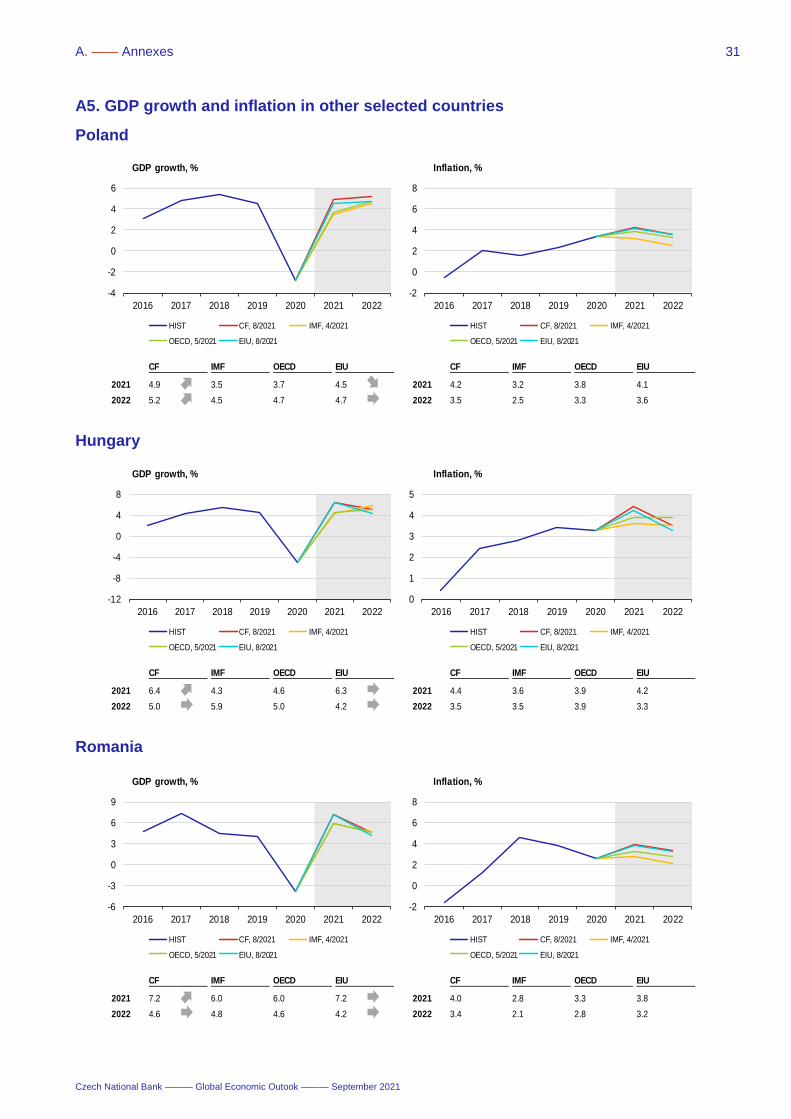
A. —— Annexes
Czech National Bank ——— Global Economic Outook ——— September 2021
31
A5. GDP growth and inflation in other selected countries
Poland
Hungary
Romania
CF IMF OECD EIU CF IMF OECD EIU
2021 6.4 4.3 4.6 6.3 2021 4.4 3.6 3.9 4.2
2022 5.0 5.9 5.0 4.2 2022 3.5 3.5 3.9 3.3
-12
-8
-4
0
4
8
2016 2017 2018 2019 2020 2021 2022
GDP growth, %
HIST CF, 8/2021 IMF, 4/2021
OECD, 5/2021 EIU, 8/2021
0
1
2
3
4
5
2016 2017 2018 2019 2020 2021 2022
Inflation, %
HIST CF, 8/2021 IMF, 4/2021
OECD, 5/2021 EIU, 8/2021
CF IMF OECD EIU CF IMF OECD EIU
2021 7.2 6.0 6.0 7.2 2021 4.0 2.8 3.3 3.8
2022 4.6 4.8 4.6 4.2 2022 3.4 2.1 2.8 3.2
-6
-3
0
3
6
9
2016 2017 2018 2019 2020 2021 2022
GDP growth, %
HIST CF, 8/2021 IMF, 4/2021
OECD, 5/2021 EIU, 8/2021
-2
0
2
4
6
8
2016 2017 2018 2019 2020 2021 2022
Inflation, %
HIST CF, 8/2021 IMF, 4/2021
OECD, 5/2021 EIU, 8/2021
CF IMF OECD EIU CF IMF OECD EIU
2021 4.9 3.5 3.7 4.5 2021 4.2 3.2 3.8 4.1
2022 5.2 4.5 4.7 4.7 2022 3.5 2.5 3.3 3.6
-4
-2
0
2
4
6
2016 2017 2018 2019 2020 2021 2022
GDP growth, %
HIST CF, 8/2021 IMF, 4/2021
OECD, 5/2021 EIU, 8/2021
-2
0
2
4
6
8
2016 2017 2018 2019 2020 2021 2022
Inflation, %
HIST CF, 8/2021 IMF, 4/2021
OECD, 5/2021 EIU, 8/2021
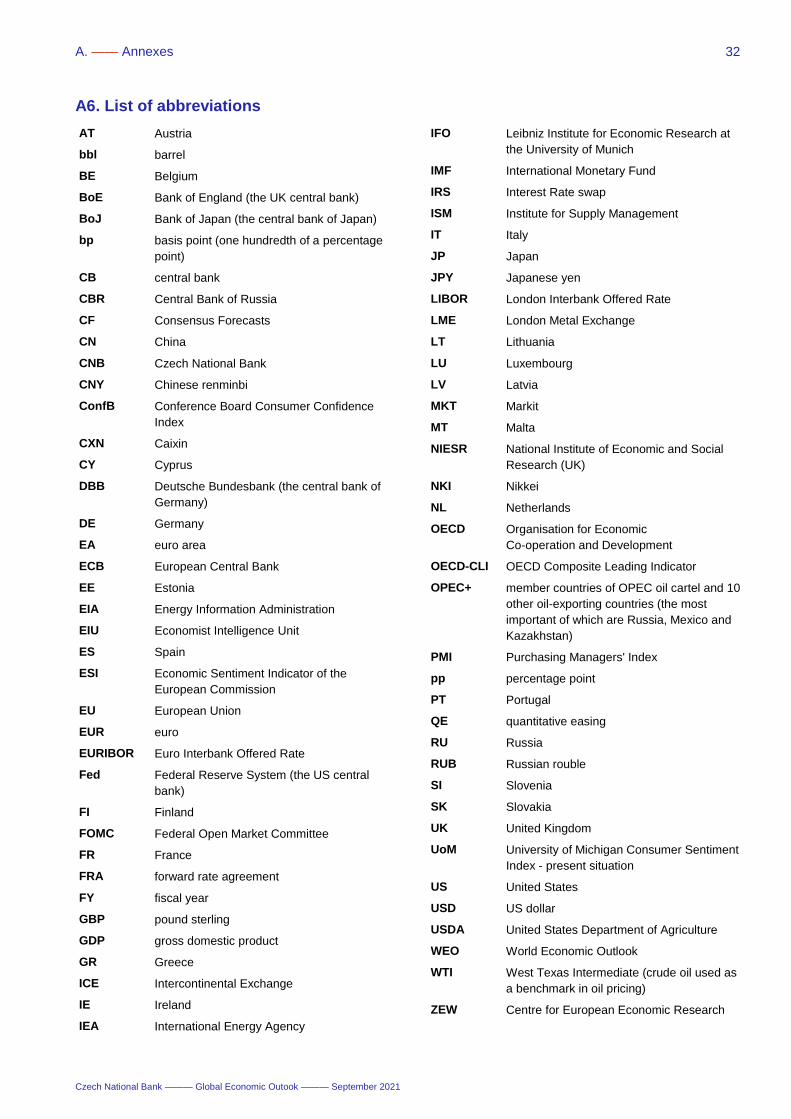
A. —— Annexes
Czech National Bank ——— Global Economic Outook ——— September 2021
32
A6. List of abbreviations
AT Austria
bbl barrel
BE Belgium
BoE Bank of England (the UK central bank)
BoJ Bank of Japan (the central bank of Japan)
bp basis point (one hundredth of a percentage
point)
CB central bank
CBR Central Bank of Russia
CF Consensus Forecasts
CN China
CNB Czech National Bank
CNY Chinese renminbi
ConfB Conference Board Consumer Confidence
Index
CXN Caixin
CY Cyprus
DBB Deutsche Bundesbank (the central bank of
Germany)
DE Germany
EA euro area
ECB European Central Bank
EE Estonia
EIA Energy Information Administration
EIU Economist Intelligence Unit
ES Spain
ESI Economic Sentiment Indicator of the
European Commission
EU European Union
EUR euro
EURIBOR Euro Interbank Offered Rate
Fed Federal Reserve System (the US central
bank)
FI Finland
FOMC Federal Open Market Committee
FR France
FRA forward rate agreement
FY fiscal year
GBP pound sterling
GDP gross domestic product
GR Greece
ICE Intercontinental Exchange
IE Ireland
IEA International Energy Agency
IFO Leibniz Institute for Economic Research at
the University of Munich
IMF International Monetary Fund
IRS Interest Rate swap
ISM Institute for Supply Management
IT Italy
JP Japan
JPY Japanese yen
LIBOR London Interbank Offered Rate
LME London Metal Exchange
LT Lithuania
LU Luxembourg
LV Latvia
MKT Markit
MT Malta
NIESR National Institute of Economic and Social
Research (UK)
NKI Nikkei
NL Netherlands
OECD Organisation for Economic
Co-operation and Development
OECD-CLI OECD Composite Leading Indicator
OPEC+ member countries of OPEC oil cartel and 10
other oil-exporting countries (the most
important of which are Russia, Mexico and
Kazakhstan)
PMI Purchasing Managers' Index
pp percentage point
PT Portugal
QE quantitative easing
RU Russia
RUB Russian rouble
SI Slovenia
SK Slovakia
UK United Kingdom
UoM University of Michigan Consumer Sentiment
Index - present situation
US United States
USD US dollar
USDA United States Department of Agriculture
WEO World Economic Outlook
WTI West Texas Intermediate (crude oil used as
a benchmark in oil pricing)
ZEW Centre for European Economic Research

www.cnb.cz
Publisher:
ČESKÁ NÁRODNÍ BANKA
Na Příkopě 28
115 03 Praha 1
Česká republika
Contact:
ODBOR KOMUNIKACE SEKCE KANCELÁŘ
Tel.: 224 413 112
Fax: 224 412 179
www.cnb.cz
Related Documents