Global development From trade to development– What explains variation in economic development across nations?

Global development From trade to development– What explains variation in economic development across nations?
Dec 25, 2015
Welcome message from author
This document is posted to help you gain knowledge. Please leave a comment to let me know what you think about it! Share it to your friends and learn new things together.
Transcript
Global development
From trade to development– What explains variation in economic development across nations?
Today
World Trade Organization (WTO) Can states effectively regulate global trade?
From trade to development Nau, chapter 11: Asia and Latin America Asia: export-led development (p. 294) Latin America: the failure of import substitution (p. 299)
Global inequality Why does poverty persist in the world?
Internal explanation: culture and corruption External explanation: rich nations are at fault

World Trade Organization
Only IGO dealing with rules of trade among nations; membership: 151
WTO reflects liberal understanding of international trade and is build on the General Agreement on Tariffs and Trade (GATT).
Three main objectives: to help trade flow as freely as possible, to achieve further liberalization gradually
through inter-state negotiations, to set up an impartial mechanism to settle trade
disputes.
From Institution to Organization
From GATT (1947) to WTO (1995) Eight trade rounds:
1947 Geneva, 23 countries (tariffs). 1949 Annecy, France 13 countries (tariffs). 1951 Torquay, England 38 countries (tariffs). 1956 Geneva, 26 countries (tariffs). 1960/1 Dillon Round, 26 countries (tariffs).
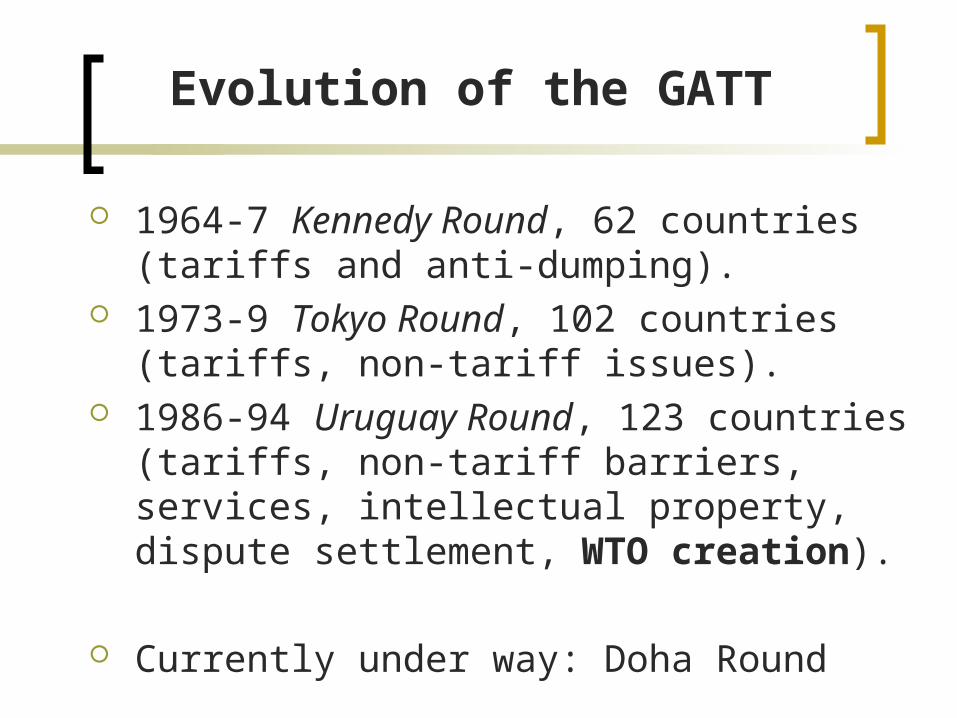
Evolution of the GATT
1964-7 Kennedy Round, 62 countries (tariffs and anti-dumping).
1973-9 Tokyo Round, 102 countries (tariffs, non-tariff issues).
1986-94 Uruguay Round, 123 countries (tariffs, non-tariff barriers, services, intellectual property, dispute settlement, WTO creation).
Currently under way: Doha Round
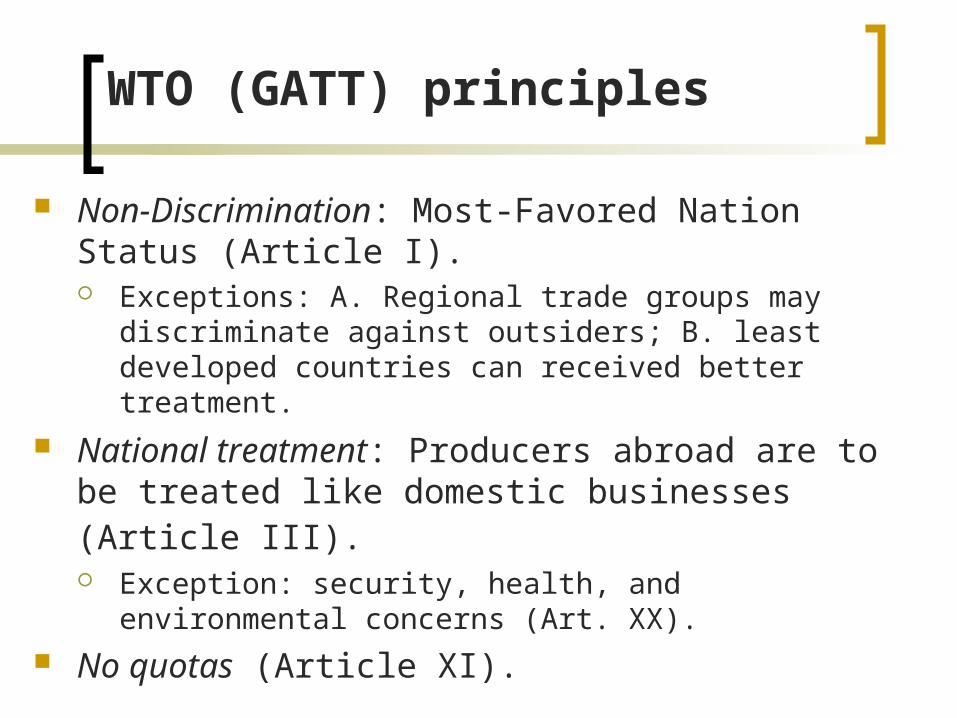
WTO (GATT) principles
Non-Discrimination: Most-Favored Nation Status (Article I). Exceptions: A. Regional trade groups may
discriminate against outsiders; B. least developed countries can received better treatment.
National treatment: Producers abroad are to be treated like domestic businesses (Article III). Exception: security, health, and environmental
concerns (Art. XX). No quotas (Article XI).

WTO basics
Currently 151 member states, covering 97% of world trade.
Organizational Chart; one state – one vote Secretariat in Geneva (staff of 550, budget: $110
Mio.)
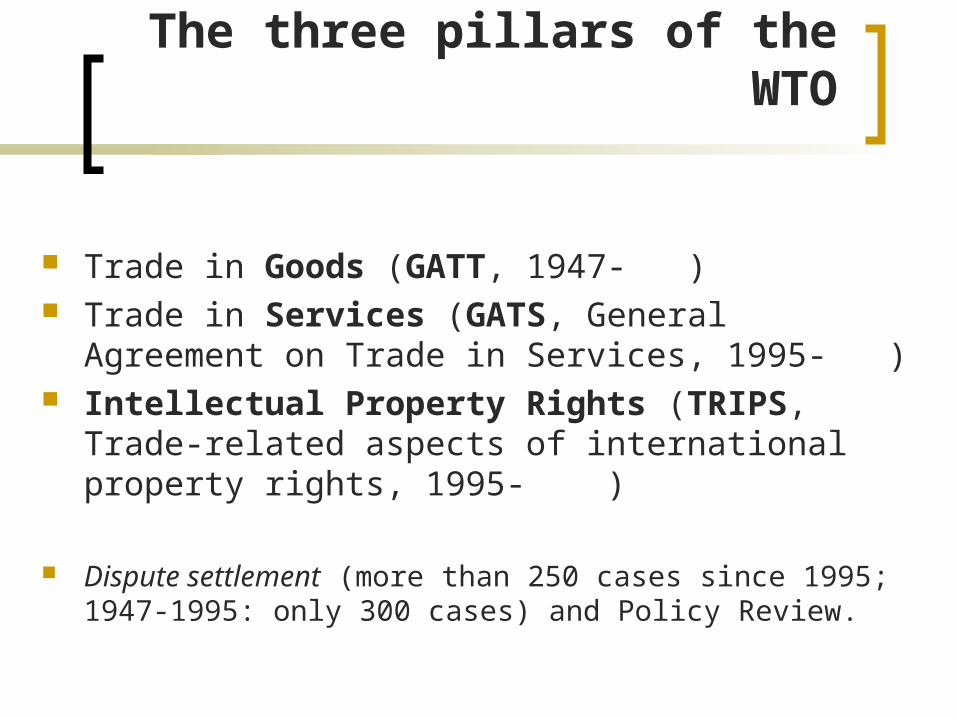
The three pillars of the WTO
Trade in Goods (GATT, 1947- ) Trade in Services (GATS, General
Agreement on Trade in Services, 1995- ) Intellectual Property Rights (TRIPS,
Trade-related aspects of international property rights, 1995- )
Dispute settlement (more than 250 cases since 1995; 1947-1995: only 300 cases) and Policy Review.

Summary
Global trade is regulated by a liberal trade regime (GATT/WTO).
WTO expands the regime from trade to services (GATS) and intellectual property rights (TRIPs).
Doha Round is stalled due to increasing collective action problems (number of states involved) and domestic stakes (outsourcing, subsidies, etc.).
From trade to development

From trade to development
Textbook, Nau, chapter 11 What is development? (p. 289)
Growth in GNP or sustainable growth? Growth in average income or reduction of
poverty? What causes development? (p. 286)
Domestic policies (neoclassical theory) International policies (dependency theory)
What are the effects of development? Democracy and Equality

What is development?
Development is the process by which a society increases the capacities to meet the basic needs of citizens and raise their standard of living.
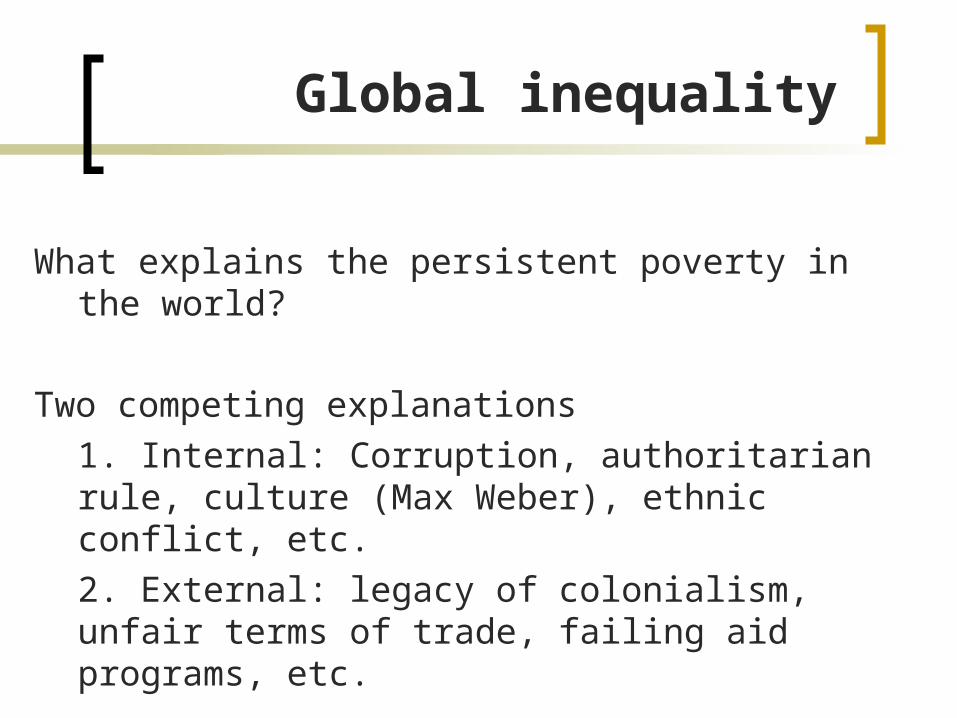
Global inequality
What explains the persistent poverty in the world?
Two competing explanations1. Internal: Corruption, authoritarian rule, culture (Max Weber), ethnic conflict, etc. 2. External: legacy of colonialism, unfair terms of trade, failing aid programs, etc.

What can be done?
Debt relief Health Care Education Microfinance Land reform Infrastructure What kind of trade? Bono calls for Debt Relief as part of the
Jubilee 2000 campaign, February 2002
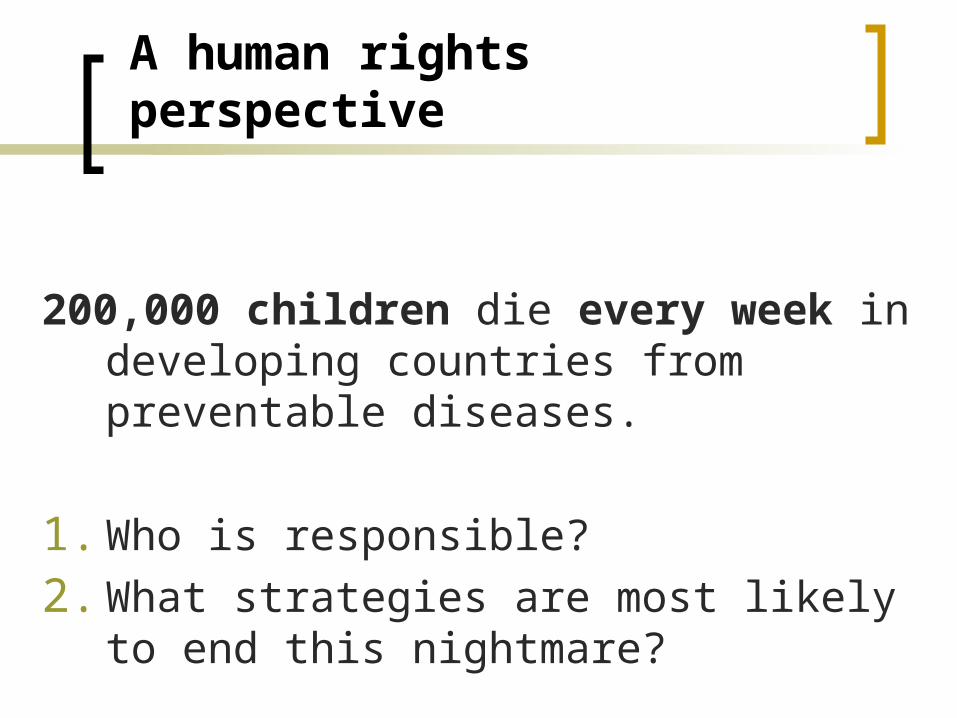
A human rights perspective
200,000 children die every week in developing countries from preventable diseases.
1. Who is responsible?
2. What strategies are most likely to end this nightmare?
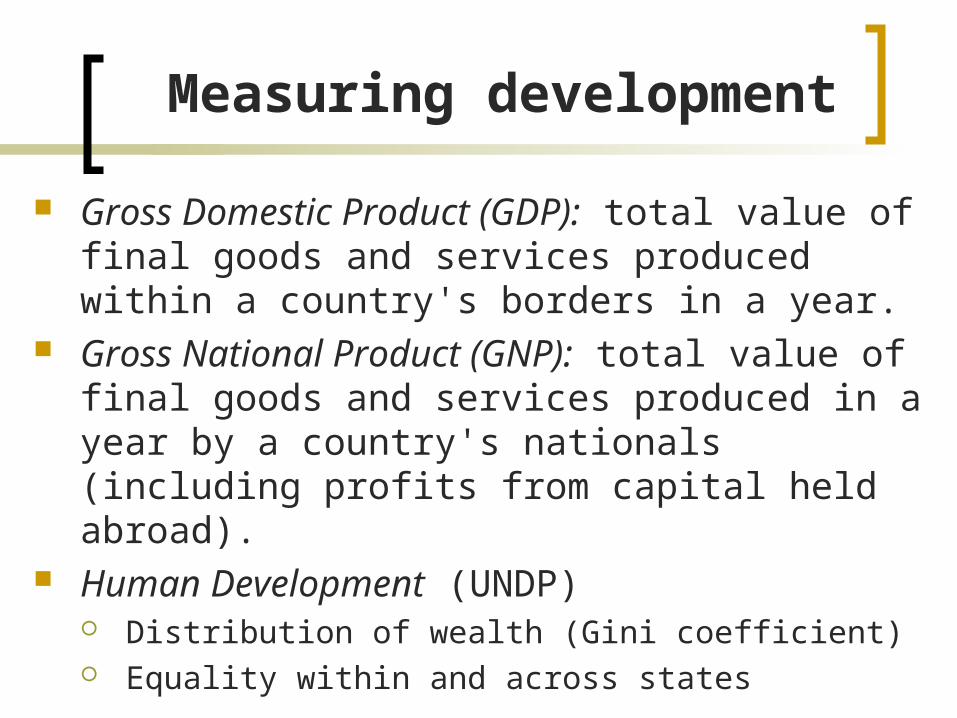
Measuring development
Gross Domestic Product (GDP): total value of final goods and services produced within a country's borders in a year.
Gross National Product (GNP): total value of final goods and services produced in a year by a country's nationals (including profits from capital held abroad).
Human Development (UNDP) Distribution of wealth (Gini coefficient) Equality within and across states

Gini Index
The Gini index: measuring the distribution of income among individuals or households within a country.
Perfectly equal distribution: 0. Perfect inequality: 100.
Of the 25 top-ranking countries in the 2003 HDI, all had a Gini coefficient of less than 40, except for the United States at 40.8.
By comparison, 19 of the 25 lowest-ranking countries, have coefficients of over 40.
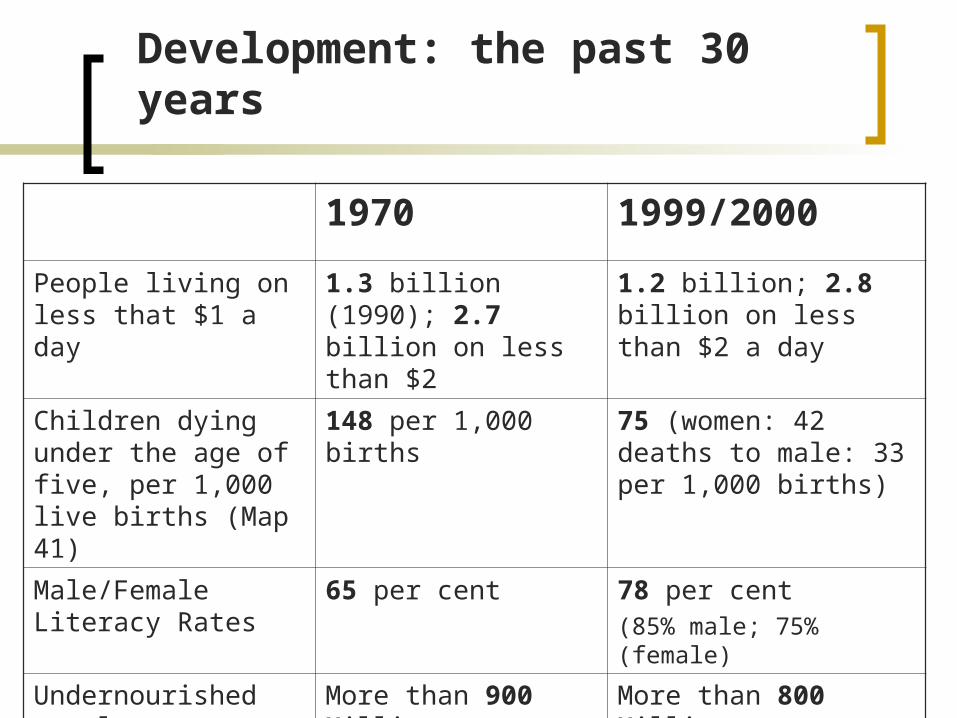
Development: the past 30 years
1970 1999/2000
People living on less that $1 a day
1.3 billion (1990); 2.7 billion on less than $2
1.2 billion; 2.8 billion on less than $2 a day
Children dying under the age of five, per 1,000 live births (Map 41)
148 per 1,000 births 75 (women: 42 deaths to male: 33 per 1,000 births)
Male/Female Literacy Rates
65 per cent 78 per cent (85% male; 75% (female)
Undernourished people
More than 900 Million More than 800 Million
Life Expectancy 60 years 66 years
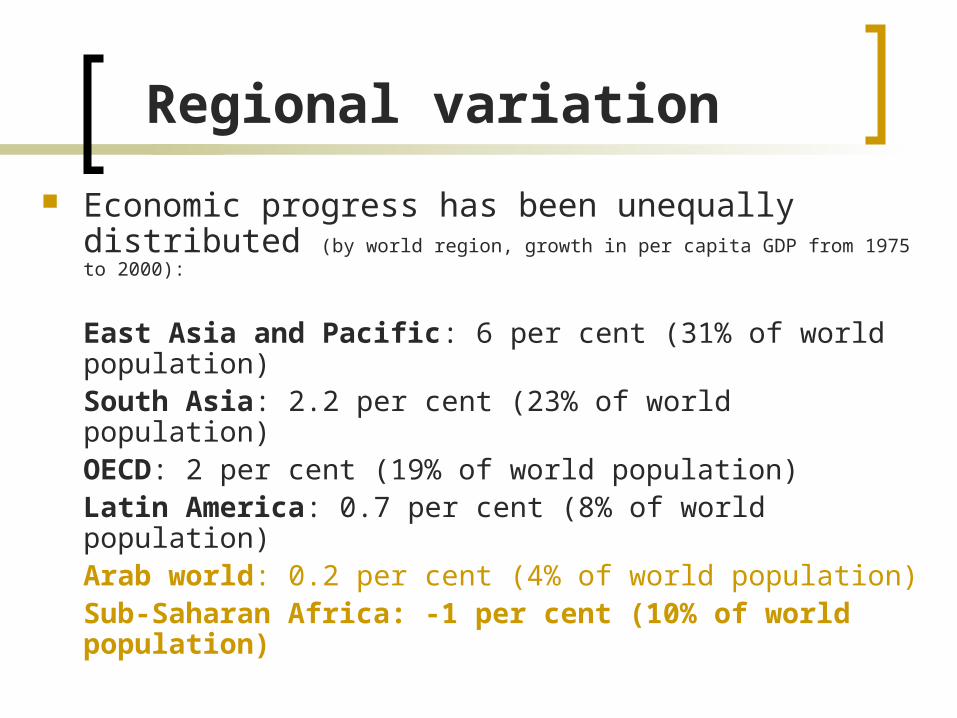
Regional variation
Economic progress has been unequally distributed (by world region, growth in per capita GDP from 1975 to 2000):
East Asia and Pacific: 6 per cent (31% of world population)South Asia: 2.2 per cent (23% of world population)OECD: 2 per cent (19% of world population)Latin America: 0.7 per cent (8% of world population) Arab world: 0.2 per cent (4% of world population)Sub-Saharan Africa: -1 per cent (10% of world population)
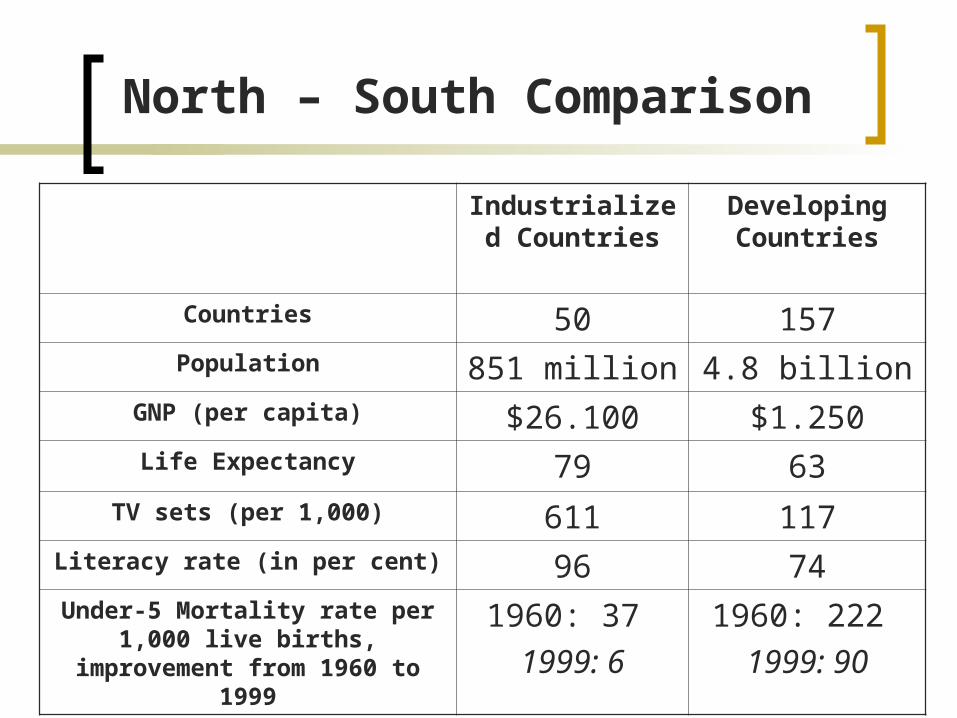
North – South Comparison
Industrialized Countries
Developing Countries
Countries 50 157Population 851 million 4.8 billion
GNP (per capita) $26.100 $1.250Life Expectancy 79 63
TV sets (per 1,000) 611 117Literacy rate (in per cent) 96 74
Under-5 Mortality rate per 1,000 live births, improvement from 1960
to 1999
1960: 37
1999: 6
1960: 222
1999: 90

Sub-Saharan Africa today
Living in absolute poverty: 47% Literacy rate: 54% (79% world average) Life Expectancy: 48 years (66 world average) Under 5-Mortality: 173 (82 world average, per
1,000 live births; 1960: 258 to 198 average) Without access to clean water: 45%
Information based on: UNDP Human Development Report 2001

The growing gap
Explore highlights of: UNDP’s Human Development Report 2006 (interactive map)
World’s richest 5 per cent have 114 times more than the poorest 5 per cent.
The richest 10% of US citizens own more than the poorest 43% of the world.
54 countries became poorer since the 1990s, in 34 life expectancy has fallen, in 14 more children die at age 5 or younger.

What causes development?
Two broad explanations Neoclassical policies, export-led (East Asia)
Minor government role Market-driven ‘Free’ trade
Revisionist policies (Latin America) Government intervention Import substitution ‘Fair’ trade

Asian ‘tigers’
South Korea Hong Kong Singapore Taiwan

Asia and Latin America
‘ASIAN TIGERS’ Domestic stability Export-led growth Low deficits Land reform (LR) Primary education Cultural cohesion
Nau, ch. 11, p. 307
LATIN AMERICA
Domestic instability Import substitution High deficits Limited LR Elite education Cultural friction
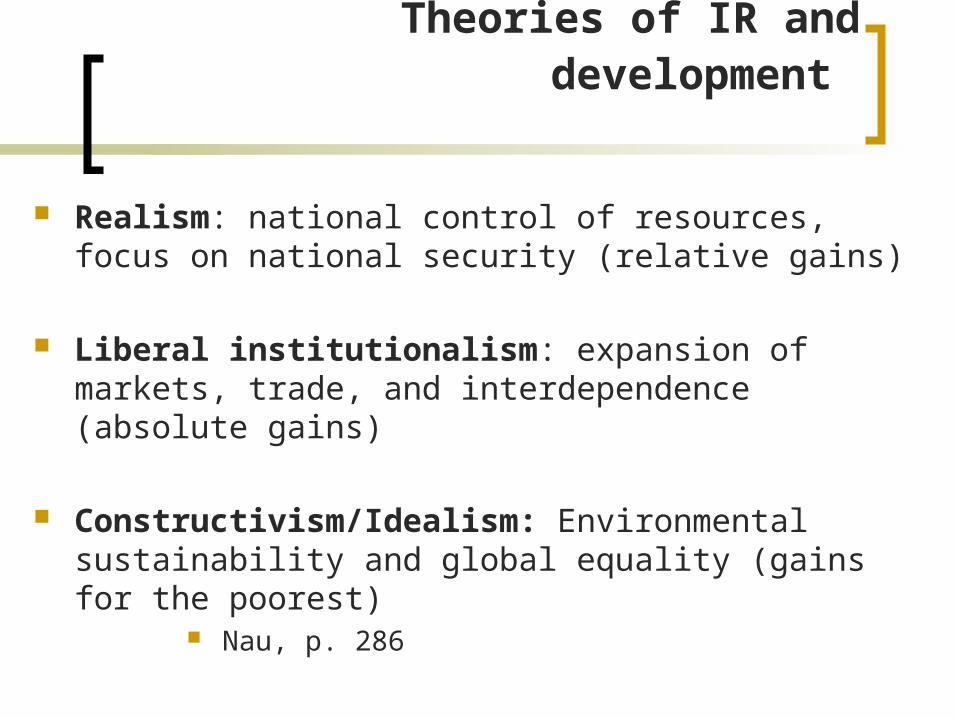
Theories of IR and development
Realism: national control of resources, focus on national security (relative gains)
Liberal institutionalism: expansion of markets, trade, and interdependence (absolute gains)
Constructivism/Idealism: Environmental sustainability and global equality (gains for the poorest)
Nau, p. 286
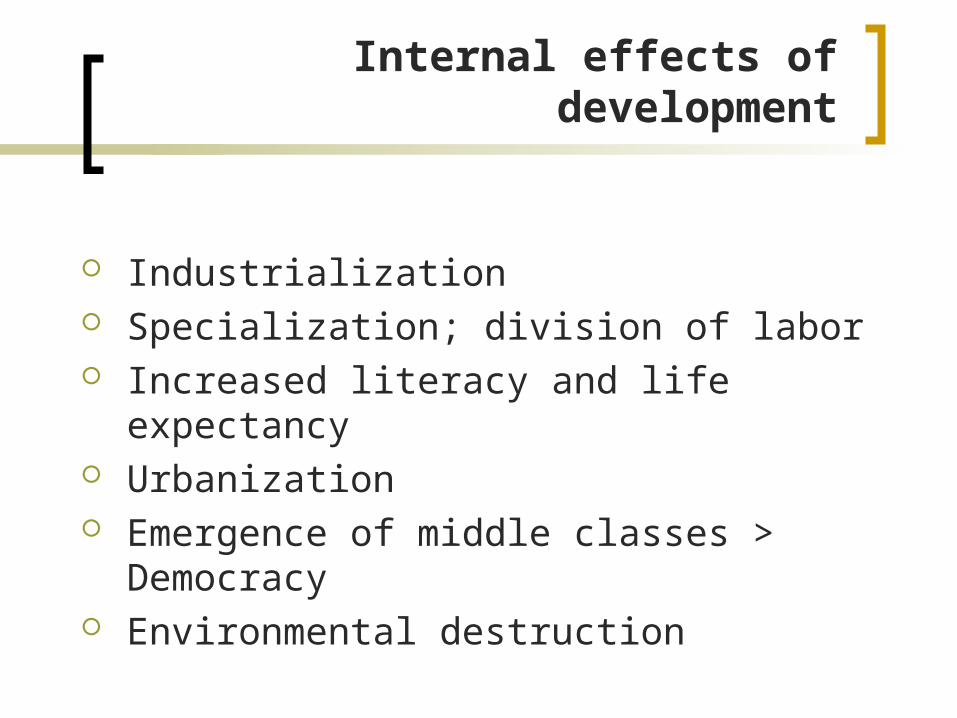
Internal effects of development
Industrialization Specialization; division of labor Increased literacy and life expectancy Urbanization Emergence of middle classes >
Democracy Environmental destruction
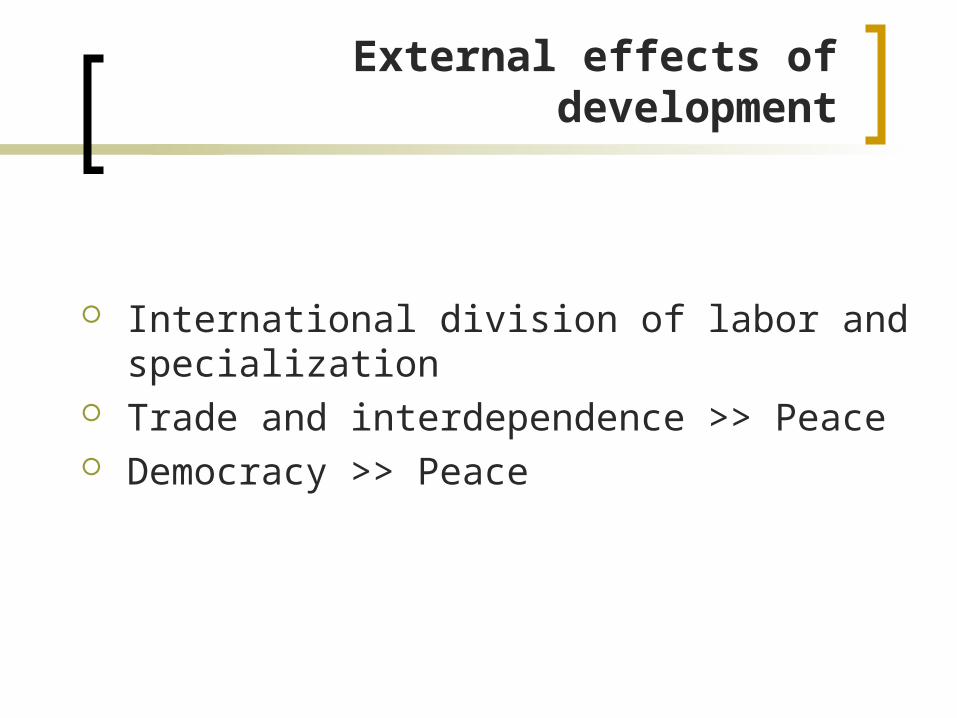
External effects of development
International division of labor and specialization
Trade and interdependence >> Peace Democracy >> Peace
Summary
What is development? More than Gross National Product (GNP)
What causes development? The right mix of growth-conducive
domestic institutions and export-led policies
What are the effects of development? Increasing wealth and decreasing income
gap (hopefully)
Related Documents