Global Culture Survey 2021 July 2021 PwC Strategy&

Welcome message from author
This document is posted to help you gain knowledge. Please leave a comment to let me know what you think about it! Share it to your friends and learn new things together.
Transcript
Global Culture Survey 2021
July 2021
PwC Strategy&
Strategy&
This publication has been developed in collaboration between Strategy&, PwC's global strategy consulting business, alongside PwC industry and function experts. Together, we transform organizations by developing actionable strategies that deliver results.
At PwC, our purpose is to build trust in society and solve important problems. We’re a network of firms in 155 countries with over 284,000 people who are committed to delivering quality in assurance, advisory and tax services. Find out more and tell us what matters to you by visiting us at www.pwc.com.
PwC refers to the PwC network and/or one or more of its member firms, each of which is a separate legal entity. Please see www.pwc.com/structure for further details.
www.pwc.com
2

Strategy&
Executive summaryRole of culture• In comparison with the global average, fewer participants from Europe
consider their corporate culture to be distinctive. This is consistent with the 2018 findings
• German and Swiss respondents consider their culture to be less distinctive
• Culture is perceived to trump strategy and operating model in China and India, but not in Europe, the USA, or Japan. This represents a change for Europe from the 2018 study
• By a large margin, respondents from China and India are more likely than those in Europe and the USA or the global average to consider their corporate culture to be a source of competitive advantage during Covid-19
• European respondents’ perception of their organization‘s ability to change is in line with the global average. Respondents from the USA, China, or India are more optimistic
3
Strategy&
Executive summaryImpact of Covid-19• Perception of the need to change as a result of Covid-19 is particularly evident in China,
India, and Japan, and is less evident in Europe or the USA than the global average
• European respondents’ perception of the impact of Covid-19 on revenue and profits is in line with the global average. Japanese firms are more likely to believe the impact to be worse than their counterparts in the USA, China, or India
• The perceived impact on business volume is similar with global average in Europe and the USA, while Japanese respondents are distinctively negative; This substantial impact on Japan could be due to shifting the Olympic Games in Tokyo to 2021, thereby eliminating the expected economic benefits of the Games in 2020
• Employee satisfaction dropped more than the global average in Europe and Japan, while firms in the USA, China, or India reported rising satisfaction. This could be because employees are happy to keep their jobs in countries where the social safety net is less strong
• The global pandemic hit Switzerland hard, due to the reported drop in business volume, employee headcount and employee satisfaction. Conversely, German respondents report a less drastic impact from Covid-19 in terms of profit/revenues, employee headcount, and business volume
• Covid-19 is seen to make quick decisions harder in Germany and Switzerland, in comparison with the European average
• Germany and Switzerland see less of a need to change as a consequence of the pandemic, in comparison with the rest of Europe or the world
4

Strategy&
Executive summary
Companies tend to enable change more in the USA, China, or India, compared in particular to Europe or Japan. This can be seen from the following dimensions: • Adjusting employee incentives, compensation, and benefits, gathering (and acting
upon) feedback from employees• Offering communication and engagement activities to support change,
communicating benefits of change in the organization, visible endorsement/ support for change from senior leaders
• Europe is generally below average when it comes to enabling change. Switzerland in particular is scoring low in this regard
• In addition, organizations in China or India report markedly more offerings for development and training. This could be due to the nature of these emerging markets, as frequent changes require organizations to constantly update the skillset of their employees
There is a strong global overlap on the identified areas of improvement in the organization, with the global top five priorities being: talent recruiting/retention, digitization, innovation, collaboration, health and safety• These findings are stable over time, as the following topics were chosen in 2018:
employee engagement/retention, agility, innovation, customer-centric, collaboration• Interestingly, one topic that that ceased to be a top concern is customer focus;
while the concern for health and safety could be a consequence of the Covid-19 pandemic, as it was not a top priority during the last survey
• The top areas identified for improvement in Germany and Switzerland are in line with the global results, placing emphasis on talent recruiting/retention, collaboration, and digitization. Quality is considered to be another area for improvement
5
Change enablers and areas for improvement
Strategy&
Executive summary
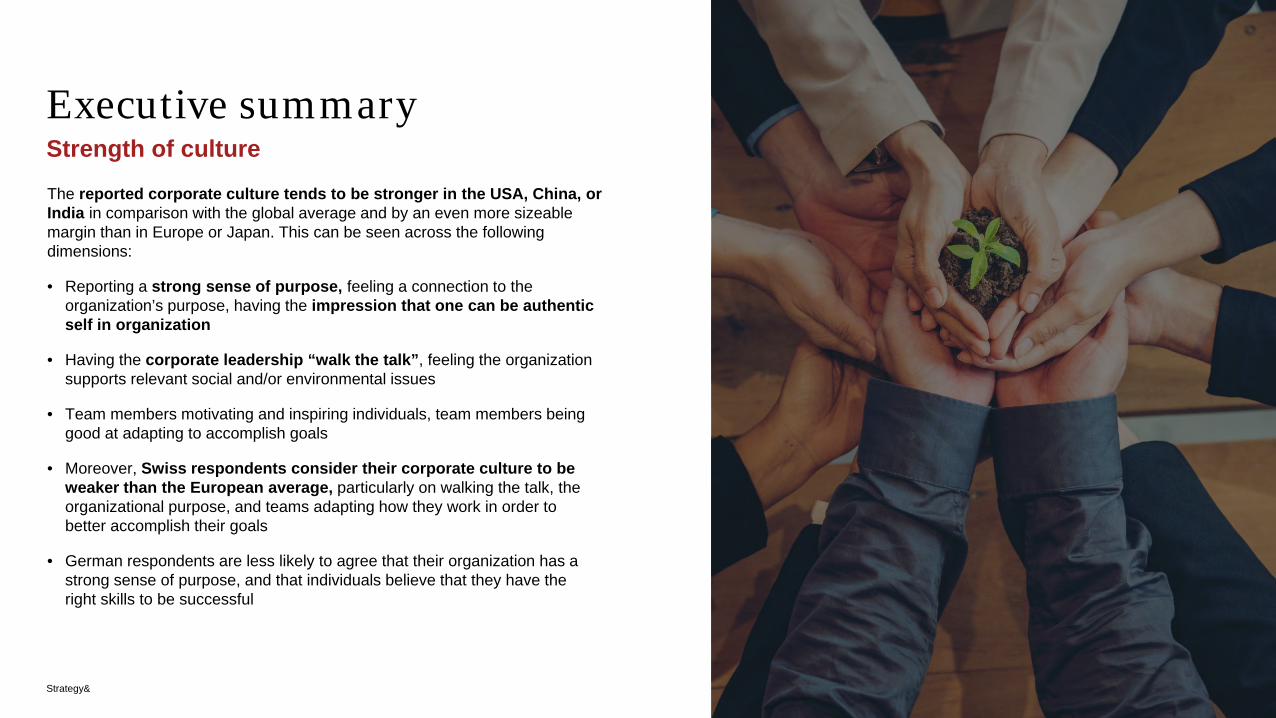
The reported corporate culture tends to be stronger in the USA, China, or India in comparison with the global average and by an even more sizeable margin than in Europe or Japan. This can be seen across the following dimensions:
• Reporting a strong sense of purpose, feeling a connection to the organization’s purpose, having the impression that one can be authentic self in organization
• Having the corporate leadership “walk the talk”, feeling the organization supports relevant social and/or environmental issues
• Team members motivating and inspiring individuals, team members being good at adapting to accomplish goals
• Moreover, Swiss respondents consider their corporate culture to be weaker than the European average, particularly on walking the talk, the organizational purpose, and teams adapting how they work in order to better accomplish their goals
• German respondents are less likely to agree that their organization has a strong sense of purpose, and that individuals believe that they have the right skills to be successful
Strength of culture
6

Strategy&
Executive summaryCultural thumbprint• Europe shows a stronger support for a single point of authority in comparison
with the rest of the world which has more of a preference for collective decision making. The differences are very small as far as the value of titles and hierarchy is concerned and only Japan shows a preference towards hierarchy
• Compared to China, India, or Japan, Europe and the US have a stronger preference for the following: external stakeholders over internal operations, incremental change over revolutionary change, completing tasks with informal relationships over the formal chain of command, following set processes and procedures rather than encouraging improvisation
• Europe, the USA, and Japan are more likely to fix problems as they arise than is the case in China or India
• Swiss respondents consider their corporate culture to be weaker than the European average; particularly on walking the talk, the organizational purpose, and teams adapting how they work in order to better accomplish their goals
• German respondents agree less that their organization has a strong sense of purpose, and that individuals have the right skills to be successful
• German companies have a preference to completing tasks via formal chains of command instead of informal relationships
• Compared to Europe and particularly the global average, Germany and Switzerland all report a trend towards a single point of accountability
• Germany and Switzerland also have a stronger focus on external stakeholders, compared to their global and particularly European peers
• Swiss firms focus more on financial metrics than the European average
7

Strategy&
Agenda
1. Demographics
2. Role of culture
3. Impact of Covid-19
4. Change enablers
5. Areas of improvement
6. Strength of culture
7. Cultural thumbprint
8. Deep dive for Germany and Switzerland
8
Strategy&
Demographics
9
Strategy&
1. Global Culture SurveyContext
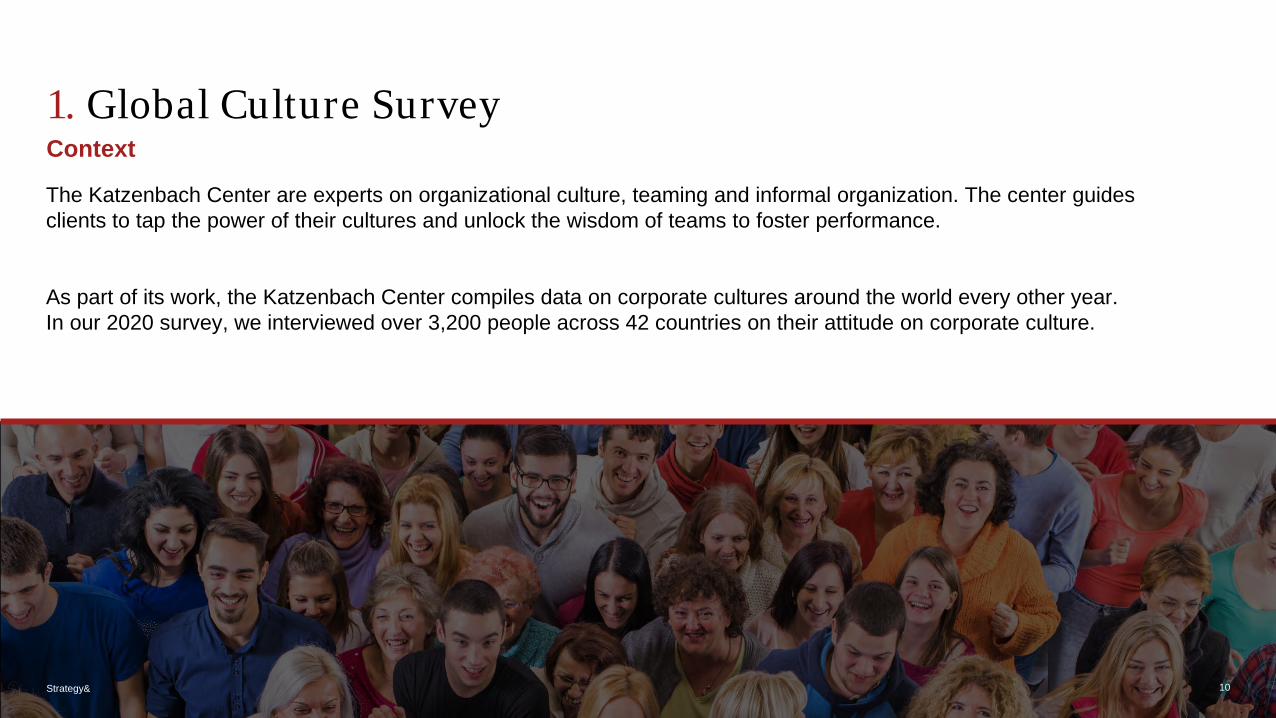
The Katzenbach Center are experts on organizational culture, teaming and informal organization. The center guides clients to tap the power of their cultures and unlock the wisdom of teams to foster performance.
As part of its work, the Katzenbach Center compiles data on corporate cultures around the world every other year. In our 2020 survey, we interviewed over 3,200 people across 42 countries on their attitude on corporate culture.
10Strategy&
Strategy&
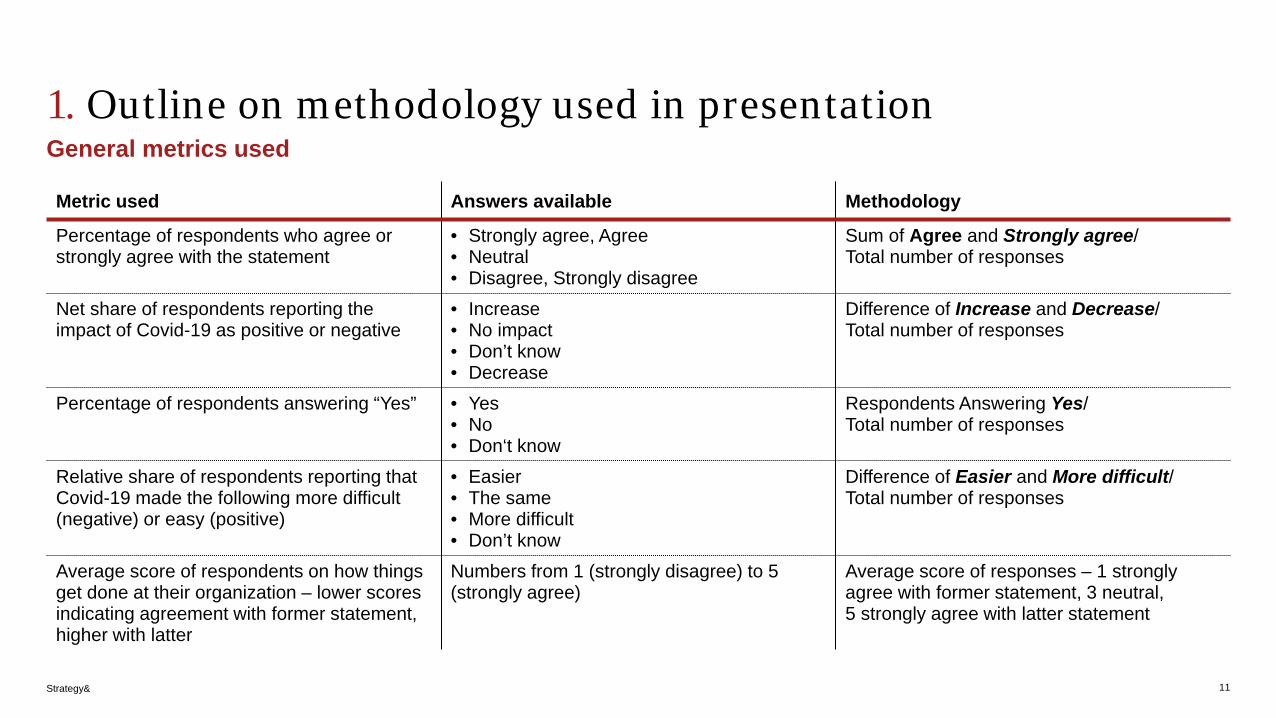
1. Outline on methodology used in presentationGeneral metrics used
11
Metric used Answers available Methodology
Percentage of respondents who agree or strongly agree with the statement
• Strongly agree, Agree• Neutral• Disagree, Strongly disagree
Sum of Agree and Strongly agree/Total number of responses
Net share of respondents reporting the impact of Covid-19 as positive or negative
• Increase• No impact• Don’t know• Decrease
Difference of Increase and Decrease/ Total number of responses
Percentage of respondents answering “Yes” • Yes• No• Don‘t know
Respondents Answering Yes/Total number of responses
Relative share of respondents reporting that Covid-19 made the following more difficult (negative) or easy (positive)
• Easier• The same• More difficult• Don’t know
Difference of Easier and More difficult/ Total number of responses
Average score of respondents on how things get done at their organization – lower scores indicating agreement with former statement, higher with latter
Numbers from 1 (strongly disagree) to 5 (strongly agree)
Average score of responses – 1 strongly agree with former statement, 3 neutral, 5 strongly agree with latter statement

Strategy&
1. Outline on methodology used in presentationImpact of Covid-19
12
Respondents were asked how they considered the impact of Covid-19 on their business along various dimensions (e.g. revenue/profits)
Participants could answer with Increase, No impact, Don’t know, or Decrease• To get an overall view, the answers of all respondents are summed up, using
the following weights: +1 for Increase, 0 for No impact, -1 for Decrease. Answers depicting Don’t know are disregarded in this respect
• This net sum is subsequently divided by the overall number of Increase, No impact, and Decrease responses
Example: European participants reported the impact of Covid-19 on their company’s revenues/profits as:• 276 for Increase, 347 for No impact, 518 for Decrease• Net impact = (276 * 1 + 347 * 0 + 518 * (-1)) / (276 + 347 - 518) = -242 / 1141 =
= -21%
Strategy&
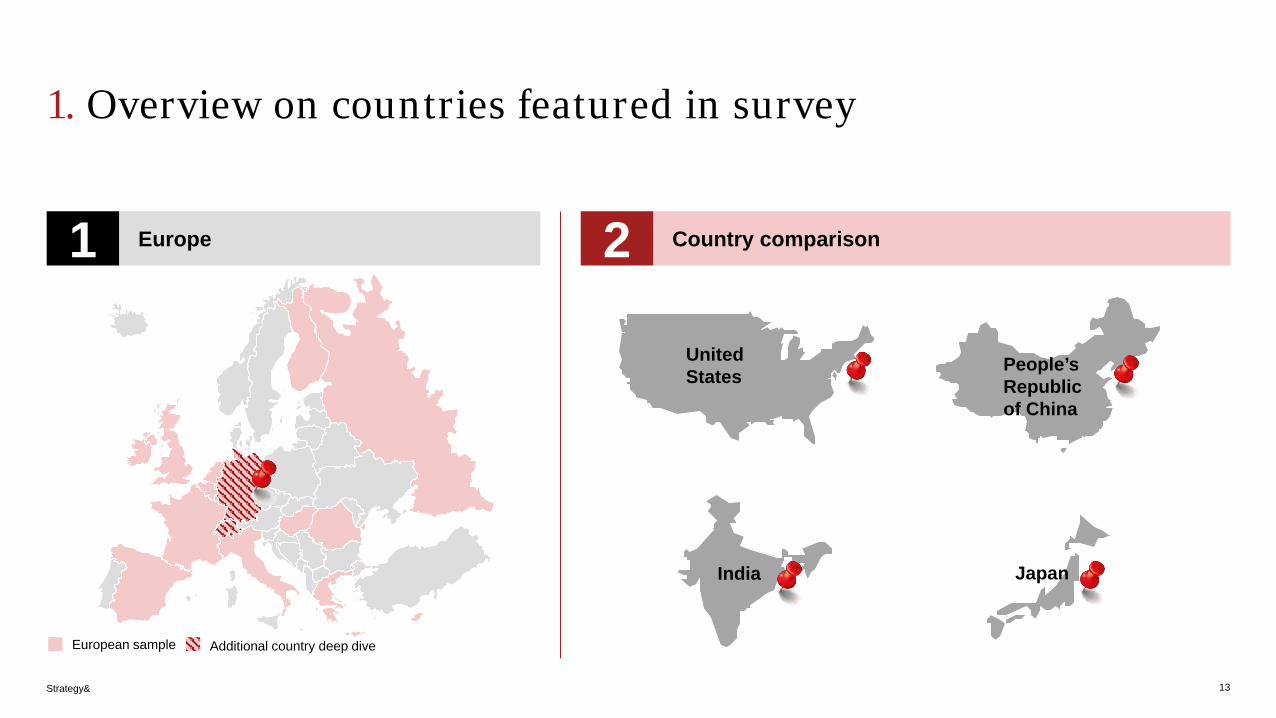
1. Overview on countries featured in survey
13
European sample Additional country deep dive
United States
India Japan
1 Europe 2 Country comparison
People’s Republic of China

Strategy&
1. Overview on countries featured in survey
14
European sample USA, China, India, Japan Global comparison sample
1European cultural attitudes are contrasted with the USA, China, India, and Japan
2
In addition, the remaining countries of the culture study serve as a global control group, with statistical tests being run on whether the differences reported in the survey are based on actual cultural differences

Strategy&
1. Breakdown of respondents by country
15
118 62
239 211 203 201106
117
189 203
201 205
204 208
210 258
308
CountryJapanEurope ChinaGlobal control set USA
1.336
India
1.053France
United Kingdom
Germany
Netherlands
Russia
Switzerland
Others
Malaysia
Singapore
Australia
Canada
South AfricaOthers
3.243 totalrespondents

Strategy&
1. Plurality of respondents from Industrial Producers, Financial Services; share of TMT decreasingDistribution of European respondents by industry
16
20%
23%
16%
8%
27%
7%
N = 240
Includes Government, Education, and Non-profit
21%
12%
25%
10%
18%
12%
N = 1336
Consumer Market (CM)
Financial Services (FS)
Health Industries Advisory (HIA)
Industrial Products and Services (IPS)
Technology, Media and Telecom (TMT)
Others
2018 2020
Strategy&
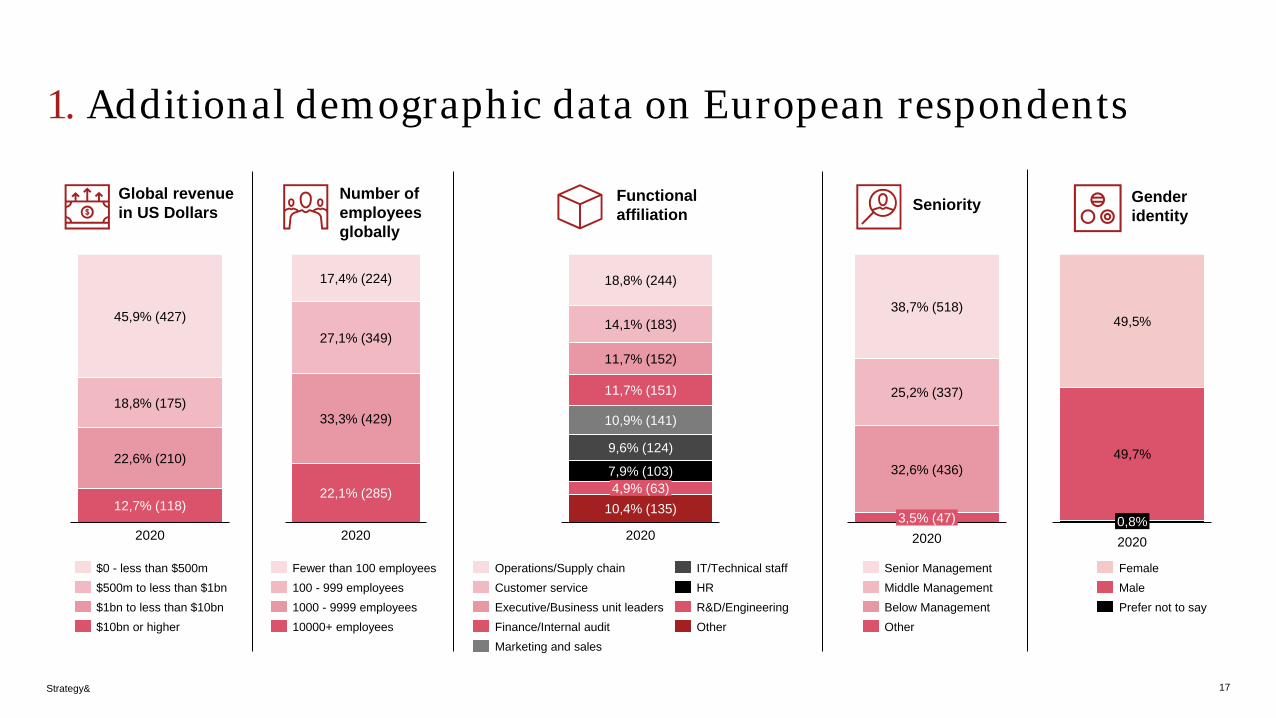
1. Additional demographic data on European respondents
17
18,8% (175)
45,9% (427)
22,6% (210)
12,7% (118)
2020
Global revenue in US Dollars
Number of employees globally
Functional affiliation
$0 - less than $500m$500m to less than $1bn$1bn to less than $10bn$10bn or higher
2020
17,4% (224)
27,1% (349)
22,1% (285)
33,3% (429)
Fewer than 100 employees100 - 999 employees1000 - 9999 employees10000+ employees
7,9% (103)
10,9% (141)
18,8% (244)
9,6% (124)
14,1% (183)
11,7% (152)
11,7% (151)
4,9% (63)10,4% (135)
2020
Marketing and sales
Operations/Supply chainCustomer service
Finance/Internal audit
IT/Technical staff
Executive/Business unit leadersHRR&D/EngineeringOther
Seniority
3,5% (47)
38,7% (518)
25,2% (337)
2020
32,6% (436)
Senior Management
Below ManagementMiddle Management
Other
Gender identity
49,5%
2020
49,7%
0,8%
FemaleMalePrefer not to say
Strategy&
Role of culture
18
Strategy&
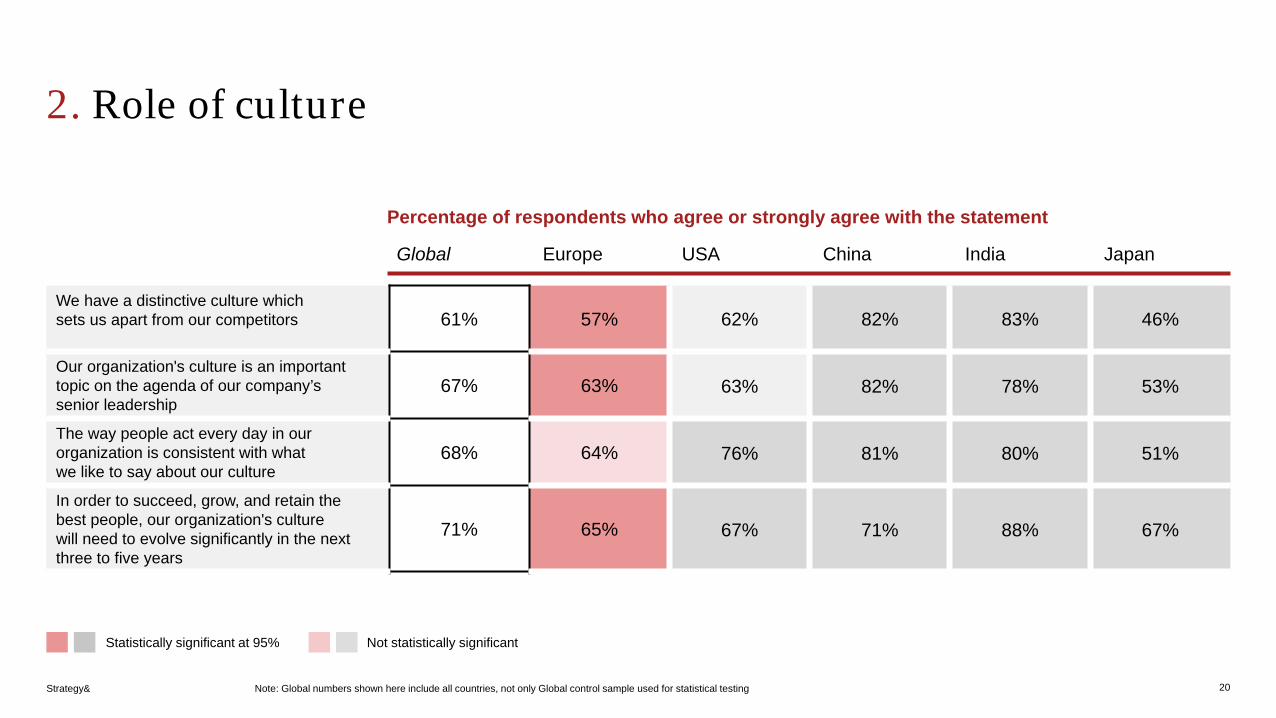
2. European corporate culture is reported to be weaker, especially compared to AsiaRole of culture – summary
19
• Fewer participants from Europe consider their corporate culture to be distinctive compared to the global average. This is consistent with the 2018 findings. German and Swiss respondents consider their culture to be particularly less distinctive
• Culture is perceived to trump strategy and operating model in China and India but not so in Europe, the USA, or Japan. This is a change for Europe from the 2018 study
• By a large margin, respondents from China and India are more likely than Europe, the USA or the global average to consider their corporate culture to be a source of competitive advantage during Covid-19
• European respondents’ perception of their organization‘s ability to change is in line with the global average. Respondents from the USA, China, and India are more optimistic
Strategy&
2. Role of culture
20
We have a distinctive culture which sets us apart from our competitors 61% 57% 62% 82% 83% 46%
Our organization's culture is an important topic on the agenda of our company’s senior leadership
67% 63% 63% 82% 78% 53%
The way people act every day in our organization is consistent with what we like to say about our culture
68% 64% 76% 81% 80% 51%
In order to succeed, grow, and retain the best people, our organization's culture will need to evolve significantly in the next three to five years
71% 65% 67% 71% 88% 67%
Statistically significant at 95% Not statistically significant
Global
Percentage of respondents who agree or strongly agree with the statement
Europe USA China India Japan
Note: Global numbers shown here include all countries, not only Global control sample used for statistical testing

Strategy&
2. Role of culture
21
Our organization's culture has been a source of competitive advantage throughout the Covid-19 pandemic
68% 65% 68% 81% 85% 47%
Our culture enables successful internal change initiatives to happen 66% 62% 67% 83% 82% 41%
Over the past year, our organization has had the ability to adapt quickly to respond to change as necessary
78% 78% 82% 86% 83% 49%
In general, culture is more important to performance than an organization's strategy or operating model
55% 47% 50% 73% 77% 37%
Global
Percentage of respondents who agree or strongly agree with the statement
Europe USA China India Japan
Statistically significant at 95% Not statistically significant
Note: Global numbers shown here include all countries, not only Global control sample used for statistical testing
Strategy&
Impact of Covid-19
22
Strategy&
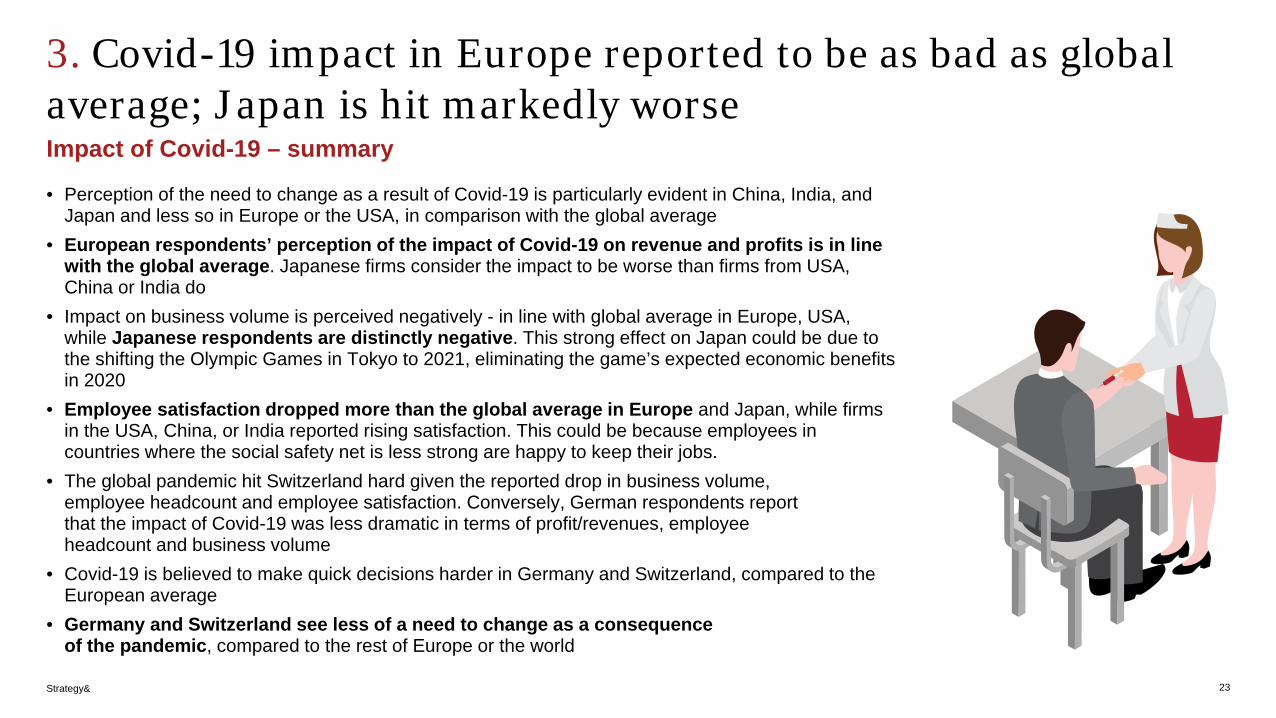
3. Covid-19 impact in Europe reported to be as bad as global average; Japan is hit markedly worseImpact of Covid-19 – summary
23
• Perception of the need to change as a result of Covid-19 is particularly evident in China, India, and Japan and less so in Europe or the USA, in comparison with the global average
• European respondents’ perception of the impact of Covid-19 on revenue and profits is in line with the global average. Japanese firms consider the impact to be worse than firms from USA, China or India do
• Impact on business volume is perceived negatively - in line with global average in Europe, USA, while Japanese respondents are distinctly negative. This strong effect on Japan could be due to the shifting the Olympic Games in Tokyo to 2021, eliminating the game’s expected economic benefits in 2020
• Employee satisfaction dropped more than the global average in Europe and Japan, while firms in the USA, China, or India reported rising satisfaction. This could be because employees in countries where the social safety net is less strong are happy to keep their jobs.
• The global pandemic hit Switzerland hard given the reported drop in business volume, employee headcount and employee satisfaction. Conversely, German respondents report that the impact of Covid-19 was less dramatic in terms of profit/revenues, employee headcount and business volume
• Covid-19 is believed to make quick decisions harder in Germany and Switzerland, compared to the European average
• Germany and Switzerland see less of a need to change as a consequence of the pandemic, compared to the rest of Europe or the world
Strategy&
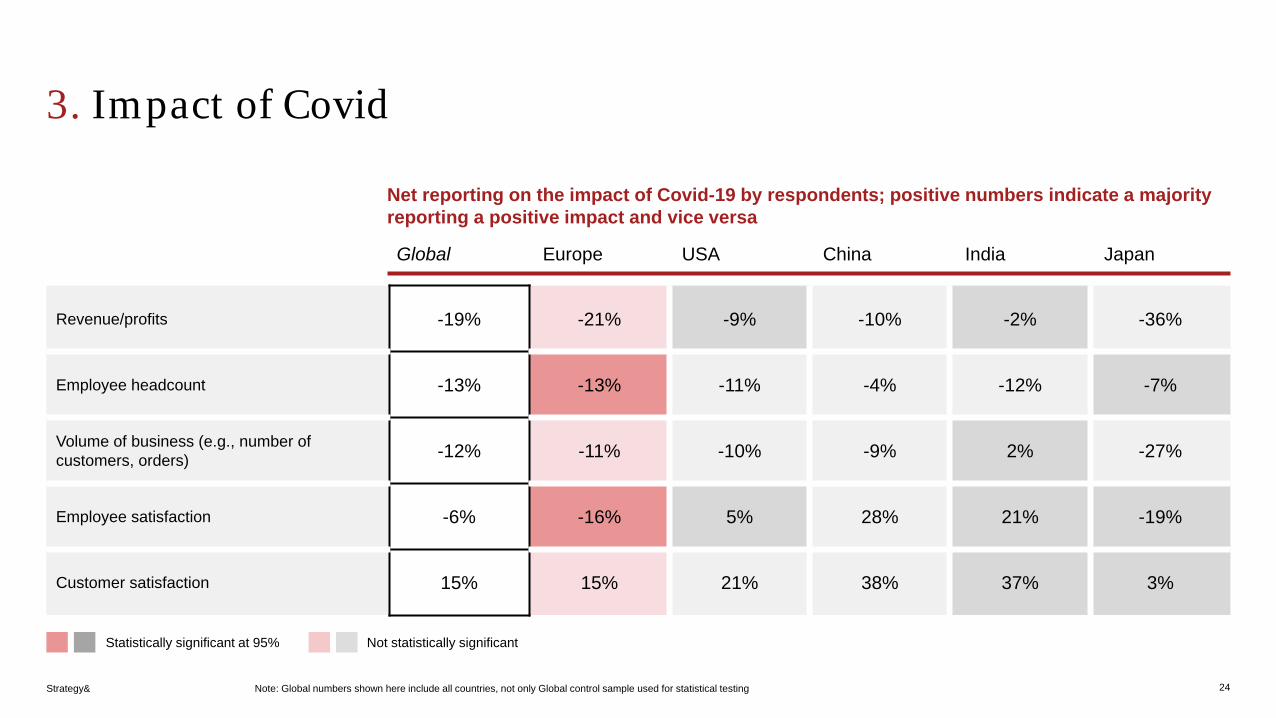
3. Impact of Covid
24
Revenue/profits -19% -21% -9% -10% -2% -36%
Employee headcount -13% -13% -11% -4% -12% -7%
Volume of business (e.g., number of customers, orders) -12% -11% -10% -9% 2% -27%
Employee satisfaction -6% -16% 5% 28% 21% -19%
Customer satisfaction 15% 15% 21% 38% 37% 3%
Global
Net reporting on the impact of Covid-19 by respondents; positive numbers indicate a majority reporting a positive impact and vice versa
Europe USA China India Japan
Statistically significant at 95% Not statistically significant
Note: Global numbers shown here include all countries, not only Global control sample used for statistical testing

Strategy&
3. Impact of Covid
25
Making decisions quickly -7% -6% -8% 17% -3% -17%
Collaborating with colleagues -20% -29% -34% 27% 7% -21%
Coaching and developing talent -29% -38% -30% 1% -9% -36%
Developing or maintaining a sense of community among peers/colleagues -25% -36% -34% 37% 0% -23%
Responding to customer needs -16% -21% -18% 14% 6% -30%
Global
Net reporting on the impact of Covid-19 by respondents; positive numbers indicate a majority reporting a positive impact and vice versa
Europe USA China India Japan
Statistically significant at 95% Not statistically significant
Note: Global numbers shown here include all countries, not only Global control sample used for statistical testing

Strategy&
3. Impact of Covid
26
Innovating new products and services -10% -11% -14% 9% 7% -22%
Producing/delivering expected results -21% -27% -19% 0% -2% -24%
Do you believe your organization's business/operating model needs to change as a result of the Covid-19 pandemic?
61% 56% 51% 68% 78% 69%
Percentage of respondents who answer “Yes”
Global
Net reporting on the impact of Covid-19 by respondents; positive numbers indicate a majority reporting a positive impact and vice versa
Europe USA China India Japan
Statistically significant at 95% Not statistically significant
Note: Global numbers shown here include all countries, not only Global control sample used for statistical testing

Strategy&
Change enabler
27
Strategy&
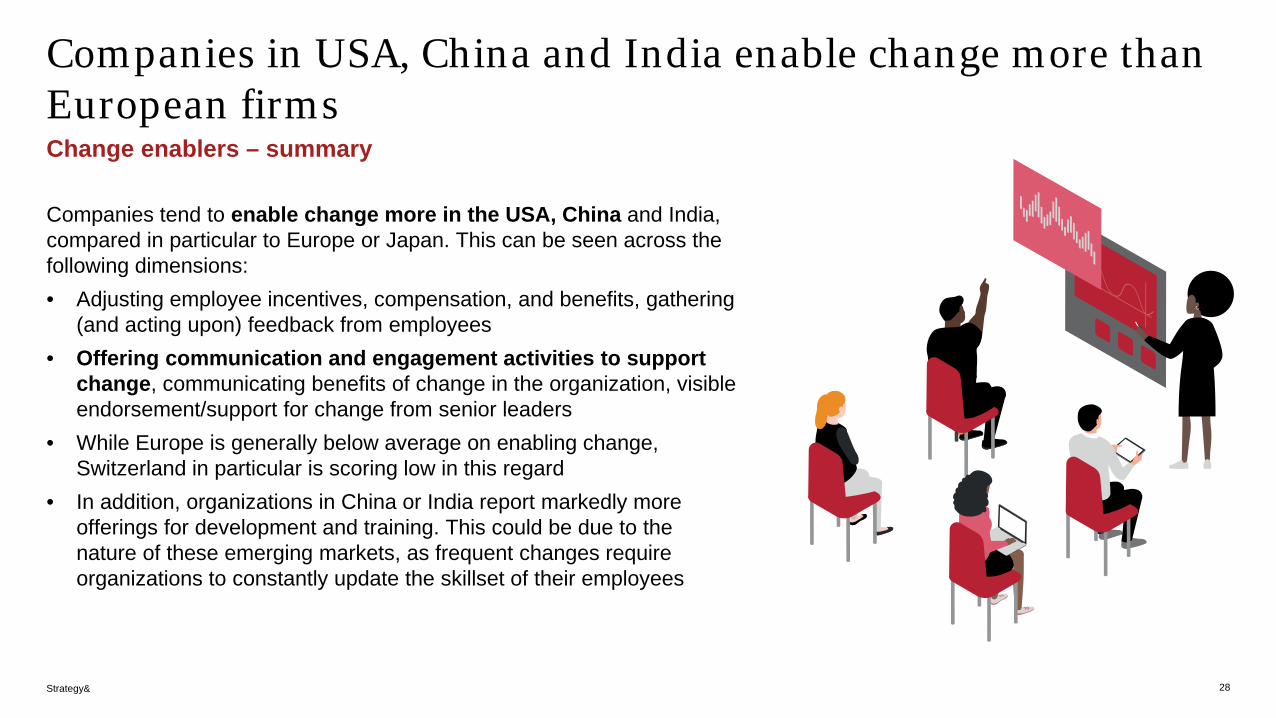
Companies in USA, China and India enable change more than European firmsChange enablers – summary
28
Companies tend to enable change more in the USA, China and India, compared in particular to Europe or Japan. This can be seen across the following dimensions: • Adjusting employee incentives, compensation, and benefits, gathering
(and acting upon) feedback from employees• Offering communication and engagement activities to support
change, communicating benefits of change in the organization, visible endorsement/support for change from senior leaders
• While Europe is generally below average on enabling change, Switzerland in particular is scoring low in this regard
• In addition, organizations in China or India report markedly more offerings for development and training. This could be due to the nature of these emerging markets, as frequent changes require organizations to constantly update the skillset of their employees

Strategy&
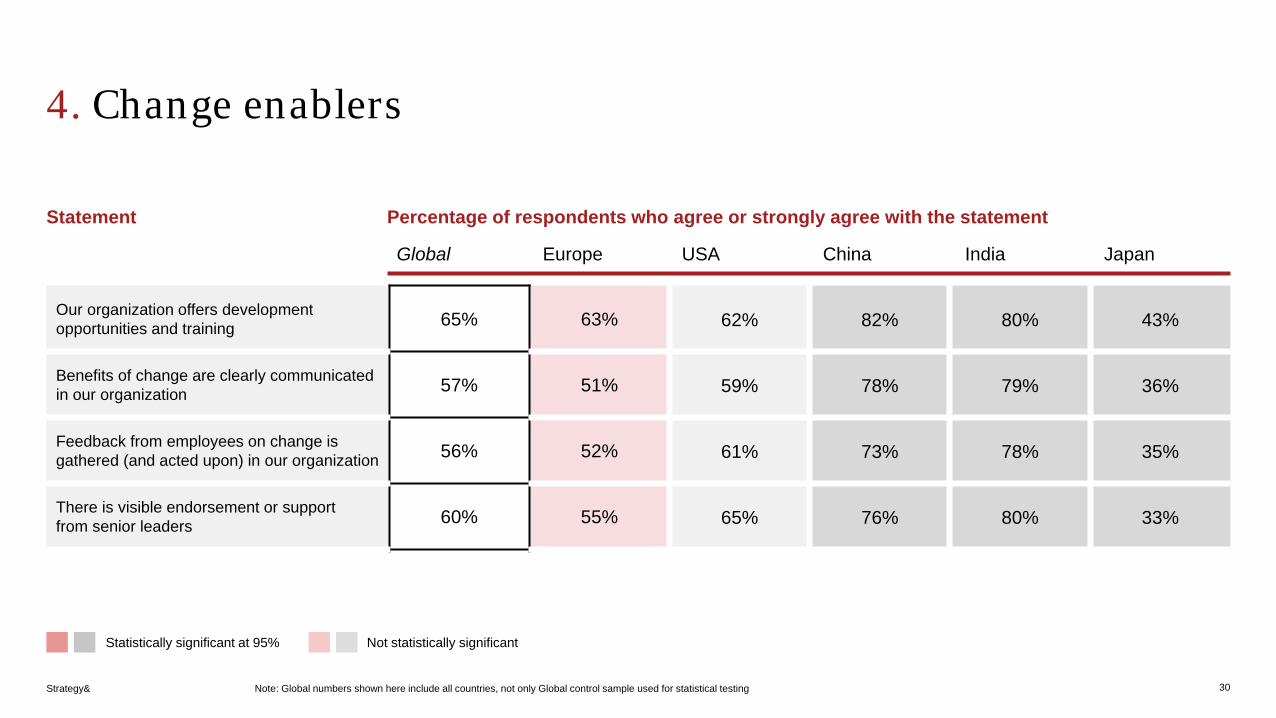
4. Change enablers
29
Our senior leaders set the tone from the top 64% 61% 73% 77% 80% 38%
Our employee networks support each other with change informally 62% 61% 64% 68% 81% 23%
Our organization provides the right technology and tools (to support change) 63% 62% 60% 79% 84% 35%
Our organization adjusts employee incentives, compensation and benefits 53% 46% 59% 73% 74% 40%
Our organization offers communications and engagement activities (to support change) 61% 57% 61% 74% 79% 32%
Statement
Global
Percentage of respondents who agree or strongly agree with the statement
Europe USA China India Japan
Statistically significant at 95% Not statistically significant
Note: Global numbers shown here include all countries, not only Global control sample used for statistical testing
Strategy&
4. Change enablers
30
Our organization offers development opportunities and training 65% 63% 62% 82% 80% 43%
Benefits of change are clearly communicated in our organization 57% 51% 59% 78% 79% 36%
Feedback from employees on change is gathered (and acted upon) in our organization 56% 52% 61% 73% 78% 35%
There is visible endorsement or support from senior leaders 60% 55% 65% 76% 80% 33%
Statement
Statistically significant at 95% Not statistically significant
Global
Percentage of respondents who agree or strongly agree with the statement
Europe USA China India Japan
Note: Global numbers shown here include all countries, not only Global control sample used for statistical testing
Strategy&
Areas of improvement
31
Strategy&
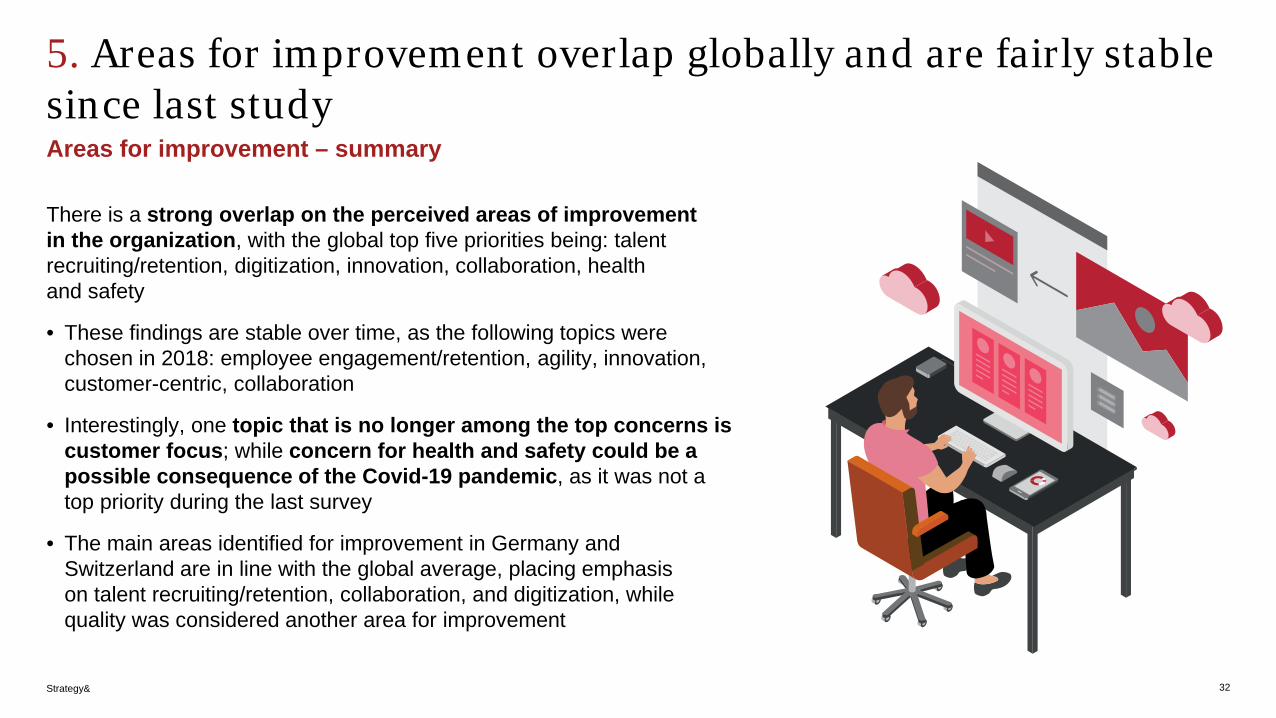
5. Areas for improvement overlap globally and are fairly stable since last studyAreas for improvement – summary
32
There is a strong overlap on the perceived areas of improvement in the organization, with the global top five priorities being: talent recruiting/retention, digitization, innovation, collaboration, health and safety
• These findings are stable over time, as the following topics were chosen in 2018: employee engagement/retention, agility, innovation, customer-centric, collaboration
• Interestingly, one topic that is no longer among the top concerns is customer focus; while concern for health and safety could be a possible consequence of the Covid-19 pandemic, as it was not a top priority during the last survey
• The main areas identified for improvement in Germany and Switzerland are in line with the global average, placing emphasis on talent recruiting/retention, collaboration, and digitization, while quality was considered another area for improvement
Strategy&
5. Innovation, talent and digitization are top concerns across major economiesIn your opinion, which of the following aspects, if any, need to be improved in your organization?
Note: Innovation includes „Anticipating and responding to disruption“ 33
Diversity and inclusionInnovation
Talent recruiting/ retention Digitization
Health and safety
Colla-boration Agility Quality
Operational Excellence
Cost cutting
Cost effectiveness
ChinaGlobal USAEU India JapanMost popular choices
Strategy&
Strength of culture
34

Strategy&
6. USA, China, India also report stronger culture than global average and Europe in particularStrength of culture – summary
35
The reported corporate culture tends to be stronger in the USA, China, or India in comparison with the global average and by an even more sizeable margin than in Europe or Japan. This can be seen across the following dimensions:• Reporting a strong sense of purpose, feeling a connection to the organization’s
purpose, having the impression that one can be authentic self in organization• Having the corporate leadership “walk the talk”, feeling the organization
supports relevant social and/or environmental issues• Team members motivating and inspiring individuals, team members being good
at adapting to accomplish goals• Moreover, Swiss respondents consider their corporate culture to be weaker
than the European average, particularly on walking the talk, the organizational purpose, and teams adapting how they work in order to better accomplish their goals
• German respondents are less likely to agree that their organization has a strong sense of purpose, and that individuals believe that they have the right skills to be successful

Strategy&
6. Strength of culture
36
Our organization has a strong sense of purpose 73% 71% 80% 75% 87% 54%
I feel a personal connection to our organization's purpose 67% 66% 75% 72% 81% 47%
Our organization supports relevant societal and/or environmental issues 64% 60% 69% 82% 77% 49%
Our leadership team consistently acts as role models for our purpose, values and culture (they "walk the talk")
60% 54% 65% 76% 82% 38%
I believe I have the right skills to be successful in our organization 81% 84% 91% 83% 85% 53%
StatementStatement
Statistically significant at 95% Not statistically significant
Global
Percentage of respondents who agree or strongly agree with the statement
Europe USA China India Japan
Note: Global numbers shown here include all countries, not only Global control sample used for statistical testing

Strategy&
6. Strength of culture
37
I am motivated to learn new skills to support our organization's success 76% 75% 74% 84% 85% 56%
Our team members motivate and inspire me to do my best work 67% 63% 69% 80% 89% 49%
Our team members are good at adapting how we work in order to better accomplish our goals
70% 66% 78% 77% 89% 59%
I feel I can be my whole ('authentic’) self in our organization 63% 64% 69% 69% 77% 34%
StatementStatement
Global
Percentage of respondents who agree or strongly agree with the statement
Europe USA China India Japan
Statistically significant at 95% Not statistically significant
Note: Global numbers shown here include all countries, not only Global control sample used for statistical testing
Strategy&
6. Strength of culture
38
Our organization actively listens to differing voices and perspectives when making major decisions, even if it adds time and complexity
56% 49% 62% 70% 78% 43%
Our organization encourages open discussions around sensitive/uncomfortable topics
52% 49% 59% 52% 72% 39%
My colleagues take the time to understand my background especially when it differs from their own
56% 55% 53% 57% 78% 37%
Our organization embraces flexibility and makes adjustments to help people with differing needs excel at work
62% 55% 70% 75% 81% 46%
Statement
Global
Percentage of respondents who agree or strongly agree with the statement
Europe USA China India Japan
Statistically significant at 95% Not statistically significant
Note: Global numbers shown here include all countries, not only Global control sample used for statistical testing

Strategy&
Cultural thumbprint
39

Strategy&
Europe and USA report stronger preference for incremental change, established procedures and external stakeholdersCultural thumbprint
40
• Europe shows a stronger support for a single point of authority than the rest of the world, which has more of a preference for collective decision-making. The differences are very small when it comes to the perception of the value of titles and hierarchy. Only Japan shows a preference for hierarchy
• In comparison with China, India, or Japan, Europe and the US have a stronger preference for external stakeholders over internal operations, incremental change over revolutionary change, completing tasks with informal relationships over the formal chain of command, and following set processes and procedures over encouraging improvisation
• Europe, the USA and Japan tend to fix problems as they arise. This is different from the approach in China or India• Swiss respondents are more likely than the European average to consider their corporate culture to be weaker;
this is particularly true for walking the talk, the organizational purpose, and teams adapting how they work in order to better accomplish their goals
• German respondents agree less that their organization has a strong sense of purpose, and that individuals have the right skills to be successful
• German companies have a preference for completing tasks via formal chains of command rather than through informal relationships
• Germany and Switzerland all report a trend towards a single point of accountability, and more so than in Europe and than the global average in particular
• Compared to their global and particularly European peers, Germany and Switzerland also have a stronger focus on external stakeholders
• Swiss firms focus on financial metrics more than the European average
Strategy&
Cultural thumbprint
41
Having single points of accountability
Making decisions via consensus
Being polite and cordial in our interactions
Accepting conflict in our interactions
Valuing loyalty Valuing performance
Stressing individual performance
Stressing team performance
Statement
Global
Average score of respondents on how things get done at their organization – scores below 3 indicating agreement with former statement, above 3 with latter statement
Europe USA China India Japan
Statistically significant at 95% Not statistically significant
Note: Global numbers shown here include all countries, not only Global control sample used for statistical testing
1 3 42 5 1 3 42 5 1 3 42 5 1 3 42 5 1 3 42 5 1 3 42 5
1 3 42 5 1 3 42 5 1 3 42 5 1 3 42 5 1 3 42 5 1 3 42 5
1 3 42 5 1 3 42 5 1 3 42 5 1 3 42 5 1 3 42 5 1 3 42 5
1 3 42 5 1 3 42 5 1 3 42 5 1 3 42 5 1 3 42 5 1 3 42 5
3,18
2,66
3,23
3,37
2,99
2,59
3,19
3,31
3,23
2,58
3,31
3,33
3,52
2,46
2,93
3,89
3,50
2,76
3,45
3,65
3,25
2,55
3,19
3,35

Strategy&
Cultural thumbprint
42
Focusing on external strategy/customers
Focusing on internal operations
Fixing problems as they arise
Preventing problems before they arise
Pursuing Incremental change
Pursuing Revolutionary Change
Valuing titles and levels Being flat and non-hierarchical
Statement
Global
Average score of respondents on how things get done at their organization – scores below 3 indicating agreement with former statement, above 3 with latter statement
Europe USA China India Japan
Statistically significant at 95% Not statistically significant
2,93 2,85 2,85 2,99 2,99
3.01 2,92 2,88 3,31 2,82
2,87 2,69 2,67 2,89
2,81 2,81 2,79 2,98
Note: Global numbers shown here include all countries, not only Global control sample used for statistical testing
1 3 42 5 1 3 42 5 1 3 42 5 1 3 42 5 1 3 42 5 1 3 42 5
1 3 42 5 1 3 42 5 1 3 42 5 1 3 42 5 1 3 42 5 1 3 42 5
1 3 42 5 1 3 42 5 1 3 42 5 1 3 42 5 1 3 42 5 1 3 42 5
1 3 42 5 1 3 42 5 1 3 42 5 1 3 42 5 1 3 42 5 1 3 42 5
3,12
2,89
3,17
3,43
3,38
2,87

Strategy&
Cultural thumbprint
43
Completing tasks via informal relationships
Completing tasks via formal chains of command
Focusing mostly on financial metrics
Focusing on broader performance measures
Being comfortable with risk Being risk-averse
Following set processes/ procedures
Encouraging improvisation
Statement
Global
Average score of respondents on how things get done at their organization – scores below 3 indicating agreement with former statement, above 3 with latter statement
Europe USA China India Japan
Statistically significant at 95% Not statistically significant
Note: Global numbers shown here include all countries, not only Global control sample used for statistical testing
1 3 42 5 1 3 42 5 1 3 42 5 1 3 42 5 1 3 42 5 1 3 42 5
1 3 42 5 1 3 42 5 1 3 42 5 1 3 42 5 1 3 42 5 1 3 42 5
1 3 42 5 1 3 42 5 1 3 42 5 1 3 42 5 1 3 42 5 1 3 42 5
1 3 42 5 1 3 42 5 1 3 42 5 1 3 42 5 1 3 42 5 1 3 42 5
3,22
3,18
3,24
2,84
3,15
3,11
3,20
2,67
3,09
3,18
3,30
2,86
3,56
3,57
3,46
3,51
3,31
3,42
3,21
3,53
3,47
3,20
3,57
2,52
Strategy&
Deep dive for Germany and Switzerland
44
Strategy&
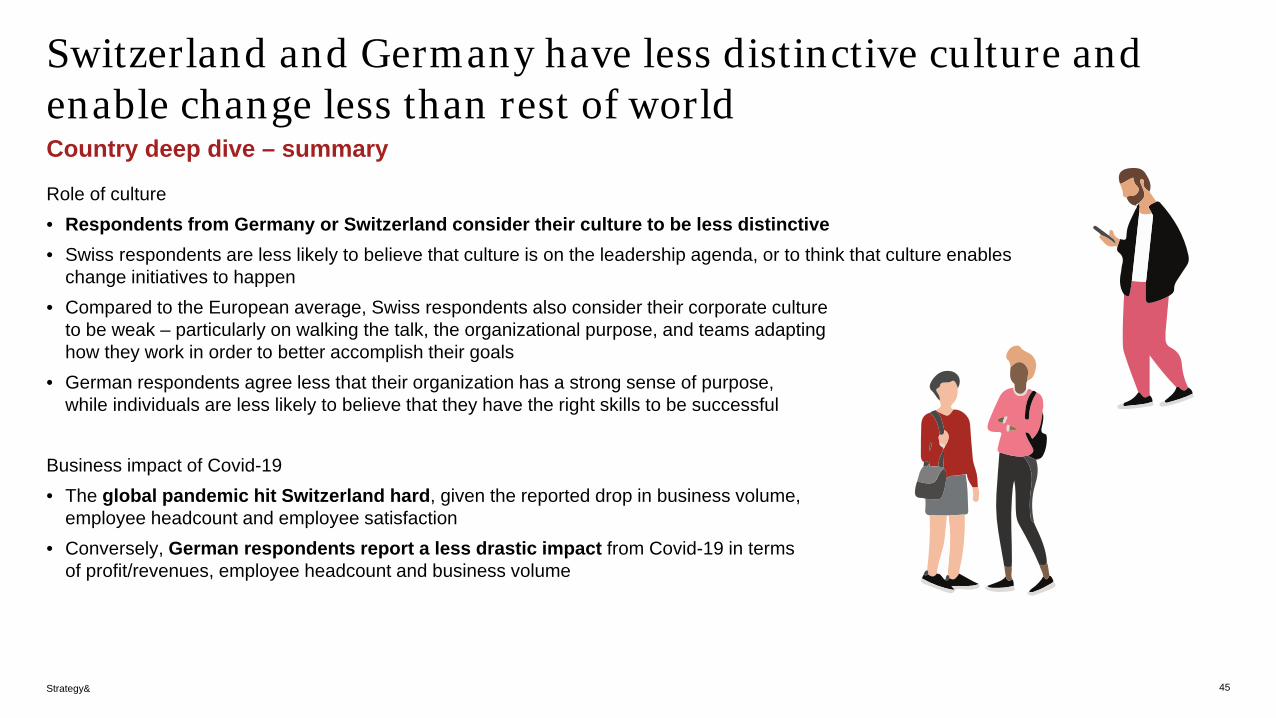
Switzerland and Germany have less distinctive culture and enable change less than rest of worldCountry deep dive – summary
45
Role of culture• Respondents from Germany or Switzerland consider their culture to be less distinctive• Swiss respondents are less likely to believe that culture is on the leadership agenda, or to think that culture enables
change initiatives to happen• Compared to the European average, Swiss respondents also consider their corporate culture
to be weak – particularly on walking the talk, the organizational purpose, and teams adapting how they work in order to better accomplish their goals
• German respondents agree less that their organization has a strong sense of purpose, while individuals are less likely to believe that they have the right skills to be successful
Business impact of Covid-19• The global pandemic hit Switzerland hard, given the reported drop in business volume,
employee headcount and employee satisfaction• Conversely, German respondents report a less drastic impact from Covid-19 in terms
of profit/revenues, employee headcount and business volume
Strategy&
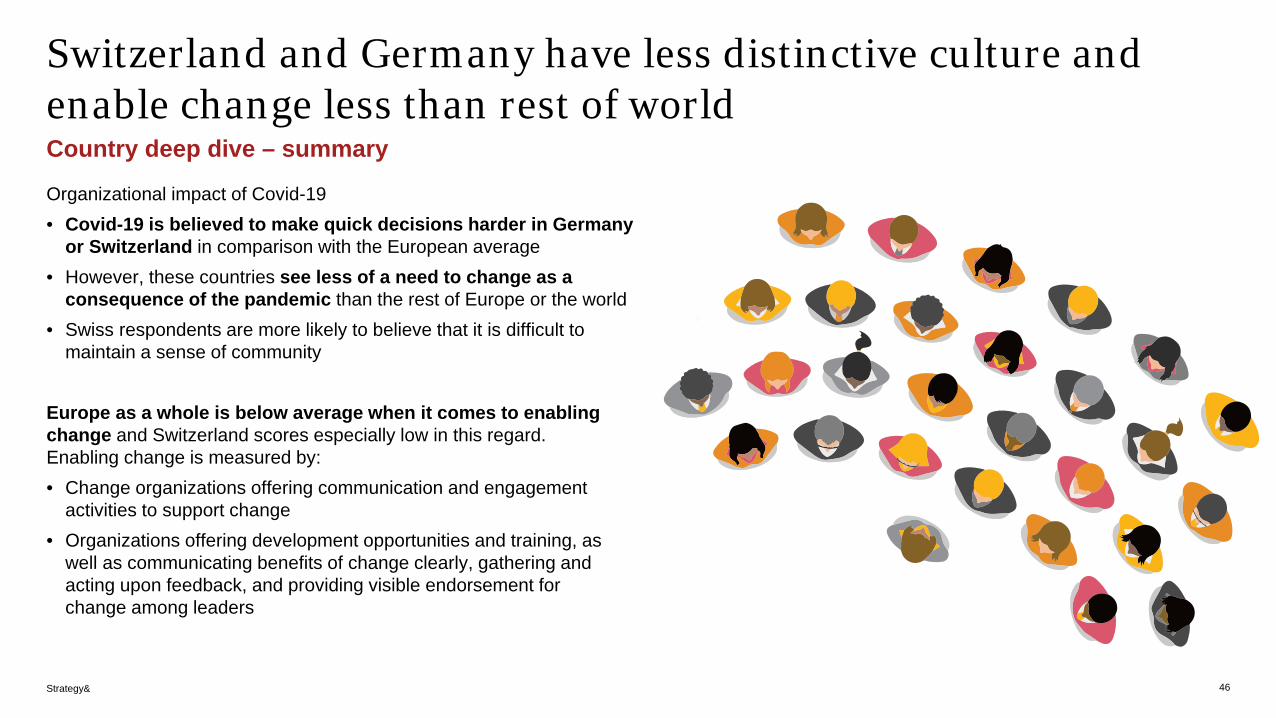
Switzerland and Germany have less distinctive culture and enable change less than rest of worldCountry deep dive – summary
46
Organizational impact of Covid-19• Covid-19 is believed to make quick decisions harder in Germany
or Switzerland in comparison with the European average• However, these countries see less of a need to change as a
consequence of the pandemic than the rest of Europe or the world• Swiss respondents are more likely to believe that it is difficult to
maintain a sense of community
Europe as a whole is below average when it comes to enabling change and Switzerland scores especially low in this regard. Enabling change is measured by:• Change organizations offering communication and engagement
activities to support change• Organizations offering development opportunities and training, as
well as communicating benefits of change clearly, gathering and acting upon feedback, and providing visible endorsement for change among leaders

Strategy&
German and Swiss companies consider quality to be a major concernCountry deep dive – summary
47
Areas for improvement• The main identified areas for improvement are in line with the global average, placing
emphasis on talent recruiting/retention, collaboration, and digitization• For Germany and Switzerland, quality is seen as another area for improvement• Cost-cutting is a major concern for consumer goods companies in all these countries,
and features as a top-five priority for improvement
Cultural thumbprint• In comparison with Europe and particularly the world, Germany and Switzerland report a
trend towards a single point of accountability, • Germany and Switzerland also have a stronger focus on external stakeholders,
compared to their global and particularly European peers• German companies have a preference to completing tasks via formal chains of command
instead of through informal relationships• Swiss firms focus more on financial metrics than the European average; as opposed to
Dutch firms which incorporate broader performance measures

Strategy&
Large companies and manufacturing firms from Germany, Switzerland hit relatively harder by Covid-19Country deep dive – summary
48
As far as Covid-19 is concerned, large companies in Germany or Switzerland are different from the European average along the following lines:• Perceive less need for change as a result of Covid-19• Steeper fall in Employee headcount, employee satisfaction, and collaborating with colleagues• Less significant reduction in revenue/profits, volume of business, ability to coach and develop talent• On a general level, large companies in these countries are more comfortable with risks than the European average
The manufacturing sector in these countries has been affected in different ways:• Industrial companies in Germany were hit harder by Covid-19 with respect to their revenue/profits, business volume,
employee satisfaction/Covid-19 has made it harder to collaborate with colleagues• However, industrial companies are more likely to have leadership supporting change, with
benefits of change clearly reported, while also having visible endorsement from senior leaders
Senior management in Germany • Need for culture change in organization is seen to be particularly pressing.
Have seen evidence that the organization is able to respond to change• Top concerns by senior management include cost effectiveness and health and safety• Senior management seems to be less bureaucratic: supports improvisation over following
set procedures and completing tasks via informal relationships instead of through formal chains of command• Stronger emphasis on a broader range of performance measures rather than just
financial metrics
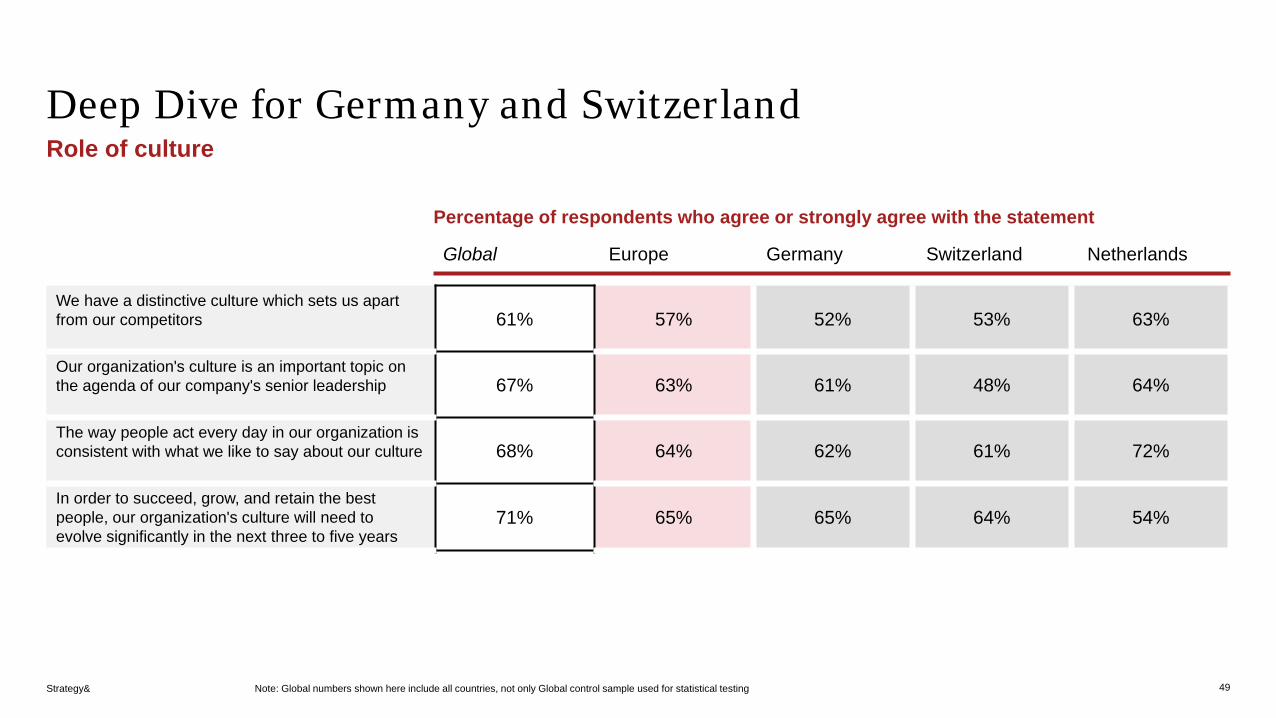
Strategy&
Deep Dive for Germany and SwitzerlandRole of culture
49
We have a distinctive culture which sets us apart from our competitors 61% 57% 52% 53% 63%
Our organization's culture is an important topic on the agenda of our company's senior leadership 67% 63% 61% 48% 64%
The way people act every day in our organization is consistent with what we like to say about our culture 68% 64% 62% 61% 72%
In order to succeed, grow, and retain the best people, our organization's culture will need to evolve significantly in the next three to five years
71% 65% 65% 64% 54%
Percentage of respondents who agree or strongly agree with the statement
Global Europe Germany Switzerland Netherlands
Note: Global numbers shown here include all countries, not only Global control sample used for statistical testing

Strategy&
Deep Dive for Germany and SwitzerlandRole of culture
50
Our organization's culture has been a source of competitive advantage throughout the Covid-19 pandemic
68% 65% 57% 57% 62%
Our culture enables successful internal change initiatives to happen 66% 62% 60% 55% 61%
Over the past year, our organization has had the ability to adapt quickly to respond to change as necessary
78% 78% 68% 71% 72%
In general, culture is more important to performance than an organization's strategy or operating model 55% 47% 44% 49% 43%
Percentage of respondents who agree or strongly agree with the statement
Global Europe Germany Switzerland Netherlands
Note: Global numbers shown here include all countries, not only Global control sample used for statistical testing

Strategy&
Deep Dive for Germany and SwitzerlandImpact of Covid
51
Revenue/profits-19% -21% -11% -25% -5%
Employee headcount-13% -13% -3% -27% -5%
Volume of business (e.g., number of customers, orders) -12% -11% -3% -25% 3%
Employee satisfaction-6% -16% -7% -23% -15%
Customer satisfaction-9% 15% 5% 8% 13%
Global Europe Germany Switzerland Netherlands
Note: Global numbers shown here include all countries, not only Global control sample used for statistical testing
Net reporting on the impact of Covid-19 by respondents; positive numbers indicate a majority reporting a positive impact and vice versa
Strategy&
Deep Dive for Germany and SwitzerlandImpact of Covid
52
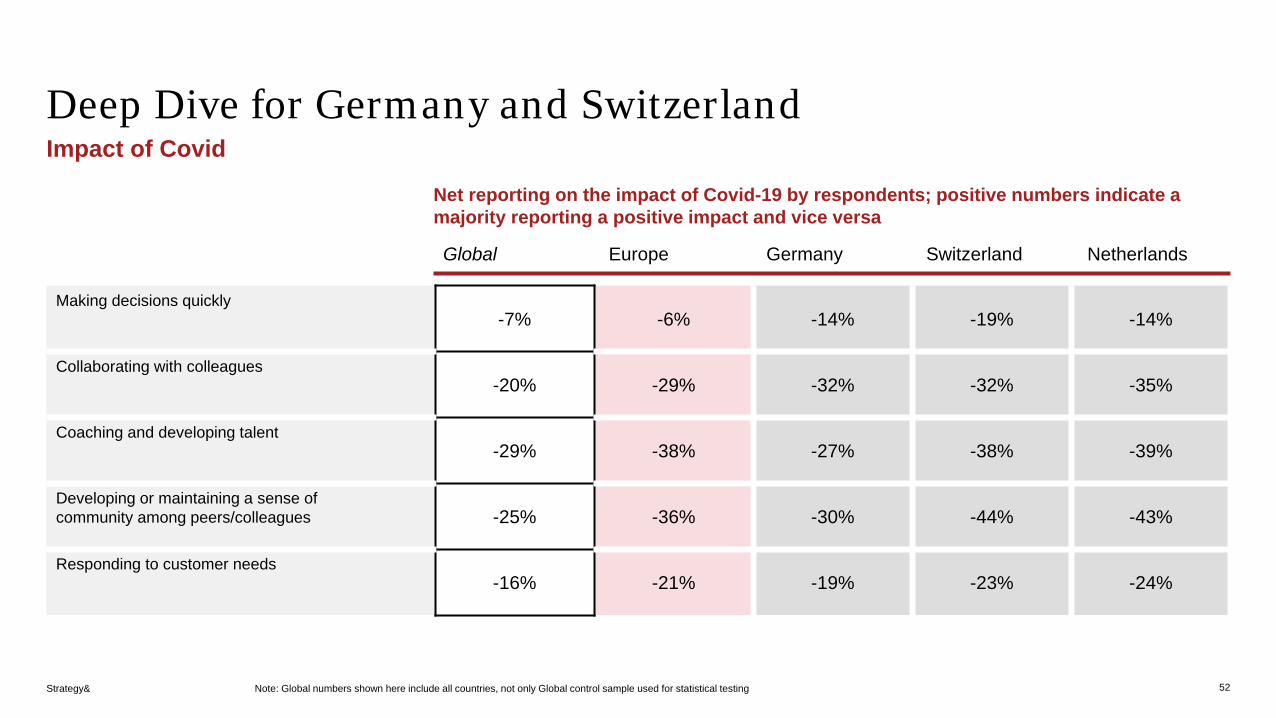
Making decisions quickly-7% -6% -14% -19% -14%
Collaborating with colleagues-20% -29% -32% -32% -35%
Coaching and developing talent-29% -38% -27% -38% -39%
Developing or maintaining a sense of community among peers/colleagues -25% -36% -30% -44% -43%
Responding to customer needs-16% -21% -19% -23% -24%
Global Europe Germany Switzerland Netherlands
Note: Global numbers shown here include all countries, not only Global control sample used for statistical testing
Net reporting on the impact of Covid-19 by respondents; positive numbers indicate a majority reporting a positive impact and vice versa
Strategy&
Deep Dive for Germany and SwitzerlandImpact of Covid
53
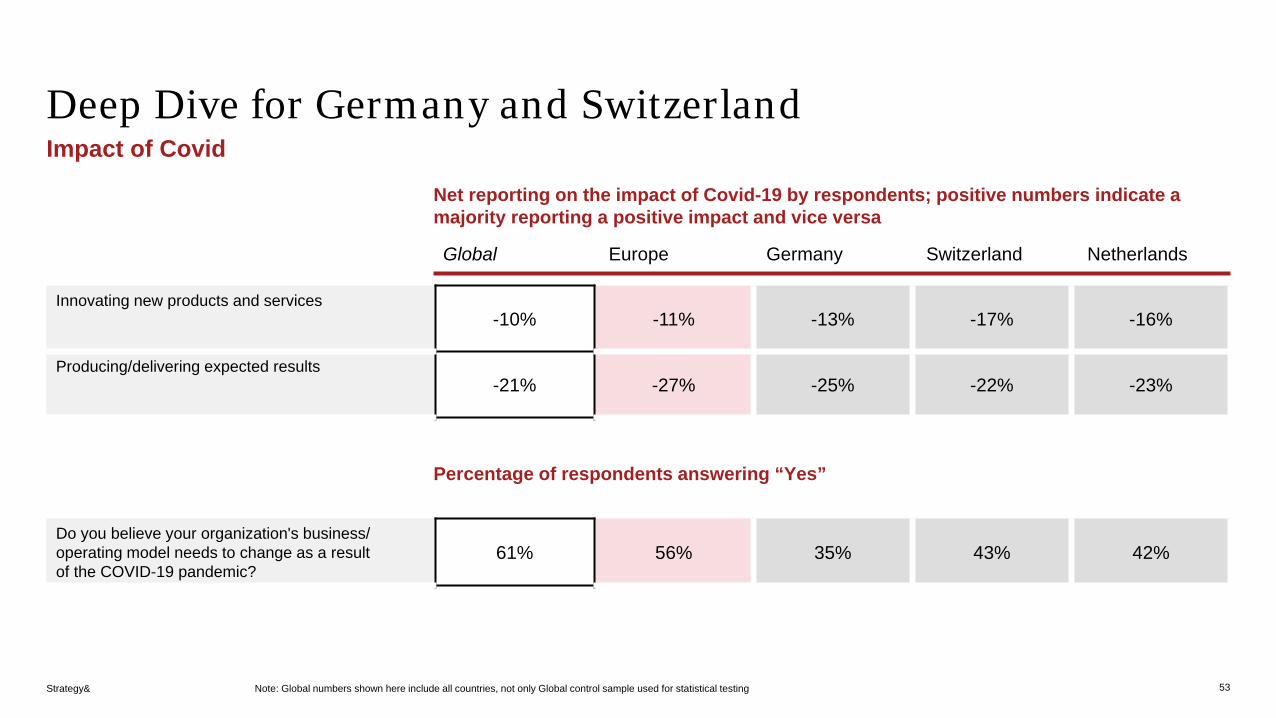
Innovating new products and services-10% -11% -13% -17% -16%
Producing/delivering expected results-21% -27% -25% -22% -23%
Do you believe your organization's business/ operating model needs to change as a result of the COVID-19 pandemic?
61% 56% 35% 43% 42%
Percentage of respondents answering “Yes”
Global Europe Germany Switzerland Netherlands
Note: Global numbers shown here include all countries, not only Global control sample used for statistical testing
Net reporting on the impact of Covid-19 by respondents; positive numbers indicate a majority reporting a positive impact and vice versa
Strategy&
Deep Dive for Germany and SwitzerlandChange enablers
54
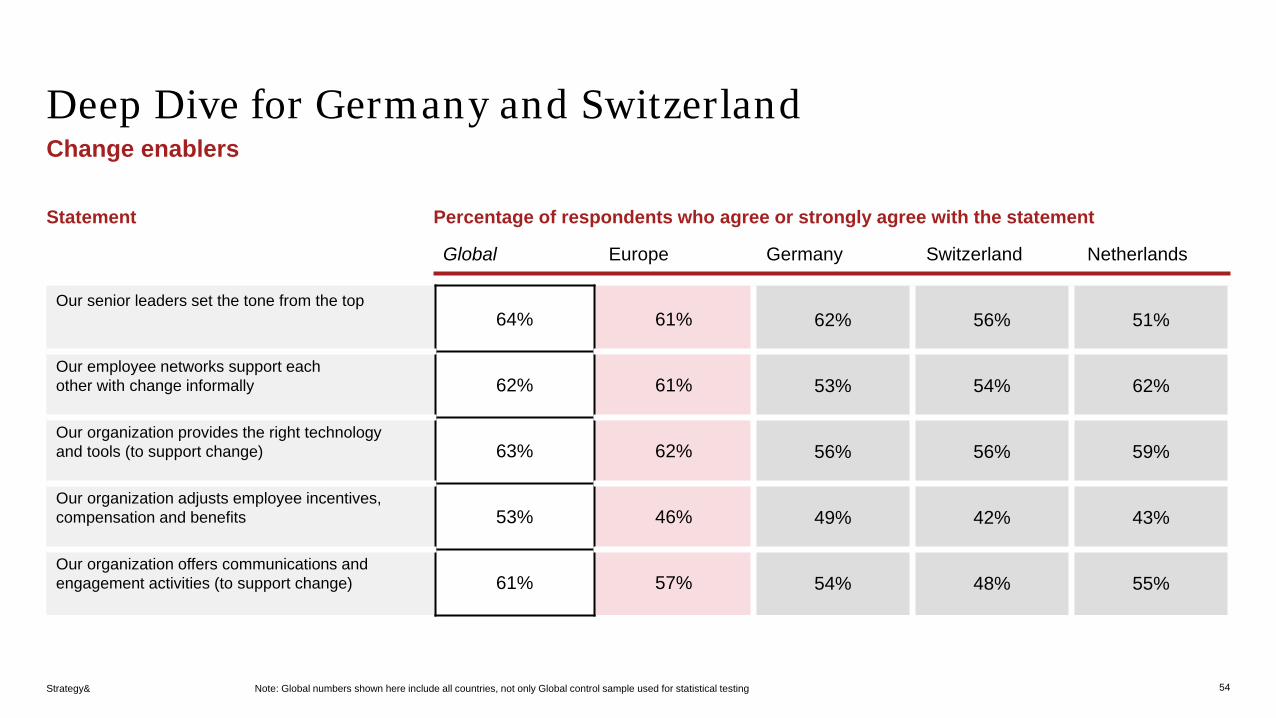
Our senior leaders set the tone from the top64% 61% 62% 56% 51%
Our employee networks support each other with change informally 62% 61% 53% 54% 62%
Our organization provides the right technology and tools (to support change) 63% 62% 56% 56% 59%
Our organization adjusts employee incentives, compensation and benefits 53% 46% 49% 42% 43%
Our organization offers communications and engagement activities (to support change) 61% 57% 54% 48% 55%
Statement Percentage of respondents who agree or strongly agree with the statement
Global Europe Germany Switzerland Netherlands
Note: Global numbers shown here include all countries, not only Global control sample used for statistical testing

Strategy&
Deep Dive for Germany and SwitzerlandChange enablers
55
Our organization offers development opportunities and training 65% 63% 62% 48% 63%
Benefits of change are clearly communicated in our organization 57% 51% 56% 42% 53%
Feedback from employees on change is gathered (and acted upon) in our organization 56% 52% 50% 42% 51%
There is visible endorsement or support from senior leaders 60% 55% 53% 43% 55%
Statement Percentage of respondents who agree or strongly agree with the statement
Global Europe Germany Switzerland Netherlands
Note: Global numbers shown here include all countries, not only Global control sample used for statistical testing

Strategy&
German and Swiss companies with focus on quality, but not agilityIn your opinion, which of the following aspects, if any, need to be improved in your organization?
Note: Innovation includes „Anticipating and responding to disruption“ 56
Talent recruiting/ retention Health & SafetyDigitization InnovationCollaboration Quality Agility
Global EU Germany Switzerland
Top concern for German and Swiss, but not European
companies
Top concern for European, but not German or Swiss
companies
Strategy&
Deep Dive for Germany and SwitzerlandStrength of culture
57
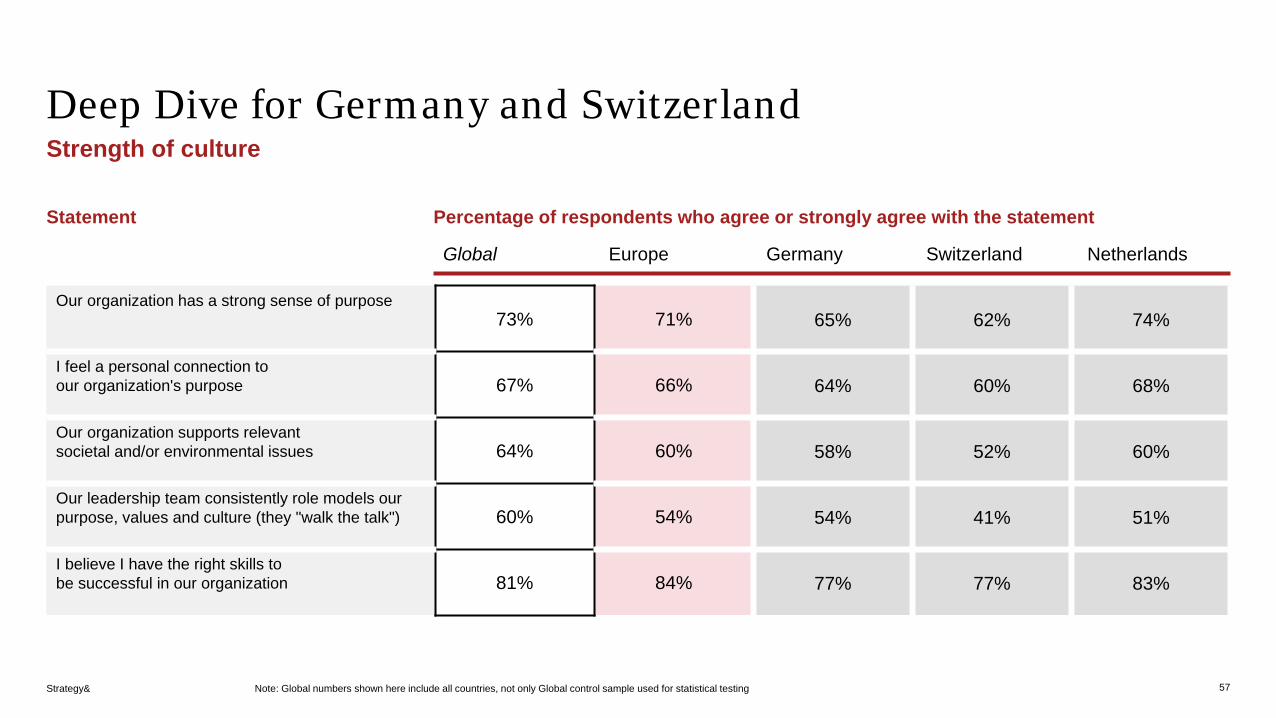
Our organization has a strong sense of purpose73% 71% 65% 62% 74%
I feel a personal connection to our organization's purpose 67% 66% 64% 60% 68%
Our organization supports relevant societal and/or environmental issues 64% 60% 58% 52% 60%
Our leadership team consistently role models our purpose, values and culture (they "walk the talk") 60% 54% 54% 41% 51%
I believe I have the right skills to be successful in our organization 81% 84% 77% 77% 83%
Statement Percentage of respondents who agree or strongly agree with the statement
Global Europe Germany Switzerland Netherlands
Note: Global numbers shown here include all countries, not only Global control sample used for statistical testing

Strategy&
Deep Dive for Germany and SwitzerlandStrength of culture
58
I am motivated to learn new skills to support our organization's success 76% 75% 71% 75% 81%
Our team members motivate and inspire me to do my best work 67% 63% 61% 54% 66%
Our team members are good at adapting how we work in order to better accomplish our goals 70% 66% 66% 59% 64%
I feel I can be my whole ('authentic') self in our organization 63% 64% 60% 58% 60%
Statement Percentage of respondents who agree or strongly agree with the statement
Global Europe Germany Switzerland Netherlands
Note: Global numbers shown here include all countries, not only Global control sample used for statistical testing
Strategy&
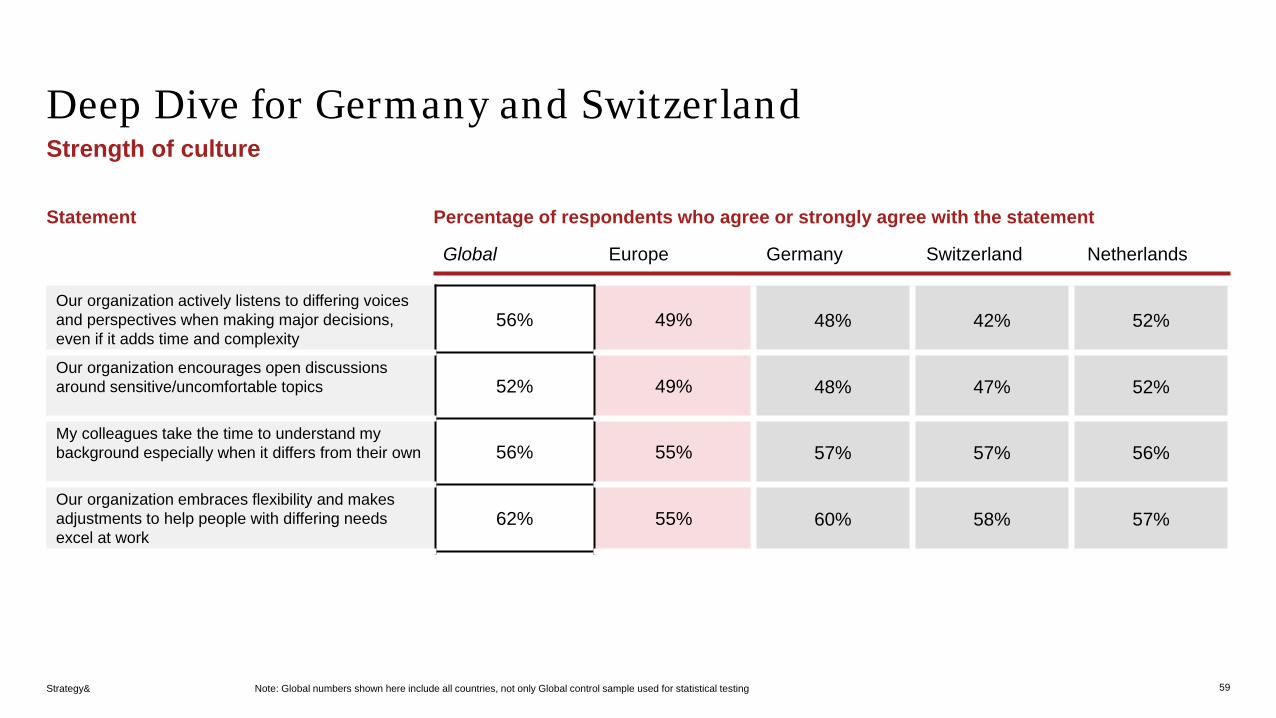
Deep Dive for Germany and SwitzerlandStrength of culture
59
Our organization actively listens to differing voices and perspectives when making major decisions, even if it adds time and complexity
56% 49% 48% 42% 52%
Our organization encourages open discussions around sensitive/uncomfortable topics 52% 49% 48% 47% 52%
My colleagues take the time to understand my background especially when it differs from their own 56% 55% 57% 57% 56%
Our organization embraces flexibility and makes adjustments to help people with differing needs excel at work
62% 55% 60% 58% 57%
Statement Percentage of respondents who agree or strongly agree with the statement
Global Europe Germany Switzerland Netherlands
Note: Global numbers shown here include all countries, not only Global control sample used for statistical testing
Strategy&
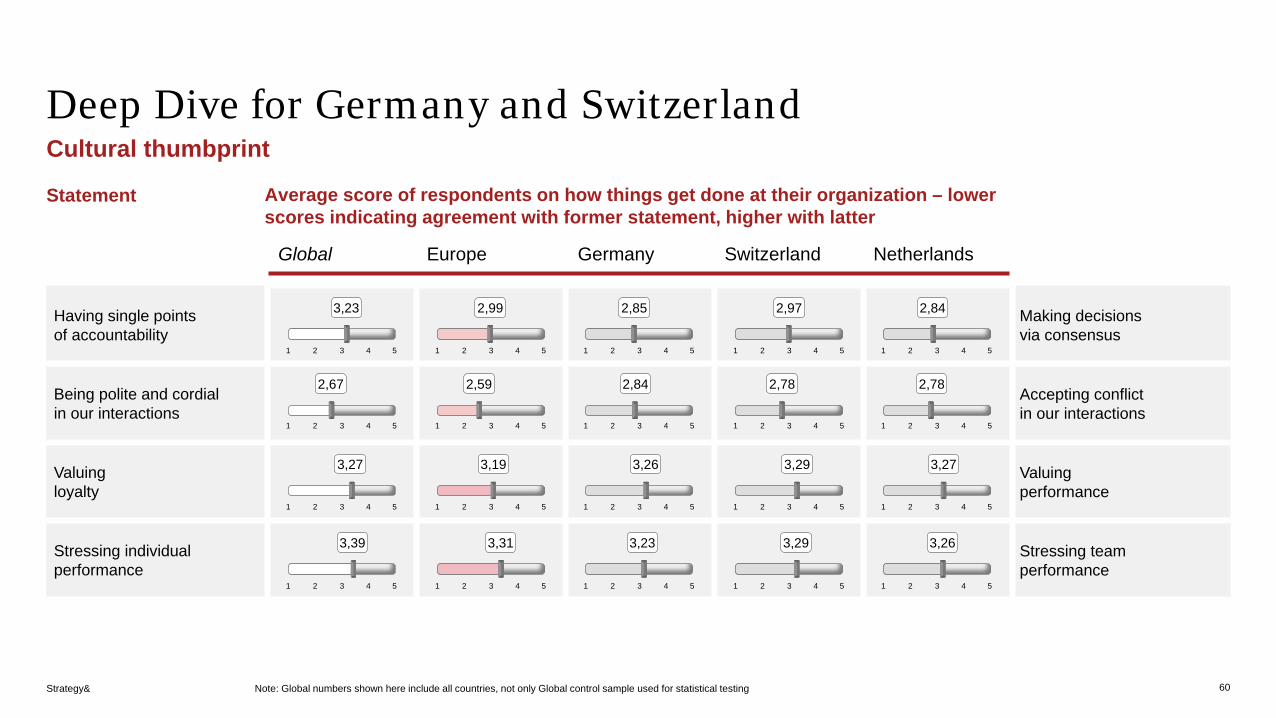
Deep Dive for Germany and SwitzerlandCultural thumbprint
60
Having single points of accountability
Making decisions via consensus
Being polite and cordial in our interactions
Accepting conflict in our interactions
Valuing loyalty
Valuing performance
Stressing individual performance
Stressing team performance
Statement Average score of respondents on how things get done at their organization – lower scores indicating agreement with former statement, higher with latter
Global Europe Germany Switzerland Netherlands
Note: Global numbers shown here include all countries, not only Global control sample used for statistical testing
1 3 42 5 1 3 42 5 1 3 42 5 1 3 42 5 1 3 42 5
1 3 42 5 1 3 42 5 1 3 42 5 1 3 42 5 1 3 42 5
1 3 42 5 1 3 42 5 1 3 42 5 1 3 42 5 1 3 42 5
1 3 42 5 1 3 42 5 1 3 42 5 1 3 42 5 1 3 42 5
3,23
2,67
3,27
3,39
2,99
2,59
3,19
3,31
2,85
2,84
3,23
3,26
2,97
2,78
3,29
3,29
2,84
2,78
3,27
3,26

Strategy&
Deep Dive for Germany and SwitzerlandCultural thumbprint
61
Focusing on external strategy/customers
Focusing on internal operations
Fixing problems as they arise
Preventing problems before they arise
Pursuing incremental change
Pursuing revolutionary change
Valuing titles and levels
Being flat and non-hierarchical
Statement Average score of respondents on how things get done at their organization – lower scores indicating agreement with former statement, higher with latter
2,94
3,00
2,82
2,82
2,85
2,92
2,69
2,81
3,14 2,84
2,97
3,12
2,97
3,14
2,82
2,99
2,66
Global Europe Germany Switzerland Netherlands
Note: Global numbers shown here include all countries, not only Global control sample used for statistical testing
1 3 42 5 1 3 42 5 1 3 42 5 1 3 42 5 1 3 42 5
1 3 42 5 1 3 42 5 1 3 42 5 1 3 42 5 1 3 42 5
1 3 42 5 1 3 42 5 1 3 42 5 1 3 42 5 1 3 42 5
1 3 42 5 1 3 42 5 1 3 42 5 1 3 42 5 1 3 42 5
2,94
2,55
2,79

Strategy&
Deep Dive for Germany and SwitzerlandCultural thumbprint
62
Completing tasks via informal relationships
Completing tasks via formal chains of command
Focusing mostly on financial metrics
Focusing on broader performance measures
Being comfortable with risk Being risk-averse
Following set processes/ procedures
Encouraging improvisation
Statement Average score of respondents on how things get done at their organization – lower scores indicating agreement with former statement, higher with latter
Global Europe Germany Switzerland Netherlands
Note: Global numbers shown here include all countries, not only Global control sample used for statistical testing
1 3 42 5 1 3 42 5 1 3 42 5 1 3 42 5 1 3 42 5
1 3 42 5 1 3 42 5 1 3 42 5 1 3 42 5 1 3 42 5
1 3 42 5 1 3 42 5 1 3 42 5 1 3 42 5 1 3 42 5
1 3 42 5 1 3 42 5 1 3 42 5 1 3 42 5 1 3 42 5
3,27
3,23
3,26
2,87
3,15
3,11
3,20
2,67
3,53
3,08
3,33
2,94
2,70
3,23
3,00
3,41
3,14
2,87
3,23
2,76

Your PwC and Strategy& contacts
63
Andreas Pratz
Partner and Head of Strategy& Switzerland
+49 171 3698 [email protected]
Mahadeva Matt Mani
Partner and Global Leader Transformation Platform,Strategy& Netherlands
+31 622 79 [email protected]
Myriam Denk
Partner People and Organization,PwC Switzerland
+41 58 792 [email protected]
Dr. Peter Gassmann
Global Strategy& Leader and Global ESG Leader of PwC
+49 170 3890 [email protected]
Partner People and Organization, PwC Switzerland
+41 58 792 96 [email protected]
Jose Marques Dr. Diana Dimitrova
Director,Strategy& Germany
+49 170 2238 [email protected]

strategyand.pwc.com
© 2021 PwC. All rights reserved.PwC refers to the PwC network and/or one or more of its member firms, each of which is a separate legal entity. Please see pwc.com/structure for further details.Disclaimer: This content is general information purposes only, and should not be used as a substitute for consultation with professional advisors.
Thank you
Related Documents