Office of Research and Development, Washington, DC 20460 National Center for Environmental Assessment EPA/600/R-07/094F | April 2009 | www.epa.gov Assessment of the Impacts of Global Change on Regional U.S. Air Quality: A synthesis of climate change impacts on ground-level ozone AN INTERIM REPORT OF THE U.S. EPA GLOBAL CHANGE RESEARCH PROGRAM

Welcome message from author
This document is posted to help you gain knowledge. Please leave a comment to let me know what you think about it! Share it to your friends and learn new things together.
Transcript

Office of Research and Development, Washington, DC 20460National Center for Environmental Assessment
EPA/600/R-07/094F | April 2009 | www.epa.gov
Assessment of the Impacts of Global Change on Regional U.S. Air Quality:
A synthesis of climate change impactson ground-level ozone
AN INTERIM REPORT OF THE U.S. EPA GLOBALCHANGE RESEARCH PROGRAM

EPA/600/R-07/094F April 2009
Assessment of the Impacts of Global Change on Regional U.S. Air Quality: A Synthesis of Climate Change Impacts
on Ground-Level Ozone
An Interim Report of the U.S. EPA Global Change Research Program
National Center for Environmental Assessment Office of Research and Development
U.S. Environmental Protection Agency Washington, DC 20460

DISCLAIMER This document has been reviewed in accordance with U.S. Environmental Protection
Agency policy and approved for publication. Mention of trade names or commercial products
does not constitute endorsement or recommendation for use.
Preferred citation: U.S. Environmental Protection Agency (EPA). (2009) Assessment of the impacts of global change on regional U.S. air quality: a synthesis of climate change impacts on ground-level ozone. An Interim Report of the U.S. EPA Global Change Research Program. National Center for Environmental Assessment, Washington, DC; EPA/600/R-07/094F. Available from the National Technical Information Service, Springfield, VA, and online at http://www.epa.gov/ncea.
ii

TABLE OF CONTENTS LIST OF TABLES ......................................................................................................................... vi LIST OF FIGURES ...................................................................................................................... vii LIST OF ABBREVIATIONS ........................................................................................................ ix FOREWORD ................................................................................................................................. xi AUTHORS, CONTRIBUTORS, AND REVIEWERS ............................................................... xiii ACKNOWLEDGEMENTS ......................................................................................................... xvi EXECUTIVE SUMMARY ........................................................................................................ xvii SUMMARY OF POLICY RELEVANT FINDINGS ................................................................. xxii 1 INTRODUCTION TO THE PROBLEM .............................................................................. 1-1
1.1 INTRODUCTION ....................................................................................................... 1-1 1.2 MAJOR THEMES OF THE INTERIM ASSESSMENT REPORT ........................... 1-2 1.3 BACKGROUND ......................................................................................................... 1-4
1.3.1 Air Pollution...................................................................................................... 1-4 1.3.2 Climate Change and Air Quality Linkages ....................................................... 1-4
1.3.2.1 Air Quality Impacts on Climate Change .......................................... 1-6 1.3.2.2 Climate Change Impacts on Air Quality .......................................... 1-6
1.4 DESIGN OF THE GLOBAL CHANGE AND AIR QUALITY ASSESSMENT ...... 1-8 1.4.1 Scope of the Assessment Effort ........................................................................ 1-9 1.4.2 What is Covered in this Report ....................................................................... 1-10
1.5 THE CLIENT COMMUNITIES ............................................................................... 1-11 1.5.1 EPA Office of Air and Radiation (OAR), State, Tribal, and Local Air
Quality Planners .............................................................................................. 1-11 1.5.2 U.S. Climate Change Science Program (CCSP) ............................................. 1-12 1.5.3 Climate Change Research Community ........................................................... 1-14 1.5.4 Air Quality Research Community .................................................................. 1-14
1.6 CONSIDERING UNCERTAINTY IN THE ASSESSMENT EFFORT .................. 1-15 1.7 STRUCTURE OF THIS REPORT ........................................................................... 1-16
2 OVERVIEW OF APPROACH .............................................................................................. 2-1
2.1 INTRODUCTION ....................................................................................................... 2-1 2.1.1 Process for Developing the Global Change-Air Quality Assessment
Effort ................................................................................................................. 2-2 2.2 WORKSHOP RECOMMENDATIONS ..................................................................... 2-2
2.2.1 Modeling ........................................................................................................... 2-2 2.2.2 Time Horizon Selected ..................................................................................... 2-5 2.2.3 Dual-Phase Assessment Approach ................................................................... 2-6 2.2.4 Research Priorities to Support Phase II ............................................................ 2-7
2.3 RESEARCH PARTNERSHIPS .................................................................................. 2-7
iii

TABLE OF CONTENTS (continued) 3 RESULTS AND SYNTHESIS .............................................................................................. 3-1
3.1 INTRODUCTION ....................................................................................................... 3-1 3.2 SUMMARY OF RESULTS FROM INDIVIDUAL GROUPS .................................. 3-1
3.2.1 GCTM-Focused Modeling Work ...................................................................... 3-2 3.2.1.1 Application of a Unified Aerosol-Chemistry-Climate GCM
to Understand the Effects of Changing Climate and Global Anthropogenic Emissions on U.S. Air Quality: Harvard University ......................................................................................... 3-2
3.2.1.2 Impacts of Climate Change and Global Emissions on U.S. Air Quality: Development of an Integrated Modeling Framework and Sensitivity Assessment: Carnegie Mellon University ......................................................................................... 3-4
3.2.2 Linked Global-Regional-Focused Modeling Work .......................................... 3-6 3.2.2.1 The Climate Impacts on Regional Air Quality (CIRAQ)
Project: EPA .................................................................................... 3-6 3.2.2.2 Modeling Heat and Air Quality Impacts of Changing Urban
Land Uses and Climate: Columbia University ................................ 3-7 3.2.2.3 Impacts of Global Climate and Emission Changes on U.S.
Air Quality: University of Illinois ................................................... 3-8 3.2.2.4 Impact of Climate Change on U.S. Air Quality Using
Multi-Scale Modeling with the MM5/SMOKE/CMAQ System: Washington State University .......................................................... 3-10
3.2.2.5 Guiding Future Air Quality Management in California: Sensitivity to Changing Climate—University of California, Berkeley .......................................................................................... 3-11
3.2.2.6 Sensitivity and Uncertainty Assessment of Global Climate Change Impacts on Ozone and Particulate Matter: Examination of Direct and Indirect, Emission-Induced Effects: GIT-NESCAUM-MIT ..................................................... 3-12
3.3 SYNTHESIS OF RESULTS ACROSS GROUPS .................................................... 3-13 3.3.1 Regional Modeling Results ............................................................................. 3-15
3.3.1.1 Modeling System Configurations, Simulations, and Evaluation ... 3-15 3.3.1.2 Changes in O3 ................................................................................. 3-19 3.3.1.3 Changes in Drivers ......................................................................... 3-24
3.3.2 Global Modeling Results ................................................................................ 3-32 3.4 CHALLENGES AND LIMITATIONS OF THE MODEL-BASED
APPROACH .............................................................................................................. 3-37 3.4.1 Inter-Model Variability and Model Evaluation .............................................. 3-38 3.4.2 The Role of Downscaling ............................................................................... 3-42 3.4.3 Uncertainties in Chemical Mechanisms .......................................................... 3-45
3.5 SYNTHESIS CONCLUSIONS AND FUTURE RESEARCH NEEDS .................. 3-47
iv

TABLE OF CONTENTS (continued) 4 FUTURE DIRECTIONS ....................................................................................................... 4-1
4.1 PHASE II OF THE GLOBAL CHANGE AND AIR QUALITY ASSESSMENT ........................................................................................................... 4-1
4.2 EXTENDING THE MODELING SYSTEMS ............................................................ 4-1 4.2.1 Exploring Modeling Uncertainties .................................................................... 4-1 4.2.2 Additional Model Development ....................................................................... 4-2 4.2.3 Additional Pollutants—PM ............................................................................... 4-3 4.2.4 Additional Pollutants—Mercury ....................................................................... 4-4
4.3 COMBINED IMPACTS OF CLIMATE AND EMISSIONS CHANGES: PRELIMINARY WORK ............................................................................................ 4-4
4.4 MODELING THE DRIVERS OF AIR POLLUTANT EMISSIONS ........................ 4-5 4.4.1 Economic Growth and Technology Choices .................................................... 4-7 4.4.2 Land Use and Transportation ............................................................................ 4-8 4.4.3 Emissions Changes Due to Changing Ecosystems: Biogenic VOCs............... 4-8 4.4.4 Emissions Changes Due to Changing Ecosystems: Wildfires ......................... 4-9 4.4.5 Taking Integrated Emissions Scenarios Through to Future U.S.
Regional Air Quality ......................................................................................... 4-9 REFERENCES ........................................................................................................................... R-1 APPENDIX A: CURRENT U.S. REGIONAL AIR QUALITY, ITS SENSITIVITY
TO METEOROLOGY AND EARLY STUDIES OF THE EFFECT OF CLIMATE CHANGE ON AIR QUALITY ............................................... A-1
APPENDIX B: CHARACTERIZING AND COMMUNICATING UNCERTAINTY:
THE NOVEMBER 2006 WORKSHOP ...........................................................B-1 APPENDIX C: THE 2001 EPA GLOBAL CHANGE RESEARCH PROGRAM’S AIR
QUALITY EXPERT WORKSHOP .................................................................C-1 APPENDIX D: U.S. EPA STAR GRANT RESEARCH CONTRIBUTING TO THE
GCAQ ASSESSMENT .................................................................................... D-1 APPENDIX E: MODELING APPROACH FOR INTRAMURAL PROJECT ON
CLIMATE IMPACTS ON REGIONAL AIR QUALITY................................ E-1 APPENDIX F: USING MARKAL TO GENERATE EMISSIONS GROWTH
PROJECTIONS FOR THE EPA GLOBAL CHANGE RESEARCH PROGRAM’S AIR QUALITY ASSESSMENT .............................................. F-1
GLOSSARY OF CLIMATE AND AIR QUALITY TERMS .................................................... G-1
v

LIST OF TABLES 3-1 The regional modeling systems whose results are discussed in
Sections 3.3.1 and 3.3.2 ..................................................................................... 3-16
3-2 GCTM-only model simulations whose results are discussed in Section 3.3.2....................................................................................................... 3-32
vi

LIST OF FIGURES 1-1 Schematic representation of the multiple interactions between tropospheric
chemical processes, biogeochemical cycles, and the climate system .................. 1-5
2-1 Links between global and regional climate and atmospheric chemistry processes with anthropogenic activities governing air pollution emissions ........ 2-1
3-1 2050s-minus-present differences in simulated summer mean MDA8 O3 concentrations (in ppb) for the (a) NERL; (b) Illinois 1; (c) Illinois 2; (d) WSU; and (e) GNM experiments (see Table 3-1) ............................................. 3-20
3-2 95th percentile MDA8 O3 concentration differences for the NERL experiment.......................................................................................................... 3-21
3-3 2050s-minus-present differences in simulated summer mean MDA8 O3 concentrations (in ppb); reproduced from Figure 2 in Hogrefe et al. (2004b) ............................................................................................................... 3-22
3-4 Frequency of simulated summer mean MDA8 O3 values exceeding 80 ppb in different regions from the NERL experiment; reproduced from Figure 11 in Nolte et al. (2008) ................................................................. 3-23
3-5 2050s-minus-present September-October compared to June-August differences in simulated mean MDA8 O3 concentrations (in ppb); reproduced from Figure 6 in Nolte et al. (2008) ................................................ 3-24
3-6 2050s-minus-present differences in simulated summer mean near-surface air T (ºC) for the (a) NERL; (b) Illinois 1; (c) Illinois 2; (d) WSU; and (e) GNM experiments .............................................................................................. 3-27
3-7 2050s-minus-present differences in simulated summer mean surface insolation (W m-2) for the (a) NERL; (b) Illinois 1; (c) Illinois 2; (d) WSU; and (e) GNM experiments ................................................................................. 3-28
3-8 2050s-minus-present differences in simulated summer mean biogenic VOC emissions (g Carbon m-2 day-1) for the (a) NERL; (b) Illinois 1; (c) Illinois 2; (d) WSU; and (e) GNM experiments ........................................... 3-30
3-9 2050s-minus-present differences in simulated summer (JJA) mean (a) MDA8 O3 concentration (ppb); (b) near-surface air temperature (ºC); (c) surface insolation (W m-2); and (d) biogenic isoprene emissions (g Carbon m-2 day-1) for the Harvard global modeling experiment (see Table 3-2) ................................................................................................... 3-34
3-10 Same as Figure 3-9 but for the CMU global modeling experiment ................... 3-35
vii

TABLE OF CONTENTS (continued) 3-11 The mean (top two panels) and standard deviation (bottom two panels)
in future-minus-present MDA8 O3 concentration differences across (left-hand panels) all seven experiments (five regional and two global) shown in Figures 3-1, 3-9, and 3-10 and, for comparison purposes, (right-hand panels) not including the WSU experiment because it shows differences for July only, while the other experiments show JJA differences ................................................................................................... 3-49
3-12 Averages across the subregions shown in Figure 3-13 for each of the simulations for (a) mean MDA8 O3 (ppb); (b) near-surface air temperature (ºC) ................................................................................................. 3-50
3-12 continued. Averages across the subregions shown in Figure 3-13 for each of the simulations for (c) surface insolation (W m-2); and (d) biogenic isoprene emissions (g Carbon m-2 sec-1) ............................................................ 3-51
3-13 The averaging subregions used in Figure 3-12 .................................................. 3-52
4-1 Integrated system of future climate, meteorology, and emissions scenarios ....... 4-6
viii

LIST OF ABBREVIATIONS AGCM Atmospheric General Circulation Model AOGCM Atmosphere-Ocean General Circulation Model AQ air quality BC boundary conditions BEIS Biogenic Emissions Inventory System CAA Clean Air Act CAM Community Atmosphere Model CACM Caltech Atmospheric Chemistry Mechanism CICE The Los Alamos Sea Ice Model CCM3 Community Climate Model version 3 CCSM Community Climate System Model CSIM Community Sea Ice Model CLM Community Land Model CMAQ Community Multiscale Air Quality Model CMIP Coupled Model Intercomparison Project CTM Chemical Transport Model EC elemental carbon ENSO El Niño-Southern Oscillation GCM General Circulation Model GCTM Global Chemical Transport Model GISS Goddard Institute for Space Studies GMAO Global Modeling and Assimilation Office HadCM3 Hadley Centre Coupled Model IC initial condition IGSM Integrated Global System Model LANL Los Alamos National Laboratory LWC liquid water content MDA8 Maximum Daily 8-hour Average Ozone Concentration MM Mesoscale Model MM5 Mesoscale Model (Version 5) MARKAL MARKet Allocation Model MOSIS Meteorology Office Surface Exchange Scheme MPMPO Model to Predict the Multiphase Partitioning of Organics NAAQS National Ambient Air Quality Standard NCAR National Center for Atmospheric Research NH4
+ ammonium ion NO3
- nitrate ion OC organic carbon O3 ozone OGCM Oceanic General Circulation Model PAN peroxyacetylnitrate PBL planetary boundary layer PCM Parallel Climate Model
ix

LIST OF ABBREVIATIONS (continued) PCTM PCM/CCSM Transition Model POP Parallel Ocean Program RACT reasonably available control technology RCM Regional Climate Model RCMS Regional Climate Modeling System RCTM Regional Chemical Transport Model RH relative humidity RRF relative reduction factor PM2.5 particulate matter with aerodynamic diameter below 2.5 μm SIP State Implementation Plan SAPRC statewide air pollution research center SMOKE Sparse Matrix Operator Kernel Emissions SOA secondary organic aerosols SO2 sulfur dioxide SO4
= sulfate ion SRES special report on emissions scenarios SST sea surface temperature THC thermohaline circulation TKE turbulent kinetic energy UKMO United Kingdom Meteorology Office VOC volatile organic compound
x
FOREWORD
The Global Change Research Program (GCRP) in EPA’s Office of Research and Development (ORD) is an assessment-oriented program with primary focus on evaluating the potential consequences of global change—particularly climate change and climate variability— for air and water quality, aquatic ecosystems, and human health in the United States. The program investigates adaptation options to improve society’s ability to effectively respond to the risks presented by global change. The program also has begun to evaluate alternative strategies for reducing greenhouse gas emissions and the environmental implications of those strategies.
This initial report, entitled Assessment of the Impacts of Global Change on Regional U.S. Air Quality: A Synthesis of Climate Change Impacts on Ground-Level Ozone, was prepared by the GCRP to provide air quality managers and scientists with timely and useful information about the potential effects of climate change on air quality in the United States. It represents an integrated, multidisciplinary research and assessment effort that includes contributions from multiple Laboratories and Centers in ORD, and it was done in partnership with EPA’s Office of Air and Radiation (OAR), which is interested in developing a foundation for considering the effects of climate change in the Agency’s air quality management programs. Additional contributors included partners in other federal agencies. I would like to thank the many people in ORD, OAR, the Regional Offices, the academic community, and our external review panel for their many contributions.
The GCRP began an initial assessment of the implications of climate change on air quality in 2000, because available scientific evidence suggested that climate and air quality are closely coupled through atmospheric chemical, radiative, and dynamic processes. It was known that meteorology plays an essential role in whether or not a metropolitan area meets the National Ambient Air Quality Standards (NAAQS) set by EPA for pollutants considered harmful to public health and the environment. It was also known that a warming climate will lead to significant changes in regional meteorological patterns. However, it was not known how a changing climate will affect air quality for a given region, and how climate change will affect a region’s ability to meet the NAAQS.
The GCRP’s long-term climate change/air quality assessment goals therefore are the following:
1. Provide an answer to the basic question, “Is global change something we will have to account for when moving forward with U.S. air quality policy?”
2. Develop research tools and a knowledge base to answer science questions about the potential impacts of global change on regional U.S. air quality.
xi

3. Deliver to the air quality policy and management community an improved understanding of the behavior and complexities of the global change/air quality system as well as the strengths and limitations of the available scientific tools and methods.
4. Provide a foundation for applying these scientific insights and tools to help answer specific policy and management questions. It is important to ascertain whether climate change should be considered in the
formulation of future air quality policy. To do so, we must gain an understanding of the importance of climate change relative to other stressors on air quality (e.g., changes in land-use) and the relative difficulty of coping with all stressors. However, this assessment design called for first providing insights about how air quality may respond to future changes in climate before tackling the additional complexities of incorporating potential future changes in anthropogenic emissions and long-range pollutant transport. This report is therefore an initial assessment that evaluates the effects of climate change alone on air quality across the United States.
The assessment focuses primarily on the impact of climate change out to 2050 on ground-level ozone, which is mainly a summertime pollutant in the United States. Possible changes in “biogenic” emissions (i.e., emissions from natural sources), such as emissions of volatile organic carbon (VOC) from vegetation, were considered. Future assessment reports will focus on other regulated pollutants, including particulate matter (PM) and mercury, as well as on the combined effects of both climate and human-caused emissions changes, to provide a more complete understanding of the range of possible impacts of global change on air quality.
Caution must be exercised in interpreting the results presented here. First, this report does not address the question of whether regulatory standards for particular pollutants (e.g., ozone) should change because of climate change. Rather, the report sheds light on the question of whether climate change will make attainment of any standard—wherever it is set—more difficult. It presents scientific findings that, in combination with other information, will inform policymaking. Second, our understanding of the linkages between climate and air quality is still at an early stage. There remains considerable uncertainty in climate modeling, and our knowledge of certain aspects of atmospheric chemistry are still lacking. With these caveats, this report includes results useful to national and regional air quality planners.
This report represents a significant advancement in our understanding of the possible impacts of climate change on regional air quality in the United States. It is our hope that the information contained in this report will enhance our ability as a nation to protect air quality and human health, even as our climate changes.
Lek Kadeli Acting Assistant Administrator Office of Research and Development
xii

AUTHORS, CONTRIBUTORS, AND REVIEWERS Principal Authors Ms. Anne Grambsch–National Center for Environmental Assessment, Office of Research and Development, U.S. Environmental Protection Agency, Washington, DC 20460 Dr. Brooke L. Hemming–National Center for Environmental Assessment, Office of Research and Development, U.S. Environmental Protection Agency, Research Triangle Park, NC 27711 Dr. Christopher P. Weaver–National Center for Environmental Assessment, Office of Research and Development, U.S. Environmental Protection Agency, Washington, DC 20460 Contributing Authors Dr. Alice Gilliland–Air Resources Laboratory, National Oceanic and Atmospheric Administration in partnership with the National Exposure Research Laboratory, U.S. Environmental Protection Agency, Research Triangle Park, NC 27711 Mr. Doug Grano–Office of Air Quality Planning and Standards, Office of Air and Radiation, U.S. Environmental Protection Agency, Research Triangle Park, NC 27711 Dr. Sherri Hunt–National Center for Environmental Research, Office or Research and Development, U.S. Environmental Protection Agency, Washington, DC 20460 Dr. Tim Johnson–National Risk Management Research Laboratory, Office of Research and Development, U.S. Environmental Protection Agency, Research Triangle Park, NC 27711 Dr. Dan Loughlin–National Risk Management Research Laboratory, Office or Research and Development, U.S. Environmental Protection Agency, Research Triangle Park, NC 27711 Dr. Darrell Winner–National Center for Environmental Research, Office or Research and Development, U.S. Environmental Protection Agency, Washington, DC 20460 Contributors Dr. William G. Benjey–Air Resources Laboratory, National Oceanic and Atmospheric Administration in partnership with the National Exposure Research Laboratory, U.S. Environmental Protection Agency, Research Triangle Park, NC 27711 Dr. Ellen J. Cooter–Air Resources Laboratory, National Oceanic and Atmospheric Administration in partnership with the National Exposure Research Laboratory, U.S. Environmental Protection Agency, Research Triangle Park, NC 27711
xiii

AUTHORS, CONTRIBUTORS, AND REVIEWERS (continued) Dr. Cynthia Gage–National Risk Management Research Laboratory, Office or Research and Development, U.S. Environmental Protection Agency, Research Triangle Park, NC 27711 Dr. Chris Nolte–Air Resources Laboratory, National Oceanic and Atmospheric Administration in partnership with the National Exposure Research Laboratory, U.S. Environmental Protection Agency, Research Triangle Park, NC 27711 Internal Reviewers Mr. Bret Anderson–Region 7, U.S. Environmental Protection Agency, Kansas City, KS 66101 Ms. Louise Camalier–Office of Air Quality Planning and Standards, Office of Air and Radiation, U.S. Environmental Protection Agency, Research Triangle Park, NC 27711 Mr. Bill Cox–Office of Air Quality Planning and Standards, Office of Air and Radiation, U.S. Environmental Protection Agency, Research Triangle Park, NC 27711 Mr. Ben DeAngelo–Office of Atmospheric Programs, Office of Air and Radiation, U.S. Environmental Protection Agency, Washington, DC 20460 Mr. Brian Eder–Air Resources Laboratory, National Oceanic and Atmospheric Administration in partnership with the National Exposure Research Laboratory, U.S. Environmental Protection Agency, Research Triangle Park, NC 27711 Mr. Tyler Fox–Office of Air Quality Planning and Standards, Office of Air and Radiation, U.S. Environmental Protection Agency, Research Triangle Park, NC 27711 Dr. Bryan Hubbell–Office of Air Quality Planning and Standards, Office of Air and Radiation, U.S. Environmental Protection Agency, Research Triangle Park, NC 27711 Dr. Carey Jang–Office of Air Quality Planning and Standards, Office of Air and Radiation, U.S. Environmental Protection Agency, Research Triangle Park, NC 27711 Dr. Terry Keating–Office of Policy Analysis and Review, Office of Air and Radiation, U.S. Environmental Protection Agency, Washington, DC 20460 Mr. Jim Ketcham-Colwill–Office of Policy Analysis and Review, Office of Air and Radiation, U.S. Environmental Protection Agency, Washington, DC 20460 Dr. Meredith Kurpius–Air Division, Region 9, U.S. Environmental Protection Agency, San Francisco, CA 94105 Ms. Anne McWilliams–Region 1, U.S. Environmental Protection Agency, Boston, MA 02114-2023
xiv

AUTHORS, CONTRIBUTORS, AND REVIEWERS (continued) Dr. Andy Miller–National Risk Management Research Laboratory, Office or Research and Development, U.S. Environmental Protection Agency, Research Triangle Park, NC 27711 Ms. Madonna Narvaez–Region 10, U.S. Environmental Protection Agency, Seattle, WA 98101 Ms. Kathryn Parker–Office of Atmospheric Programs, Office of Air and Radiation, U.S. Environmental Protection Agency, Washington, DC 20460 Ms. Sharon Philips–Office of Air Quality Planning and Standards, Office of Air and Radiation, U.S. Environmental Protection Agency, Research Triangle Park, NC 27711 Mr. Frank Princiotta–National Risk Management Research Laboratory, Office or Research and Development, U.S. Environmental Protection Agency, Research Triangle Park, NC 27711 Dr. ST Rao–Air Resources Laboratory, National Oceanic and Atmospheric Administration in partnership with the National Exposure Research Laboratory, U.S. Environmental Protection Agency, Research Triangle Park, NC 27711 Mr. Randy Robinson–Region 5, U.S. Environmental Protection Agency, Chicago, IL 60604-3507 Mr. Jason Samenow–Office of Atmospheric Programs, Office of Air and Radiation, U.S. Environmental Protection Agency, Washington, DC 20460 Dr. Ravi Srivastava–Office of Air Quality Planning and Standards, Office of Air and Radiation, U.S. Environmental Protection Agency, Research Triangle Park, NC 27711 Ms. Sara Terry–Office of Air Quality Planning and Standards, Office of Air and Radiation, U.S. Environmental Protection Agency, Research Triangle Park, NC 27711
xv

ACKNOWLEDGEMENTS This interim report is part of a larger climate change and air quality assessment that is
being carried out by ORD’s Global Change Research Program. It was made possible because of the many people who helped plan and implement the assessment effort, participated in workshops, conducted research, and contributed ideas that shaped the final product. We are grateful for their support and encouragement. In particular, we wish to acknowledge the following: Doug McKinney, Michele Aston, Robert Gilliam, Bill Rhodes, Joseph DeCarolis, Carol Shay, Jenise Swall, Deb Mangis, Ruby Leung, and the Science To Achieve Results (STAR) grantees. Many thanks as well to Jinhong Zhu and Xin-Zhong Liang who archived model output from the various participating groups and helped produce many of the figures in this report. Furthermore, we wish to thank our external review panel, David Allen, Russ Dickerson, Greg Huey, Alan Robock, Drew Shindell, Yuhang Wang, and Jason West, for their many valuable insights and critical contributions to improving the quality of this report. Finally, we are very grateful to the NCEA Global Change Research Program staff for their perspectives and support.
xvi

EXECUTIVE SUMMARY
It is increasingly recognized that the science and policy communities need to explore the potential impact of long-term (multi-decadal), global climate change on regional air quality—specifically the possibility that such change may complicate air quality managers’ ability to attain their management goals. These concerns are grounded in information derived from observational studies, basic atmospheric chemistry, and modeling of short-term air pollution episodes. For example, these analyses have established the major role that weather patterns play in establishing conditions conducive to ozone (O3) formation and accumulation, such as abundant sunshine, high temperatures, and stagnant air. It is now well understood that year-to-year variability in summer climate is strongly correlated with the number of days that exceed O3 air quality standards.
Historically, air pollution has been studied mostly in terms of immediate local and regional concerns, rather than as a global change issue. In 2001, the EPA Office of Research and Development’s Global Change Research Program initiated an effort to increase understanding of the multiple complex interactions between long-term global climate change and atmospheric chemistry which have the potential to influence air pollution in the United States.
The overall goal of the assessment effort is to enhance the ability of air quality policy makers and managers to consider global climate change in their decisions through this increased understanding.
A phased approach has been used to systematically achieve progress toward this overall goal. Phase I focused on building coupled modeling systems capable of capturing the range of processes from global climate to regional air quality and applying these systems to study the sensitivity of U.S. air quality to climate change, with a particular emphasis on O3. Phase I considers the impact of climate change on air quality in isolation, without including the interacting effects of changes in the emissions of pollutants from human systems. Phase II, in progress, focuses on the combined impacts of changing climate and changing human-caused air pollutant emissions. It builds on Phase I by: extending the modeling systems developed under Phase I to explore additional pollutants and processes; investigating more comprehensively the key modeling uncertainties uncovered in Phase I; and integrating changes in climate with the changes in emissions that might result from changes in air quality regulations, population growth and economic development, changes in energy technologies, and land use change.
This report provides a synthesis of the major results from Phase I of the overall assessment. The findings presented here are interim, as Phase II is currently ongoing, and future reports will update and extend our knowledge of the potential impacts of global change on air quality. xvii

Specifically, this report provides a synthesis of the EPA-funded modeling studies that have been carried out to date under Phase I, primarily for O3. Future interim reports will provide syntheses of additional topics, e.g., particulate matter. These projects have all adapted and combined existing tools from diverse fields, such as global climate models, global chemistry and transport models, regional meteorological models, and regional air quality models, into systems capable of carrying out numerical experiments to explore the sensitivity of U.S. air quality to changes in global climate. These linked modeling systems have simulated nationwide changes in O3 concentrations, primarily for summertime, as a result of simulated climate change a few decades into the future. The numerical experiments discussed in this report held human-caused emissions of O3 precursor pollutants constant at present-day levels, but allowed climate-sensitive natural emissions, like volatile organic compounds (VOCs) from vegetation, to vary in response to the simulated changes in climate.
Coupling atmospheric chemical processes and the climate system presents considerable challenges because of the large number of physical, chemical, and biological processes involved, many of which are poorly understood, all interacting in complex ways. The types of modeling systems developed under this assessment permit the detailed exploration of the potential responses of air quality to climate change over the next few decades in a way that would be difficult or impossible with other approaches. For example, they permit the exploration of climate changes well outside of the envelope of historical experience. In addition, they permit the systematic investigation of the multiple competing climate- and weather-related drivers of air quality interactions on the regional scale, which produce aggregate patterns of air quality change.
This effort represents the first systematic attempt to use linked global-to-regional climate and air quality modeling systems from multiple research groups to jointly investigate the regional dimensions of potential climate-induced air quality changes across the United States.
The major findings from this suite of experiments are First, while these modeling studies cannot tell us what the future will hold, they
demonstrate the potential for global climate change to make U.S. air quality management more difficult, and therefore future air quality management decisions should begin to account for the impacts of climate change.
Second, the science of modeling climate and atmospheric chemistry for the purposes of understanding the sensitivity of regional air quality to climate change is in its early stages. This effort highlights a number of uncertainties that limit the information that can be provided to support decision-making, as well as what work is needed (some currently underway) to begin addressing these uncertainties.
xviii

The synthesis of scientific information in this report supports the scientific community and air quality managers and policy makers by
• Providing an improved understanding of the richness and range of behaviors of the global
change-regional air quality system;
• Providing an appreciation for the strengths and limitations of the scientific tools and methods used to develop this improved understanding;
• Creating the foundation for a suite of collaborative activities between the scientific research and air quality policy and management communities to investigate specific air quality policy and management questions.
The two major findings rest on a foundation of a number of more detailed conclusions
drawn from the modeling studies. In support of the first major finding
• For every region of the country, at least one (usually multiple) of the modeling groups found that simulated climate change caused increases in summertime O3 concentrations.
• These climate-induced increases, averaged over the summer season, were in the range of approximately 2-8 parts per billion (ppb) for Maximum Daily 8-hour Average O3 concentration, a key metric for regulating U.S. air quality.
• The climate sensitivity of O3 was greatest for the peak pollution episodes that tend to occur over a number of days each summer, resulting in substantially larger increases for these times than for the overall seasonal average.
While the results from the different research groups agreed on the above points, their
modeling systems did not necessarily simulate the same regional patterns of climate-induced O3 changes, with the individual simulations showing regions of little change, or even decreases, in addition to the O3 increases. This speaks to the second major finding of this report, articulated above, of important modeling uncertainties. Certain regions show greater agreement than others: for example, there is very generally more agreement on the spatial patterns of climate-induced increases for the eastern half of the country than for the West, though parts of the Southeast show some of the strongest disagreements across the modeling groups. These differences in the regional patterns of O3 change result, in large part, from differences in how the different modeling systems, composed of different combinations of climate models, chemistry models, greenhouse gas scenarios, and number of years modeled, simulated the competing regional influences of changes in key meteorological drivers of air quality, especially the amount of sunlight reaching the surface and near-surface air temperature.
xix

In general, differences between climate simulations tend to be more pronounced at the regional scales considered in this report than at the global scale. This is because of differences across models and simulations in the representation of large-scale circulation patterns that strongly affect regional meteorology, like the mid-latitude storm tracks and the subtropical high pressure systems. In addition, there are differences between models in how they capture small-scale processes, like clouds and precipitation, which also are important for air quality. In the studies discussed in this report, these modeling uncertainties strongly influenced the O3 simulations, producing much of the difference in regional patterns of change between studies. For example, there were differences across modeling groups in the regions of the country where simulated increases in cloud cover, and hence decreases in the amount of sunlight reaching the surface, partially counteracted the effects of warming temperatures on O3 concentrations in these regions. This highlights current limitations in our ability to understand regional impacts of global climate change.
The results from the modeling studies discussed in this report clearly show that a complex interplay between multiple meteorological factors drives regional O3 changes. Simply considering a single variable, such as temperature, may not provide a sufficient basis for determining future air quality risks due to climate change in every region.
Another important impact is that climate change leads to changes in the natural emissions of VOCs., e.g., isoprene from vegetation. All of the modeling groups found climate-induced increases in these biogenic VOC emissions over most of the United States, with especially pronounced increases in the Southeast. However, there are large disagreements across the different groups as to the degree to which these increases affect O3 concentrations, with some simulations showing large O3 increases while others show little change. An important factor that helps explain these differences is the differing representation of isoprene nitrate chemistry in the different modeling systems, another key uncertainty in the science.
In addition to the issues discussed above, most of the groups examined the importance of year-to-year variability on their results to some degree. These groups found that the climate-induced differences in O3 concentrations are roughly the same size as present-day year-to-year variability. This implies that simulated future O3 change can be strongly affected by the choice of present-day and future years to compare. It also implies that climate change has the potential to push O3 concentrations in extreme years beyond the envelope of current natural year-to-year variability.
Finally, while this report focuses mainly on summertime results, some of the modeling groups also found climate-induced increases in O3 concentrations in some regions for the spring and fall, suggesting a possible future extension of the O3 season that would present additional challenges for air quality managers.
xx
Moving forward, this report has highlighted key areas for improving integrated climate and air quality modeling systems that can deliver improved information to meet evolving climate policy and air quality management decision support needs. These include:
• Using recent advances in global and regional models, parameterizations, and downscaling
techniques to build more advanced coupled climate and air quality modeling systems;
• Developing ensembles of multiple modeling systems over many years of simulation to develop more robust results of air quality sensitivity to climate change;
• Carrying out more extensive evaluations of climate models for their ability to represent processes (and timescales) that strongly influence regional air quality, such as regional-scale stagnation events.
• Carrying out more extensive evaluations of atmospheric chemistry models for their ability to represent certain chemical pathways that lead to O3 climate change sensitivity, such as the chemical fate of isoprene nitrate.
Finally, this report provides a preview of ongoing and upcoming work under Phase II of
the overall assessment: exploring the uncertainties discussed above; extending the modeling systems to investigate the climate sensitivity of additional pollutants (i.e., particulate matter and mercury) in greater detail; exploring feedbacks between chemistry and climate; and assessing the integrated effects of changes in climate and changes in emissions of pollutants by changes in human systems, such as population growth and migration, economic development, new regulations, energy use and technology, and land use.
xxi

SUMMARY OF POLICY RELEVANT FINDINGS The recent Intergovernmental Panel on Climate Change (IPCC) Fourth Assessment Report (AR4) states, “Warming of the climate system is unequivocal, as is now evident from observations of increases in global average air and ocean temperatures, widespread melting of snow and ice, and rising global average sea level” (IPCC, 2007). Directly relevant to EPA’s mission to protect human health and the environment is the IPCC finding that, “Future climate change may cause significant air quality degradation by changing the dispersion rate of pollutants, the chemical environment for ozone and aerosol generation and the strength of emissions from the biosphere, fires and dust. The sign and magnitude of these effects are highly uncertain and will vary regionally.” Climate change impacts have not yet been explicitly considered in air quality program planning—accounting for them will be a critical challenge for the air quality management system in the coming decades. In partnership with EPA’s Office of Air and Radiation (OAR) and several Regional offices, the EPA’s Office of Research and Development (ORD) Global Change Research Program began an assessment effort to increase scientific understanding of the multiple complex interactions between climate and atmospheric chemistry. The ultimate goal of this assessment is to enhance the ability of air quality managers to consider global change in their decisions through improved characterization of the potential impacts of global change on air quality. An integrated framework for the assessment was designed that leveraged the research and development strengths within the EPA, within other agencies, and within the academic research community. This framework calls for first developing insight into the range of possible air quality responses to future climate changes alone (Phase I) before tackling the additional complexities of integrating the effects of potential future changes in anthropogenic emissions and long-range pollutant transport with these climate-only impacts (Phase II). The core approach of the assessment is the development of integrated modeling systems capable of capturing these effects and applying them in simulations to explore the global change-air quality problem. This interim report provides an update on the progress in this first phase of the assessment. Its primary focus is on the potential changes in U.S. regional air quality due to global climate change alone, including direct meteorological impacts on atmospheric chemistry and transport, and the effect of these meteorological changes on climate-sensitive natural emissions of pollutant precursors. The aim in this phase was to consider the effects of climate change in isolation, without accompanying changes in anthropogenic emissions of precursor pollutants expected to occur over the same timeframe. Future reports will explore the potential impacts when also considering possible changes in future air pollution emissions.
xxii

Two “grand challenges” have emerged in the course of developing and conducting this assessment. The first arises from the Global Change Research Program’s emphasis on decision support, namely, to provide the best possible scientific basis for understanding potential climate change impacts on air quality and air quality policies in a useful form and a timely manner as one key set of inputs to help managers develop pollution control strategies. The second “grand challenge” is to convey to the scientific research community the knowledge gaps that limit our understanding of the problem and/or create barriers to the use and interpretation of scientific information by decision makers. The discussion below summarizes information that has emerged from the assessment to date. Most of the discussion centers on topics related to tropospheric ozone (O3) since our understanding of O3 is more complete at this time than that of particulate matter (PM). Preliminary findings related to PM are presented where available. Unless otherwise indicated, to isolate the impacts of climate change, all model results discussed are for simulations that assumed no future changes in the anthropogenic emissions of precursor pollutants. Also, unless otherwise indicated, “future” refers to the time period around 2050. The organization of the rest of this Summary is as follows: In the first sub-section, what has been learned about possible impacts of climate change on O3 (and PM) concentrations is presented. With this information in hand, in the second sub-section, it is then possible to focus on those meteorological drivers important for air quality and highlight complexities in the interaction between these drivers and pollutant concentrations, such as reinforcing or competing effects of individual drivers. The third sub-section discusses climate change impacts on climate-sensitive natural emissions of pollutant precursors. The fourth and fifth sub-sections discuss important modeling uncertainties, and preliminary sensitivity tests comparing the first-order impacts of climate and anthropogenic emissions changes, respectively, as previews of issues that will receive more attention in the next phase of the assessment. I. Summary of Impacts on O3 (and PM) Concentrations
A. Climate change has the potential to produce significant increases in near-surface O3 concentrations throughout the United States. 1. A large number of earlier observation- and model-based studies have demonstrated
connections between meteorological variability and O3 concentrations and exceedances, implying the possibility of climate change leading to increasing O3 levels in some regions.
2. The new modeling studies discussed in this report show increases in summertime O3 concentrations over substantial regions of the country as a result of simulated 2050 climate change. These results were obtained under the assumption of anthropogenic emissions of precursor pollutants held constant at present-day levels while allowing
xxiii

for some changes in climate-sensitive natural emissions. For nearly every region of the country, at least one (usually multiple) of the modeling groups found that climate change caused increases in summertime O3 concentrations.
3. Where these increases occur, the amount of increase in summertime average Maximum Daily 8-hour Average (MDA8) O3 concentrations across all the modeling studies tends to fall in the range 2−8 ppb, as illustrated in the figures shown in Section 3.
4. The largest increases in O3 concentrations in these simulations occur during peak pollution events. (For example, the increases in 95th percentile of MDA8 O3 tend to be significantly greater than those in summertime-mean MDA8 O3.)
5. Though in agreement on the above points, the different modeling systems did not necessarily simulate the same regional patterns of climate-induced O3 changes, with the individual simulations showing some regions of little change, or even decreases, in addition to the O3 increases.
6. As will be discussed in Sections II and III below, these disagreements in the spatial patterns of future O3 changes can largely be attributed to the wide variations across simulations in the patterns of changes of key meteorological drivers (e.g., temperature and cloud cover), along with the differing representations of key chemical mechanisms in the various model systems.
7. There is greater agreement across simulations in these O3 changes for certain regions than for others. For example, there is generally more agreement on the spatial patterns of climate-induced increases for the eastern half of the country than for the West, though parts of the Southeast show some of the strongest disagreements across the modeling groups.
8. A subset of results also suggests that climate change effects on O3 grow continuously over time, with evidence for significant impacts (in the same direction as described above) emerging as early as the 2020s. For example, the Columbia research group (which simulated only the eastern half of the United States) found significant summertime O3 increases across broad swathes of the Midwest and Mid-Atlantic by the 2020s, with greater increases by the 2050s and 2080s.
Relevance for air quality policy: These studies suggest that EPA’s Office of Air Quality Planning and Standards should begin to consider climate change, for example, in the next update of EPA's ozone modeling guidance, especially for planning horizons in 2020 and beyond. In other words, they may need to account for a “climate penalty” that could influence the amount of controls needed in some locations. Conflicting results among simulations for certain regions of the country suggest that evaluations of the potential effectiveness of future controls in those regions will be particularly sensitive to uncertainties in the modeling systems. The findings also indicate that, where climate-change-induced increases in O3 do occur, damaging effects on ecosystems, agriculture, and health may be pronounced, due to increases in the frequency of extreme pollution events.
xxiv

B. Climate change has the potential to push O3 concentrations in extreme years beyond the envelope of current natural year-to-year variability. In addition, it has the potential to lengthen the O3 season. 1. Interannual variability in weather conditions plays an important role in determining
average O3 levels and exceedances in a given year. For example, statistical analyses of current O3 observations show that, for several U.S. cities that have not attained the current O3 NAAQS, weather-related interannual variability can increase or decrease observed mean O3 concentrations by as much as 10 ppb from the 25-year (1981−2006) mean.
2. The subset of modeling groups that examined multiple simulation years for both present-day and future climate found that, in many regions, increases in summer O3 concentrations due to climate change were comparable in magnitude to, or even greater than, simulated present-day interannual variability.
3. Similarly, a subset of the future climate simulations showed that, for parts of the country with a defined summertime O3 season, climate change expanded its duration into the fall and spring.
Relevance for air quality policy: Multi-year simulations may be necessary to support the development of long-term air quality control strategies, to capture the effects of both natural meteorological variability and climate-induced changes. Air quality managers may also need to plan to extend the season over which they monitor O3 concentrations and be prepared to issue air quality alerts earlier in the spring and later into the fall.
C. Climate change is expected to cause a decrease in O3 concentrations in remote areas with low ambient NOx levels. 1. The global modeling studies described in this report simulate general decreases in O3
concentrations over remote areas with low NOx concentrations (e.g., oceans) as a result of climate change. Consistent with current understanding of O3 chemistry, this is due to increased O3 destruction in an atmosphere with more water vapor.
2. This decrease is in contrast to the significant climate-related increases for many already-polluted areas.
3. The relative impact of these changes in remote background O3 on simulated U.S. O3 concentrations is unclear. One potential influence pathway seen in some of the modeling results is an increased mixing of clean air into coastal areas, via stronger ocean-land flow combined with the reduced O3 concentrations over the oceans.
Relevance for air quality policy: Changes in O3 concentrations as a result of climate change will depend, in part, on whether an area is clean or polluted, and/or on the degree of influence of air masses from adjacent clean or polluted areas. For example, under low NOx conditions, a reduced atmospheric lifetime for O3 in the future due to increased humidity may imply reductions in the quantity of O3 transported downwind.
D. The potential impact of climate change on PM is less well understood than that on O3. Preliminary results from the modeling studies show a range of increases and decreases in PM concentrations in different regions and for different component chemical species in the same region.
xxv

1. Precipitation is a more important primary meteorological driver of PM than of O3, due to its role in removing PM from the atmosphere (wet deposition). Precipitation is particularly difficult to model and tends to show greater disagreement across simulations than other variables.
2. Aerosol chemical processes, especially those concerning the formation of organic aerosols and aerosol/cloud interactions, are not fully understood and therefore not well characterized in current regional air quality models.
3. In addition, increase in wildfire frequency associated with a warmer climate has the potential to increase PM levels in certain regions, but the relative importance of this effect is not well characterized.
4. Preliminary simulation results suggest that the PM response reflects the combined climate change responses of the individual species that make up PM (e.g., sulfate, nitrate, ammonium, black carbon, organic carbon, etc.). Depending on the region, these individual responses can be in competing directions, producing either increases or decreases in PM (on the order of a few percent).
Relevance for air quality policy: The more limited scientific understanding and greater modeling uncertainties concerning the production and loss of PM highlight the need for future research. Assessing the effects of a changing climate on PM on an airshed-by-airshed basis may be helpful for considering the detailed chemical characteristics of local PM, the possible range of changes in local precipitation, and the potential influence of changing wildfire frequency. An upcoming EPA report that is expected to incorporate new research findings will address the impacts of climate change on PM in more detail.
II. Impacts on Meteorological Variables that Directly Affect O3 Concentrations
A. Climate change has the potential to impact a number of meteorological variables important for O3. Whether changes in these variables lead to increases, decreases, or no change in O3 concentrations in a given region depends on whether the effects of these individual changes on O3 act in concert or compete with each other. This discussion of meteorological mechanisms is intended to provide additional detail to the general conclusions summarized in Section I above. 1. The simulations discussed in this report all show significant future changes in
meteorological quantities such as temperature, cloud cover, humidity, precipitation, wind speed and pattern, and mixing depth.
2. However, there is significant variability across simulations in the spatial patterns of these future changes.
3. As noted above in Section I.A, these variations across simulations help explain the disagreements in the spatial patterns of simulated future O3 changes. Each simulation produces its own unique pattern of changes in these key meteorological drivers. The combined effects of all of these changes in individual O3 drivers in turn help create the unique pattern of future O3 changes across regions seen for each simulation.
4. For example, the different simulations provide examples of regions where both temperature increased and surface solar radiation increased (due to a decrease in cloudiness). These regions tended to experience increases in future O3 concentration.
xxvi

In contrast, regions where the changes in these variables were in opposite directions tended to have mixed O3 results.
5. In general, variations in individual meteorological drivers are not independent of each other. This is because these variables are linked through underlying atmospheric processes, and thus there will tend to be consistent variations across groups of variables as a result of specific changes in pressure and cloud patterns. It is through such changes in short-term weather that the effects of long-term climate change on O3 are expressed.
Relevance for air quality policy: It is the interrelationships between the many meteorological variables important for O3 that determine O3 concentrations at a particular time and place. Evaluating the potential influence of climate change on air quality and the potential effectiveness of future control strategies will require accounting for these sometimes complex interactions. These complexities can best be appreciated through the use of integrated modeling systems capable of simulating interactions among drivers in a realistic and self-consistent way. Current modeling uncertainties lead to disagreements about the spatial patterns of future changes in meteorological variables and, hence, the specific regional distributions of future O3 changes across the United States.
B. Global climate change is expected to produce changes in planetary-scale circulation systems, thereby influencing regional weather patterns. These changes have the potential to strongly affect regional O3 concentrations, since O3 episodes are driven by synoptic meteorological variability. 1. Observations suggest that the extratropical storm tracks have moved poleward over
the last few decades. A number of recent modeling studies suggest that this trend could continue into the future (IPCC, 2007), resulting in significant changes in winds, precipitation, and temperature patterns in mid-latitudes, with implications for the simulated frequency and duration of synoptic stagnation events and resulting extreme O3 episodes.
2. Some of the modeling studies discussed in this report simulate increases in the duration and frequency of extreme O3 events in the Midwest and Northeast that can be directly traced to the weaker frontal systems and decreased frequency of surface cyclone activity due to a poleward storm track shift.
3. There remains some disagreement across models of the effects of climate change on the summertime mid-latitude storm tracks and stagnation, however, as other studies discussed in this report do not seem to simulate these circulation changes as strongly, and/or do not simulate the corresponding O3 increases.
4. Similarly, differences in simulations of the climate response of other key large-scale circulation patterns, like the Bermuda High off the U.S. east coast, also can produce significant differences in the amount and spatial distribution of simulated future O3.
Relevance for air quality policy: Changes in large-scale circulation systems can have a significant impact on O3 throughout the country. For example, understanding and accounting for changes in synoptic stagnation events resulting from large-scale storm track shifts is critical for understanding potential changes in future O3 concentrations in the northern portion of the United States. At present, modeling uncertainties persist, and
xxvii

further research is needed. Consideration of historic patterns in local meteorology versus current observations may help determine whether and where changes in stagnation should be addressed in city-level air quality planning.
III. Impacts on Climate-Sensitive Natural Emissions of O3 Precursors
A. Climate change has the potential to increase biogenic emissions of O3 precursors, but significant uncertainties remain about the impact of these emissions changes on O3 concentrations in a given region. Increases in lightning NOx production may also be a factor in future O3 changes. It is important to note that the modeling results discussed in this report do not account for all climate-sensitive natural emissions of chemical precursors, excluding, for example, oceanic dimethyl sulfide and sea-salt, mineral dust, methane from wetlands, and wildfire emissions. 1. Earlier observational studies suggest that increases in biogenic emissions of volatile
organic compounds (VOCs) would occur in many regions as a result of the higher temperatures associated with expected future climate change.
2. The modeling studies discussed in this report generally simulate increases in biogenic VOC emissions over most of the country as a result of climate change, with particularly substantial increases in certain regions, notably the Southeast.
3. However, these biogenic emissions increases do not necessarily correspond with large O3 concentration increases, depending on the region and modeling system used. One reason for this appears to be because the response of O3 to changes in biogenic VOC emissions depends strongly on how isoprene chemistry is represented in the models.
4. Globally, an increase in the rate of natural production of NOx by lightning is expected in a warmer and wetter climate. Some of the simulations discussed here examined this issue and did, in general, see future increases. As the significance of these results for regional U.S. O3 concentrations is unclear given the research available at this time, these findings are not highlighted in this report.
Relevance for air quality policy: Resolving uncertainties in the response of O3 to biogenic emissions changes is important to improve the understanding of potential climate change impacts on O3. For example, the success of regional O3 control strategies in regions like the southeastern United States may be highly sensitive to this uncertainty—additional anthropogenic emissions controls may need to be considered to offset climate-induced increases in biogenic emissions, but only if these emissions increases will lead to large O3 increases. A better understanding of the chemical reactions involving isoprene nitrate is critical for resolving this issue. Regional O3 control strategies in areas where biogenic VOC emissions are projected to increase due to climate change are likely to continue to be NOx-limited areas and thus continue to respond to NOx emissions decreases with O3 concentration decreases. In addition, local- and regional-scale O3 modeling does not typically consider NOx production from lightning. Given potential future changes in lightning NOx emissions, long-term air quality management strategies may need to account for growth in this source as well.
xxviii
IV. Modeling Uncertainties
A. Simulated future U.S. regional air quality is highly sensitive to model configuration choices in the integrated global-to-regional climate and air quality modeling systems used in this assessment. 1. As discussed in Section II above, there are large differences across modeling groups,
and/or across different model configurations used by the same group, in the specific spatial patterns of future simulated changes in meteorology that lead to differences in simulated future concentrations of O3.
2. These differences in simulated meteorology can largely be traced to differences in a number of elements of model system configuration. Key elements include which global climate model (GCM) was used to simulate future global climate change, whether the output from this GCM was “downscaled” to much higher resolution over the United States with a regional climate model (RCM), and which model physical parameterizations were used, for example for representing cumulus convection.
3. Sensitivities of air quality-relevant meteorology to other parameterizations (e.g., for turbulent mixing, radiative transfer, microphysics, and land-surface processes) may also be important but have yet to be examined systematically.
4. The specific techniques used to implement the downscaling of the GCM output with an RCM may also significantly affect the results, but this issue is still to be examined systematically as well.
5. As discussed above, there are also significant sensitivities of simulated O3 concentrations to uncertainties in the representation of key chemical processes in the models.
6. The choice of future greenhouse gas scenario also affects the future GCM climate simulation, though in 2050, as opposed to the end of the century, the range in greenhouse gas forcing across the various IPCC scenarios used in this assessment is still relatively small.
Relevance for air quality policy: It is important to carefully select and describe the GCM, RCM, model physical parameterizations, and downscaling techniques used as part of any model-based analysis of potential future changes in air quality. Interpretation of the causes of simulated air quality changes will, in general, be highly sensitive to these components. Additional efforts to understand and quantify the uncertainties associated with these components (as planned for Phase II) will aid in the interpretation of results produced by these modeling systems. Furthermore, work is needed on new strategies for incorporating information from climate models into uncertainty analysis while accounting for all sources of uncertainty.
V. Combined Impacts of Climate and Anthropogenic Emissions Changes
A. Preliminary work suggests that the impacts of climate change on future U.S. regional O3 concentrations remain significant when also considering possible future anthropogenic O3 precursor emissions changes. Several major efforts to address the combined impacts are underway and will be the subject of another EPA Global Change Research Program report in 2012.
xxix

1. A number of the modeling teams whose results are discussed in this report also carried out simulations with modified future air pollutant emissions constructed using spatially non-explicit scaling factors generally derived from the assumptions used to formulate the various IPCC greenhouse gas emissions scenarios.
2. These preliminary tests found that the combined effects of climate and anthropogenic precursor emissions changes are highly sensitive to the assumptions about future emissions trajectories.
3. For example, simple scaling of future emissions to match the gross assumptions of the IPCC A1B or B1 Special Report on Emissions Scenarios (SRES) scenario (IPCC, 2000) resulted in substantial reductions of U.S. NOx emissions in 2050, which in turn resulted in corresponding reductions in simulated future O3 concentrations. In contrast, using future emissions consistent with the weaker pollutant control assumptions in the “dirtier” A2 or A1Fi scenarios tended to result in higher future O3 concentrations.
4. The size of the climate change impact on air quality is highly dependent on the emissions levels. In other words, the effects of climate and emissions changes were not, in general, additive.
5. These results highlight the need for emissions scenarios with greater regional detail, consistency between global and regional assumptions, and consistency between greenhouse gases and precursor emissions. Meeting this need is a major focus of Phase II of the assessment effort.
Relevance for air quality policy: While existing air quality controls will likely continue to produce significant benefits, to the extent that climate change may increase O3 concentrations in some areas and therefore threaten the ability of an area to attain or maintain air quality standards, additional controls (i.e., a climate penalty) may be required. Preliminary results suggest that the magnitudes of additional controls could be significant in certain regions but also that they are highly dependent on detailed assumptions about future emissions. Exploring these assumptions and improving our understanding of the fundamental emissions drivers, as part of Phase II of this assessment, is expected to lead to the creation of improved scenarios of future emissions that in turn will be integrated into the climate and air quality modeling systems to produce more robust estimates of potential climate impacts on control policies.
This is an interim report, and, therefore, these findings should be considered to be preliminary. Future reports will update, refine, and augment the synthesis contained herein. Finally, it is important to emphasize that this assessment is a science assessment, not a policy assessment. In other words, the primary means by which this assessment will achieve its ultimate goal of enhancing the ability of air quality managers to consider global change in their decisions is through the development of tools and a knowledge base to answer science questions about the potential impacts of global change on air quality. The resulting improved understanding of the behavior and complexities of the system can then provide a basis for a suite of parallel, collaborative activities between the science and policy audiences of this report. Such
xxx

xxxi
activities would be aimed at answering specific air quality management questions and might include, for example, the development of new tools and models, designed with an explicit focus on decision support, that incorporate the new scientific and technical knowledge gained as a result of this assessment. The initiation of such collaborative efforts would represent a significant assessment outcome.

1 INTRODUCTION TO THE PROBLEM 1.1 INTRODUCTION
The recent Intergovernmental Panel on Climate Change (IPCC) Fourth Assessment Report (AR4) found that “Warming of the climate system is unequivocal, as is now evident from observations of increases in global average air and ocean temperatures, widespread melting of snow and ice, and rising global average sea level” (IPCC, 2007). The IPCC also found that “Most of the observed increase in globally averaged temperatures since the mid-20th century is very likely due to the observed increase in anthropogenic greenhouse gas concentrations.” Furthermore, of particular importance for the U.S. Environmental Protection Agency’s (EPA) mission to protect human health and the environment was the IPCC’s finding that “Future climate change may cause significant air quality degradation by changing the dispersion rate of pollutants, the chemical environment for ozone and aerosol generation and the strength of emissions from the biosphere, fires and dust. The sign and magnitude of these effects are highly uncertain and will vary regionally.”
The National Research Council (NRC), in 2001, posed the question “To what extent will the U.S. be in control of its own air quality in the coming decades?” noting that “…changing climatic conditions could significantly affect the air quality in some regions of the U.S.” (NRC, 2001). The NRC called for the expansion of weather and air quality studies to include “studies of how air quality is affected by long-term climatic changes.” To address this concern, the EPA’s Office of Research and Development (ORD) Global Change Research Program initiated a research effort to increase our understanding of the multiple complex interactions between climate and atmospheric chemistry. The ultimate goal of EPA’s air quality assessment is to enhance the ability of air quality managers to consider global change in their decisions through improved characterization of the potential impacts of global change on air quality.
This ultimate goal will be achieved via three distinct assessment sub-goals:
• To develop tools and a knowledge base to answer science questions about the impacts of global change on air quality.
• To deliver the general benefits to the air quality policy and management community that derive from addressing these science questions, namely, an improved understanding of the behavior and complexities of the global change-air quality system, an appreciation for the strengths and limitations of the scientific tools and methods used to develop this improved understanding, and an answer to the first and most basic “policy” question, “is climate change something we will have to account for when moving forward with U.S. air quality policy?”
1-1

• To set the stage for determining how to apply these scientific insights and tools to help answer specific, detailed policy and management questions.
This last sub-goal anticipates a separate activity, or set of activities, branching off from this science assessment, that will coalesce around specific air quality decision support needs. These activities might include, for example, developing new tools and models designed explicitly for decision support (rather than primarily for scientific research).
This interim assessment report provides an update on the progress toward these three sub-goals. As will be discussed in more detail in Section 1.4 below, and in Section 2, the assessment design calls for first providing insight into possible air quality responses to future climate changes before tackling the additional complexities of incorporating potential future changes in anthropogenic emissions and long-range pollutant transport. Therefore, its primary focus is on the potential changes in U.S. regional air quality due to global climate change alone, including direct meteorological impacts on atmospheric chemistry and transport, and the effect of these meteorological changes on climate-sensitive natural emissions of pollutant precursors. As such, this interim report cannot fully address questions related to the importance of changing future anthropogenic emissions of air pollutants. Meeting this need is a major focus of Phase II of the assessment effort.
The following sub-sections will present the major themes that run through this report, provide background on the potential links between climate and air quality that motivate the science questions underlying the assessment research, outline the structure and design of the overall assessment, identify the assessment stakeholders, discuss issues related to handling scientific uncertainty, and present a roadmap to the rest of the report. 1.2 MAJOR THEMES OF THE INTERIM ASSESSMENT REPORT
In the course of conducting this assessment, two “grand challenges” have emerged. The first stems directly from the EPA Global Change Research Program’s emphasis on decision support. The challenge is to provide the best possible scientific basis for understanding the potential range of impacts of climate change on air quality, and air quality policies, in a useful form and a timely manner, as one important set of information inputs to help managers develop appropriate pollution control strategies. Having these improved insights into the way the global change-air quality system works may yield new options for addressing air quality issues or minimize the potential for introducing policies with significant unintended consequences. At the same time, the complexity of the problem, and hence the data, models, and techniques used to address it, means that many unanswered scientific questions and unresolved uncertainties will exist at a given point in the decision-making timeline. These must be understood and accurately
1-2

conveyed to policy makers so they have a sense of the levels of confidence underlying individual elements of this scientific understanding.
The second “grand challenge” is to convey to the scientific research community the key knowledge gaps that limit our understanding of the problem and/or create barriers to the use and interpretation of scientific information by decision makers. These range from the sensitivity of regional climate simulations to the parameterizations and methods used in downscaling to how the intricate details of the chemical mechanisms are represented in the models. For example, as will be discussed in Section 3, there are a number of meteorological metrics that are crucial for modeling regional air quality for which the climate modeling community has not yet systematically evaluated the skill of their modeling systems. Similarly, future emissions scenarios that are consistent across pollutants and geographic scales and that incorporate important processes such as fire, land use, biogenic emissions, and technological change are lacking, limiting the kinds of studies that can be accomplished at this time.
It is possible to think of these challenges as informing two parallel “readings” of this report, one tuned to the perspective of a “science” audience and the other to that of a “policy” audience. While these obviously intersect and overlap, each would highlight its own distinct set of issues, falling broadly under two questions: “What do we know, scientifically, about the climate change-air quality problem?” and “What might this knowledge mean for me, as an air quality manager?”
For example, for the scientific audience, this report generates additional information by synthesizing across the findings from multiple research groups. This synthesis improves our understanding of the potential for climate change to impact air quality in different regions of the United States and the complex interplay between air quality and its different climatic and meteorological drivers. It also throws into relief scientific and technical uncertainties that will be helpful in guiding future research efforts.
For the policy audience, the scientific findings presented in this report begin to answer the question raised above: “Is climate change something we will have to account for when moving forward with U.S. air quality policy?” In addition, by illuminating the subtleties and complexities of the interactions between climate, meteorology, and air quality, these findings can inform thinking about policy responses. This knowledge can be carried forward into the next phase of the assessment, which will consider added complications such as changes in anthropogenic emissions drivers. Furthermore, this report provides a basis for evaluating the relative robustness of these scientific findings in light of the uncertainties that surround them. Finally, all of these general insights create a foundation for targeted efforts to solve specific air quality management problems.
1-3
1.3 BACKGROUND
1.3.1 Air Pollution EPA's mission is to protect human health and the environment. To achieve this mission,
EPA implements a variety of programs under the Clean Air Act that reduce ambient concentrations of air pollutants, including those that cause smog, haze, and acid rain. Pollutants such as ozone (O3) are not emitted directly into the atmosphere: instead they are created by chemical reactions between nitrogen oxides (NOx) and volatile organic compounds (VOCs) in the presence of heat and sunlight. VOCs are emitted from a variety of sources, including motor vehicles, chemical plants, refineries, factories, consumer and commercial products, other industries, and natural (biogenic) sources. NOx is emitted from motor vehicles, power plants, other sources of combustion, and natural sources including lightning and biological processes in the soil. EPA’s efforts have been successful: between 1980 and 2007, emissions of VOCs and NOx decreased by 50 and 39 percent respectively, even though gross domestic product increased 124 percent, vehicle miles traveled increased 103 percent, and energy consumption increased 30 percent (U.S. EPA, 2008; see also http://www.epa.gov/airtrends/sixpoll.html).
Air pollution, however, continues to be a widespread public health and environmental problem in the United States. In 2007, approximately 158 million people lived in counties that exceeded at least one of the National Ambient Air Quality Standards (NAAQS). The health effects of air pollution range from increased mortality to chronic effects on respiratory and cardiovascular health (e.g., see Jerrett et al., 2009). Air pollution also has been associated with increased use of health care services, including visits to physicians and emergency rooms and admissions to hospitals. Other effects include reduced visibility, damage to crops and buildings, and acidifying deposition on soil and in water bodies, where the chemistry of the water and resident aquatic species are affected.1 Moreover, there is growing concern that global change may make it more difficult to reach these goals. The air quality assessment effort itself does not address health and other effects. However, it will provide information that will be used in the Global Program’s climate and air quality health assessments, the first of which focuses on O3. 1.3.2 Climate Change and Air Quality Linkages
The NRC, in 2001, highlighted the linkages between climate and regional air quality and the need for a comprehensive research strategy:
Air pollution is generally studied in terms of immediate local concerns rather than as a long-term 'global change' issue. In the coming decades, however, rapid
1 See, for example the Ozone Criteria Document, at
http://cfpub.epa.gov/ncea/cfm/recordisplay.cfm?deid=149923, and the Particulate Matter Criteria Document, at http://cfpub.epa.gov/ncea/cfm/recordisplay.cfm?deid=149923.
1-4

population growth and urbanization in many regions of the world, as well as changing climatic conditions, may expand the scope of air quality concerns by significantly altering atmospheric composition over broad regional and even global scales. … Although air quality and climate are generally treated as separate issues, they are closely coupled through atmospheric chemical, radiative, and dynamical processes. … A better understanding is needed in order to make accurate estimates of future changes in climate and air quality and to evaluate options for mitigating harmful changes. Coupling atmospheric chemical processes and the climate system remains a challenge to
the science and modeling communities, however, because a large number of physical, chemical, and biological processes are involved (see Figure 1-1), and many of these are poorly understood.
Figure 1-1. Schematic representation of the multiple interactions between tropospheric chemical processes, biogeochemical cycles, and the climate system. RF represents radiative forcing, UV represents ultraviolet radiation, and IR represents infrared radiation. The red arrows, discussed below in Section 1.4.1, represent the scope of EPA’s assessment effort. (Adapted from IPCC, 2007.)
Atmospheric Concentrations
CH4
VOCsCO
Pollutant Emissions• Fossil Fuel Combustion
•Biomass Burning•Industrial Emissions
•Emissions Relating to Land‐use Change
ClimateNitrogen CycleEmissions
Environmental Concentrations
Atmospheric Concentrations
O3
Ecosystem NutrientsBiogenic Emissions
Lightning,Precipitation,Temperature
RF (IR)
CH4, VOCEmissions Rates
RF (UV + IR)
O3 Production O3 Production
Carbon Oxidation(via OH) Temperature,
Humidity, Dynamics
N2O, RF
NOx, HNO3
Lifetimes
Atmospheric Concentrations
CH4
VOCsCO
Atmospheric Concentrations
CH4
VOCsCO
Atmospheric Concentrations
CH4
VOCsCO
Pollutant Emissions• Fossil Fuel Combustion
•Biomass Burning•Industrial Emissions
•Emissions Relating to Land‐use Change
Pollutant Emissions• Fossil Fuel Combustion
•Biomass Burning•Industrial Emissions
•Emissions Relating to Land‐use Change
ClimateNitrogen CycleEmissions
Environmental Concentrations
Nitrogen CycleEmissions
Environmental Concentrations
Nitrogen CycleEmissions
Environmental Concentrations
Atmospheric Concentrations
O3
Atmospheric Concentrations
O3
Ecosystem NutrientsBiogenic Emissions
Lightning,Precipitation,Temperature
RF (IR)
CH4, VOCEmissions Rates
RF (UV + IR)
O3 Production O3 Production
Carbon Oxidation(via OH) Temperature,
Humidity, Dynamics
N2O, RF
NOx, HNO3
Lifetimes
1-5

1.3.2.1 Air Quality Impacts on Climate Change Prior to the mid-1970s, anthropogenic climate change was largely viewed as a
CO2-driven phenomena. This picture began to change with a series of papers on non-CO2 reactive gases including:
• The impact of Chlorofluorocarbons (CFCs) on the greenhouse effect (e.g., Ramanathan,
1975);
• The impact of NOx on stratospheric O3 (a strong greenhouse gas) (e.g., Crutzen, 1972);
• The identification of methane (CH4) and nitrous oxide (N2O) as greenhouse gases (e.g., Wang et al., 1976); and
• The contribution of tropospheric O3 (and therefore CO, VOCs, and NOx) to global warming (e.g., Fishman et al., 1980).
A World Meteorological report published in 1985 concluded that trace gases other than
CO2 contributed as much anthropogenic climate forcing as CO2 since the industrial revolution (Ramanathan et al., 1985), and our understanding of the multiple strong and complex links between climate and air quality have continued to evolve (Ramanathan and Feng, 2009).
Air pollution emissions can also affect concentrations of the hydroxyl radical (OH), the primary cleansing agent of the lower atmosphere, with increases in NOx tending to elevate OH levels, while increases in CO have the opposite effect. Changes in OH affect the lifetime and thus the concentrations of reactive greenhouse gases such as CH4, HFCs, and HCFCs (NRC, 2001). The nitrogen cycle itself plays a key role in climate and atmospheric chemistry, contributing N2O (a greenhouse gas), NOx (an O3 precursor, with indirect effects on CH4 via shortening of atmospheric lifetime), and ammonia (NH3), which contributes to the formation of sulphate and nitrate aerosols (IPCC, 2007).
Aerosol particles affect climate by scattering and absorbing radiation (the “direct effect”) and through their impact on clouds (the “indirect effect”). Aerosols interact with clouds and precipitation in a variety of ways: e.g., by acting as cloud condensation nuclei and/or ice nuclei; through effects on the albedo or reflectivity of the cloud; and by impacting cloud lifetimes. Such effects can change precipitation patterns as well as cloud extent and optical properties (CCSP, 2009).
1.3.2.2 Climate Change Impacts on Air Quality
Concerns about the impacts of climate change on air quality are grounded in information derived from a wealth of observational studies, knowledge of basic atmospheric chemistry, and, more recently, modeling studies (see Appendix A for more details about these lines of evidence).
1-6

For example, there have been many empirical analyses showing that weather patterns play a major role in establishing conditions conducive to O3 formation and accumulation, given sufficient levels of precursor pollutants such as nitrogen oxides (NOx) and volatile organic compounds (VOCs): e.g., year-to-year variability in warm-season climate is strongly correlated with variability in O3 exceedances. Generally speaking, meteorological conditions favorable to high levels of O3 include sunshine, high temperatures, and stagnant air (NRC, 1991). However, this NRC report also cautioned about the potential complexities of the problem arising from interactions between key drivers, noting that, for example, the relationship between temperature and O3 “cannot readily be extrapolated to a warmer climate because higher temperatures are often correlated empirically with sunlight and meteorology.”
A variety of statistical methods have been successfully applied to weather, O3, and other data to obtain short-term air quality forecasts (U.S. EPA, 1999), estimate time trends (Thompson et al., 2001; Bloomfield et al., 1996; Cox and Chu, 1993; Camalier et al., 2007), and increase understanding of underlying mechanisms (Sillman and Samson, 1995). There are substantially fewer observations for particulate matter (PM), as monitoring networks have been in place for a much shorter time period. This should improve over time as more data become available.
Two early modeling studies (Morris et al., 1995; U.S. EPA, 1989) of the effect of a warming climate on U.S. O3 levels considered a uniform 4°C increase in temperature across horizontal, vertical, and temporal scales.2 The EPA study modeled specific episodes and simulated changes in daily 1-hour maximum O3 concentrations ranging from +3 to +20% for Central California and from −2.4 to +8% for the Midwest and Southeast. Morris et al. (1995) included the effect of warmer conditions on mobile source and biogenic emissions in their simulation of a 4-day episode in the Northeast, simulating O3 concentration increases of 15−25 parts per billion by volume (ppb) in much of the modeling domain above baseline daily one-hour maximum concentrations of 110−120 ppb and 120−140 ppb (i.e., increases of 10−20%).
The results of these early studies suggested that regional air quality may be sensitive to a warming climate, creating an additional challenge for air quality managers. However, as noted by the authors, their studies were constrained by the limitations of the tools and data available at the time. It was recognized that the relationship between climate change and air quality was not a simple one of “higher temperatures equals worse air quality” (NRC, 1991; U.S. EPA, 1989). The number of meteorological factors, and the complex interactions between and among them and air pollutants (see Box 1-1), highlight the need to use sophisticated modeling tools and experimental designs to help understand the multiple ways that climate change can affect
2 Because of the technical hurdles existing at the time in adapting climate model output to be input to a regional air quality model, the researchers elected to make this simplifying assumption.
1-7

regional air quality. Fortunately, modeling capabilities have improved substantially since that time and continue to improve.
Box 1-1. Climate Change Factors Important for Regional Air Quality Adapted from U.S. EPA (1989) Changes in the following affect air quality:
• The average maximum or minimum temperature and/or changes in their spatial distribution and duration leading to a change in reaction rate coefficients and the solubility of gases in cloud water solution;
• The frequency and pattern of cloud cover leading to a change in reaction rates and rates of conversion of SO2 to sulfate aerosols, leading to acid deposition;
• The frequency and intensity of stagnation episodes or a change in the mixing layer leading to more or less mixing of polluted air with background air;
• Background boundary layer concentrations of water vapor, hydrocarbons, NOx, and O3, leading to more or less dilution of polluted air in the boundary layer and altering the chemical transformation rates;
• The vegetative and soil emissions of hydrocarbons and NOx that are sensitive to temperature and light levels, leading to changes in their concentrations;
• Deposition rates to vegetative surfaces whose absorption of pollutants is a function of moisture, temperature, light intensity, and other factors, leading to changes in concentrations; and
• Circulation and precipitation patterns leading to a change in the abundance of pollutants deposited locally versus those exported off the continent.
1.4 DESIGN OF THE GLOBAL CHANGE AND AIR QUALITY ASSESSMENT
To address the need for an improved understanding of the potential impacts of global change on U.S. regional air quality, building on the scientific understanding summarized above, an integrated assessment framework was designed that blends the research and development strengths within the EPA with those of other agencies and the academic research community. The assessment program was designed to provide the scientific information and modeling capabilities to answer the following types of questions:3
• What are the effects of plausible future changes in climate, climate variability, and land-use patterns on air quality, specifically ground-level O3 and PM?
• What is the range of potential impacts of climate change on air quality relative to the range of potential impacts of emissions changes due to pollution controls, technological development, and land-use change?
• How might the effectiveness of air quality management be affected by climate change, i.e., can changes in emissions, technology, and land use offset air quality changes due to climate change?
3 These questions were adapted from the November 2002 EPA Global Change Research Program Research
Strategy (EPA/600/R-02/087), which can be found at: http://www.epa.gov/ncea/pdfs/glblstrtgy.pdf.
1-8

1.4.1 Scope of the Assessment Effort The discussion in Section 1.3.1 is not a comprehensive description of all the potential
linkages between climate and atmospheric chemistry. Instead, it is meant to highlight the fact that these linkages are complex, involve nonlinear coupling among numerous processes, and that many of these are not well quantified. The scientific enterprise required to elucidate all of the linkages exceeds the resources available to the EPA’s Global Change Research Program.
Accordingly, the Program elected to focus its efforts on the impact of climate change on regional air quality (the red arrows emanating from the “Climate” box in Figure 1-1) to inform and support EPA’s air quality programs. The NRC (2004) identified climate change as an important new challenge to the air quality management (AQM) system. The report concluded that “The AQM system must be flexible and vigilant in the coming decades to ensure that pollution mitigation strategies remain effective and sufficient as our climate changes.” Focusing on climate effects on air quality also takes advantage of the considerable expertise within EPA in regional air quality modeling. Other federal agencies have active research programs investigating other aspects of Figure 1-1, such as the feedback effects of aerosols and atmospheric chemistry on the climate system. The Atmospheric Composition research element of the U.S. Climate Change Science Program (CCSP) coordinates research on atmospheric chemistry and climate system interactions across the federal government.4
The assessment addresses its questions in two phases. Phase I of the effort focuses on augmenting, linking, and applying existing climate and atmospheric chemistry models to investigate the range of current and potential future meteorological effects on air quality. It does not include changes in air pollutant emissions other than those that are explicitly linked to meteorological variables and incorporated within the models (e.g., biogenic VOC emissions, evaporative emissions, lightning NOx, depending on the modeling system).
Phase II of the assessment focuses on the combined impact of changing climate and changing air pollutant emissions on air quality. It builds on the findings from the first phase by extending the linked modeling systems developed therein, and also by exploring the scientific uncertainties more comprehensively. Simultaneously, it integrates plausible, spatially detailed scenarios of U.S. criteria pollutant emissions 50 years in the future with the climate and air quality modeling efforts initiated in the first phase. The development of the tools to create plausible scenarios of technology, land use, and demographic changes needed to derive these emissions scenarios is a critical aspect of this phase of the assessment.
4 See http://www.usgcrp.gov/usgcrp/ProgramElements/atmosphere.htm.
1-9

1.4.2 What is Covered in this Report The problem and challenge of air quality is defined by its local impacts combined with its
global dimensions and the linkages across scales and disciplines needed to address it. The purpose of this interim assessment report is to provide an update on our progress toward the development of tools and a knowledge framework that encompasses these linkages in the investigation of global change impacts on U.S. air quality. It is not intended to provide a comprehensive assessment of the literature. There have been several recent state-of-the-science reviews that provide such assessments (e.g., see IPCC, 2007 Chapter 7; Jacob and Winner, 2009; U.K. Royal Society, 2008).
By design, the emphasis in this report is on EPA, and EPA-funded, work carried out under the EPA Global Change Research Program’s assessment. In Section 3, the focus is on results emerging from the subset of participating intramural and extramural research groups that are currently producing model simulations of the impacts of climate change on air quality, as part of Phase I of the assessment. This is a mid-course overview of the findings to date from the several parallel efforts to build, test, and apply individual versions of these linked climate and air quality modeling systems. Notably, this is the first systematic effort to apply combined global and regional climate and air quality models to investigations of potential climate change impacts on future U.S. regional air quality. Though the focus is on EPA, and EPA-funded, research, this body of work does in fact represent the large majority of the research to date in the area of applying these types of linked modeling systems to the problem of regional U.S. air quality (e.g., see Jacob and Winner, 2009).
From a scientific perspective, the main goal is to assess the larger meaning of the various research groups’ model simulation results when examined all together. The aim is to synthesize the simulated air quality changes in different regions of the United States, as well as the dependence of these changes on different climatic drivers. By highlighting scientific and technical uncertainties to which these findings are sensitive, the synthesis helps identify future research needs.
From a policy perspective, this synthesis across scientific findings begins to answer the question: “Is climate change something we will have to account for when moving forward with U.S. air quality policy?” In addition, by illuminating the subtleties and complexities of the interactions between climate, meteorology, and air quality, it helps build up intuition about the way the coupled system works. Section 3 also provides an extended discussion of the challenges and uncertainties associated with the modeling approach that underpins the assessment, to create an improved understanding about the level of confidence in the scientific findings, and an appreciation for the limits on what questions the science can answer now, and may be able to answer in the future.
1-10

Changes in anthropogenic forcing (i.e., fossil fuels, biomass burning, and land use) are not covered in this report. However, they will be addressed in the second phase of the assessment effort. Section 4 provides an overview of Phase II. Ongoing activities include investigation of modeling uncertainties (for example, through the use of ensemble approaches), additional model development (for example, the incorporation of dynamic vegetation sub-models), and examination of additional pollutants including PM and mercury. Preliminary results for PM are provided, but a more comprehensive presentation awaits future assessment reports focusing on these additional pollutants. Future assessment reports also will cover the combined impacts of changing climate and air pollutant emissions on air quality. Initial results from combined climate and emissions sensitivity studies and ongoing work on the drivers of emissions changes—e.g., technology, population growth and geographic distribution, economic growth, and land use—are also described in Section 4. 1.5 THE CLIENT COMMUNITIES
Section 1.2 referred to the two broadly defined themes, audiences, and readings of this report that flow from the two “grand challenges.” Though this conceptualization provides a useful roadmap to the major purposes of the report, it is also important to identify specific groups that are potential beneficiaries of the information contained herein, and that supply the audiences and perspectives to which the report speaks. These include air quality managers, employees of agencies working as part of the overall U.S. federal climate change research effort, and the climate change and air quality research and modeling communities. 1.5.1 EPA Office of Air and Radiation (OAR), State, Tribal, and Local Air Quality
Planners The EPA’s Global Change Research Program engages in activities that support EPA’s
mission to protect human health and the environment. As the specific focus of this report is air quality, OAR is a major client for this work. Recent air quality regulations, such as the NOx State Implementation Plan (SIP) Call,5 Clean Air Interstate Rule (CAIR),6 Heavy Duty Highway Diesel Rule,7 and Non-road Diesel Rule,8 are expected to bring many urban areas of the United
5 “Finding of Significant Contribution and Rulemakings for Certain States in the Ozone Transport
Assessment Group Region for the Purposes of Reducing Regional Transport of Ozone (“NOx SIP Call”).” U.S. EPA Technology Transfer Network: O3 Implementation.
6 “Clean Air Interstate Rule.” U.S. EPA: Clean Air Rules of 2004. http://www.epa.gov/cair/. 7 “Clean Diesel Trucks, Buses, and Fuel: Heavy-Duty Engine and Vehicle Standards and Highway Diesel
Fuel Sulfur Control Requirements (the “2007 Heavy-Duty Highway Rule”).” U.S. EPA. http://www.epa.gov/otaq/highway-diesel/regs/2007-heavy-duty-highway.htm.
8 “Clean Air Nonroad Diesel – Tier 4 Final Rule.” U.S. EPA. http://www.epa.gov/nonroad-diesel/2004fr.htm.
1-11

States into attainment with current PM and O3 standards by 2015. However, as noted by the NRC (2004),
The AQM system will need to ensure that pollution reduction strategies remain effective as the climate changes, because some forms of air pollution, such as ground-level ozone, might be exacerbated. In addition, emissions that contribute to air pollution and climate change are fostered by similar anthropogenic activities, that is, fossil fuel burning. Multi-pollutant approaches that include reducing emissions contributing to climate warming as well as air pollution may prove to be desirable. Furthermore, air quality management involves policy decisions with consequences that
can last for decades. For example, policy guides the choices made for electricity production investment and the emissions and fuel efficiencies of motor vehicles. Power plant and motor vehicle fleet replacement involves very long lead-times (see, e.g., U.S. EPA, 1992). In this context, it will be important to consider the air quality impacts of global change to identify actions that accomplish air quality goals with the least long-term cost to society. Information and tools supporting the creation of holistic, robust decisions are thus very much needed. Similarly, information and tools supporting new and innovative approaches to existing and emerging issues are needed as well. As introduced in Section 1.1 above, providing a foundation for developing such decision support instruments that can be transferred to national, regional, state, and local decision-makers is a critical goal of the overall air quality assessment effort. 1.5.2 U.S. Climate Change Science Program (CCSP)
The CCSP integrates federal research on climate change, as sponsored by 13 federal agencies and overseen by the Office of Science and Technology Policy (OSTP), the Council on Environmental Quality (CEQ), the National Economic Council (NEC), and the Office of Management and Budget (OMB). The primary EPA role within the CCSP is to develop an understanding of the potential consequences of global change on human health, ecosystems, and socioeconomic systems in the United States. Currently, EPA’s ORD, within which the Global Change Research Program is located, is focusing on topics that include impacts on future water and air quality, risks to coral reefs and watersheds, and impacts on biological criteria and aquatic invasive species, as well as developing decision support methods and resources.
The impact of climate change on air quality is one of the overarching questions guiding the Atmospheric Composition research element of the CCSP (CCSP, 2003; see Box 1-2). The CCSP Atmospheric Composition Interagency Working Group coordinates research that focuses on how the composition of the global atmosphere is altered by human activities and natural phenomena and how such changes influence climate, O3, PM, ultraviolet radiation, pollutant exposure, ecosystems, and human health. Atmospheric composition issues involving
1-12

interactions with climate variability and change—such as the potential effects of global climate change on regional air quality—are important research topics. Several federal agencies, including the National Oceanographic and Atmospheric Administration (NOAA), the National Aeronautics and Space Administration (NASA), and the Department of Energy (DOE), are involved in research activities in this area, including satellite observations, aircraft field campaigns, laboratory studies, and global modeling studies. EPA contributes its expertise in regional air quality modeling and anthropogenic emissions, along with research support in other air quality-relevant topic areas.
Box 1-2. Contributions to CCSP The EPA Global Change Research Program Air Quality Assessment addresses a number of CCSP research and development elements, as described in the CCSP strategic plan (CCSP, 2003), including Chapter 3. Atmospheric Composition Question 3.3: What are the effects of regional pollution on the global atmosphere and the effects of global climate and chemical changes on regional air quality and atmospheric chemical inputs to ecosystems? Question 3.5: What are the couplings and feedback mechanisms among climate change, air pollution, and ozone layer depletion, and their relationship to the health of humans and ecosystems? Chapter 9. Human Contributions and Responses to Environmental Change Question 9.2: What are the current and potential future impacts of global environmental variability and change on human welfare, what factors influence the capacity of human societies to respond to change, and how can resilience be increased and vulnerability reduced? Question 9.4: What are the potential human health effects of global environmental change, and what climate, socioeconomic, and environmental information is needed to assess the cumulative risk to health from these effects? Chapter 11. Decision Support Resources Development Goal 11.1: Prepare scientific syntheses and assessments to support informed discussion of climate variability and change issues by decision-makers, stakeholders, the media, and the general public. Goal 11.2: Develop resources to support adaptive management and planning for responding to climate variability and climate change, and transition these resources from research to operational application. Goal 11.3: Develop and evaluate methods (scenario evaluations, integrated analyses, alternative analytical approaches) to support climate change policymaking and demonstrate these methods with case studies.
In addition to contributing to efforts under the Atmospheric Composition element, the scientific and technical accomplishments of the current assessment are enlarging the database of information needed to address questions under a number of other CCSP elements (see Box 1-2). Information from the ongoing air quality assessment is included in the CCSP Synthesis and Assessment Product 4.6: “Analyses of the effects of global change on human health and welfare and human systems” (CCSP, 2008).
1-13

1.5.3 Climate Change Research Community Understanding potential impacts of global change on U.S. air quality is a particularly
challenging task, given the varying climate regimes contained within the continental United States and the 3-dimensional modeling at high spatial and temporal resolution that is required to capture effects of importance to policy planners. The larger climate change research community, including other government science agencies and academia, plays a crucial role in the EPA Global Change Research Program’s research and development process by assuming the task of advancing the capabilities of global and regional climate models and global and regional atmospheric chemistry models. Beyond the many challenges of understanding potential future global climate change itself, the problem of impacts on air quality adds additional dimensions. For example, the global climate modeling community has typically focused on long-term average meteorological parameters on continental and planetary scales, while adverse regional air quality events are often determined by finer-scale geographic and temporal variability. Successfully simulating the impact of climate change on air quality requires advances in the climate sciences and climate modeling, with particular attention to these spatial and temporal needs. The research synthesis portion of this report (Section 3) looks across the modeling studies conducted as part of this assessment, studies that represent an initial step toward addressing this challenge.
In addition, the modeling work in this assessment provides an important test of some methodologies used for linking (downscaling) global and regional climate models, a key aspect of climate impacts work in general. Further advances in meeting the demanding requirements of simulating climate change impacts on U.S. air quality will improve our capabilities to assess other global change impacts of great importance to the environmental policy community, including impacts on water quality, aquatic ecosystems, water resources, agriculture, and forests, in addition to the quantification of air quality-related human health effects. 1.5.4 Air Quality Research Community
Developing coupled climate and air quality modeling systems challenges the capabilities of regional air quality models. Improvements in our ability to model chemistry of air pollution are needed in a number of areas to better understand the influence of climate change on air quality. For example, enhancing linkages between climate/meteorology models and air quality models, developing suitable initial and boundary conditions for all important chemical species, and producing plausible future emission scenarios are all required. Comprehensive examinations like this assessment effort also reveal key uncertainties in chemical mechanisms and processes that can be used to prioritize future modeling improvements. Notable among these is the need to introduce the ability to simulate two-way interactions between climate and chemistry: for
1-14

example, changes in the distribution of particulates as a result of climate or emissions changes could have important impacts on the Earth’s radiation budget, thereby further influencing climate. Finally, the extremely large data files involved in this assessment effort have required the development of automated data management and quality control tools and highlighted the need for new data distribution systems. 1.6 CONSIDERING UNCERTAINTY IN THE ASSESSMENT EFFORT
Characterization of the uncertainty in a given finding, judgment, or prediction, and communication of this uncertainty in clear, precise, objective language, are important components of scientific assessments. Large global change assessment efforts, such as those conducted by the IPCC and CCSP, have produced general guidance on handling uncertainty in assessment reports (see CCSP, 2009; IPCC, 2005). For example, a fundamental principle is that basic differences between descriptions of uncertainty in terms of likelihood of an outcome and level of confidence of the science underlying a finding must be recognized.
Likelihood is relevant when assessing the chance of defined future occurrence or outcome. When the maturity of the scientific knowledge base warrants it, it is considered best practice to assign numerical probabilities to qualifiers such as “probable,” “possible,” “likely,” “unlikely,” etc., to avoid differing interpretations among people and contexts.
Level of confidence refers to the degree of belief in the scientific community that available understanding, models, and analyses are accurate, expressed by the degree of consensus in the available evidence and its interpretation. One way to think about the level of confidence concept is to consider two attributes of the state of knowledge underlying a given finding or judgment: the amount of evidence available to support it and the degree of consensus within the scientific community about the interpretation of that available evidence.
The study of climate impacts on air quality is a still-emerging field of research. In addition, the modeling studies discussed herein were designed to be sensitivity studies, not predictions. Therefore, this report does not attempt to express the findings from the scientific synthesis in terms of the probabilities (“likelihoods”) of particular future events. Instead, the report provides information to help evaluate the relative levels of confidence in the findings. Findings for which multiple lines of evidence are presented, and for which there is general agreement across these lines of evidence, should be viewed with higher confidence than findings for which there is a paucity of observations and/or model simulation results or for which there are competing interpretations of the results that are available. For example, as will be discussed in Section 3, there is broad agreement across the modeling studies, consistent with scientific understanding from theory and observations, that simulated future climate change leads to increases in biogenic VOC emissions in the southeastern United States, but there is significant
1-15

disagreement as to whether these emissions increases lead to large increases in O3 concentrations due to uncertainty about how to represent isoprene nitrate chemistry.
Section 3 provides a detailed discussion of the major uncertainties associated with the coupled climate and air quality modeling systems upon which rests the science synthesis presented in this report. Moving forward into the second phase of the assessment, the complexity of the problem will grow when the multiple dimensions of climate and emissions changes are fully integrated. In anticipation of the challenges that multiple, interacting categories of uncertainties will present for interpretation of the assessment findings, EPA convened an expert workshop in November 2006 to begin the process of identifying a set of guiding principles to assist in evaluating uncertainty as the assessment moves forward. Participants included experts in global and regional climate modeling, socioeconomic modeling and emissions projection, atmospheric chemistry, regional air quality modeling, and uncertainty analysis and communication, along with key stakeholders from OAR and the EPA regions. The workshop findings suggested emphases on the following issues: building a healthy, collaborative process involving both scientists and policy makers; identifying formal uncertainty analysis techniques appropriate for complex, computationally expensive linked climate and air quality modeling systems; evaluating the potential contributions of complementary methods, such as expert elicitation; communications strategies; and the need for future workshops to focus on specific technical issues. The workshop and its findings are summarized in Appendix B. 1.7 STRUCTURE OF THIS REPORT
This report presents the progress made toward the overall assessment goals. It is divided into five sections (including this one):
The Summary of Policy Relevant Findings, which precedes this section, seeks to draw some preliminary connecting lines between the scientific findings of the assessment to date and the issues of concern to air quality managers. Analogous to the approach taken in the IPCC Summary for Policymakers, OAR was substantially engaged in the writing of this section in order to ensure the salience of the results for air quality policy.
Section 2 discusses in greater detail the design of the assessment effort, including the process used to develop this design, key decisions made by the research team, research priorities, and program capabilities. The focus on developing and applying linked global-to-regional climate and air quality modeling systems is in recognition of the complexities of the global change-air quality problem, including its multi-scale (i.e., from global to local; from decadal to diurnal) dimensions.
Section 3 synthesizes the results emerging from the initial applications of these modeling systems to the simulation of U.S. air quality under potential future climate change. It highlights
1-16

1-17
the sensitivities in the climate-air quality system and the uncertainties associated with the modeling tools.
Section 4 discusses the next phase of the assessment. It summarizes ongoing work that seeks to increase our understanding of key modeling issues and develop new capabilities for simulating future changes in anthropogenic emissions.
Appendix A describes the meteorological variables to which U.S. air quality is known to be sensitive, e.g., the basis for the anticipated effects of changing climate on future air quality. Appendix A also discusses early research results on the role of climate in future air quality. Appendix B describes the 2006 workshop convened by EPA NCEA to identify the essential issues that must be addressed in identifying and communicating the uncertainties inherent in this assessment, and other complex, model-based assessments. Appendix C describes the 2001 expert workshop convened by EPA NCEA to evaluate the research and assessment framework developed by the EPA Global Change Research Program for identifying and quantifying the effects of global change on U.S. regional air quality. Finally, Appendices D, E, and F expand upon the descriptions provided in the main report of the internal EPA ORD programs contributing the GCRP assessment effort. A glossary has been provided to assist readers who are unfamiliar with the terms that are frequently used in the discussion of climate and air quality research and policy.

2-1
2 OVERVIEW OF APPROACH 2.1 INTRODUCTION
The NRC stated in 2001 that, “improving our understanding of linkages between climate, atmospheric chemistry, and air quality and our ability to assess future states of the atmosphere will require coupling local- and regional-scale air quality models with global-scale climate and chemistry models” (NRC, 2001). The EPA’s Global Change Research Program initiated a research program designed to meet the “grand challenges” introduced in Section 1 that is consistent with EPA’s traditional “place-based” regional assessment approach, and that focuses on spanning the breadth of issues from global-scale drivers of climate and air quality to developing regional-scale inputs for air quality modeling.
In the design of this program, the EPA recognized three key linkages inherent to the global change and air quality issue: those across spatial scales, those across temporal scales, and those across disciplines. The processes linking global to regional scales, symbolized in Figure 2-1, and the requirements for modeling them, were identified as a first step in the assessment design. Similarly, while air quality is defined, studied, and managed most readily on the synoptic timescales associated with meteorological and air quality episodes, global climate change is manifested on timescales of decades and longer, imposing significant research challenges to bridge this gap. Finally, given the inherently multi-disciplinary nature of the problem, it was recognized that merging the efforts of the climate change, air quality, emissions inventory, land use, energy, and transportation economics research communities would be critical to bring about advances required for this assessment. Developing the modeling tools and knowledge base to achieve these linkages is a fundamental task of the assessment.
Figure 2-1. Links between global and regional climate and atmospheric chemistry processes with anthropogenic activities governing air pollution emissions. The dashed arrows represent feedbacks not considered as part of this assessment.
Regional Meteorology
Regional Emissions
Regional Air Quality
Regional Boundary ConditionsMeteorological Chemical
Global Emissions
Global Air Quality
Global Meteorology
Global Change Scenarios (IPCC SRES)
Regional Change Scenarios
•Economic Growth
•Technology
•Population Growth and Migration
•AQ and GHG Policy
Regional MeteorologyRegional
Meteorology
Regional EmissionsRegional Emissions
Regional Air QualityRegional Air Quality
Regional Boundary ConditionsMeteorological Chemical
Regional Boundary ConditionsMeteorological Chemical
Global EmissionsGlobal
Emissions
Global Air Quality
Global Meteorology
Global Air QualityGlobal
Air QualityGlobal
MeteorologyGlobal
Meteorology
Global Change Scenarios (IPCC SRES)
Global Change Scenarios (IPCC SRES)
Regional Change Scenarios
•Economic Growth
•Technology
•Population Growth and Migration
•AQ and GHG Policy

2.1.1 Process for Developing the Global Change-Air Quality Assessment Effort In 1997, the EPA’s Global Program underwent a major redirection, including the
development of a new Strategic Plan in 1999. As part of that effort, the global change-air quality assessment was designed. Specifically, a small workgroup was formed, made up of scientists knowledgeable about various aspects of the issue, including atmospheric and emissions modeling, technology, socioeconomics, climate modeling, and air quality programs. The workgroup included members from all of the Labs and Centers involved in the EPA’s Global Change Research Program, and input from several offices within OAR was also solicited to help guide the effort. An iterative process within the workgroup was used to define the purpose, goals, and issues to be addressed; to identify appropriate EPA participants and stakeholders; and to develop an initial conceptual framework for organizing the assessment effort, leading to a white paper describing the proposed framework and timeline for accomplishing key milestones.
To review this draft framework and help EPA identify priority research needs, a workshop was held in Research Triangle Park, North Carolina in December 2001 that brought together technical experts from ORD and OAR, as well as invited international experts. The goal of the workshop was to identify the important processes and inputs and to discuss the design and implementation of the assessment. Participants included experts in climate modeling, air quality modeling, anthropogenic emissions inventory development, and biogenic emissions inventory development. The workshop agenda included presentations by a panel of experts on regional climate modeling, future emissions inventory development, regional air quality modeling, biogenic emissions and wildfires, and socioeconomic and technological change projection methods. The workshop participants were assembled into four groups to discuss specific issues related to the EPA Global Change Research Program’s objectives: (1) the Regional Climate Modeling Group, (2) the Emission Drivers and Anthropogenic Emissions Group, (3) the Biogenic Emissions and Wildfires Group, and (4) the Air Quality Modeling Group. Each examined charge questions about possible approaches, and each developed recommendations for research required to meet the needs of the assessment. Here, the key recommendations from the workshop that define the approach used in the assessment are summarized (for further details see Appendix C). 2.2 WORKSHOP RECOMMENDATIONS
2.2.1 Modeling The three key conceptual linkages introduced above, i.e., across spatial scales, temporal
scales, and disciplines, are embodied in the foundational technical challenge of the assessment: linking available modeling tools to span the climate, meteorology, air quality, and human dimensions of the problem. As will be described in more detail below, the primary focus of this 2-2

2007 interim report is the potential for future climate change to impact air quality, independent of changes in anthropogenic emissions. The individual research communities use a number of different types of models, described in Box 2-1, to study the various aspects of this sub-problem.
Box 2-1. Climate and Chemistry Modeling Tools General Circulation Model (GCM): Comprehensive model of Earth system, including components that simulate 3-D flow in atmosphere and ocean, exchange of energy and water with land and ocean surface, and growing and melting of ice sheets and sea ice, ultimately in response to amount of solar energy received over time across planet; typically operated with horizontal grid spacing of 100-500 km to examine climate variables at continental to global scales; most often applied in simulations of how long-term climate statistics evolve over years, decades, or centuries in response to past or future changes in outside forcings (e.g., variations in solar input, volcanic aerosols, and changes in anthropogenic greenhouse gas emissions). [Note: The use of “GCM” as an acronym for “Global Climate Model” and “Global Circulation Model” reflects current usage as well.] Global Chemistry and Transport Model (GCTM): Type of model that blends representations of chemical reactions and physical chemical transformations with meteorology supplied either from gridded observational analyses or a GCM simulation; applied to study how transport by winds, deposition onto or emissions from surface, and atmospheric chemistry control long-term distributions of important gases and aerosols within the atmosphere (e.g., O3, carbon monoxide, sulfates, and black carbon, among many others); chemistry/transport can also be built directly into a GCM for similar applications. Regional Climate Model (RCM): Similar to a high-resolution (e.g., 10-50 km) version of a GCM but only applied to limited area of globe (e.g., continental United States); designed to capture more accurately role of fine-scale forcings (e.g., topography, land-surface heterogeneity) and atmospheric processes (e.g., nonlinear dynamics of fronts, development of convective rainfall systems) hard to represent at coarse scales of a GCM; derived primarily from weather prediction models but including some additional features that allow simulations longer than typical several-day timescale of weather forecasts; driven at boundaries by gridded analyses of observational data or output from a GCM to study in greater detail how long-term, large-scale climate variability is expressed in weather events over shorter timescales and in particular locations. Regional Air Quality Model (RAQM): Developed to account for impact of meteorological transport and mixing, atmospheric chemistry, and surface deposition/emission of multiple chemical species, particularly regulated pollutants; most often applied by air quality management community to evaluate impact of control strategies and practices; also frequently used in research mode to develop improved understanding of chemical and physical interactions in atmosphere; typically operated on time and space scales characteristic of air pollution episodes, i.e., a metropolitan area or larger region over period of a few days.
These different modeling tools have historically been developed for distinct purposes.
The assessment design reflects the need for bridging the gaps between these standard applications to move toward more comprehensive, integrated systems capable of addressing the breadth of the problem of potential climate change impacts on air quality.
As such, one core recommendation that emerged from the workshop was to use these tools separately and in combination in multiple modeling approaches to investigate the relevant space and time scales and physical/chemical processes governing the connections between climate and air quality. These approaches are
2-3

• Comprehensive modeling approach: This approach uses linked global and regional climate and chemistry models to simulate fine regional details of present-day and future air quality while simultaneously accounting for global drivers like changes in anthropogenic emissions of greenhouse gases. Output from GCM simulations of long-term climate change is used as input into a higher-resolution RCM, which “downscales” the climate and meteorological variables to the scales required for input into an RAQM. This approach is the most computationally expensive and methodologically complex, with concerns such as the length of simulation required to extract a meaningful climate change signal from interannual climate variability.
• Intermediate modeling approach: This approach relies primarily on GCMs and GCTMs to capture the broader impacts of climate change on air quality. The emphasis in this approach is on the potential for increases or decreases in air pollution events as the climate changes over a long simulation period. The results from such modeling work can be used to guide the comprehensive modeling approach (e.g., by guiding the selection of time periods for the higher-resolution simulations).
• Sensitivity approach: This approach applies detailed, state-of-the-art RAQMs at regional and even urban scales. Rather than a dynamic linkage, air quality simulations are carried out by varying key meteorological and emissions parameters to examine the sensitivity of the air quality outputs over particular, identified meteorological and air quality episodes. The sensitivity approach might permit use of more detailed descriptions of important processes, i.e., aerosol processes.
Initially, the assessment team proposed to move forward primarily with the
Comprehensive approach. The workshop participants endorsed this plan as effective and reasonable, but they also suggested the other two strategies to complement the Comprehensive approach and add richness to the assessment.
Another key model-related discussion was the need to address uncertainty by sampling over multiple GCMs, RCMs, GCTMs, RAQMs, as well as the need to examine sensitivities to model parameterizations and downscaling methodologies. A critical challenge is to quantify the uncertainty produced by the system of linked models required to simulate changes in air quality driven by climate change. It was also acknowledged that an important research gap was the evaluation of the climate models for their ability to simulate air quality-relevant variables and air quality-relevant weather patterns at the appropriate space and time scales.
Finally, the assessment team was urged to consider in more detail the role of hemispheric-scale air pollutant transport and to support the development of appropriate initial and boundary conditions for regional-scale air quality modeling efforts.
2-4

2.2.2 Time Horizon Selected A key consideration is the timeframe for building future scenarios and carrying out future
climate and air quality simulations. It was decided to focus on a time horizon of roughly 2050 in order to balance the following considerations:
Natural meteorological variability versus climate change: Because meteorology varies from year-to-year, the signal from the changing climate needs to be relatively strong to discern climatically driven effects on air quality. In its Third Assessment Report (TAR) (IPCC, 2001), the IPCC projected that global average temperatures could increase from 1.4−5.8ºC (2.5−10.4ºF) by 2100, and that the warming is expected to be larger than the global average for land areas in the mid- and high latitude regions. These findings are consistent with the most updated projections from the IPCC AR4 (IPCC, 2007). This trend is expected to lead to intermediate levels of warming in the intervening decades. For example, the U.S. National Assessment (NAST, 2001) based their findings on average U.S. temperature increases of 0.5−2.0ºF by 2025, 1.5−4.0ºF by 2050, and 3.0−9.0ºF by 2100. Therefore, the longer the timeframe, the stronger the climate change signal captured relative to natural interannual and interdecadal variability.
Uncertainties in GCM climate projections: The IPCC AR4 (IPCC, 2007) documents significantly greater divergence in the climate change projections for 2100 compared to 2050, largely because the various driving greenhouse gas emissions scenarios from the IPCC Special Report on Emissions Scenarios (SRES) (IPCC, 2000) have diverged relatively little by 2050. Even though the climate change signal is stronger in 2100, the spread between model projections created using different scenarios is not as wide. Choosing 2050 thus constrains somewhat one of the potential sources of uncertainty in the assessment.
Uncertainties in the assumptions concerning long-term change in emissions drivers: The uncertainty in projections of economic growth, patterns of land-use and land-cover change, energy use, migration, transportation patterns, and technological development needed to develop projections of anthropogenic emissions increases significantly over longer time horizons. An assessment timeframe of, e.g., 2100, would likely be too speculative for practical application to current air quality management planning.
Current EPA decision processes: In areas such as investment in electricity production, motor vehicle emissions, and power plant and fleet replacement, the EPA already makes air quality management decisions with long lead times of one to several decades. Therefore, a time horizon of the next half-century for assessing the potential consequences of climate change on air quality is consistent with this planning timescale.
2-5

2.2.3 Dual-Phase Assessment Approach It is well recognized that anthropogenic emissions levels are a dominant factor in
determining air quality, as evidenced by the dramatic improvements that took place with the implementation of emissions controls beginning in the mid-20th Century in the United States and other developed countries. Understanding how changes in air quality due to changing climate might confound long-term management of these emissions for NAAQS attainment and maintenance is a critical assessment goal. To more readily achieve this understanding, a second core recommendation from the workshop was to investigate possible regional air quality responses to future climate and meteorological changes alone, before tackling the additional complexities of accounting for changes in other aspects of the system, such as anthropogenic emissions and long-range pollutant transport.
The assessment research program was, therefore, designed in two phases. Phase I focuses on developing tools, capabilities, and a knowledge base, and then applying these in research to address the impacts of climate change on air quality with anthropogenic emissions held constant between present and future. Phase II builds on the insights from Phase I, by extending the capabilities of the modeling systems developed therein (e.g., to more comprehensively explore uncertainties, encompass additional pollutants, and investigate climate and air quality feedbacks) and by adding the effects of changing patterns of anthropogenic emissions (e.g., due to population, land-use, and energy and transportation technologies changes). In this second phase, emissions will be projected into the future, accounting for factors such as differential population growth and migration, economic growth, and technology change.
As described in Section 1.4.2, the major focus of this interim assessment report is the progress to date under Phase I, presented in Section 3. The Phase II work will be the subject of follow-on reports. A summary of research efforts already ongoing to support Phase II is provided in Section 4.
One of the key challenges in executing the comprehensive approach described in Section 2.2.1 lies as much with maintaining logical consistency in linking the many models as with the technical difficulties of simulating changes to 2050. The O3 simulations in Phase I, reflecting the climate in 2050, have been accomplished while holding air pollution emissions constant at present-day levels. In the strictest sense, this therefore introduces an internal inconsistency, i.e., between emissions of greenhouse gases and those of conventional air pollutants, which in reality are coupled. The model results from this first phase serve as sensitivity tests—to determine the potential effect on climate-induced meteorological changes on air quality and to better understand the characteristics of the linked modeling systems—and cannot be construed in any way as future predictions.
2-6

2.2.4 Research Priorities to Support Phase II Finally, we briefly summarize some key workshop recommendations on additional
research needed to support Phase II of the assessment. Processes governing biogenic emissions: Algorithms will have to be developed that
describe chemical emissions of major vegetative species response to climate change for use in current and biogenic emission forecasting. Projections of land-use changes will have to be integrated with forest physiological models to project current and future biogenic VOC emissions.
Wildfires: There is a need to develop methods to define fire emissions as a function of fire intensity, extent, and frequency. Simultaneously, there is a need to develop methods to relate fire intensity, extent, and frequency to current and future land use, land management, fuel loading, socioeconomic conditions, and climate.
Anthropogenic emissions projections: Plausible scenarios for future emissions need to be developed that account for changes in urbanization, population growth, migration, industrialization, fuel, technology, etc. Also needed is normalization of procedures for emissions calculations across regions and countries and reconciliation between global and regional emission inventories. Principles of downscaling socioeconomic scenarios to more detailed geographic scales must be applied. There is also a need to incorporate feedbacks of climate change on energy use, economic development, land use, and migration.
Air quality modeling: Improvements in our ability to model the chemistry of air pollution in a number of areas will be required to more accurately simulate the influence of climate change on air quality. These areas include representations of aerosol physical and chemical processes, two-way linkages between climate/meteorology models and air quality models, the availability of suitable initial and boundary conditions for all important chemical species, and stratosphere-troposphere exchange. 2.3 RESEARCH PARTNERSHIPS
To implement the workshop recommendations and achieve the goals of the assessment, the EPA’s Global Change Research Program designed a joint intramural and extramural research program. The goal is to harness the unique capabilities of the EPA research laboratories and the academic community to build a broad program.
Within the EPA’s intramural effort, the National Exposure Research Laboratory (NERL) is the primary developer of the Community Multiscale Air Quality (CMAQ) model that predicts air quality pollutant transport and fate (Byun and Schere, 2006). CMAQ, which, as of December 2006, has undergone three external peer reviews, is being used by the Office of Air Quality Planning and Standards (OAQPS) within OAR for current rulemakings, as well as by the
2-7

research community for a range of research applications including climate and air quality interactions. Via a partnership between EPA and NOAA, a team at NERL is charged under this assessment with leading the development of a series of regional-scale air quality simulations using CMAQ under current and future climate scenarios. This effort, the Climate Impacts on Regional Air Quality (CIRAQ) project, was initiated in 2002 following the above-mentioned workshop. This team provides the air quality modeling expertise to develop these simulations, to interpret the sensitivity of air quality to the future climate changes simulated, and to consider regulatory implications of potential changes in air quality.
In addition, NERL researchers are key contributors to the development of models of environmentally influenced emissions from the air-surface interface for regional and global emissions inventories and application to air quality modeling, such as biogenic emissions (the Biogenic Emission Inventory System; BEIS) and wildfire emissions (based on the Blue Sky wildfire model). NERL was also the primary ORD collaborator in the development of the Sparse Matrix Operator Kernel Emission (SMOKE) modeling system. SMOKE assembles input data from anthropogenic emission inventories, and biogenic, mobile, and wildfire emission models into the hourly, gridded, speciated form required by air quality models such as CMAQ. These emissions models are needed for both retrospective and future air quality modeling scenarios. More information on aspects of the NERL effort is contained in Appendix E.
Simultaneously, researchers in the National Risk Management Research Laboratory (NRMRL) are focused on evaluating the potential impact of technological evolution on future-year air pollutant emissions, in coordination with the NERL efforts. This process involves characterizing future energy demands and technologies, and using this information within energy system models to estimate emissions over a wide range of alternative scenarios. In addition, NRMRL researchers have developed a suite of analytical and visualization tools for examining the flexibility available in meeting future emission targets and for evaluating sensitivity to uncertainties in model parameters and inputs. NRMRL is applying these methods and tools to examine the system-wide implications on fuel use and emissions of the penetration of new transportation and electric generation technologies. This work directly addresses the need, identified in the 2001 workshop, to develop realistic future emissions scenarios that are regionally plausible and also consistent with assumptions about global trends. Together, NERL and NRMRL have the expertise required to contribute crucially to both Phase I and Phase II of the overall assessment. For additional information, see Appendix F and Section 4.
The assessment effort benefits substantially from a strong collaboration with the extramural research community. The EPA’s National Center for Environmental Research (NCER), through its competitive Science To Achieve Results (STAR) grants program, funded a
2-8
2-9
number of leading university research groups through the following Requests for Applications (RFAs):
• 2000: Assessing the Consequences of Interactions between Human Activities and a
Changing Climate
• 2002: Assessing the Consequences of Global Change for Air Quality: Sensitivity of U.S. air quality to climate change and future global impacts
• 2003: Consequences of Global Change for Air Quality: Spatial Patterns in Air Pollution Emissions
• 2004: Regional Development, Population Trend, and Technology Change Impacts on Future Air Pollution Emissions
• 2005: Fire, Climate and Air Quality
• 2006: Consequences of Global Change for Air Quality
These RFAs, most of which derive from the recommendations of the 2001 workshop,
encompass roughly 25 projects, totaling over $20 million, covering topics including projection of population, development, and transportation trends; observations of biosphere-air quality interactions; coupled climate and air quality modeling; and human health effects. Many of the current projects involve collaboration across disciplines to link models. All of this is emblematic both of the breadth of the issue and EPA’s commitment to build and populate a comprehensive framework to address it. Further details are provided in Appendix D.
Finally, the National Center for Environmental Assessment (NCEA) has unique expertise in preparing the air quality criteria documents upon which the NAAQS are based, conducting environmental assessments, and performing synthetic analyses of the type presented in Section 3. NCEA’s global change assessment team has the primary responsibility for developing the reports synthesizing the results of the broad inter-laboratory and extramural research effort represented in this assessment.

3 RESULTS AND SYNTHESIS 3.1 INTRODUCTION
The goal of this section is to synthesize the EPA, and EPA-funded, climate and air quality modeling research that has emerged in Phase I of the assessment. The material presented here is intended to map onto each of the two intertwining readings introduced in Section 1, i.e., “science” and “policy,” that run through the report and reflect the two “grand challenges” of evaluating the state of the science and providing a foundation on which effective decision support can be built.
Section 3.2 provides brief summaries of activities and key findings to date from each of the participating modeling groups. Section 3.3 attempts to assess the larger meaning of the groups’ results when they are examined all together, focusing on inter-group comparisons of the simulation outputs that are largely common to all (or most)—it provides a preliminary synthesis by taking a broad view across this subset of assessment results. Section 3.4 discusses the challenges and uncertainties associated with the modeling approach that underpins the assessment.
As the EPA’s assessment activities continue, overall understanding will grow richer and techniques will become more refined. Thus, it will be possible to build on the foundation provided by this first attempt to interpret this evolving body of work. 3.2 SUMMARY OF RESULTS FROM INDIVIDUAL GROUPS
Results discussed throughout the rest of this section are drawn from the intramural, EPA work, as well as from several STAR-funded extramural initiatives. More detailed descriptions of the experimental designs and results of the extramural (Appendix D) and intramural (Appendix E) efforts are given in the appendices to this report.
The projects highlighted here largely share similar fundamental goals and approaches and can be divided into two major groups: (1) those that, to date, have primarily used global climate and chemistry models to focus on the large-scale changes in future U.S. air quality,9 and (2) those that have used nested, high-resolution, global-to-regional modeling systems to focus on the regional details of the potential future changes.10 All of these projects adapt existing modeling tools (as described in Section 2) as components for assembling their systems, including GCTMs,
9 The Harvard University and Carnegie Mellon University teams. 10 The EPA National Exposure Research Laboratory (NERL), Columbia University, University of Illinois,
Washington State University, University of California, Berkeley, and Georgia Institute of Technology (GIT)-Northeast States for Coordinated Air Use Management (NESCAUM)-Massachusetts Institute of Technology (MIT) teams.
3-1

GCMs, RCMs, and RAQMs, along with emissions models and a number of boundary and initial conditions datasets. They all apply these modeling systems in numerical experiments designed broadly to investigate the impacts of future global climate change on U.S. air quality for present-day and future time periods.
It is important to consider both the global model simulations and the downscaled regional simulations together, because each method has its strengths and weaknesses. The global models simulate the whole world in an internally self-consistent way across both climate and chemistry, but because of computational demand must use coarse spatial resolution, thereby potentially missing or misrepresenting key processes. Dynamical downscaling with an RCM dramatically increases the resolution and process realism for the region of interest, but at the expense of introducing lateral boundary conditions into the simulation. Section 3.4 provides additional discussion of these relative advantages and trade-offs. Examining both sets of results gives us a more complete picture of the overall climate-air quality system.
In addition to any similarities in approach, however, each project brings unique and complementary differences in emphasis to these tasks. In aggregate, these differences add greatly to the richness of the overall assessment. Below are brief summaries of selected key themes and findings from each of these research efforts as a prelude to the more focused inter-group comparisons of Section 3.3. 3.2.1 GCTM-Focused Modeling Work
3.2.1.1 Application of a Unified Aerosol-Chemistry-Climate GCM to Understand the Effects of Changing Climate and Global Anthropogenic Emissions on U.S. Air Quality: Harvard University
In early work for this project, the Harvard research group examined the role of potential changes in atmospheric circulation by carrying out GCM simulations, using the Goddard Institute for Space Studies (GISS) GCM version II′, for the period 1950−2052, with tracers representing carbon monoxide (CO) and black carbon (BC) (Mickley et al., 2004). They based the concentrations of greenhouse gases for the historical past on observations, while future greenhouse gases followed the A1b IPCC SRES scenario. A key result from these simulations is a future 10% decrease in the frequency of summertime mid-latitude surface cyclones moving across southeastern Canada and a 20% decrease in cold surges from Canada into the Midwest. Since these events typically clear air pollution in the Midwest and Northeast, pollution episodes in these regions increase in duration (by 1−2 days) and intensity (by 5−10% in pollutant concentration) in the future. These simulated future circulation changes are consistent with findings from some other groups in the broader climate modeling community, and the Harvard model also successfully reproduces the observed 40% decrease in North American cyclones from
3-2

1950−2000. These results are supported, and expanded upon, by more recent work from this group, e.g., see Leibensperger et al. (2008), who found that the frequency of mid-latitudes cyclones tracking across eastern North America in the southern climatological storm track was a strong predictor of the frequency of summertime pollution episodes in the eastern United States for the period 1980−2006. In addition, they found a decreasing trend over this period in the number of cyclones in this storm track that they attributed to greenhouse warming, consistent with a number of other observational and modeling studies. However, as will be discussed in more detail below, other groups, including those participating in this assessment, do not necessarily find the same decrease in future mid-latitude cyclones when analyzing similar GCM outputs, or even the same GCM outputs downscaled using an RCM (e.g., see Leung and Gustafson, 2005).
Subsequent to the initial modeling effort described in Mickley et al. (2004), the Harvard group applied the GEOS-Chem GCTM, driven by the GISS III GCM (Wu et al., 2007), to the direct simulation of 2050s O3 air quality over the United States (Wu et al., 2008a) and global tropospheric O3 and the policy-relevant background O3 over the United States (Wu et al., 2008b). For one set of simulations with this modeling system designed to isolate the impacts of climate change alone on air quality, anthropogenic emissions of precursor pollutants were held constant at present-day levels, while climate changed in response to greenhouse gas increases under the IPCC A1b scenario (Wu et al., 2008a). Climate-sensitive natural emissions, e.g., of biogenic VOCs, were allowed to vary in response to the change in climate. In these simulations, they found that at global scales, future O3 averaged throughout the depth of the troposphere increases, primarily due to increases in lightning (leading to additional NOx production), but near the surface increases in water vapor generally caused O3 decreases, except over polluted continental regions. Focusing in more detail on the United States, they found that the response of O3 to climate change varies by region. Their results show increases in mean summertime O3 concentrations of 2−5 ppb in the Northeast and Midwest, with little change in the Southeast. The Harvard group also found that peak O3 pollution episodes are far more affected by climate change than mean values, with effects exceeding 10 ppb in the Midwest and Northeast.
In contrast to this regional pattern of future U.S. O3 change, the Carnegie Mellon work (described next) found a relatively smaller response in the Northeast and Midwest but a strong increase in the Southeast, using some similar models and assumptions as the Harvard project (although with a different IPCC greenhouse gas scenario and some key differences in the ocean surface boundary condition). As will be discussed in greater detail below, the explanations for these differences appear to reside in (1) differences in how the chemical mechanisms regulating the reactions and transformation of biogenic VOC emissions are represented in the two modeling systems and (2) possible differences in future simulated mid-latitude storm track changes.
3-3

In addition to these findings, this group used historically measured relationships between temperature and the probability of O3 concentrations above the air quality standard (e.g., see Lin et al., 2001), together with statistically downscaled climate projections for the Northeast United States from an ensemble of IPCC AR4 GCMs and scenarios, to project future O3 exceedances in the region (Lin et al., 2007). They found a doubling of the frequency of exceedances in the climate of the 2050s if anthropogenic emissions were to remain constant. As will be discussed further below, statistical relationships between observed O3 and temperature reflect both the direct impact of temperature on O3 chemistry and the often strong correlation between temperature and other factors conducive to high O3 concentrations, such as clear skies, stagnant air, and increased biogenic emissions. As such, they tend to be regionally and seasonally dependent. Work exploring the use of these types of statistical approaches to project O3 NAAQS exceedances (and PM concentrations) is ongoing.
As a final part of this project, the Harvard group has developed, and is in the process of testing, a linked global-to-regional system of models (including a GCM, GCTM, RCM, and RAQM). This system will be applied to investigations of the effects of climate change, as well as future changes in pollutant emissions and long-range transport, on regional-scale O3 and PM concentrations and mercury (Hg) deposition.
Additional information on the Harvard research effort can be found in Appendix D and at • http://cfpub.epa.gov/ncer_abstracts/index.cfm/fuseaction/display.abstractDetail/abstract/6
157/report/0
• http://www.as.harvard.edu/chemistry/trop/gcap/
3.2.1.2 Impacts of Climate Change and Global Emissions on U.S. Air Quality:
Development of an Integrated Modeling Framework and Sensitivity Assessment: Carnegie Mellon University
The Carnegie Mellon group performed global-scale simulations of atmospheric chemistry under present and future (2050s) climate conditions using a “unified model,” i.e., the GISS II′ model modified to incorporate tropospheric gas phase chemistry and aerosols. Ten years of both present and future climate were simulated, following the A2 IPCC greenhouse gas emissions scenario, with anthropogenic air pollution emissions held at present-day levels to isolate the effects of climate change. As in the Harvard project described above, the effects of changes in certain climate-sensitive natural emissions were also included as part of the “climate” changes simulated.
They found that a majority of the atmosphere near the Earth’s surface experiences a decrease in average O3 concentrations under future climate with air pollution emissions held constant, mainly due to the increase in humidity, which lowers O3 lifetimes (Racherla and
3-4

Adams, 2006). Further analysis of these results on a seasonal and regional basis found that, while global near-surface O3 decreases, a more complex response occurs in polluted regions. Specifically, summertime O3 increases over Europe and North America, with larger increases for the latter. A second key finding is that the frequency of extreme O3 events increases in the simulated future climate: over the eastern half of the United States, where the largest simulated future O3 changes occurred, the greatest increases were at the high end of the O3 distribution, and there was increased episode frequency that was statistically significant with respect to interannual variability (Racherla and Adams, 2008). They further suggested that it is necessary to simulate a minimum of five present-day and future years to separate a climate change response from this interannual variability. These general results are broadly consistent with the Harvard experiments described above. However, as also mentioned, there are important regional differences in response between the two groups. These can largely be attributed to differences in the modeled chemical mechanism for isoprene oxidation in the southeastern United States, as well as possibly differences in the future simulation of the summertime storm track across the northern part of the country. These issues will be discussed in more detail in the synthesis to follow these summaries.
The Carnegie Mellon team is also pursuing two complementary approaches in conjunction with their global modeling efforts. First, they are investigating the sensitivity of O3, PM, acid deposition, and visibility to individual meteorological parameters by performing a set of sensitivity experiments using the PM Comprehensive Air Quality Model with Extensions (PMCAMx) (e.g., see Dawson et al., 2007a, b). One key finding from this work is that O3 concentrations increased nearly linearly with temperature in the study region/period, and that a 2.5ºC increase in temperature led to a 30% increase in the area exceeding the EPA 8-hour standard. Second, they have now developed and tested a global-to-regional modeling system to carry out higher-resolution investigations of the impacts of climate and anthropogenic emissions changes on air quality (Dawson et al., 2008).
Additional information on this research effort can be found in Appendix D and at • http://cfpub.epa.gov/ncer_abstracts/index.cfm/fuseaction/display.abstractDetail/abstract/6
240/report/0
• http://www.ce.cmu.edu/~adams/index.html
• http://www.cheme.cmu.edu/who/faculty/pandis.html
3-5

3.2.2 Linked Global-Regional-Focused Modeling Work
3.2.2.1 The Climate Impacts on Regional Air Quality (CIRAQ) Project: EPA In addition to the extramural projects described in this section, an intramural modeling
study, the CIRAQ project, is being conducted at EPA NERL, as introduced in Section 2. Under this project, the NERL team built a coupled global-to-regional climate and chemistry modeling system covering the continental United States. They used the output from a global climate simulation with the GISS II′ model (including a tropospheric O3 chemistry model) for 1950−2055, following the A1b IPCC SRES greenhouse gas emissions scenario for the future simulation years (i.e., the same simulation described in Mickley et al., 2004) as climate and chemical boundary conditions for the regional climate and air quality simulations. The Penn State/NCAR Mesoscale Model Version 5 (MM5) was used at DOE’s Pacific Northwest National Laboratory (PNNL) to create downscaled fields from this GCM simulation for the periods 1996−2005 and 2045−2055 (Leung and Gustafson, 2005). The NERL group used this regionally downscaled meteorology to simulate air quality for 5-year-long subsets of these present and future time periods with the CMAQ model. Multiple years were simulated, in spite of the considerable computational expense, to examine the role of interannual variability in the results.
A key element of this project was extensive evaluations of the simulated meteorological variables, not just for long-term climate statistics (e.g., monthly and seasonal means), but of synoptic-scale patterns that can be linked more directly to air quality episodes (Cooter et al., 2005; Gilliam et al., 2006; Gustafson and Leung, 2007). One important finding was that the subtropical Bermuda High pressure system off the southeastern United States coast, a critical component of eastern United States warm season weather patterns, was not well simulated in the downscaled model runs, a result that is likely attributable to biases in the GCM, as will be discussed further below. Another key finding was that, as mentioned above in the summary of the Harvard project, the reduction in cyclones tracking across the northern United States found in Mickley et al. (2004) was not as clearly present when this global model output was downscaled using MM5 (Leung and Gustafson, 2005).
The NERL team also evaluated the CMAQ results against historical O3 observations, finding high biases in summertime O3 related to the choice of chemical mechanism in CMAQ between the Carbon Bond-IV (CB-IV) vs. the Statewide Air Pollution Research Center (SAPRC) representations. In addition, they found O3 biases related to biases in MM5-downscaled meteorology. For example, the model under-predicted precipitation and over-predicted temperature in the areas of the Midwest and Southeast where O3 was most over predicted, highlighting the strong control that meteorology can exert on O3.
In a set of future simulations with this global-to-regional climate and air quality modeling system, for which anthropogenic emissions of precursor pollutants were held constant while
3-6

climate changed, the NERL group found increases in future summertime maximum daily 8-hour (MDA8) O3 concentrations of roughly 2−5 ppb in some areas (e.g., Northeast, Mid-Atlantic, and Gulf Coast) compared to the present-day, though with strong regional variability and even decreases in some regions (Nolte et al., 2008). This regional variability in future O3 concentration changes was associated primarily with changes in temperature, the amount of solar radiation reaching the surface, and, to a lesser extent, climate-induced changes in biogenic emissions. The increases in peak O3 concentrations tended to be greater and cover larger areas than those in mean MDA8 O3. These results will be discussed in more detail in the synthesis below. The NERL team also found significant O3 increases in September and October over large portions of the country, suggesting a possible extension of the O3 season into the fall in the future.
Additional information on the NERL effort can be found in Appendix E and at http://www.epa.gov/asmdnerl/Climate/index.html. 3.2.2.2 Modeling Heat and Air Quality Impacts of Changing Urban Land Uses and
Climate: Columbia University The Columbia group built a linked air quality modeling system based on the GISS
Atmosphere-Ocean (AO) GCM (Russell et al., 1995) and the MM5 RCM and carried out simulations using two SRES greenhouse gas scenarios (A2 and B2) for 5 summers each during the 1990s, 2020s, 2050s, and 2080s, focusing on the eastern half of the continental United States. Additional simulations using higher resolution were carried out for the New York City metro area for particular meteorological/air quality episodes. One important feature of the Columbia effort is that the team carried the air quality modeling results through to an assessment of human health endpoints.
A key aspect of the Columbia team’s work was the evaluation of the performance of this coupled modeling system. They found that (1) dynamical downscaling with MM5 reduces biases present in the GCM simulation, most strongly for temperature and less so for precipitation and (2) there is a strong sensitivity of climate to the choice of RCM parameterizations, e.g., the cumulus convection scheme (e.g., see Lynn et al., 2004). In addition, the downscaled results were often quite different from those of the driving GCM, including, for example, warmer summers. For O3, they found that their modeling system was able to simulate synoptic and interannual variability reasonably well, including the frequency and duration of extreme O3 events, but underestimated variability on shorter time scales (Hogrefe et al., 2004a).
In future climate change simulations (with anthropogenic emissions of air pollutants held constant at present-day levels), the Columbia group found summertime O3 increases of 2−8 ppb across broad swathes of the Midwest and Mid-Atlantic (Hogrefe et al., 2004b). Significant
3-7

effects were already seen by the 2020s, with greater increases by the 2050s and 2080s. One exception was certain geographic areas that experienced increases in mixed layer depths and convective activity in the 2080s, changes that actually ended up decreasing O3, illustrating the complexity of the climate-meteorology-O3 relationship. In general, the spatial correlation of O3 increases with any one meteorological variable was not particularly strong in their results. Again the largest future increases in O3 were for the highest-concentration O3 episodes, leading to large increases in hypothetical exceedances concentrated in the Ohio Valley and the Mid-Atlantic coast. They also found an increase in the duration of high-O3 events. The effect of climate change in 50 eastern U.S. cities, without considering future changes in air pollution emissions, was to increase the number of days exceeding the 8-hour O3 standard by 68% (Bell et al., 2007).
These model results also showed future increases in biogenic VOC emissions in most places as a result of climate change, with the largest absolute increases in the southern and southeastern parts of the United States. While biogenic emissions changes were responsible for up to half of the total climate effect on O3 concentrations in some parts of the Ohio Valley and Mid-Atlantic further to the north, they did not produce significant O3 changes in these more southern areas that experienced the largest changes in these emissions. The impact of how biogenic emissions chemistry is represented in air quality modeling systems on simulated O3 is discussed in more detail in the synthesis below.
Finally, an analysis of the effects of land-use change on O3 (and heat waves) in the smaller New York City metro region suggests that such changes could also have local impacts of comparable magnitude to the climatic, emissions, and boundary conditions factors considered (Civerolo et al., 2007).
For more information on the Columbia team’s efforts, see Appendix D and • http://cfpub.epa.gov/ncer_abstracts/index.cfm/fuseaction/display.abstractDetail/abstract/8
12/report/0
• http://www.mailman.hs.columbia.edu/ehs/research.html
• http://www.geography.hunter.cuny.edu/luca/
• http://www.cmascenter.org/2003_workshop/session2/hogrefe_abstract.pdf
3.2.2.3 Impacts of Global Climate and Emission Changes on U.S. Air Quality: University
of Illinois The University of Illinois group focused on exploring and evaluating, as comprehensively
as possible, the capabilities and sensitivities of the tools and techniques underlying the full, global-to-regional model-based approach to the problem. They concentrated on building a system that accounts for global chemistry and climate, and regional meteorology and air quality, capable of simulating effects of climate changes, emissions changes, and long-range transport
3-8

changes on regional air quality for the continental United States (Huang et al., 2007; 2008). To capture a wider range of sensitivities, they built different versions of this system, which combines multiple GCMs (PCM and the Hadley Centre Model, HadCM3), SRES scenarios (A1Fi, A2, B1, B2), and convective parameterizations (the Grell and Kain-Fritsch schemes) with the Model for OZone And Related chemical Tracers (MOZART) GCTM, a modified version of the MM5 RCM (referred to as CMM5), and the SARMAP11 Air Quality Model (SAQM). They also made considerable efforts to evaluate both climate and air quality variables with respect to historical observations and to understand the implications of these evaluations for simulations of future changes.
Several important findings emerge from this group’s model evaluation efforts. First, they demonstrated that any individual GCM will likely have significant biases in temperature, precipitation, and circulation patterns, as a result of both parameterizations and internal model variability, so multi-model ensemble means will tend to be more accurate than individual models (Kunkel and Liang, 2005). With proper attention, RCM downscaling can improve on these GCM biases in climate variables over different temporal scales (e.g., diurnal, seasonal, interannual), due to higher resolution and more comprehensive physics, and that furthermore the RCM can produce future simulations of temperature and precipitation patterns that differ significantly from those of the driving GCM (e.g., Liang et al., 2006). They found that the improvements in present-day climate generally led directly to improvements in simulated air quality endpoints, though they also found that the performance of their modeling system tended to be better for monthly and seasonal average O3 concentrations than for multi-day high-O3 episodes, reflecting the primary use for which the driving climate models have been designed (Huang et al., 2007). In addition, they found a high sensitivity of downscaled climate (and downscaling skill) to the convective scheme chosen, with different parameterizations working better in different regions/regimes (Liang et al., 2007). This sensitivity strongly affects simulated air quality, for example by altering meteorology and hence also biogenic emissions (Tao et al., 2008). All of these findings are consistent with, and expand considerably upon, the results from the Columbia project described above.
Notably, the Illinois team also found that the different patterns of GCM biases with respect to present-day observations in different simulations, as well as the way the RCM downscaling altered these biases, were consistently reflected in the future GCM and GCM-RCM differences as well. This suggests a strong link between the ability of a GCM or GCM-RCM downscaling system to accurately reproduce present-day climate and the type of future climate it simulates (Liang et al., 2008).
11 SARMAP stands for the San Joaquin Valley Air Quality Study (SJVAQS)/Atmospheric Utility Signatures, Predictions, and Experiments (AUSPEX) Regional Model Adaptation Project.
3-9

In future simulations with their coupled global-to-regional modeling system completed to date, based on PCM GCM simulations following both the A1Fi and B1 SRES greenhouse gas scenarios, the Illinois group found changes in O3 due to climate change alone (i.e., with anthropogenic pollutant emissions held constant at present-day levels) that were of comparable magnitude to those seen by the NERL and Columbia groups, though with differences in regional spatial patterns (Tao et al., 2007). These similarities and differences will be described in greater detail in the synthesis below. The larger greenhouse gas concentrations, and hence greater simulated climate change, associated with the A1Fi scenario generally resulted in larger future O3 increases than for the climate change simulation driven by the B1 scenario.
For more information on the Illinois group’s efforts, see Appendix D and • http://cfpub.epa.gov/ncer_abstracts/index.cfm/fuseaction/display.abstractDetail/abstract/6
160/report/0
• http://www.sws.uiuc.edu/atmos/modeling/caqims/
3.2.2.4 Impact of Climate Change on U.S. Air Quality Using Multi-Scale Modeling with
the MM5/SMOKE/CMAQ System: Washington State University Similar to the NERL, Columbia, and Illinois groups, the Washington State team
developed a combined global and regional climate and air quality modeling system to investigate changes in O3 (and PM) (Chen et al., 2009; Avise et al., 2009). They used the PCM, MM5, and CMAQ models, and they focused on the IPCC A2 scenario for future greenhouse gases. With this system, the Washington State group investigated climate and air quality changes for the continental United States as a whole, and in addition focused in more detail on two specific regions: the Pacific Northwest and the northern Midwest. A key distinguishing feature of their effort is the attention to biogenic emissions and the consideration of land cover changes (both vegetation cover and urban distributions), as well as changes in the frequency of wildfires in their simulations. Evaluations of their coupled system against observations indicated reasonable agreement with observed climatology and O3 concentrations in their two focus regions. They also examined wet and dry deposition rates and found qualitatively similar results between modeled and measured rates in the Pacific Northwest.
In five years of simulated summertime O3 under both present-day and future climate conditions (with constant anthropogenic precursor pollutants), the Washington State group found future O3 increases in certain regions, most notably in the Northeast and Southwest, with smaller increases or slight decreases in other regions (Avise et al., 2009). These climate change effects were most pronounced when considering the extreme high end of the O3 concentration distribution. The magnitude of the O3 increases found by the Washington State group (i.e., a few to several ppb) were roughly comparable to those found by the other regional modeling groups
3-10

already discussed, though again with differences in the specific regional spatial patterns of the future changes, linked to differences in the spatial patterns of key O3 drivers, discussed in more detail in the synthesis below.
In addition, by accounting for plausible future changes in land-use distribution, they simulated both net decreases and increases in biogenic emission capacity, depending on region: i.e., they found that reductions in forested area in the Southeast and West due to increases in development more than offset potential increased biogenic emissions due to climate change, leading to reduction in MDA8 O3 levels, while enhanced use of poplar plantations for carbon sequestration significantly increased isoprene emissions in the Midwest and eastern United States, leading to O3 increases. Finally, they found that warmer and drier conditions in their future simulations yielded increased occurrences of fire in the western states.
Additional information on this group’s effort can be found in Appendix D and at • http://cfpub.epa.gov/ncer_abstracts/index.cfm/fuseaction/display.abstractDetail/abstract/6
229
• http://www.nwairquest.wsu.edu
3.2.2.5 Guiding Future Air Quality Management in California: Sensitivity to Changing
Climate—University of California, Berkeley Distinct from that of the other groups described above, the Berkeley group’s research
focused in detail on central California, using a combination of model and observation-based analyses to determine the effects on air quality of changes in temperature, humidity, atmospheric mixing, and biogenic and anthropogenic emissions changes.
Specifically, the Berkeley group used CMAQ at very high resolution (4 km horizontal grid spacing), driven by MM5, to investigate the effects of perturbations in these drivers on O3 concentrations during a 5-day O3 episode in the state (Steiner et al., 2006). They derived plausible, spatially resolved future changes in summertime temperatures from two simulations with the Community Climate Model version 3 (CCM3) GCM downscaled to a 40 km grid spacing for the western United States: one with a “pre-industrial” CO2 concentration of 280 parts per million (ppm) and one representing a hypothetical 2050 climate with a doubled CO2 concentration of 560 ppm (Snyder et al., 2002). The average August temperature difference between these two downscaled simulations at each point in the domain was added to the MM5 meteorological output used to drive CMAQ. This temperature perturbation was applied in an uncoupled manner so as not to affect other meteorological quantities such as wind speed and boundary layer height, to isolate the impact of temperature changes on chemical reaction kinetics. This imposed temperature increase was also used to derive perturbations of humidity and biogenic VOC emissions for additional, separate sensitivity experiments. In addition to
3-11

these climate-based changes, the Berkeley group carried out simulations to investigate the sensitivity of O3 to changes in anthropogenic NOx and VOC emissions, as well as to the inflow of pollutants from outside the state.
They found that higher temperatures increased O3 concentrations in this simulated pollution episode both directly (through increased reaction rates) and indirectly (through increases in biogenic emissions). Across all the different effects explored, they found that O3 sensitivity varied depending on proximity to the Pacific Coast (e.g., where impacts of increased pollution at the inflow boundary are greatest), and on preexisting NOx or VOC levels (e.g., NOx-saturated regions in central California appear to be most sensitive to climate-related changes).
The Berkeley team also conducted an observationally based study of the temperature sensitivity of anthropogenic VOC emissions: the role of temperature in increasing fuel evaporation was highlighted in this analysis (Rubin et al., 2006). Increased evaporation was apparent in observed correlations between speciated VOCs and temperatures as they varied by time of day and from day to day, with implications for the climate sensitivity of these emissions.
Additional information about the Berkeley project can be found in Appendix D and at http://cfpub.epa.gov/ncer_abstracts/index.cfm/fuseaction/display.abstractDetail/abstract/6231/report/0. 3.2.2.6 Sensitivity and Uncertainty Assessment of Global Climate Change Impacts on
Ozone and Particulate Matter: Examination of Direct and Indirect, Emission-Induced Effects: GIT-NESCAUM-MIT
Similar to the NERL, Columbia, Washington State, and Illinois groups discussed above, the GIT-NESCAUM-MIT group constructed a linked global-to-regional climate and air quality modeling system to investigate the impacts of global change on regional U.S. O3 and PM concentrations (Tagaris et al., 2007; Liao et al., 2007). Specifically, they used CMAQ, driven by present-day and future climate simulations with the GISS II′ GCM downscaled using MM5 (the same MM5-downscaled GISS II′ GCM simulations developed for the NERL project described above). However, compared to these other groups, they had a unique focus on understanding the climate sensitivity of regional air quality in the context of expected future pollutant emissions under the implementation of current and future control strategies. This effort not only investigated O3, but also PM and its speciated components of sulfates, nitrates, ammonium, and organics, in detail. A strong, built-in link between the academic and regional air quality management communities is achieved via the inclusion of NESCAUM in the partnership.
Their work to date attempts to determine if climate change will have significant impacts on the efficacy of O3 and PM emissions control strategies currently being considered in the
3-12

United States by focusing on (1) comparing the sensitivity of future regional U.S. air quality to changes in emissions around present-day and projected future climate and emissions baselines and (2) accounting for the effects of uncertainties in future climate on simulated future air quality to evaluate the robustness of these results (see Liao et al., 2009).
To address these issues, the GIT-NESCAUM-MIT team developed a detailed, spatially resolved U.S. future air pollutant emissions inventory to understand the relative impacts of climate change on future air quality in different emissions and control strategy regimes. To accomplish this, they used the latest projection data available for the near future (to about 2020), such as the EPA CAIR Inventory, and they extended point source emissions to 2050 using the IMAGE12 model combined with the IPCC A1b emissions scenario (the same scenario used in the GISS II′ future climate simulations) and mobile source emissions from Mobile Source Emission Factor Model version 6 (MOBILE6), projecting reductions of more than 50% in NOx and SO2 emissions (Woo et al., 2007).
A key finding from the GIT-NESCAUM-MIT work is that, overall, existing control strategies should continue to be effective in an altered future climate, though with regional variations in relative benefit (Tagaris et al., 2007). The magnitude of the “climate change penalty” for controlling O3 (as defined by the Harvard group) is found to be consistent with the work of Wu et al. (2008a). The spatial distribution and annual variation in the contribution of precursors to O3 and PM formation under the combined future scenario of climate change and emission controls remain similar to the baseline case, implying the continued effectiveness of current control strategies. The findings further suggest, however, that compliance with air quality standards in areas at or near the NAAQS in the future would be sensitive to the amount of future climate change. Finally, an analysis of potential health impacts of these simulated future air quality changes, using the environmental Benefits Mapping and Analysis Program (BenMAP),13 is ongoing.
Additional information on the GIT-NESCAUM-MIT project can be found in Appendix D and at
• http://cfpub.epa.gov/ncer_abstracts/index.cfm/fuseaction/display.abstractDetail/abstract/6238/report/0
• http://www.ce.gatech.edu/~trussell/lamda/
3.3 SYNTHESIS OF RESULTS ACROSS GROUPS
This sub-section synthesizes findings across the global and regional modeling results from the groups that have just been introduced, focusing on nationwide changes in summertime
12 A Netherlands Environmental Assessment Agency modeling tool. 13 See http://www.epa.gov/ttn/ecas/benmodels.html for more information.
3-13

O3 concentrations due to simulated climate change a few decades into the future. Other pollutants are not addressed here. As already mentioned, the major focus is the particular subset of results completed to date which are largely common across groups, to facilitate a synthesis. Nevertheless, even limiting discussion to this subset allows us to effectively illustrate a number of key points to carry forward.
Specifically, then, the focus is on inter-group comparisons of future decade (~2050s) and present-day simulations of summertime O3 under scenarios of climate change. The emphasis on summer reflects that of the participating research groups, i.e., on the primary season for O3 episodes and exceedances. All of the future simulations discussed in this sub-section held anthropogenic emissions of precursor pollutants constant at present-day levels, but allowed climate-sensitive natural emissions (e.g., of biogenic VOCs) to vary in response to the simulated changes in climate.14 The organization is as follows: first, the O3 results from the fully downscaled, high-resolution regional model simulations are presented and compared; then, comparisons of differences in key meteorological variables (and biogenic emissions) from these same simulations are provided to begin explaining these O3 results and to highlight the sometimes complex interactions between O3 and its drivers; and finally, some results from the global-model-only runs are presented to complement the regional model findings and to illuminate more clearly certain important issues.
Most of the groups whose results make up this synthesis of the impacts of climate change on O3 have also carried out additional, in most cases highly preliminary, simulations designed to investigate, to first-order, the effects of changes in climate relative to changes in worldwide and/or U.S. anthropogenic emissions of precursor pollutants. The results from these simulations are not included in the synthesis below to maintain the focus on first exploring climate change impacts alone. However, these sensitivity studies provide useful insights that will help inform the more detailed treatments of future emissions planned for Phase II, highlighting key assumptions and uncertainties that will need to be addressed. Therefore, Section 4 contains a brief summary of these analyses and findings.
Similarly, some of the groups have also completed simulations of potential future changes in PM (and its component chemical species), but these results are not discussed here. This is because the research effort and the level of scientific understanding are much more mature at this time for climate and O3 than for climate and PM—there are far more O3 results from these projects to date to draw from, along with a greater knowledge base for interpreting them. In addition, it is anticipated that many of the modeling-related issues revealed in the examination of the O3 results will likely apply to PM as well, though PM also poses unique
14 Differences in IPCC SRES scenarios between the different simulations thus refer only to greenhouse gas concentrations, and not precursor pollutants.
3-14
3-15
challenges for coupled climate-air quality modeling. Some discussion of progress toward understanding climate change impacts on PM is also included in Section 4, and a future report focusing on PM is anticipated. 3.3.1 Regional Modeling Results
3.3.1.1 Modeling System Configurations, Simulations, and Evaluation Table 3-1 lists the regional climate and O3 modeling results discussed in this section.
These simulations were carried out with linked systems consisting of a GCM/GCTM, dynamical downscaling with an RCM, and regional-scale air quality calculations with an RAQM. In aggregate, they cover a range of models, IPCC SRES scenarios of future greenhouse gas emissions, climate and meteorological model physical parameterizations, and chemical mechanisms.
The principal comparison in this section is across the regional modeling experiments listed in Table 3-1 that have regional simulation domains covering the entire continental United States. These are the NERL, University of Illinois (Illinois 1 and Illinois 2), Washington State (WSU), and Georgia Tech-NESCAUM-MIT (GNM) sets of simulations. Results from the Berkeley and Columbia simulations, conducted for subsets of the country, are referred to in the course of the text to reinforce particular findings. Note that the NERL and GNM sets both relied on the same MM5-downscaled GISS III climate simulations, though GNM is for three summers versus five for NERL. They also differed in their development of their emissions inventories. Note also that Illinois 1 and Illinois 2 are identical except for the greenhouse gas emissions scenario used in the GCM simulation of future global climate, with Illinois 1 using the IPCC SRES A1Fi and Illinois 2 using B1. The many additional details of each of these sets of numerical experiments can be found in the references cited in Table 3-1 (and further references therein).
It is important to reiterate that the differences in IPCC SRES scenarios for the simulations listed in Table 3-1 refer only to greenhouse gas concentrations, and not precursor pollutants. As emphasized previously in this report, all of the results shown here are from simulations that held anthropogenic emissions of precursor pollutants, as well as other relevant chemical species (e.g., CH4) constant at present-day levels. Climate-sensitive natural emissions, such as biogenic VOCs, evaporative emissions, and lightning NOx (depending on the modeling system used), were allowed to change in response to the simulated climate change, with the biogenic VOCs being the dominant impact. Land use and land cover also remained constant. Finally, potential impacts of changes in O3 concentrations on plant productivity and carbon uptake were not included (e.g., see Sitch et al., 2007).

Table 3-1. The regional modeling systems whose results are discussed in Sections 3.3.1 and 3.3.2. The regional resolution listed for each group represents the horizontal grid spacing of the regional air quality simulation (also corresponding to the innermost nested grid of the RCM). The Illinois AQM runs use 30 km grid spacing over four sub-regions of the country and 90 km everywhere else (their CMM5 runs use 30 km everywhere). Therefore, for the O3 results shown below, these 30 km values in the sub-regions are overlaid on the background map of 90 km values, introducing some minor contouring discrepancies at the boundaries of the sub-regions.
3-16
Berkeleya Columbiab NERLc Illinois 1d Illinois 2d WSUe GNMf
Domain Cent. CA East. U.S. Cont. U.S. Cont. U.S. Cont. U.S. Cont. U.S. Cont. U.S.
Simulation Period 1 August 5 JJAs 5 JJAs 1 JJA 1 JJA 5 Julys 3 JJAs
GCM CCM3 GISS AO GISS III PCM PCM PCM GISS III
Global Resolution 2.8º × 2.8º 4º × 5º 4º × 5º 2.8º × 2.8º 2.8º × 2.8º 2.8º × 2.8º 4º × 5º
GHG Scenario 2 × CO2 A2 A1b A1Fi B1 A2 A1b
RCM MM5 MM5 MM5 CMM5g CMM5g MM5 MM5
Regional Resolution
4 km 36 km 36 km 90/30 km 90/30 km 36 km 36 km
Convection Scheme
N/A Betts-Miller Grell Grell Grell Kain-Fritsch Grell
RAQM CMAQ CMAQ CMAQ AQMh AQMh CMAQ CMAQ
Chemical Mechanismi
SAPRC99j CB-IVk SAPRC99 RADM2l RADM2 SAPRC99 SAPRC99
Climate Sensitive Emissions
BVOCs BVOCs; Evaporativem
BVOCs; Evaporativem
BVOCs; Evaporativem
BVOCs; Evaporativem
BVOCs; Evaporativem
BVOCs; Evaporativem
aFor more details, see Steiner et al. (2006). bFor more details, see Hogrefe et al. (2004a,b)—the GISS AO model refers to the model of Russell et al. (1995).

3-17
cFor more details, see Leung and Gustafson (2005); Nolte et al. (2008). dFor more details, see Liang et al. (2006); Huang et al. (2007; 2008); Tao et al. (2007). eFor more details, see Chen et al. (2009); Avise et al. (2009). fFor more details, see Tagaris et al. (2007); Liao et al. (2007); Woo et al. (2007). gCMM5 is based on the standard MM5, but with modifications to the buffer zone, ocean interface, and cloud-radiation interactions. hAQM has been adapted from the SARMAP model, incorporating a faster, more accurate numerical solver for gas-phase chemistry. iNote that the SAPRC99 and RADM2 chemical mechanisms recycle isoprene nitrate, while the CB-IV mechanism does not. jFor more details, see Carter (2000). kFor more details, see Gery et al. (1989). lFor more details, see Stockwell et al. (1990). mThrough the SMOKE emissions modeling system, e.g., see Houyoux et al. (2000). Cent. = Central; East. = Eastern; Cont. = Continental; U.S. = United States.
All of these modeling systems have been evaluated to some degree with respect to historical observations of both climate and chemistry. Each of the individual modeling components making up the coupled system is well established in their respective research communities, and has undergone extensive testing and evaluation, though not necessarily for the particular variables, and statistics, most appropriate for coupled climate and air quality research. For example, the CMAQ model has been extensively evaluated against observations for operational air quality forecasting evaluations (e.g., see Eder and Yu, 2006; Eder et al., 2006), as well as for the purposes of examining issues such as the sensitivity of simulated O3 concentration to nudging of meteorological fields and subsequent impact on O3 biases (e.g., see Otte, 2008). Similar claims may be made for the other global and regional climate and chemistry modeling components.
Evaluation of the coupled modeling systems, built out of these individual components, is at an early stage. Each of the modeling teams has performed a number of evaluations of their coupled climate and air quality systems using station observations of meteorological variables and ozone concentrations (e.g., from EPA’s Air Quality System database15) for various historical time periods. Details of these evaluations can be found in the references cited above, and additional references therein for the individual modeling components. For example, the NERL group compared their combined GCM-RCM-RAQM MDA8 O3 distributions with AQS observations nationally, finding reasonable agreement comparable to that found for uncoupled CMAQ simulations. In general, they found the smallest biases in the northeastearn United States, and at the high end of the O3 distribution. They attributed these biases to both meteorological and chemical mechanism factors.
Beyond providing insight into the performance and biases of the modeling systems, these evaluation studies also provide a number of important insights that complement the simulations of climate change impacts on O3 that will be discussed shortly, e.g., on the role of meteorological drivers or alternative chemical mechanisms in O3 variability. For example, Nolte et al. (2008) attribute a portion of the O3 biases over the eastern United States that they observe in their coupled system to the biases in temperature and precipitation present in the MM5 regional climate used to drive their ozone simulation (see also Leung and Gustafson, 2005). They also found, in sensitivity studies, differences in simulated O3 using the SAPRC vs. the CB-IV chemical mechanism in CMAQ (see also Faraji et al., 2008). Similarly, Huang et al. (2007) showed how low or high biases in simulated temperature over the Northeast and Midwest lead to O3 concentration biases in the same directions.
15 http://www.epa.gov/ttn/airs/airsaqs/.
3-18

3.3.1.2 Changes in O3 Figure 3-1 shows summertime mean MDA8 O3 concentration differences between
simulated future and present-day climates for the regional modeling experiments listed in Table 3-1 that have model domains covering the entire continental United States. These are the NERL, Illinois 1, Illinois 2, WSU, and GNM simulations. Results from the Berkeley and Columbia simulations, conducted for subsets of the country, are referred to in the course of the text to reinforce particular findings. MDA8 O3 is selected because of its direct relevance to U.S. air quality standards. All plots discussed here show future minus present differences. All O3 values are in ppb.
Key similarities between the results from the different groups emerge:
• For all the present/future simulation pairs, some substantial regions of the country show future increases in O3 concentrations of roughly 2−8 ppb under a future climate.
• Other regions show little change in O3 concentrations, or even decreases, though the decreases tend to be less pronounced than the increases.
• These patterns of O3 differences are accentuated in the 95th percentile MDA8 O3 (shown in Figure 3-2 for the NERL experiment, as one example of this result) compared to the mean MDA8 O3.
The basic result of larger climate sensitivity of O3 concentrations for high-O3 conditions
(e.g., 95th percentile MDA8 O3) is one of the most robust findings of this synthesis—it holds across all the modeling groups and appears in many different analyses carried out by these groups. These more detailed results can be found in the papers cited in Table 3-1. This is significant, because these high-O3 episodes are of particular concern for air quality managers.
Some pronounced differences in the broad spatial patterns of change across experiments emerge as well. For example, the NERL and GNM simulations show increases in O3 concentration in the Mid-Atlantic and parts of the Northeast, Gulf Coast, and parts of the West. They also show decreases in the upper Midwest and Northwest and little change elsewhere, including the Southeast. By contrast, the Illinois 1 experiment shows the strongest increases in the Southeast, the Northwest, and the Mississippi Valley (as well as the Gulf Coast, in agreement with NERL), with weaker increases in the upper Midwest. In addition, these changes tend to be larger than those from the NERL experiment. The WSU experiment shows the largest increases
3-19

Figure 3-1. 2050s-minus-present differences in simulated summer mean MDA8 O3 concentrations (in ppb) for the (a) NERL; (b) Illinois 1; (c) Illinois 2; (d) WSU; and (e) GNM experiments (see Table 3-1).
3-20

Figure 3-2. 95th percentile MDA8 O3 concentration differences for the NERL experiment.
in the Northeast, parts of the Midwest, and desert Southwest, with decreases in some parts of the West, the Southeast, the Northwest, the Plains states, and the Gulf Coast. As is to be expected, the NERL and GNM patterns are quite similar, with differences primarily reflecting the averaging over five vs. three summers, respectively. This highlights the potential importance of interannual variability in driving differences between modeling groups, as will be discussed further below.
Certain regions show greater agreement across experiments than others. Figure 3-1 illustrates that a loosely bounded area, encompassing parts of the Mid-Atlantic, Northeast, and lower Midwest, tends to show at least some O3 increase across all the simulations. By contrast, the West and the Southeast/Gulf Coast are areas of greater disagreement, hinting at some of the complexities underlying the interactions between climate and O3. Even for these regions, however, at least some of the models (here and in Section 3.3.2) show substantial climate-induced O3 increases. Changes in drivers that help explain these agreements and disagreements, and help illustrate these complexities, will be presented and discussed shortly.
All of these findings are generally consistent with results from the earlier Columbia study (see Hogrefe et al., 2004b). Figure 3-3 shows future-minus-present climate summertime mean
3-21

MDA8 O3 concentration difference for their modeling domain, covering the eastern half of the United States.
Figure 3-3. 2050s-minus-present differences in simulated summer mean MDA8 O3 concentrations (in ppb); reproduced from Figure 2 in Hogrefe et al. (2004b). Note from Table 3-1 that there are differences in the number of years of simulation
completed by the different groups so far. As introduced in Section 1, and discussed further below, it is well recognized that interannual meteorological variability drives large year-to-year changes in O3 (e.g., see White et al., 2007; Leibensperger et al., 2008; Jacob and Winner, 2009). All of the modeling groups eventually aim to analyze interannual variability in their simulations. In this context, Figure 3-4 (reproduced from Nolte et al., 2008) illustrates two points. First, for some regions, the average change in O3 from the present to the 2050s as a result of climate change is just as large as (and on top of) the year-to-year O3 variability that is of concern today. In other words, climate change has the potential to push O3 concentrations in extreme years beyond the envelope of natural interannual variability. Second, it highlights the need for simulating multiple years to increase the robustness of findings about present-to-future changes. These results are consistent with those presented in Racherla and Adams (2008) (based on their GCTM runs), who found that the magnitude of simulated future changes in O3 concentrations over the eastern United States tended to be greater than the magnitude of present-day interannual 3-22
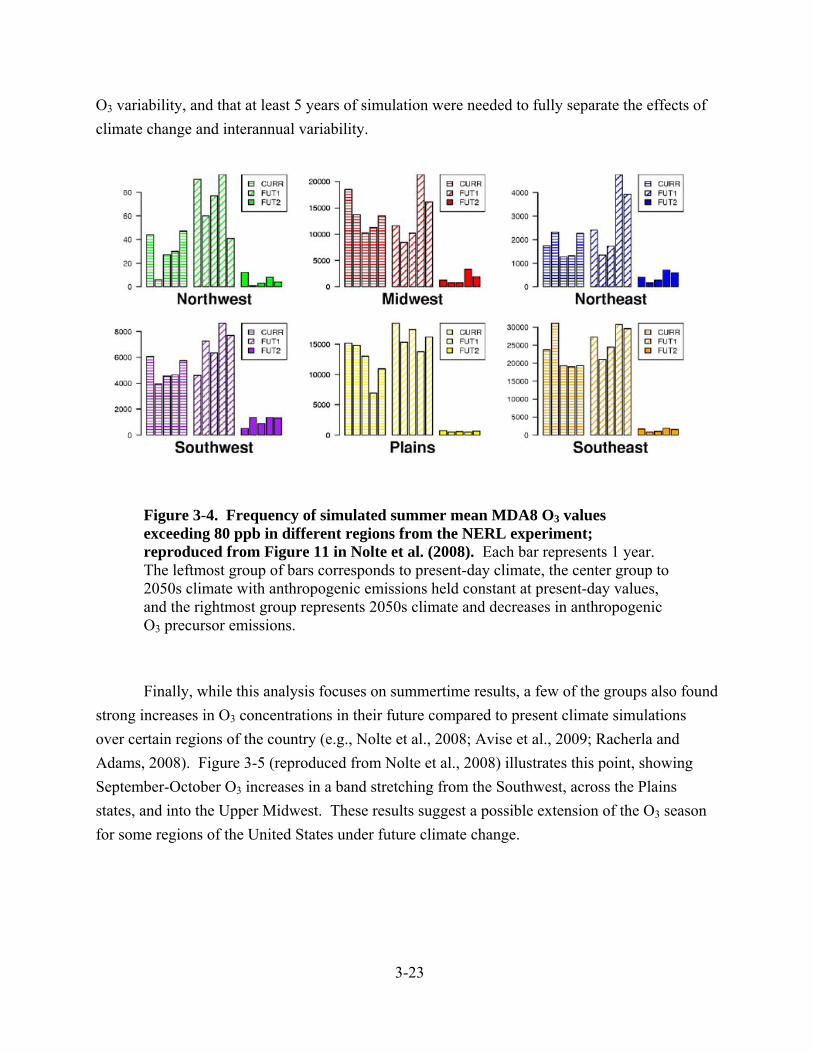
O3 variability, and that at least 5 years of simulation were needed to fully separate the effects of climate change and interannual variability.
presents 2050s climate and decreases in anthropogenic 3 precursor emissions.
und
g
e extension of the O3 season for som regions of the United States under future climate change.
Figure 3-4. Frequency of simulated summer mean MDA8 O3 values exceeding 80 ppb in different regions from the NERL experiment; reproduced from Figure 11 in Nolte et al. (2008). Each bar represents 1 year. The leftmost group of bars corresponds to present-day climate, the center group to2050s climate with anthropogenic emissions held constant at present-day values, and the rightmost group reO Finally, while this analysis focuses on summertime results, a few of the groups also fo
strong increases in O3 concentrations in their future compared to present climate simulationsover certain regions of the country (e.g., Nolte et al., 2008; Avise et al., 2009; Racherla and Adams, 2008). Figure 3-5 (reproduced from Nolte et al., 2008) illustrates this point, showinSeptember-October O3 increases in a band stretching from the Southwest, across the Plains states, and into the Upper Midwest. These results suggest a possibl
e
3-23

Figure 3-5. 2050s-minus-present September-October compared to June-August differences in simulated mean MDA8 O3 concentrations (in ppb); reproduced from Figure 6 in Nolte et al. (2008).
3.3.1.3 Changes in Drivers
There is already a great deal of regional variability in near-surface O3 under current climate conditions. For example, as introduced in Section 1, a large body of observational and empirical work has helped us understand that concentrations tend to be especially great where the emissions of precursor chemical species like VOCs and NOx are also large, and that, furthermore, these pollutants tend to drive up O3 even more during the times when meteorological conditions most favor strong net photochemical production—persistent high pressure, stagnant air, lack of convection, clear skies, and warm temperatures—and vice versa. It is for these reasons that the O3 NAAQS are most often exceeded during summertime hot spells in places with large natural or anthropogenic precursor emissions (e.g., cities). To the extent that climate change may alter weather patterns, and, hence, the frequency, duration, and intensity of these episodes, for example, O3 concentrations could be significantly affected.
However, the causal chain linking (a) long-term global climate change, (b) changes in the aspects of (often) short-term meteorological variability that most directly drive near-surface O3 concentration changes of concern to air quality managers, and (c) any O3 changes that ultimately result from the interaction of these meteorological changes with the pollutants present in the environment (which may themselves be sensitive to meteorology and climate) may not be straightforward. Changes in the O3 distribution of a given region due to climate change will reflect a balance among competing changes in multiple factors.
For example, a number of meteorological variables have been identified as potentially important, including
• Near-surface temperature
• Near-surface humidity
3-24

• Precipitation
• Cloud cover
• Planetary Boundary Layer (PBL) height
• Near-surface wind speed and direction
• Ventilation and mixing due to convective events
• Ventilation and mixing due to synoptic-scale cyclones
• Ventilation and mixing due to coastal onshore flow.
These variables are not, in general, independent of each other. Instead, they vary, together or separately in different combinations, at different locations over different timescales, in ways that may favor either increases or decreases in O3. For example, all other factors being equal, increases in temperature at a given time and place might lead to increases in O3 concentration, but if these temperature increases are accompanied by increases in cloudiness, the net result might be a decrease in O3 concentration. Box 3-1 provides a discussion of how one’s perception of the relationship between O3 and its meteorological drivers can vary depending on the timescale considered, using the temperature-O3 relationship as an example. This provides some additional context for interpreting these next modeling results to be presented. This issue is revisited in Section 3.4 below, where the implications for interpreting long-term mean climate change-air quality modeling results are discussed.
The advantage of the type of model-based approach that is the focus of this section, i.e., the strategy of linking climate, meteorology, and air quality models, is that such integrated modeling systems are capable of capturing these complexities by representing the reinforcing and competing interactions between variables in an internally self-consistent way. As such, they help illuminate potentially non-obvious impacts of climate change on O3 that result from synergistic interactions between the changes in key drivers.
Figures 3-6 and 3-7 display the average future-minus-present differences in near-surface air temperature and surface incoming solar radiation (typically referred to as “insolation”), which are two of the most critical meteorological drivers of ground-level O3. The insolation changes largely reflect changes in cloud cover. Other variables besides the two shown in Figures 3-6 and 3-7 were also examined, including average daily maximum temperature, precipitation, number of rainy days, and PBL height. However, none of these additional comparisons are shown here because, at least at this level of analysis, they do not seem to add a great deal to the explanatory power of temperature and surface insolation (and, as will be discussed below, biogenic VOC emissions). This is likely due to the strong correlations among these variables already been discussed.
3-25

Box 3-1. The Temperature-O3 Relationship As seen through the lenses of different meteorological/climatic timescales Episode: The severity of a particular O3 episode lasting one or a few days can depend strongly on temperature. For example, Aw and Kleeman (2003) found that, by increasing temperature (but without modifying the other meteorological variables) in an air quality model simulation of a southern California O3 episode, they significantly increased daily peak O3 concentrations. Temperature affects the kinetics of the O3-forming and destroying chemical reactions. For example, in polluted environments, increasing temperature will tend to lead to more NOx, and hence more O3, via a decrease in peroxyacetylnitrate (PAN) production. The new results from the Berkeley and Carnegie Mellon groups described in Section 3.2 have yielded similar insights. Steiner et al. (2006), in their very high-resolution simulations of a 5-day O3 episode over California, found that temperature perturbations consistent with plausible 2050s climate change led to increases in afternoon O3 concentrations of 1-5 ppb across the state. Dawson et al. (2007b) found similar effects of temperature modification when using the PMCAMx model to simulate O3 concentrations during a week-long period over the eastern U.S. Season: From the perspective of an entire season, however, mean O3 concentration and the number of O3 exceedances will likely depend at least as much on how many of these meteorological episodes that promote O3 formation occur, and how long they last, as on how hot it is during them. In other words, how often in a given summer that cool, cloudy, rainy, and windy conditions give way to spells of hot, clear, dry, and stagnant conditions will play a large role in determining whether it was a “high-O3” or “low-O3” summer. At this timescale, temperature and O3 will also be positively correlated, but here the “temperature-O3” relationship exists at least partly because temperature itself is highly correlated with these other meteorological conditions, like more sunlight and less ventilation, that also favor increased O3 concentrations. Long-Term Climate Change: On the multi-decadal timescales of global climate change, however, the relationship between temperature and these other meteorological drivers may or may not play out in the same way that is characteristic of seasonal timescales. In some regions, climate change may indeed have the effect of producing long-term average associations between higher temperatures, less cloudiness, and weaker mixing that in aggregate would be likely to lead to O3 concentration increases. This would be true, for example, in the regions most at risk for increases in the frequency, duration, and intensity of summertime heat waves (e.g., see Meehl and Tebaldi, 2004; IPCC, 2007). In other regions, however, climate change may lead to changes in these other variables that do not favor increases in O3 concentrations. For example, a warmer world is likely, on average, to be a wetter world. Both the Harvard and Carnegie Mellon GCTM results summarized earlier showed how increases in humidity in their future simulations led to decreases in near-surface O3 in less-polluted regions (Wu et al., 2008a; Racherla and Adams, 2006). Similarly, regions that experience increases in cloudiness (and hence decreases in sunlight and O3 photo-production) in an altered future climate might have net O3 concentration decreases, in spite of increased temperatures.
Combined with the O3 results shown above in Figure 3-1, Figures 3-6, and 3-7 reveal
some key similarities in the relationships between O3 and meteorological drivers among the different model studies:
• First, in many regions the O3 concentration changes (Figure 3-1) seem to correspond
relatively well with combined changes in mean temperature (Figure 3-6) and mean surface insolation (Figure 3-7). For example, the NERL results show the O3 increases corresponding with temperature and insolation increases in the Mid-Atlantic and Gulf Coast and O3 decreases associated with the insolation decreases and the local minimum in temperature increases in the upper Midwest and the northern Plains.
3-26
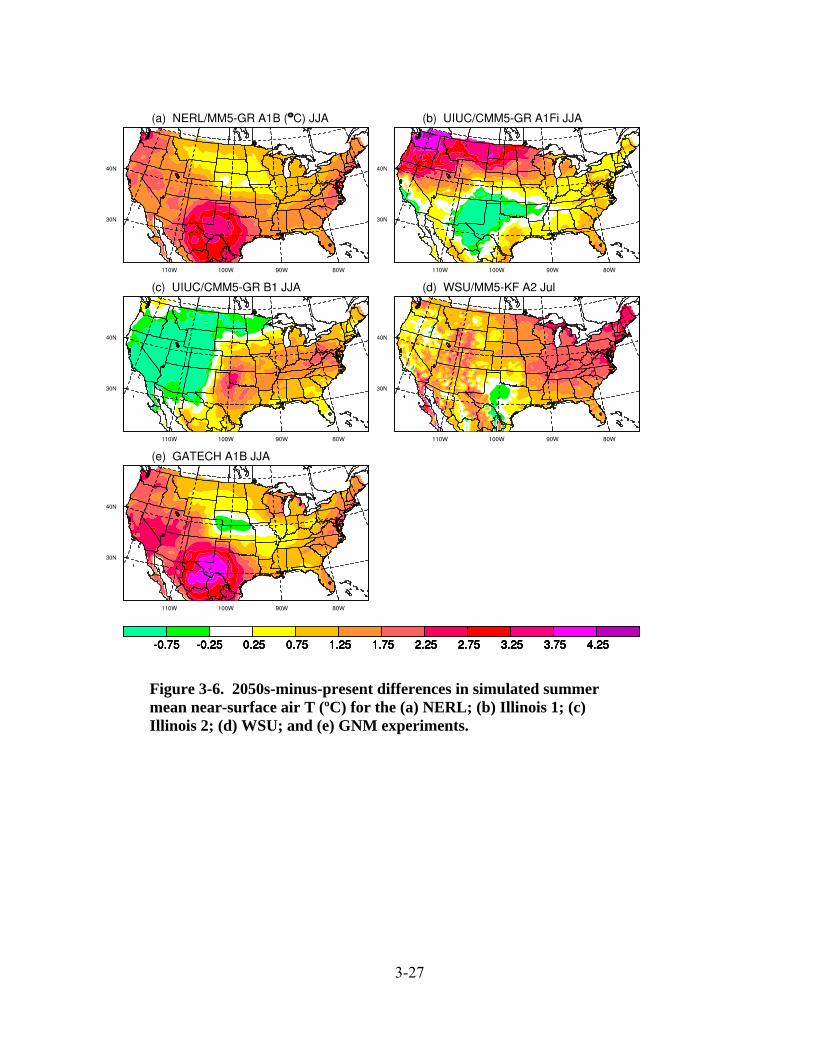
Figure 3-6. 2050s-minus-present differences in simulated summer mean near-surface air T (ºC) for the (a) NERL; (b) Illinois 1; (c) Illinois 2; (d) WSU; and (e) GNM experiments.
3-27

Figure 3-7. 2050s-minus-present differences in simulated summer mean surface insolation (W m-2) for the (a) NERL; (b) Illinois 1; (c) Illinois 2; (d) WSU; and (e) GNM experiments.
• In other regions, temperature and insolation vary in opposite directions, with mixed impacts on O3 concentrations. For example, in the Illinois 1 simulations, in spite of insolation decreases over much of the Northwest, the large increase in temperature there seems to drive O3 increases.
In a small number of regions across the simulations, there is no strong correspondence between O3 concentrations and either insolation or temperature (e.g., the areas around Oklahoma
3-28

in the Illinois 1 experiment and Nevada/Utah/Idaho in the Illinois 2 experiment), suggesting that other forcing factors may be important, and/or that a correspondence might exist, but only for different averaging periods and statistics of these variables.
The differences between the NERL and GNM results are consistent with this last bullet. For example, in the Plains states, GNM shows greater O3 decreases, consistent with the difference in temperature and insolation trends resulting from the difference in the number of summers simulated.
Again, as discussed above and in Box 3-1, when interpreting these monthly- or seasonal-mean results it is important to recognize they encompass not just changes in the meteorological conditions most related to O3 episodes, but the whole spectrum of changes in regional climatology arising from global climate change.
Considering the results from the Columbia group, Hogrefe et al. (2004b) do not report any single clear relationship across their study region between the spatial patterns of future-minus-present O3 concentrations and a number of meteorological variables (e.g., temperature, wind speed, and mixed layer height), as mentioned in the summary in Section 3.2. This is consistent with the potential for different competing effects in different regions illustrated by the results shown here. They do note a strong sensitivity of future O3 changes to changes in convective activity in certain areas, which may reflect the dependence on insolation found by the other groups.
Figure 3-8 shows the patterns of changes in mean biogenic VOC emissions across the simulations. As documented in earlier work (e.g., Chameides et al., 1988; Roselle et al., 1991; Guenther et al., 1994; Pierce et al., 1998; Fuentes et al., 2000; Purves et al., 2004; among others), the emissions of these important natural O3 precursors are themselves sensitive to meteorology, including sunlight and temperature. Therefore, in conjunction with the direct forcing exerted on O3 processes by changes in meteorology, climate-induced changes in biogenic emissions levels can lead to changes in O3 concentrations as well (see also Zhang et al., 2008). As will be discussed again below, in the context of the global modeling results, this impact depends in part on the relative amounts of NOx and VOCs in the environment. For example, Steiner et al. (2006) found significant O3 concentration increases in the high-NOx San Francisco Bay area due to increases in biogenic VOC emissions, whereas even larger increases in biogenic emissions over the Sierras actually produced slight O3 decreases.
The climate-induced biogenic emissions changes shown in Figure 3-8 seem to contribute to the O3 concentration changes, but only in some regions, and not wholly consistently across model studies. For example, temperature-driven increases in biogenic emissions may contribute to the above-mentioned O3 increases in the Northwest in the Illinois 1 experiment, the Mid-Atlantic in the NERL and GNM experiments, the Northeast in the Illinois 2 experiment, and
3-29

Figure 3-8. 2050s-minus-present differences in simulated summer mean biogenic VOC emissions (g Carbon m-2 day-1) for the (a) NERL; (b) Illinois 1; (c) Illinois 2; (d) WSU; and (e) GNM experiments.
the Southeast in the Illinois 1 experiment. Contrastingly, in parts of the Southeast and Mountain West in the NERL and GNM experiments, emissions increase significantly but O3 concentrations do not change. Notably, the WSU simulation shows large decreases in O3 in some of the parts of the Southeast and Gulf Coast where increases in VOC emissions are the strongest, a result that is partially attributed to increases in precipitation, and hence reduced photo-production. Where there are strong correlations between biogenic emissions changes and O3 concentration changes, often there are similarly strong changes in insolation and/or temperature, so separating the different effects is not always straightforward. The earlier work by Hogrefe et al. (2004b) found 3-30
the strongest increases in emissions in the Southeast, similar to the results from the NERL and Illinois 1 and 2 experiments, but found that the largest O3 concentration changes that could be attributed to biogenic emissions changes occurred instead in parts of the Ohio Valley and coastal Mid-Atlantic.
Discerning the precise chemical pathways whereby O3 responds to changes in biogenic emissions, and how they vary as a function of region and climatic conditions, is an area of ongoing scientific inquiry. Different air quality models employ different representations of these pathways in their code. As such, differences between the simulated O3 response to changes in simulated biogenic emissions from different modeling systems is at this time a key source of uncertainty in climate change impacts on future air quality, particularly in certain regions where the effect of increasing VOC concentrations is highly dependent on NOx levels. This issue will be highlighted further in Section 3.3.2 below, in the intercomparison of the results from the global modeling experiments.
One way to summarize the aggregate results presented in Figures 3-1 and 3-6 to 3-8 is to say that O3 responds to the meteorological/emissions drivers in a qualitatively consistent manner across the simulations, but the regional patterns of relative changes in these drivers is highly variable across these same simulations.
In other words, there are important differences in the simulated future regional climate changes across groups that seem to drive the differences in the regional patterns of O3 increases (and decreases). The differences in modeling systems among the groups, as documented in Table 3-1, provide some indication of a number of possible contributing factors that might be responsible for these differences in simulated future regional climate patterns, including
• Differences in the driving GCM
• Differences in the SRES greenhouse gas scenario
• Differences in the RCM (and/or model physical parameterizations) used to simulate regional meteorology
• Differences in the RAQM (and/or chemical mechanisms)
• Differences in the amount of interannual variability captured
These issues of inter-group differences, and the sensitivity of simulation results to
modeling methodology, are discussed in greater detail in Section 3.4 below, to provide additional guidance on interpreting the findings and evaluating their robustness in the context of the existing scientific uncertainties.
3-31

The findings presented here, in Sections 3.3.1.2 and 3.3.1.3, are generally consistent with the limited number of regional climate and air quality modeling experiments recently carried out for Europe. For example, Forkel and Knoche (2006) simulated changes in near-surface O3 concentrations between the 1990s and the 2030s over Southern Germany under climate change but no change in anthropogenic emissions. They found a 10 percent increase in average daily maximum O3 during summer (approximately 2−6 ppb, depending on location in the model domain). Langner et al. (2005), in a set of regional modeling experiments, found climate change-induced increases in April-September O3 concentrations during the mid-21st century compared to the present over Southern and Central Europe, with decreases over Northern Europe, and that these changes were significant with respect to interannual variability. Meleux et al. (2007) found higher summertime O3 concentrations under future climate conditions over Europe, due primarily to increased temperatures, decreased cloudiness and precipitation, and increases in biogenic VOC emissions. They also found large regional variability in these O3 changes. Finally, Szopa and Hauglustaine (2007) found worsening O3 conditions over Europe as a result of anticipated climate change in 2030, though this was sensitive to the choice of global and regional emissions change scenarios. 3.3.2 Global Modeling Results Table 3-2 lists the groups that have results from GCTM simulations available at the time of developing this report.
Table 3-2. GCTM-only model simulations whose results are discussed in Section 3.3.2. CMU stands for Carnegie Mellon University. The two Harvard runs use different GCMs with the same SRES greenhouse gas scenario. The two Illinois runs have identical setups but are driven with different SRES scenarios. As with the regional modeling system results discussed above, anthropogenic emissions of precursor pollutants were held constant across present-day and future simulations, while natural climate-sensitive emissions were allowed to change.
Harvard 1a Harvard 2b CMUc Illinois 1d Illinois 2d
Simulation Period 5 summer/falls 5 summers 10 summers/falls 5 summers 5 summers
GCM GISS III GISS II′ GISS II′ PCM PCM
Resolution 4º × 5º 4º × 5º 4º × 5º 2.8º × 2.8º 2.8º × 2.8º
GHG Scenario A1b A1b A2 A1Fi B1
GCTM GEOS-Chem GISS II′ e GISS II′ e MOZART v.4 MOZART v.4
3-32

Chemical Mechanism
GEOS-Chemf Harvard Trop Chem Modelg
Harvard Trop Chem Model
MOZART v.4h MOZART v.4
Climate Sensitive Emissions
BVOCs; Lightning and
soil NOx
BVOCs; Lightning and
soil NOx
BVOCs; Lightning and
soil NOx
BVOCs; Lightning and
soil NOx
BVOCs; Lightning and
soil NOx
aFor more details, see Wu et al. (2007); Wu et al. (2008a; 2008b) bFor more details, see Mickley et al. (2004) cFor more details, see Racherla and Adams (2006; 2008) dFor more details, see Tao et al. (2007); Lin et al. (2008); Huang et al. (2008) eThe GISS II′ model was coupled to the Harvard tropospheric O3-NOx-hydrocarbon chemical model (Mickley et al., 1999) fFor more details, see http://homepages.see.leeds.ac.uk/~lecmje/GEOS-CHEM/GEOS-CHEM_Chemistry.htm. gFor more details, see Mickley et al. (1999) hFor more details, see Horowitz et al. (2003) and http://gctm.acd.ucar.edu/mozart/models/m4/index.shtml.
All of these GCM/GCTM simulations are also associated with regional downscaling and air quality modeling efforts. The Illinois GCM/GCTM runs are the same ones used to provide climatic and chemical boundary conditions for the Illinois 1 and 2 regional simulations listed in Table 3-1 and described above (see also Lin et al., 2008), and the Harvard 2 run is the same one used to drive the NERL regional simulations (see also Mickley et al., 2004). The Harvard 1 and CMU simulations will similarly eventually be used to drive RCM and RAQM models—these groups have developed and tested full global-to-regional systems, with results expected in the near future. Here, a somewhat more limited inter-group comparison than for the regional modeling results is presented, with the goal of illustrating a few specific points.
In a global context, the results from these simulations are generally consistent with other GCTM climate change experiments (e.g., see Murazaki and Hess, 2006; Stevenson et al., 2006; Zeng et al., 2008): e.g., decreases in background O3 concentrations in clean environments (e.g., the oceans), due to increased water vapor concentrations, and increases regionally over the polluted continents.
A comparison of results across all of these simulations for the United States in particular (not shown) supports the most general conclusions from the regional modeling studies: i.e., large regions of the country show future O3 concentration increases of a few to several ppb, and there can be significant differences in the spatial patterns of these changes between different modeling experiments. The purpose of this sub-section is to highlight a comparison between two of these simulation sets—Harvard 1 (see also Wu et al., 2008a) and CMU (see also Racherla and Adams, 2006)—because these results illustrate particularly well two critical insights: the potential importance for simulated future O3 of large-scale circulation changes, and the potential importance of how isoprene chemistry is represented in the modeling systems.
3-33

Figure 3-9 shows the mean MDA8 O3 changes from the Harvard 1 experiment, along with accompanying changes in temperature, insolation, and biogenic emissions. In these results, the largest O3 increases are mostly in a sweeping pattern from the central United States, across the Plains states and the Midwest, and extending into the Northeast. In contrast to the regional model results shown above, there is not as obvious a spatial correlation between the changes in O3 and those of any one of the driver variables. The insolation increase in the Midwest matches, to some degree, the pattern of O3 increase there, but the largest temperature, insolation, and biogenic emissions increases occur in the southern part of the country, where there are much smaller changes in O3. This weak relationship also holds for a number of other variables considered but not shown (e.g., precipitation, PBL height, etc.).
In Figure 3-10, which shows the same quantities for the CMU experiment, a different regional pattern of change emerges. Here, the major increases in future O3 concentrations are instead centered on the Gulf Coast and eastern seaboard, with minimal O3 changes in the upper Midwest and northern Plains states.
Figure 3-9. 2050s-minus-present differences in simulated summer (JJA) mean (a) MDA8 O3 concentration (ppb); (b) near-surface air temperature (ºC); (c) surface insolation (W m-2); and (d) biogenic isoprene emissions (g Carbon m-2 day-1) for the Harvard global modeling experiment (see Table 3-2).
3-34

Figure 3-10. Same as Figure 3-9 but for the CMU global modeling experiment.
The differences between these two sets of results can seemingly mostly be explained by two factors: (1) differences in the future simulation of the summertime storm track across the northern part of the country and (2) differences in the response of O3 to changes in biogenic VOC emissions in the southeastern United States.
As explained in Wu et al. (2008a), there are two distinct dynamical shifts from the present to the future climate in the Harvard 1 experiment: a decrease in summertime cyclones tracking across the upper part of the United States, resulting in a decrease in cloudiness and precipitation over the upper Midwest (as reflected in the insolation changes shown in Figure 3-9), and a northward shift of the Bermuda High, resulting in a decrease in convective activity over the Gulf Coast and the southern Great Plains. All other factors being equal, both shifts might be expected to contribute to O3 concentration increases in their respective regions.
In this context, the spatial pattern of O3 concentration increases in Figure 3-9a is certainly consistent with the decrease in cyclones in the north in the Harvard 1 experiment, as suggested in Wu et al. (2008a) and originally posited in Mickley et al. (2004), i.e., that the decrease in cold surges in the simulated future climate leads to a decrease in the clearing of pollutants from the
3-35

boundary layer (see also Murazaki and Hess, 2006). Racherla and Adams (2008), on the other hand, examined the distribution of sea-level pressure anomalies in the present-day and future CMU simulations and found only relatively small changes in these regions. These results suggest that storm track activity does not decrease in the future in this CMU model simulation, but a more detailed analysis of the storm tracks in this model may be needed (Leibensperger et al., 2008).
Acknowledging this qualification, it seems plausible that differences in simulated future large-scale circulation patterns explain the differences in future O3 changes simulated by the two groups for the northern part of the country. What is the explanation for the even larger difference in simulated future O3 changes in the southern half?
The difference in simulated future O3 changes in the southern half of the country likely arises because of differences in how O3 responds to the climate-induced changes in biogenic VOC emissions in modeling systems used in the Harvard 1 and CMU experiments. The spatial patterns of future-minus-present changes in isoprene emissions shown in Figures 3-9d and 3-10d are qualitatively similar, with the largest increases centered on the Southeast and Gulf Coast regions for both groups. Examining the CMU results in Figure 3-10, it appears that increases in temperature and decreases in cloud cover (and hence increases in insolation) have combined to lead to increases in both isoprene emissions and O3 concentrations in this region. An additional CMU simulation with future meteorology but scaled-back isoprene emissions has confirmed that the enhanced O3 chemical production resulting from these enhanced emissions are largely responsible for the simulated future O3 increases (Racherla and Adams, 2008).
Contrast this with the Harvard 1 results, which show only weak changes in O3 concentrations over the Southeast and Gulf Coast, in spite of the large increase in future biogenic VOC emissions. Even the especially large increases in temperature and insolation that accompany these biogenic emissions changes in the Gulf Coast region do not seem to increase appreciably future O3 concentrations.
One factor to which this striking difference between the two sets of results might be traced is the modeled isoprene nitrate chemistry. While increased emissions of biogenic VOCs are often associated with increases in O3 concentrations, these increased emissions can also lead to decreases in O3 concentrations via different pathways. For example, high concentrations of isoprene can reduce O3 amounts through direct ozonolysis and can also suppress O3 production in NOx-limited regimes (e.g., rural areas) by sequestering NOx in isoprene nitrates (e.g., see Fiore et al., 2005). In the modeling system used for the Harvard 1 simulations, it is plausible that increasing isoprene emissions results in little change, or even decreases in O3 amounts, largely because the model chemistry represents these isoprene nitrates as a “terminal” sink for NOx. In the absence of additional NOx, the small change in O3 concentrations in the Gulf Coast, in spite
3-36

of the strongly favorable climate changes there, could be explained by this suppressing effect of isoprene. By contrast, in the CMU modeling system, the isoprene nitrates are assumed to react rapidly with OH and O3 and “recycle” NOx back to the atmosphere with 100% efficiency. This NOx then becomes available to help create O3 again, tending to favor greater O3 concentrations in regions of greater biogenic VOC emissions, and dominating the impact of climate change on O3 in the CMU results.
This comparison strongly illustrates the importance of understanding the underlying details of the chemical mechanism of O3 formation. Constraining the precise pathways whereby isoprene, NOx, and O3 are linked is the subject of ongoing research (e.g., see Horowitz et al., 2007), and as such remains an important source of uncertainty in the modeling systems. However, there are a number of other important uncertainties associated with the choice of chemical mechanisms, as will be discussed further in Section 3.4.
Finally, in the Harvard 1 simulations, enhanced ventilation and mixing also plays a role in partially offsetting expected climate-induced O3 concentration increases in some near-coastal regions. This results from the combination of the humidity-driven decreases in O3 over the oceans reported in Wu et al. (2008b) (and also Racherla and Adams, 2006), and perhaps also stronger onshore flow due to an increase in the summertime land-ocean heating contrast. Lin et al. (2008) report similar effects in their simulations of future O3 over United States and China.
Before concluding with a summary of the synthesis points that have emerged, the following sub-section provides some additional discussion of outstanding issues related to modeling the linked climate-air quality system and the complexities and scientific uncertainties inherent therein. 3.4 CHALLENGES AND LIMITATIONS OF THE MODEL-BASED APPROACH
All of the results shown in this section are model-based. This emphasis on model studies has been built, from the beginning, into the framework and implementation of the assessment. This sub-section spends some time outlining the challenges, limitations, and areas of uncertainty associated with this model-based approach to provide context for a meaningful interpretation of this synthesis. This discussion helps delineate areas of needed future research to build on our understanding of the climate change-air quality problem, and it aims to convey how the findings presented above might be sensitive to the various modeling uncertainties.
The central concern of this section is the use of linked systems of global and regional climate and air quality models to investigate potential future changes in O3 that may occur due to climate change. These complex modeling systems are extremely valuable scientific tools, as they allow for the exploration of nonlinearities, feedbacks, threshold effects, and in general surprising behaviors that only emerge when the various components are linked together. They
3-37

also, to a degree, encapsulate current scientific understanding of how a wide range of chemical, physical, and dynamical processes interact with each other; i.e., they provide a useful snapshot of the state of the science.
Because of the complexity of the system they mean to mirror, however, at any moment they necessarily embody only an incomplete representation. This results from technical challenges, such as limitations on computing power, as well as from a fundamental lack of understanding of certain processes.
Furthermore, different versions of these modeling systems, for example as developed by different groups, will sample different parts of the space of possible representations. The current assessment effort shows the distribution of results across multiple groups and linked modeling system. Therefore, it is possible to consider different combinations over a range of models, scenarios, and parameterizations, as summarized in Tables 3-1 and 3-2. It is also important to emphasize, however, that, because of the enormous computational burden of these modeling systems as applied to this problem, at this point it is only a very small subset of the available range that has been sampled here (e.g., a few GCMs and SRES scenarios, essentially one RCM, three regional model convection schemes, etc.). Expanding the scope to include additional models, scenarios, and parameterizations, along with multiple combinations of each, might further broaden the distribution of projected regional O3 changes. Alternatively, such new results might reinforce previous findings.
Therefore, any synthesis conclusions are subject to revisions pending results from future investigations. However, this preliminary synthesis makes it possible to identify some of the key modeling-related sensitivities that are likely to determine our ability to accurately simulate climate change-driven O3 changes, as summarized in the following questions:
• What kinds of differences do different GCMs (under different greenhouse gas emissions
scenarios) simulate in the climate, and especially in the weather patterns that matter most for air quality?
• How do RCMs translate these climate and meteorological changes down to the regional scales that are desired?
• How are important chemical mechanisms represented in the climate-air quality modeling systems?
3.4.1 Inter-Model Variability and Model Evaluation The IPCC AR4 (IPCC, 2007) summarizes current understanding of variations in future
global climate simulations. The spread across models, groups, and scenarios is the result of differences in exogenous forcings, like natural volcanic or solar changes or changes in
3-38

anthropogenic emissions of greenhouse gases and aerosols. This spread also results from internal model variability and nonlinear behavior that reflect the inherently chaotic nature of the atmospheric and oceanic circulations. Finally, it arises from model configuration differences due to different choices for dealing with resolution constraints, numerical approximations, and lack of perfect understanding of processes or perfect observations of key parameters. The impact of these factors is reflected in the range of average climates, and regional spatial distributions of climate characteristics, simulated by the different GCMs that are featured here.
The significance of these inter-model/scenario differences varies depending on the lens provided by the particular problem of interest. For air quality in general, and O3 specifically, a critical question is “What kind of changes do models simulate in the weather patterns that matter most for air quality?” The results shown in Figures 3-9 and 3-10 illustrate some of the uncertainties associated with this question. Physical and dynamical arguments suggest that future decreases in the equator-to-pole temperature gradient should drive poleward shifts in the mid-latitude storm tracks, and that this may lead to decreases in the frequency of cyclone ventilation of pollutants in the Northeast and Midwest. The results from the Harvard 1 experiment show this clearly, while those from the CMU experiment do not seem to. Taking a broader perspective across many models and groups, the IPCC AR4 states
Central and northern regions of North America are under the influence of mid-latitude cyclones. Projections by AOGCMs [Atmosphere-Ocean Global Circulation Models] generally indicate a slight poleward shift in storm tracks, an increase in the number of strong cyclones but a reduction in medium-strength cyclones over Canada and poleward of 70°N (IPCC, 2007).
However, the agreement across groups is by no means absolute. Furthermore, the IPCC report states
Results from a systematic analysis of AMIP-2 simulations (Hodges, 2004; Stratton and Pope, 2004) indicate that models run with observed SSTs are capable of producing storm tracks located in about the right locations, but nearly all show some deficiency in the distribution and level of cyclone activity (IPCC, 2007).
Recent increases in model resolution and other improvements have led to improvements
in simulations of present-day storm tracks, and may eventually lead to a stronger consensus on the likely magnitude and direction of future climate-induced changes over the United States. At this time, however, current levels of uncertainty probably do not allow us to say much more than (1) the number and intensity of summertime cyclones passing over the northern United States is
3-39

a key factor in determining air quality there and (2) the occurrence of fewer and weaker cyclones is a plausible consequence of global climate change.
This discussion about cyclones suggests a broader question: how should the scientific community evaluate the performance of these modeling systems for the task at hand? It is not possible to answer this question comprehensively here, but it is possible to place some general issues with which the climate modeling community continuously struggles in the context of the specific problem of climate change impacts on air quality.
First, all groups carry out evaluations of their modeling systems compared to historical observations. The key is to conduct these evaluations for the variables, and statistics of those variables, that are most relevant for the problem of interest. As discussed in various places in this report, “air quality,” from a health, environmental, and regulatory perspective in the United States, has been largely determined by episodes that occur during specific, sporadic weather events. Therefore, what is most important to know is how well available modeling tools simulate these events and how well they can predict future changes. At present, however, the focus of the climate modeling community is still largely on long-term mean values of variables like temperature, precipitation, and cloud cover. These quantities can be important in situ drivers of air quality on short timescales, but more effort is needed to understand how changes in atmospheric flow patterns are reflected in the changes in these long-term means. There is a need to address questions like “Did a simulated temperature change in a given region result from an across-the-board change in baseline temperature during all weather regimes, or instead from a change in the frequency of occurrence of one particular weather pattern (e.g., the afternoon sea breeze, synoptic-scale anticyclones, or mesoscale convective systems)?” Climatological averages of variables like temperature will only have explanatory power for air quality to the extent that they reflect the changes in the most relevant circulation patterns, as opposed to being obscured by “noise” that is less related to air quality (e.g., increases in nighttime average temperature).
The current situation reflects the relatively youthful state of coupled climate and air quality science. The application of climate models to air quality represents a significant challenge for the climate modeling community. One path forward is to make it standard practice to conduct in-depth evaluations of global and regional climate models for additional variables and metrics more relevant for air quality. As Gustafson and Leung (2007) state,
Our ability to address these questions relies critically on the ability of climate models in simulating the meteorological conditions needed to realistically simulate air quality. Because of the nonlinear nature of atmospheric chemistry and its dependence on difficult to model variables, such as precipitation and the planetary boundary layer (PBL) height, biases in variables considered acceptable
3-40

for other downscaling applications may not be appropriate for this new application. An additional challenge in air quality assessment is the required knowledge of the three dimensional structures of the atmosphere, which are not needed for most other assessments.
New efforts carried out under the auspices of this assessment, as summarized in Leung
and Gustafson (2005), Gilliam et al. (2006), and Gustafson and Leung (2007) represent significant advances in this area and provide useful insights moving forward.
Second, it is important to remember that, for the problem under consideration here, accurately reproducing present-day conditions is not interesting in and of itself, but is interesting for what it might imply for simulating and understanding future changes. The connection between the two is not necessarily straightforward. Again from the IPCC AR4: “What does the accuracy of a climate model’s simulation of past or contemporary climate say about the accuracy of its projections of climate change? This question is just beginning to be addressed…” (IPCC, 2007: Ch. 8).
Given a particular variable, and statistic of that variable, to be evaluated, there are two sources of error in any future-minus-present comparison: the bias in the present-day simulation, and some (hypothetical) bias in simulating the future conditions. The modeling community typically makes two implicit assumptions about these sources, but these assumptions are potentially contradictory. First, there is the assumption that these two errors are correlated, i.e., the better the modeling system is at reproducing present-day observations, the better it will be at reproducing future climate shifts. This could lead logically to the conclusion that a model system that does a poor job of simulating the present will likely be even worse at getting the “correct” future-minus-present changes. However, it is often simultaneously asserted that looking at differences between simulated future and present results will yield accurate insights, i.e., that the biases should be similar in the present and future simulations and thus will cancel. Barring improbable coincidences, these two assumptions can only be reconciled if a third assumption also holds: namely, that most of the biases in the present-day simulation come from error sources that will not impact the model’s ability to capture the future changes, i.e., the present-day biases will simply be carried along to the future. The validity of this assumption for a highly nonlinear system like climate must be tested. Again, research carried out for this assessment is contributing to this need. For example, Liang et al. (2008) showed how GCM (and downscaled RCM) biases with respect to historical observations are consistently propagated into future simulations, empirically linking the ability of a modeling system to accurately reproduce present-day climate to the types of future climate changes it predicts.
3-41

3.4.2 The Role of Downscaling As described in Section 2, this assessment has been built, in part, around dynamical
downscaling, i.e., the use of an RCM to derive higher-resolution meteorology from a GCM simulation for a particular sub-region of the globe. This is in recognition of the dual need to be regionally explicit, so as to connect more closely with the priorities of policy makers, while at the same time capturing the inherently global scale of the climate drivers. As noted, this is really the first systematic attempt to apply these techniques to air quality impacts work, and valuable lessons are being learned.
The fundamental task of dynamical downscaling is to maximize the “value retained” from the GCM and the “value added” by the RCM. In other words, successful downscaling will take advantage of the things the RCM does well in simulating weather and climate, by virtue of its high resolution, without sacrificing too much of what the GCM does well, by virtue of its global extent. From the results presented above, it is clear that changes in both large-scale circulation patterns and local-scale forcings are crucial drivers of O3 changes. A given modeling system will be able to accurately simulate changes in O3 only to the extent that it can accurately capture both.
Because of its higher resolution, the RCM develops small-scale features that the GCM cannot. These features develop for three primary reasons (see, e.g., Denis et al., 2002):
• finer-scale representations of surface characteristics, like topography, water bodies,
vegetation, soil moisture, and land use, that lead to local-scale circulation systems like sea and lake breezes and mountain-valley flows;
• nonlinearities in the fluid dynamics equations that lead to the development of fronts and other mesoscale features;
• hydrodynamic instabilities arising from shear or buoyancy forcing that create turbulent eddies and convection and are more accurately represented with higher resolution.
RCMs therefore add the most value by more accurately simulating near-surface
meteorological fields, as well as extreme conditions (e.g., cyclone low pressure, intense precipitation, high winds). These advantages make it possible to significantly improve on regional biases in temperature and precipitation present in GCM simulations (e.g., see Liang et al., 2006), and these improvements can lead directly to improved simulations of O3.
RCM performance is highly sensitive, however, to the physical parameterizations used, as already summarized above. For example, Liang et al. (2006; 2004a,b) and Lynn et al. (2004; 2007) found strong sensitivities of temperature and precipitation to the convection scheme chosen. These meteorological sensitivities drive corresponding sensitivities in simulated air
3-42

quality (e.g., Kunkel et al., 2007; Tao et al., 2008). In addition, sensitivities of air quality to PBL, radiation, microphysics, and land-surface schemes may also be important, but these have yet to be examined as systematically in this assessment.
Along with the physical parameterizations, the other major sensitivity of the RCM is the application of the large-scale boundary conditions from the GCM, i.e., the actual “implementation” of the dynamical downscaling that links the GCM with the RCM. By itself, an RCM cannot simulate the large-scale circulation of the atmosphere because the drivers are planetary in scale (e.g., the difference in net radiation between equator and poles), necessitating a global domain. So, for example, an RCM cannot generate dynamical systems like the mid-latitude storm tracks, which instead must be supplied by a GCM. It is in the context of this GCM-provided large-scale circulation that the smaller-scale features described above evolve. This leads to the basic question of dynamical downscaling: how best to close the system? In other words, what is the optimal method for importing information from the GCM into the RCM so as to preserve any desired features of the large-scale circulation patterns without compromising the ability of the RCM to develop realistic smaller scales?
The most common practice has been to assimilate the GCM fields into a narrow strip at the lateral boundaries of the RCM domain. This technique is commonly referred to as “lateral nudging,” and follows Davies (1976). Everywhere else in the domain, the RCM develops its own solution, which it is hoped will evolve consistently within the envelope defined by the GCM flow at the boundaries. This approach is widely used and has yielded valuable results in a number of different applications across the field of regional climate modeling. It is the approach that is used in all the downscaling work contributing to this report. The major perceived advantage of this approach is that it allows for the possibility of the RCM correcting biases not only in the relatively fine-scale, near-surface temperature, and precipitation features, but also in continental-scale circulation patterns. For example, Gustafson and Leung (2007) illustrate how a better representation of the Rockies leads to improvements in the overall flow patterns over the United States when MM5 is used to downscale the GISS II′ GCM simulation.
Recent work (see Rockel et al., 2008; Miguez-Macho et al., 2004, 2005; Castro et al., 2005; von Storch et al., 2000), however, suggests that this lateral nudging approach can be problematic and introduce additional biases of its own. Specifically, if the RCM captures the energy of the large-scale flow only through assimilation at its lateral boundaries, two problems can arise. First, the energy of the large-scale circulation can be progressively lost as a result of several factors as it makes its way into the domain from the RCM boundaries. This lost energy cannot be re-supplied by the RCM, since, as already noted, the drivers are planetary in scale. A potential consequence, then, is weaker large-scale circulation features in the RCM compared to the GCM. Second, the large-scale flow field can be modified significantly as it makes its way
3-43
across the RCM domain. This can cause problems at the RCM boundaries that, in turn, can introduce artificial flow features back in the main body of the model domain. For example, the jet stream entering the western boundary of the RCM domain will encounter the steeper (because higher-resolution) Rockies and be deflected, so that by the time it reaches the eastern boundary, it will not be consistent with the GCM boundary condition there. Both of these problems are more pronounced with larger RCM domains and coarser RCM resolution.16
One method for handling these problems is so-called “spectral nudging,” i.e., nudging applied not at the lateral boundaries at all spatial scales, but instead applied at all locations in the RCM domain (above the PBL at least) but only for the longest waves that are resolved in the GCM (see Miguez-Macho et al., 2004 and von Storch et al., 2000 for descriptions of the technique). At this time, whether lateral nudging or spectral nudging is preferable is just becoming an active research question: does one take the large-scale flow field of the GCM as “truth” and force the RCM to conform to it as closely as possible, or does one instead allow the RCM to evolve a more independent circulation? Therefore, the implications for simulating air quality are as yet unclear, since the downscaled simulations carried out to date for this assessment have all used the lateral nudging approach.
Given what we do know at this time about dynamical downscaling, however, the following should be considerations when interpreting the regional air quality results presented in this section:
• The RCM may not faithfully capture important features of the large-scale circulation
patterns present in the driving GCM. In particular, the large-scale flow might be too weak in the RCM, leading to a proportionally too-strong influence of more local-scale forcing, like convection. Alternatively, there might be artificial flow features introduced by discrepancies between the RCM and GCM at the boundaries.
• Even if the RCM reproduces the GCM’s large-scale circulation very closely, it may still simulate different air quality patterns because of differences in the way it simulates convective clouds and rainfall, or other fine-scale processes, embedded within this large-scale flow.
Either or both of these considerations may help explain why, as mentioned previously, the influence of a shift in the storm track present in the Mickley et al. (2004) GCM experiment does not show up as clearly when this same GCM simulation is downscaled using MM5 (Nolte et al., 2008; Leung and Gustafson, 2005). Precisely attributing these differences between the downscaled results and the driving global simulation remains a key task in the furthering of our
16 To date, these two potential pitfalls of lateral nudging have mostly been investigated for RCM simulations driven by global reanalysis data and not GCM output, and there may be differences between the two in the impact on the downscaled fields.
3-44

understanding of the impacts of global climate change on regional air quality, and it remains the subject of ongoing investigation.
In any case, the strong influence of the GCM-simulated climate on the downscaled results is inescapable, regardless of the methodological details. Gustafson and Leung (2007) emphasize that the GCM chosen will strongly impact any downstream regional air quality findings. Nolte et al. (2008) show clearly that a large portion of the bias in the NERL group’s regional simulations for the eastern United States can be traced directly to an incorrect northeastward displacement of the Bermuda High in the driving GISS II′ GCM simulation. This and similar results, then, underscore again the discussion from above: quantifying the biases and characteristics of the individual global model simulations being relied upon for representing future climate change is of critical importance for the problem of global change impacts on air quality. 3.4.3 Uncertainties in Chemical Mechanisms
The differences in simulated O3 as a function of isoprene chemistry, as discussed in Section 3.3.2, highlight the importance of the choice of regional air pollution modeling mechanisms in investigating the potential for climate-induced changes in air quality. Differences in simulated O3 concentrations among modeling studies may be attributed, in part, to differences in the choice of photochemical mechanism. Each mechanism, in turn, will have characteristic uncertainties as well as biases in simulated O3 concentrations, due to uncertain information about the chemical reactions represented by the model mechanism, and the simplifying assumptions used to optimize computational speed.
For example, Atkinson (2000) listed several sources of scientific uncertainty in air quality photochemical modeling mechanisms. Note that most of these uncertainties relate to the oxidation of biogenic compounds:
• Quantitative knowledge of the rate constants and mechanism of the reactions of organic
peroxy (RO2) radicals with NO, HO2 radicals, and other RO2 and NO3 radicals
• Additional data concerning the organic nitrates yields from the reactions of organic peroxy radicals with NO as a function of temperature and pressure
• Knowledge of reaction rates of alkoxy radicals for decomposition, isomerization and reaction with O2, especially alkoxy radicals other than those formed from alkanes and alkenes (for example, from hydroxyl-compounds, ethers, glycol ethers, and esters)
• The detailed mechanisms of the reactions of O3 with alkenes and VOCs containing >C=C< bonds (this involves understanding the reactions of the initially energy-rich biradicals and of the thermalized biradicals formed in these reactions)
3-45

• Studies of the thermal decompositions of other atmospherically-important reactions of the higher PANs, including, for example, CH2=C(CH3)C(O)OONO2 formed in the atmospheric photo-oxidation of isoprene
• Further understanding of the products and mechanisms of the reactions of monoterpenes and oxygenated VOCs (including 2-methyl-3-buten-2-ol) emitted from vegetation with OH radicals, NO3 radicals and O3
• Improved knowledge of the mechanisms and products of the reactions of OH-aromatic adducts with O2 and NO2
• An improved understanding of the tropospheric chemistry of many oxygenated VOCs formed as first-generation products of VOC photooxidations, including but not limited to carbonyls (including unsaturated dicarbonyls), di-unsaturated dicarbonyls, and unsaturated epoxy-carbonyls), hydroperoxides, and esters
• A quantitative understanding of the reaction sequences leading to products which gas/particle partition and lead to secondary aerosol formation
Compounding the uncertainties created by incomplete information about the chemical
pathways, and their associated rate constants, is the practical necessity for abbreviating the overall chemical reaction scheme to improve the computational speed of the air quality model. A photochemical oxidation mechanism that explicitly treated all of the known atmospheric reactions would have to include more than 20,000 reactions and several thousand organic reactants and products (Dodge, 2000). Reaction schemes like those used by the research teams participating in the EPA assessment program have been streamlined to minimize the number of reaction steps, either by lumping several relevant organic compounds into classes that are given “average” reaction rates, or by ignoring reaction pathways that appear to be unimportant in determining the concentrations of the targeted pollutant. These design choices are made through a process of evaluation against observational data. Mechanisms may also be fine-tuned to produce output that better fits the ambient data by adjusting the reaction rate constants within the laboratory-established experimental uncertainty range. Furthermore, differences exist amongst models in the size of the time steps used for calculating pollutant concentrations. Given the complex, nonlinear, nature of O3 production, these differences tend to result in differences in predicted O3 concentrations among models. See also Fine et al. (2003) for additional discussion of many of these issues.
A number of intercomparison studies of photochemical mechanisms have been reported in the air quality literature: e.g., see Russell and Dennis (2000), Jimenez et al. (2003), and Faraji et al. (2008), among many others. For example, Jimenez et al. (2008) compared box model calculations, with identical inputs and boundary conditions, for several state-of-the-art photochemical mechanisms. They found that the calculated average and maximum O3
3-46

concentrations, along with the concentrations for nine related chemical species, varied widely between these mechanisms. Gilliland et al. (2008) evaluated the performance of the CB-IV and SAPRC99 chemical mechanisms in a study of model response to NOx reductions associated with the implementation of the NOx SIP Call. They found that CB-IV significantly underestimates the contribution of O3 (and its precursors) from long-range transport, and it is less successful than the SAPRC99 mechanism at capturing the effects of meteorological changes on O3 concentrations.
Variability in simulated O3 concentrations among photochemical mechanisms does not necessarily imply that any one mechanism is incorrect: rather, that each may have been optimized for different local or regional conditions. Given the necessity of simplifying photochemical mechanisms for the sake of computational efficiency, future studies of climate change-induced air quality change might reasonably include photochemical mechanisms that have been tailored to perform best under a range of well defined conditions consistent with the emissions, meteorological, and land-use conditions under consideration.
Additional detailed discussions of both well understood and highly uncertain O3 photochemistry can be found in the U.S. EPA Air Quality Criteria Document for O3 (U.S. EPA, 2006). 3.5 SYNTHESIS CONCLUSIONS AND FUTURE RESEARCH NEEDS
This section concludes by collecting and summarizing the major points that have emerged from the scientific synthesis. These help address the goals of this report by addressing questions like “What new findings are emerging from the body of work that EPA has made possible?” and “What have we learned about our ability to simulate potential future changes in U.S. regional air quality due to climate change?” Specifically,
• Across all of the modeling experiments, global and regional, carried out by the different groups, simulated global climate change causes increases in summertime O3 concentrations over substantial regions of the country. For nearly every region of the country, at least one (usually multiple) of the modeling groups found that climate change caused increases in summertime O3 concentrations.
• For summertime-mean MDA8 O3, the increases are in the 2−8 ppb range.
• The largest increases in O3 concentrations in these simulations occur during peak pollution events. For example, the increases in 95th percentile MDA8 O3 tend to be significantly greater than those for summertime-mean MDA8 O3.
• Though in agreement on the above points, the different modeling systems did not necessarily simulate the same regional patterns of climate-induced O3 changes, with the individual simulations showing some regions of little change, or even decreases, in addition to the O3 increases.
3-47
• These differences in the regional patterns of O3 changes result from variations across the simulations in the patterns of mean changes in key meteorological drivers, such as temperature and surface insolation. The modeling experiments provide examples of regions where simulated future changes in meteorological variables either have reinforcing or competing effects on O3 concentrations. Figure 3-11 shows the mean and standard deviation in future-minus-present MDA8 O3 differences across all seven sets of simulation results displayed in Section 3.3.
• For example, regions where the changes in simulated temperature and insolation are in the same direction tend to experience O3 concentration changes in a similar direction, while temperature and insolation varying in opposite directions tends to correspond with mixed O3 changes. Figure 3-12 shows regional averages across MDA8 O3 concentration differences and the differences in these drivers for the sub-regions shown in Figure 3-13.
• Large-scale circulation patterns play an important role in modifying these local meteorological drivers. For example, how a given modeling system simulates changes in key circulation features, like the mid-latitude storm track or the Bermuda High, has a strong impact on the simulated future O3 concentrations.
• Other factors to which the patterns in the simulated meteorological variables appear to be highly sensitive include the choice of convection scheme and whether or not the global model outputs are dynamically downscaled with an RCM.
• Certain regions show greater agreement than others. For example, there is very generally more agreement on the spatial patterns of climate-induced increases for the eastern half of the country than for the West, though parts of the Southeast show some of the strongest disagreements across the modeling groups. Even for these regions, however, at least some of the models show substantial climate-induced O3 increases.
• Across nearly all simulations, climate change is associated with simulated increases in biogenic VOC emissions over most of the United States, with especially pronounced increases in the Southeast.
• These biogenic emissions increases do not necessarily correspond with O3 concentration increases, however, depending on the region and modeling system.
• One factor in this, as highlighted by the global modeling results, is that the response of O3 to changes in biogenic emissions may depend sensitively on how isoprene chemistry is represented in the model. Models that recycle isoprene nitrates back to NOx may tend to simulate greater O3 concentration increases in regions with biogenic emissions increases than models for which isoprene nitrate is a terminal sink for NOx.
• Interannual variability plays a critical role in determining seasonal-average O3 levels in a given year. Some of the modeling groups found that, in some regions of the United States, the average increase in MDA8 O3 concentrations from the present to the 2050s as a result of climate change was as large as the present-day year-to-year variability. In other words, climate change has the potential to push O3 concentrations in extreme years beyond the envelope of natural interannual variability.
3-48

3-49
Figure 3-11. The mean (top two panels) and standard deviation (bottom two panels) in future-minus-present MDA8 O3 concentration differences across (left-hand panels) all seven experiments (five regional and two global) shown in Figures 3-1, 3-9, and 3-10 and, for comparison purposes, (right-hand panels) not including the WSU experiment because it shows differences for July only, while the other experiments show JJA differences.
Mean MDA8 O3 (ppb)Mean MDA8 O3 (ppb)
Standard Deviation in MDA8 O3 (ppb) Standard Deviation in MDA8 O3 (ppb)
40N
30N
40N
30N
40N
30N
40N
30N
110W 100W 90W 80W 110W 100W 90W 80W
0.4 0.8 1.2 1.6 2.0 2.4 2.8 3.2 3.6 4.0 4.4 4.8
110W 100W 90W 80W 110W 100W 90W 80W
-4.5 -3.5 -2.5 -1.5 -0.5 0.5 1.5 2.5 3.5 4.5 5.5 6.5 7.5 8.5
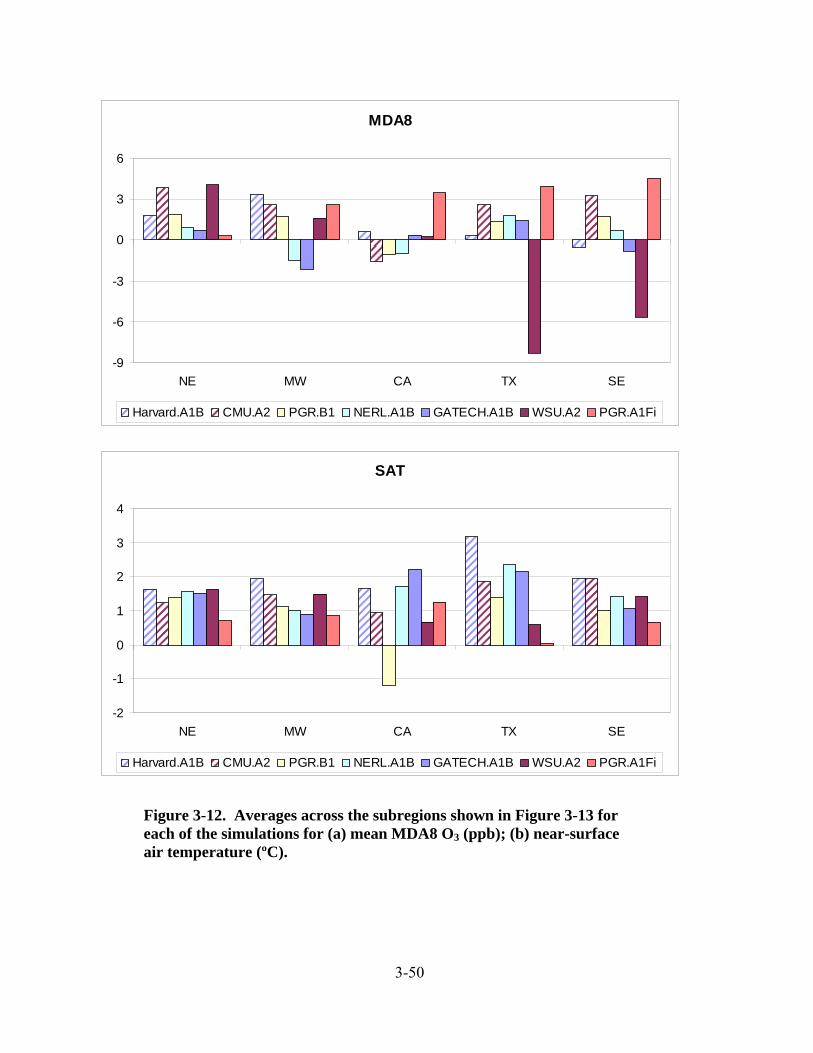
MDA8
-9
-6
-3
0
3
6
NE MW CA TX SE
Harvard.A1B CMU.A2 PGR.B1 NERL.A1B GATECH.A1B WSU.A2 PGR.A1Fi
SAT
-2
-1
0
1
2
3
4
NE MW CA TX SE
Harvard.A1B CMU.A2 PGR.B1 NERL.A1B GATECH.A1B WSU.A2 PGR.A1Fi
Figure 3-12. Averages across the subregions shown in Figure 3-13 for each of the simulations for (a) mean MDA8 O3 (ppb); (b) near-surface air temperature (ºC).
3-50

SWDOWN
-20
-15
-10
-5
0
5
10
15
20
25
NE MW CA TX SE
Harvard.A1B CMU.A2 PGR.B1 NERL.A1B GATECH.A1B WSU.A2 PGR.A1Fi
VOC
-12
-8
-4
0
4
8
12
16
20
NE MW CA TX SE
Harvard.A1B CMU.A2 PGR.B1 NERL.A1B GATECH.A1B WSU.A2 PGR.A1Fi
Figure 3-12 continued. Averages across the subregions shown in Figure 3-13 for each of the simulations for (c) surface insolation (W m-2); and (d) biogenic isoprene emissions (g Carbon m-2 sec-1).
3-51

Figure 3-13. The averaging subregions used in Figure 3-12.
• It also highlights the fact that the amount of future-minus-present change in O3 concentration simulated will likely depend strongly on the choice of present and future simulated years to compare, and that multi-year simulations are desirable for producing findings that are more robust.
• In addition, while this analysis focuses on summertime results, some of the groups also found increases in O3 concentrations in some regions in the spring and fall, suggesting the possibility of an extension of the O3 season under climate change.
These findings should be interpreted as speaking to the question, “How does the system
work?” rather than the question, “What will happen in the future?” They provide insight into the subtleties and complexities of the interactions between climate, meteorology, and air quality, thereby helping to build intuition about the richness, and range of behaviors, of the climate-air quality system. They also illustrate how valuable the modeling systems developed for this assessment can be for exploring this problem.
This improved system understanding, combined with a clear appreciation of the important uncertainties, opens the doors to a wide range of future applications based on this knowledge and these tools. For example, the results of modeling experiments have the potential
3-52
to provide guidance as to whether, for example, statistical relationships based on historical observations of O3 and temperature will serve as accurate approximations of the effects of climate change in a given region. Other applications might include evaluating the potential for unintended consequences of a particular policy choice, e.g., whether tree plantations for carbon sequestration might harm air quality in a given region in the face of future climate change.
In addition, these findings highlight a number of areas where further research is needed:
1. First, as has been emphasized throughout, an improved understanding of how well models simulate the large-scale circulation patterns that are important for air quality is needed. This issue was being considered at least as early as 1991, when the NRC pointed out that whether a GCM simulated a persistent high or low pressure pattern over a given region had the potential to counteract any increase in O3 associated with warmer temperatures, through changes in other meteorological drivers (NRC, 1991). The NRC also pointed out in this report that GCMs do not in general simulate the same shifts in pressure patterns in response to increases in greenhouse gases. As discussed above in Section 3.4, these kinds of disagreements among models persist today.
2. As a related point, there is a need for an improved understanding of how well RCMs can downscale changes in these GCM-simulated circulation patterns, as well as a need for more insight into the sensitivity of these downscaled regional simulations to model parameterizations, including convection schemes, but also expanding to PBL, radiative transfer, microphysics, and land-surface schemes.
3. Recalling the discussion surrounding Box 3-1, a critical component of addressing points 1 and 2 above will be extending efforts, initiated in this first phase of the assessment, to evaluate the GCM- and RCM-based systems for the meteorological variables, and especially the temporal statistics of the meteorology, most appropriate for air quality: for example, long-term average changes in the frequency, duration, and intensity of stagnation episodes driven by synoptic-scale variability. This will need to include outputting and analyzing the required quantities, at the required temporal frequency, from the models, as well as further analyses of historical observational data.
4. Development and refinement of techniques for systematically exploring the effects of the modeling uncertainties are also needed, including ensemble methods, techniques for blending ensemble approaches with dynamical downscaling, and reduced form models.
5. An issue raised in a small subset of the results discussed in this section is whether or not the possible future extension of the O3 season into the spring and fall is robust across more simulations. Additional simulations that go beyond summertime are needed to address this.
6. Another issue arising from a small subset of the results is the question of interannual variability. Particularly in the regional modeling results, to date there is disparity in the number of years simulated across the different groups. Moving forward, more precise quantification of the magnitude of mean future O3 changes relative to interannual variability, as well as the potential for future increases or decreases in interannual variability itself, is needed.
3-53

Moving beyond meteorology, the results to date also suggest important gaps in our understanding of issues related to chemistry and emissions:
1. More research is needed into the links between climate, biogenic emissions, and O3. The
results presented here highlight the importance of correctly representing isoprene nitrate chemistry in models to accurately capture the response of O3 to changes in emissions. In addition, there are other uncertainties in chemical mechanisms with the potential to influence climate change-air quality impacts that require further study.
2. Improving biogenic emissions inventories and process models of the response of biogenic emissions to climate and atmospheric composition changes should also be a priority.
3. Changes in deposition velocity as a function of the impact of changing CO2 concentrations on stomatal conductance could also be incorporated into the modeling systems.
4. An overarching issue that has not been fully addressed to date is whether or not the overall O3 chemical regime change as a function of climate change, and/or global atmospheric composition change (e.g., as a function of changing concentrations of CH4 and other species).
5. As already discussed, while some of the groups have also carried out simulations of PM, in addition to O3, the focus in this section is only on the O3 results. Our understanding of how to represent PM chemistry in modeling systems is more limited, and there are a number of additional complexities surrounding PM, including the fact that it consists of multiple species, and that precipitation is a more important primary meteorological driver for PM than for O3, an issue because the uncertainties in modeling precipitation are much greater than in modeling, for example, temperature. Much additional research is needed on simulating the potential impacts of climate change on PM. Brief summaries of the ongoing work on PM under this assessment, as well as on emissions and chemistry issues, is provided next, in Section 4.
Furthermore, there are a wide range of issues related to anthropogenic emissions of precursor pollutants that will become important as the assessment moves into its next phase. These include the impacts of changes, on future emissions in the United States (and worldwide), in:
• Energy use • Land use • Agricultural practices • Transportation patterns • Demographics • Technology
3-54

3-55
Building on the modeling experiments discussed here, one major consideration is that much additional work is needed to construct emissions scenarios that are realistic and internally self-consistent across both greenhouse gases and precursor pollutants. These and other issues will feature prominently in Phase II of the assessment, and they are previewed in Section 4.
Finally, there are a number of issues for the air quality management community to consider, related to the potential for scientific research to provide improved decision support. These include how best to inform the scientific community about the specific air quality metrics to focus on in research that would best inform management activities, as well as how best to address mismatches between the timescales of air quality management and long-term global climate change.

4 FUTURE DIRECTIONS 4.1 PHASE II OF THE GLOBAL CHANGE AND AIR QUALITY ASSESSMENT
As outlined in Section 2, Phase II of the assessment program requires a transition from climate-only studies to an evaluation of the integrated effects of changes in climate and changes in anthropogenic air pollutant emissions. Simplistic assumptions about future U.S. emissions are of limited usefulness for evaluating the possible range of climate change impacts on air quality at scales that are of interest for planning and management. Therefore, EPA ORD has initiated several projects that are developing new methods and modeling tools for creating regional-scale emissions projections for the United States. These projects recognize that the important drivers of future changes in air pollutant emissions are linked. For example, economic factors influence population migration which, in turn, affects land use, thereby affecting air pollutant emissions via choices in transportation modalities. To realistically represent the feedbacks among the drivers of air pollutant emissions, modeling systems must be developed that capture these links between underlying processes.
Phase II of the air quality assessment will also build upon the insights gained in Phase I from the efforts of the contributing research teams in producing climate change-only air quality simulations, including the effects of particular modeling choices. This section, therefore, begins by highlighting efforts underway to improve the climate-air quality modeling systems, and planned efforts to develop efficient approaches for evaluating the impact of uncertainties on model outputs. An overview of the projects focused on devising modeling tools to capture the processes governing the underlying drivers of air pollutant emissions, and the links between them, follows. Air pollutant emissions scenarios will eventually be shared with the climate-air quality modeling teams, who will, in turn, simulate the integrated effects of climate and emissions changes on regional U.S. air quality.
4.2 EXTENDING THE MODELING SYSTEMS Section 3 concluded with a discussion of modeling uncertainties and research needs to be addressed. Ongoing and upcoming activities designed to achieve these improvements and needed advances in modeling capability are discussed in the following subsections. 4.2.1 Exploring Modeling Uncertainties
Ensemble modeling techniques are being applied to more fully explore the effects on model outputs of uncertainties in the global-to-regional climate and air quality modeling systems. This involves blending multiple alternative GCMs, RCMs, and RAQMs with multiple
4-1

emissions scenarios and model physical parameterizations (including both PBL and convection schemes). In addition, some of the work will explore the use of Bayesian weighting of ensemble members based on their skill in representing both observed climate and air quality, as a means of reducing the number of ensemble members required for capturing the probable range of future climate changes. Adding new GCMs, RCMs, and RAQMs to the suite used in Phase I is also an important element of this work.
Several modeling teams plan to evaluate potential changes in the length and timing of annual O3 seasons under a changed climate. To better capture and characterize changes in interannual variability in different climate regimes, simulations of additional present-day and future years with the global-to-regional modeling systems are also planned.
Finally, the groups discussed in Section 3 that carried out global scale-only simulations are in the process of conducting comparable studies using downscaled global-to-regional modeling systems. The application of these new systems to simulations of future regional climate and air quality will also expand the range of models, scenarios, and methodologies in the assessment. Added to the results obtained to date, these new simulations have the potential to increase the level of confidence in, and/or add nuance to, key conclusions made in this report. 4.2.2 Additional Model Development
Substantial uncertainty remains in the modeling of current biogenic VOC emissions. EPA ORD is currently supporting studies to better define the processes governing biogenic emissions to improve their representation in regional air quality modeling systems. These studies include work to identify and quantify species-dependent emissions sensitivities to temperature and other meteorological variables, to changes in forest composition in response to changing climate, and to changes in ambient CO2 concentrations, based on observations and biochemical modeling.
The accumulating body of new scientific insights is being used to design biogenic emissions models with greater process realism. These models are also being extended to include complementary capabilities, such as dynamic vegetation sub-models to capture the two-way coupling between land cover and climate. These improvements will assist in increasing our understanding of the potential role of biogenic emissions changes in global change-related impacts on air quality.
The importance of feedbacks between climate change and regional air quality is not presently well understood. Should climate change produce significant changes in aerosol chemistry and composition, or substantial changes in tropospheric O3, those perturbations could feed back onto the Earth’s radiation budget, possibly driving further changes in climate. Other research efforts within the assessment program include an investigation of the importance of
4-2

these two-way feedbacks between climate change and air quality. To explore this question, NERL is expanding the pollutant chemistry represented in the Weather Research and Forecast Model with Chemistry (WRF/Chem). Simultaneously, an extramural effort funded by the STAR program is directly linking WRF with the CMAQ model in a combined WRF-CMAQ system. Both will be applied in studies of future climate and air quality. Downscaling GCM simulations of future climate using WRF/Chem and WRF-CMAQ will allow for the assessment of possible long-term impacts of global change on regional air quality while accounting for feedbacks between meteorology, air quality, and radiation in a unified modeling framework. 4.2.3 Additional Pollutants—PM Some of the groups whose O3 results are featured in Section 3 have also carried out simulations of PM. Because of the additional complexities and uncertainties associated with PM and its response to climate change, these results were not incorporated into the synthesis. However, a few preliminary results suggest that
• Globally, PM generally decreases as a result of simulated climate change (with anthropogenic emissions held constant), due to increased atmospheric humidity and/or increased precipitation;
• Regionally, simulated climate change produces both increases and decreases in PM (on the order of a few percent) in 2050, depending on the region of the United States, with the largest increases in the Midwest and Northeast;
• The responses of the individual species that make up net PM (e.g., sulfate, nitrate, ammonium, black carbon, organic carbon, etc.) to climate change are highly variable, depending on the chemistry and transport characteristics of each species;
• Key uncertainties to which simulated PM is sensitive include model precipitation, model aerosol chemistry, aerosol-cloud interactions, volatilization of semi-volatile PM species, such as nitrate and secondary organic aerosol (SOA), and assumed future air pollution emissions.
Building on these findings, work underway, both within EPA and funded through the STAR program, is continuing to explore the impacts of climate and emissions changes on PM in coupled climate and air quality modeling systems. Efforts to improve the relevant aerosol chemistry in these models, as well as to introduce the capability of two-way coupling between chemistry and meteorology (as noted above) are also underway. In addition, substantial work is being done outside the EPA sphere that is expected to contribute knowledge and techniques as the assessment moves forward.
4-3

4.2.4 Additional Pollutants—Mercury Some of the modeling groups already highlighted in this report, in conjunction with
several new groups, will also be extending our understanding of the impact of global change on air pollution to mercury (Hg). Climate change can potentially impact a number of atmospheric processes that help determine the fate of Hg, including heterogeneous oxidation of gas-phase Hg, dry deposition of elemental, reactive gas-phase and particulate Hg, and Hg chemistry in the presence of fog, clouds, and photochemical smog.
These groups will use both models and observational datasets to explore Hg chemistry and transport as a function of climate and emissions changes. The focus will be on present and future Hg distribution for the United States as a whole, as well as for particular regions, e.g., the Great Lakes, Florida. In addition, this work will be aimed at improving the Hg chemistry in the linked climate and air quality modeling systems by incorporating additional reactions and refining existing representations. 4.3 COMBINED IMPACTS OF CLIMATE AND EMISSIONS CHANGES:
PRELIMINARY WORK Several of the modeling teams that produced the simulations discussed in Section 3 also
conducted preliminary evaluations of the combined effects of changes in anthropogenic air pollutant precursor emissions and changes in climate on regional U.S. quality. The general approach taken was to assume that, rather than remaining constant at the NEI 1999−2000 levels, future U.S. emissions of pollutant precursors, i.e., NOx, SO2, VOCs, and CO, scaled in ways that were consistent with the IPCC SRES scenarios.
The major findings that emerged from these sensitivity studies are as follows: First, that the combined effects of climate and anthropogenic precursor emissions changes are much more sensitive to the assumptions about future emissions trajectories than differences in simulated climate across models and groups. For example, simple scaling of future emissions to match the gross assumptions of the IPCC A1b or B1 SRES scenario resulted in substantial reductions in NOx emissions, with corresponding reductions in simulated future O3 that dominated any increases associated with climate change. In contrast, using future emissions consistent with the weaker pollutant control assumptions in the “dirtier” A2 or A1Fi scenarios tended to result in climate and emissions producing changes of comparable magnitudes. Second, the effects of climate and emissions changes are not, in general, additive. In other words, the degree of “climate penalty” on air quality is itself highly dependent on the emissions levels.
Therefore, these results highlight the need for additional work to develop more sophisticated, regionally detailed scenarios of U.S. anthropogenic precursor pollutants that account for population, economic, energy, and transportation changes, along with work to
4-4

improve the representation of natural emissions sensitive to climate and land-use changes. These efforts are highlighted in the next sub-section.
4.4 MODELING THE DRIVERS OF AIR POLLUTANT EMISSIONS
Human activities, such as population growth and migration, economic growth, land use, and technology change are key drivers affecting emissions. Changes in human activity patterns impact pollutant emissions across the globe, and, combined with global scale circulation patterns, influence the long-range transport of air pollution into the United States.
There is a gap in our understanding of how these factors will interact to influence air quality at urban and regional scales in the United States. In addition, while human activities generate the largest share of the U.S. air pollutant emissions burden, biogenic and wildfire emissions also contribute to the degradation of regional-scale air quality. The vegetation composition and biomass density of forest ecosystems help determine both the emissions of biogenic VOCs and the intensity and frequency of wildfires. These properties are sensitive, to varying degrees, to changing climate and to local and regional development. Future progress will require integrating population growth and land-use models with economic forecasts, technology models, travel demand models, mobile source models, and forest composition and wildfire process models to create emissions modeling systems that can be used to blend comprehensive scenarios of future air pollution emissions with those of future climate and meteorology changes (Figure 4-1).
As described in Section 2, evaluating the combined air quality impacts of changing anthropogenic emissions levels, changing biogenic and wildfire emissions levels, and changing climate is a critical goal of Phase II of the air quality assessment effort. To accomplish this, the assessment program has undertaken a significant research effort to develop and/or apply the necessary emissions projection tools. The following sub-sections highlight efforts underway to investigate the critical processes leading to pollutant emissions changes and to incorporate this information into modeling tools capable of realistically simulating long-term emissions changes.
A growing U.S. population can be expected to lead to increased energy and transportation service demands, potentially leading to increased pollutant emissions, depending on control strategies implemented. In addition, internal migration of the U.S. population could redistribute pollutant emissions geographically.
The Cohort-Component methodology17 is being used to develop a range of scenarios of future U.S. population. These scenarios build on the Census Bureau’s population projections, systematically incorporating assumptions to express the differences captured in the IPCC SRES
17 For example, see http://www.census.gov/population/www/projections/aboutproj.html.
4-5

Figure 4-1. Integrated system of future climate, meteorology, and emissions scenarios. Population growth, migration, and land use. The dashed blue lines represent feedbacks.
storylines. The migration component of the demographic model uses a regression-based “gravity” model that depends on the functional connectivity of each county to all others and amenity values to estimate production and attraction values for domestic migration. This effort is exploring the wide range of assumptions at national, state, and local scales in the United States that are consistent with the general SRES storylines.
Future development patterns will result in changes in both the quantity and location of pollutant emissions. The demographic-migration model described above is being coupled with a spatial allocation-type land-use model to develop urban and exurban growth projections consistent with the SRES storylines. The potential of these land-use scenarios for spatially allocating emission sources is under investigation.
4-6

4.4.1 Economic Growth and Technology Choices Absent additional air pollution controls and/or improvements in technologies, economic
growth would be expected to increase emissions. Other trends, like further transformation from a manufacturing-based to a service-based economy, can also lead to changes in domestic emissions. A range of plausible economic scenarios to capture these factors is needed as part of an integrated evaluation of human-driven change in future emissions. Several models have been employed by OAR in policymaking, and the EPA’s Global Change Research Program is planning to evaluate them (and others) for application in the Phase II assessment effort.
Changes in future anthropogenic emissions cannot be understood apart from the development, deployment, and use of energy and transportation technologies. To assist in defining those relationships, a Market Allocation (MARKAL) energy-systems modeling framework has been developed to examine the most emission-intensive sectors of the U.S. economy: transportation and electric power production. MARKAL maps the energy economy from primary energy sources, through their refining and transformation processes, to the point at which a variety of technologies (e.g., classes of light-duty personal vehicles, heat pumps, or gas furnaces) service end-use energy demands (e.g., projected vehicle miles traveled, space heating). A large linear programming model, MARKAL determines the least-cost pattern of technology investment and use required to meet specified demands, and then calculates the resulting criteria pollutant and greenhouse gas emissions. Preliminary scenarios of potential future emissions and emissions growth factors for energy system technologies, such as combustion technologies in the electricity generation, transportation, industrial, residential, and commercial sectors, have been generated for the United States. Particular attention has been paid to alternative-fuel vehicles (e.g., ethanol-gasoline, plug-in gasoline-electric hybrids, hydrogen fuel cell) and analyses to date show that different technology development and penetration scenarios can have greatly differing emissions consequences.
Research has also been conducted on the response of electricity consumption to warming from climate change, capacity siting and dispatch decisions, and characterization of emerging energy generation technologies in terms of cost and cost projections and learning parameters. This modeling system has been used to analyze the effect of climate change upon the temporal and spatial distributions of NOx emissions in the Mid-Atlantic and Midwest power markets. An additional study investigates air quality consequences from the broad adoption of ethanol-gasoline, plug-in gasoline-electric hybrids, and wind-electrolysis-hydrogen fuel-cell vehicles. The consequence of this technology shift will be explored for Los Angeles, the Central Valley, and Atlanta over the next 50 years.
4-7

4.4.2 Land Use and Transportation A critical and previously unexplored dimension in projecting air quality in response to
human factors is the spatial distribution of the emissions projected to result from land-use and transportation choices. Several studies of the connection between socioeconomic forces, land-use planning and development patterns, policy design, and future air quality are underway as part of the assessment’s research program. Specific studies include
• In Washington DC, development and application of a flexible modeling framework to
estimate long-term mobile sources emissions;
• In Chicago, an examination of the consequences of continued deindustrialization of U.S. manufacturing and its impact on the city’s manufacturing-heavy metro area;
• In the Upper Midwest, a study of the air quality changes associated with a “smart growth” land-use and development policy over the next 25 to 50 years;
• In the San Joaquin Valley, CA, investigation of the effect on emissions from combined changes in economics, land-use, water constraints, transportation, and stationary sources;
• In the Charlotte, NC metro area, an examination of the influence of development patterns (e.g., transit oriented development, dense mixed-use development, development supportive of non-motorized transportation modes for non-work trips, neo-traditional suburbs, new urban core development, and redevelopment) on the spatial characteristics and quantity of emissions;
• In Austin, TX, a comparison of emissions, air quality, and exposures from an integrated transportation-land-use model with four urban growth scenarios developed through a regional “visioning” initiative known as Envision Central Texas;
• In the Puget Sound region, a project to integrate an activity-based travel model component and a network assignment component into a land-use model (UrbanSim) and to tightly couple this system to air emissions models.
4.4.3 Emissions Changes Due to Changing Ecosystems: Biogenic VOCs
Changing amounts and distributions of biogenic emissions due to land-use and climate changes is potentially a key factor for future air quality, as discussed throughout this report. Past studies have shown that emissions of VOCs from forest ecosystems can cause increases in pollution in near-urban and suburban areas. In one example, VOC emissions from forests near Atlanta entirely offset the effects of the policies put in place to reduce mobile-source emissions.
As described above, substantial uncertainty remains in modeling biogenic emissions. As part of the assessment effort, EPA is supporting studies on the VOC-emitting species in the current climate. Fundamental scientific questions are being addressed concerning the chemical and physical properties of primary and secondary organic aerosols (POAs, SOAs), the identity of
4-8

the biogenic VOCs that form SOAs, and the sensitivity of VOCs, POAs, and SOAs emission and formation rates to changes in environmental conditions. In addition, much research is being done outside the EPA sphere that is expected to contribute new findings to the assessment as it moves forward. 4.4.4 Emissions Changes Due to Changing Ecosystems: Wildfires
Fires, both natural and anthropogenic, have significant impacts on U.S. air quality, especially on PM concentrations. Recent studies show that fires in North America can have important effects on U.S. visibility and air quality on an episodic basis. Climate variability influences the extent and intensity of fires, e.g., moist years followed by dry years produce very favorable conditions for wildfires. Climate change, which is very likely to increase the frequency of precipitation in some areas, drought in other areas, and produce higher temperatures in general, may enhance future fire frequency, extent, and intensity regionally.
Therefore, along with better model representations of the effects of climate change on biogenic VOC emissions, simulations of the effects of climate on air quality should also consider changing levels in wildfire-generated O3 and PM precursor emissions. Three modeling studies are underway that integrate the complex interactions of fire, climate, and air quality and are exploring important uncertainties. Two groups are focusing on the U.S. Southeast as a test case, with the third working to evaluate wildfire changes across the continental United States as a whole. All three teams are working to develop integrated models that account for fire-related changes in ecosystems in a warming climate, such as the extent of vegetative cover and fuel characteristics. State-level fire statistics, along with ground and satellite observations, will be used to evaluate the performance of the modeling systems. In addition, the continental-scale study will develop a climatology of plume heights from forest fires since 2000, and will relate plume heights to area burned for use in the climate change scenarios. 4.4.5 Taking Integrated Emissions Scenarios Through to Future U.S. Regional Air
Quality As shown in Figure 4-1, Phase II of the assessment will involve integrating these demographic, land-use, economics, transportation and energy models to produce a series of future emissions scenarios as input for the integrated climate and regional air quality models developed in Phase I of the program. Building on the improved understanding from the work already accomplished, and the new insights that will emerge in the near future, an important task will be to identify a subset of emission scenarios that capture the range of desired assumptions and outcomes to explore the critical questions of interest in the integrated climate and emissions modeling efforts. Conducting a series of sensitivity test simulations over shorter time periods, so
4-9

4-10
that a wider range of emissions scenarios can be tested, will likely be a key aspect of the research design. The results from these sensitivity tests will provide guidance on which set of scenarios offers sufficient representation of the range of plausible emissions changes for the future.

REFERENCES Atkinson, R. (2000) Atmospheric chemistry of VOCx and NOx. Atmos Environ 34:2063−2101.
Aw, J; Kleeman, MJ. (2003) Evaluating the first-order effect of intraannual temperature variability on urban air pollution. J Geophys Res 108:4365, doi:10.1029/2002JD002688.
Avise, J; Chen, J; Lamb, B; et al. (2009) Attribution of projected changes in summertime U.S. ozone and PM2.5 concentrations to global changes. Atm Chem and Phys 9:1111−1124.
Bell, ML; Goldberg, R; Hogrefe, C; et al. (2007) Climate change, ambient ozone, and health in 50 U.S. cities. Climactic Change, doi:10.1007/s10584-006-9166-7.
Bloomfield, P; Royle, JA; Steinberg, LJ; et al. (1996) Accounting for meteorological effects in measuring urban ozone levels and trends. Atmos Environ 30:3067−3077.
Byun, D; Schere, KL. (2006) Review of the governing equations, computational algorithms, and other components of the Models-3 Community Multiscale Air Quality (CMAQ) modeling system. Appl Mech Rev 59:51−77.
Camalier, L; Cox, W; Dolwick, P. (2007) The effects of meteorology on ozone in urban areas and their use in assessing ozone trends. Atmos Environ 4:7127−7137.
Carter, WPL. (2000) Implementation of the SAPRC-99 chemical mechanism into the models-3 framework. Parepared for the U.S. Environmental Protection Agency, Washington, DC.
Castro, CL; Pielke, RA, Sr; Leoncini, G. (2005) Dynamical downscaling: Assessment of value retained and added using the Regional Atmospheric Modeling System (RAMS). J Geophys Res 110:D05108, doi:10.1029/2004JD004721.
CCSP (Climate Change Science Program). (2003) Strategic plan for the U.S. Climate Change Science Program: A report by the Climate Change Science Program and the Subcommittee on Global Change Research. U.S. Climate Change Science Program, Washington, DC; 202 pp. http://www.climatescience.gov/
CCSP (Climate Change Science Program). (2008) Analyses of the effects of global change on human health and welfare and human systems. A report by the U.S. Climate Change Science Program and the Subcommittee on Global Change Research [Gamble, J.L. (ed.), K.L. Ebi, F.G. Sussman, T.J. Wilbanks, (Authors)], U.S. Climate Change Science Program Synthesis and Assessment Product 4.6, Washington, DC.
CCSP (Climate Change Science Program). (2009) Best practice approaches for characterizing, communicating, and incorporating scientific uncertainty in climate decision making. A report by the U.S. Climate Change Science Program and the Subcommittee on Global Change Research [M.G. Morgan, H. Dowlatabadi, M. Henrion, D. Keith, R. Lempert, S. McBride, M. Small, and T. Wilbanks (Authors)], U.S. Climate Change Science Program Synthesis and Assessment Product 5.2, Washington, DC, 156 pp.
Chameides, WL; Lindsay, RW; Richardson, J; et al. (1988) The role of biogenic hydrocarbons in urban photochemical smog: Atlanta as a case study. Science 241:1473−1474.
Chen, J; Avise, J; Lamb, B; et al. (2009) The effects of global changes upon regional ozone pollution in the United States. Atm Chem and Phys 9:1125−1141.
Civerolo, K; Hogrefe, C; Lynn, B; et al. (2007) Estimating the effects of increased urbanization on surface meteorology and ozone concentrations in the New York City metropolitan region. Atmos Env 41:1803−1818.
R-1

Cooter, E; Gilliam, R; Gilliland, A; et al. (2005) Examining the impact of climate change and variability on regional air quality over the United States. Presented at the U.S. Climate Change Science Program, Climate Science in Support of Decision Making Workshop, Arlington, VA, 14-16 November.
Cox, WM; Chu, S-H. (1993) Meteorologically adjusted ozone trends in urban areas: A probabilistic approach. Atmos Environ 27B:425−434.
Crutzen, PJ. (1972) SSTs: A threat to the earth’s ozone shield. Ambio 1:41−51.
Davies, HC. (1976) A lateral boundary formulation for multi-level prediction models. Q J Roy Meteor Soc 102:405 418.
Dawson, JP; Adams, PJ; Pandis, SN. (2007a) Sensitivity of PM2.5 to climate in the Eastern U.S.: A modeling case study. Atmos Chem Phys 7:4295−4309.
Dawson, JP; Adams, PJ; Pandis, SN. (2007b) Sensitivity of ozone to summertime climate in the Eastern U.S.: A modeling case study. Atmos Environ 41:1494−1511.
Dawson, JP; Racherla, PN; Lynn, BH; et al. (2008) Simulating present-day and future air quality as climate changes: Model evaluation. Atmos Environ 42:4551−4566.
Denis, B; Laprise, R; Caya, D; et al. (2002) Downscaling ability of one-way nested regional climate models: the Big-Brother Experiment. Clim Dyn 18:627-646, doi:10.1007/s00382-001-0201-0.
Dodge, MC. (2000) Chemical oxidant mechanisms for air quality modeling: Critical review. Atmos Environ 34:2103−2130.
Eder, B; Yu, S. (2006) A performance evaluation of the 2004 release of Models-3 CMAQ. Atmos Environ 40:4811−4824.
Eder, B; Kang, D; Mathur, R; et al. (2006) An operational evaluation of the Eta-CMAQ air quality forecast model. Atmos Environ 40:4894−4905.
Faraji, M; Kimura, Y; McDonald-Buller, E; et al. (2008) Comparison of the carbon bond and SAPRC photochemical mechanisms under conditions relevant to southeast Texas. Atmos Environ 42:5821−5836.
Fine, J; Vuilleumier, L; Reynolds, S. (2003) Evaluating uncertainties in regional photochemical air quality modeling. Annu Rev Environ Resour 28:59-106.
Fiore, AM; Horowitz, LW; Purves, DW; et al. (2005) Evaluating the contribution of changes in isoprene emissions to surface ozone trends over the eastern United States. J Geophys Res 110:D12303, doi:10.1029/2004JD005485.
Fishman, J; Ramanathan, V; Crutzen, PJ; et al. (1980) Tropospheric ozone and climate. Nature 282:818−920.
Forkel, R; Knoche, R. (2006) Regional climate change and its impact on photooxidant concentrations in southern Germany: Simulations with a coupled regional climate-chemistry model. J Geophys Res 111:D12302, doi:10.1029/2005JD006748.
Fuentes, J; Lerdau, M; Atkinson, R; et al. (2000) Biogenic hydrocarbons in the atmospheric boundary layer: A review. Bull Amer Meteorol Soc 81:1537−1575.
Gery, MW; Whitten, GZ; Killus, JP; et al. (1989) A photochemical kinetics mechanism for urban and regional scale computer modeling. J Geophys Res 94:12925−12956.
R-2

Gilliam, RC; Hogrefe, C; Rao, ST. (2006) New methods for evaluating meteorological models used in air quality applications. Atmos Environ 40:5073−5086, doi:10.1016/j.atmosenv.2006.01.023.
Gilliland, AB; Hogrefe, C; Pinder, RW; et al. (2008) Dynamic evaluation of regional air quality models: Assessing changes in O3 stemming from changes in emissions and meteorology. Atmos Environ 42:5110−5123.
Guenther, A; Zimmerman, P; Wildermuth, M. (1994) Natural volatile organic compound emissions rate estimates for U.S. woodland landscapes. Atmos Environ 28:1197−1210.
Gustafson, WI; Leung, RL. (2007) Regional downscaling for air quality assessment: A reasonable proposition? Bull Am Meteorol Soc 88:1215−1227.
Hodges, K. (2004) Feature based diagnostics from ECMWF/NCEP Analyses and AMIP II: Model Climatologies. In: The Second Phase of the Atmospheric Model Intercomparison Project (AMIP2) [Gleckler, P. (ed.)]. Proceedings of the WCRP/WGNE Workshop, Toulouse, France, pp. 201-204.
Hogrefe, C; Biswas, J; Lynn, B; et al. (2004a) Simulating regional-scale ozone climatology over the eastern United States: Model evaluation results. Atmos Environ 38:2627−2638.
Hogrefe, C; Lynn, B; Civerolo, K; et al. (2004b) Simulating changes in regional air pollution over the eastern United States due to changes in global and regional climate and emissions. J Geophys Res 109:D22, doi:10.1029/2004JD004690.
Horowitz, LW; Walters, S; Mauzerall, DL; et al. (2003) A global simulation of tropospheric ozone and related tracers: Description and evaluation of MOZART, version 2. J Geophys Res 108:4784, doi:10.1029/2002JD002853.
Horowitz, LW; Fiore, AM; Milly, GP; et al. (2007) Observational constraints on the chemistry of isoprene nitrates over the eastern United States. J Geophys Res 112:D12S08, doi:10.1029/2006JD007747.
Houyoux, MR; Vukovich, JM; Coats Jr., CJ; et al. (2000) Emission inventory development and processing for the Seasonal Model for Regional Air Quality (SMRAQ) project. J Geophys Res 105:9079−9090.
Huang, H-C; Liang, X-Z; Kunkel, KE; et al. (2007) Seasonal simulation of tropospheric ozone over the Midwestern and Northeastern United States: An application of a coupled regional climate and air quality modeling system. J Appl Meteor Clim 46:945−960.
Huang, H-C; Lin, J; Tao, Z; et al. (2008) Impacts of long-range transport of global pollutants and precursor gases on U.S. air quality under future climatic conditions. J Geophys Res 113:D19307, doi:10.1029/2007JD009469.
IPCC (Intergovernmental Panel on Climate Change). (2000) Special report on emissions scenarios. Cambridge, United Kingdom: Cambridge University Press; 595 pp.
IPCC (Intergovernmental Panel on Climate Change). (2001) Climate Change 2001: The Scientific Basis. Contribution of Working Group I to the Third Assessment Report of the Intergovernmental Panel on Climate Change. Cambridge, United Kingdom and New York, NY: Cambridge University Press, 881 pp.
IPCC (Intergovernmental Panel on Climate Change). (2005) Guidance notes for lead authors of the IPCC fourth assessment report on addressing uncertainties. World Meteorological Organization, Geneva, and United Nations Environment Program, Nairobi:4 pp.
IPCC (Intergovernmental Panel on Climate Change). (2007) Climate change 2007: The physical science basis. Contribution of Working Group I to the Fourth Assessment Report of the Intergovernmental Panel on Climate Change [Solomon, S; Qin, D; Manning, M; et al.; (eds.)]. Cambridge, United Kingdom and New York, NY: Cambridge University Press, 996 pp.
R-3

Jacob, DJ; Winner, DA. (2009) Effect of climate change on air quality. Atmos Environ 43:51−63.
Jerrett, M; Burnett, RT; Pope, CA. (2009) Long-term ozone exposure and mortality. N Engl J Med 360:1085-1095.
Jimenez, P; Baldasano, JM; Dabdub, D. (2003) Comparison of photochemical mechanisms for air quality modeling. Atmos Environ 37:4179−4194.
Kunkel, KE; Huang, H-C; Liang, X-Z; et al. (2007) Sensitivity of future ozone concentrations in the Northeast U.S. to regional climate change. Mitig Adapt Strat Glob Change 13:597−606.
Kunkel, KE; Liang, X-Z. (2005) GCM simulations of the climate in the central United States. J Climate 18:1016 1031.
Langner, J; Bergstrom, R; Foltescu, V. (2005) Impact of climate change on surface ozone and deposition of sulphur and nitrogen in Europe. Atmos Environ 39:1129−1141.
Leibensperger, EM; Mickley, LJ; Jacob, DJ. (2008) Sensitivity of U.S. air quality to mid-latitude cyclone frequency and implications of 1980−2006 climate change. Atm Chem Phys 8:7075−7086.
Leung, LR; Gustafson, WI. (2005) Potential regional climate change and implications to U.S. air quality. Geophys Res Lett 32:L16711, doi:10.1029/2005GL022911.
Liang, X-Z; Li, L; Dai, A; et al. (2004a) Regional climate model simulation of summer precipitation diurnal cycle over the United States. Geophys Res Lett 31:L24208, doi:10.1029/2004GL021054.
Liang, X-Z; Li, L; Kunkel, KE; et al. (2004b) Regional climate model simulation of U.S. precipitation during 1982−2002. Part I: Annual cycle. J Climate 17:3510−3529.
Liang, X-Z; Pan, J; Zhu, J; et al. (2006) Regional climate model downscaling of the U.S. summer climate and future change. J Geophys Res 111:D10108, doi:10.1029/2005JD006685.
Liang, X-Z; Xu, M; Kunkel, KE; et al. (2007) Regional climate model simulation of U.S.-Mexico summer precipitation using the optimal ensemble of two cumulus parameterizations. J Climate 20:5201−5207.
Liang, X-Z; Kunkel, KE; Meehl, GA; et al. (2008) Regional climate models downscaling analysis of general circulation models present climate biases propagation into future change projections. Geophys Res Lett 35:L08709, doi:10.1029/2007GL032849.
Liao, K-J; Tagaris, E; Manomaiphiboon, K; et al. (2007) Sensitivities of ozone and fine particulate matter formation to emissions under the impact of potential future climate change. Environ Sci Technol 41: 8355−8361, doi:10.1021/es070998z.
Liao, K-J; Tagaris, E; Manomaiphiboon, K; et al. (2009) Quantification of the impact of climate uncertainty on regional air quality. Atmos Chem Phys 9:865−878.
Lin, C-YC; Jacob, DJ; Fiore, AM. (2001) Trends in exceedances of the ozone air quality standard in the continental United States, 1980-1998. Atmos Environ 35:3217−3228.
Lin, C-YC; Mickley, LJ; Hayhoe, K; et al. (2007) Rapid calculation of future trends in ozone exceedances over the Northeast United States : Results from three models and two scenarios. Presented at the Consequences of Global Change for Air Quality Festival, EPA, Research Triangle Park, NC, 20−21 February, 2007.
Lin, JT; Patten, KO; Liang, X-Z; et al. (2008) Effects of future climate and biogenic emissions changes on surface ozone over the United States and China. J Appl Meteor Clim 47:1888−1909.
R-4

Lynn, BH; Druyan, L; Hogrefe, C; et al. (2004) Sensitivity of present and future surface temperatures to precipitation characteristics. Clim Res 28:53−65.
Lynn, BH; Healy, R; Druyan, LM. (2007) An analysis of the potential for extreme temperature change based on observations and model simulations. J Climate 20:1539−1554.
Meehl, GA; Tebaldi, C. (2004) More intense, more frequent, and longer lasting heat waves in the 21st century. Science 305:994−997.
Meleux, F; Solmon, F; Giorgi, F. (2007) Increase in European summer ozone amounts due to climate change. Atmos Environ 41:7577−7587.
Mickley, LJ; Murti, PP; Jacob, DJ; et al. (1999) Radiative forcing from tropospheric ozone calculated with a unified chemistry-climate model. J Geophys Res 104:30153−30172.
Mickley, LJ; Jacob, DJ; Field, BD; et al. (2004) Effects of future climate change on regional air pollution episodes in the United States. Geophys Res Lett 30:L24103, doi:10.1029/2004GL021216.
Miguez-Macho, G; Stenchikov, GL; Robock, A. (2004) Spectral nudging to eliminate the effects of domain position and geometry in regional climate model simulations. J Geophys Res 109:D13104, doi:10.1029/2003JD004495.
Miguez-Macho, G; Stenchikov, GL; Robock, A. (2005) Regional climate simulations over North America: Interaction of local processes with improved large-scale flow. J Climate 18:1227−1246.
Morris, RE; Guthrie, PD; Knopes, CA. (1995) Photochemical modeling analysis under global warming conditions. Proceedings of the 88th air & waste management association annual meeting and exhibition: Pittsburgh, PA: Paper No. 95—WP 74B.02.
Murazaki, K; Hess, P. (2006) How does climate change contribute to surface ozone change over the United States? J Geophys Res 111:D05301, doi:10.1029/2005JD005873.
NAST (National Assessment Synthesis Team). (2001) Climate change impacts on the United States: The potential consequences of climate variability and change. Report for the U.S. Global Change Research Program, Cambridge, UK: Cambridge University Press; 620 pp.
Nolte, CG; Gilliland, AB; Hogrefe, C. (2008) Linking global to regional models to assess future climate impacts on surface ozone levels in the United States. J Geophys Res 113:D14307, doi:10.1029/2007JD008497.
NRC (National Research Council). (1991) Rethinking the ozone problem in urban and regional air pollution. National Academy Press, Washington, DC; 489 pp.
NRC (National Research Council). (2001) Global air quality. National Academy Press, Washington, DC; 41 pp.
NRC (National Research Council). (2004) Air quality management in the United States. Committee on Air Quality Management in the United States, National Research Council. National Academy Press, Washington, DC: 426 pp.
Otte, T. (2008) The impact of nudging in the meteorological model for retrospective air quality simulations. Part I: Evaluation against national observation networks. J Appl Meteor Clim 47:1853−1867.
Pierce, T; Geron, C; Bender, L; et al. (1998) Influence of increased isoprene emissions on regional ozone modeling. J Geophys Res 103:25611−25629.
Purves, DW; Caspersen, JP; Moorcroft, PR; et al. (2004) Human-induced changes in U.S. biogenic volatile organic compound emissions: evidence from long-term forest inventory data. Glob Chang Bio 10:1737−1755, doi: 10.1111/j.1365-2486.2004.00844.x.
R-5

Racherla, PN; Adams, PJ. (2006) Sensitivity of global ozone and fine particulate matter concentrations to climate change. J Geophys Res 111:D24103, doi:10.1029/2005JD006939.
Racherla, PN; Adams, PJ. (2008) The response of surface ozone to climate change over the Eastern United States. Atmos Chem Phys 8:871−885.
Ramanathan, V. (1975) Greenhouse effect due to chlorofluorocarbons: climatic implications. Science 190:50−52.
Ramanathan, V; Feng, Y. (2009) Air pollution, greenhouse gases and climate change: Global and regional perspectives. Atmos Environ 43:37−50.
Ramanathan, V; Callis, LB; Cess, RD; et al. (1985) Trace gas effects on climate. In Atmospheric Ozone, 1985. Vol. III, WMO global Ozone Research and Monitoring Project, Report No. 16, World Meteorological Organization, Geneva:821−893.
Rockel, B; Castro, CL; Pielke, RA, Sr; et al. (2008) Dynamical downscaling: Assessment of model system dependent retained and added variability for two different regional climate models. J Geophys Res 113:D21107, doi:10.1029/2007JD009461.
Roselle, S; Pierce, T; Shere, K. (1991) The sensitivity of regional ozone modeling to biogenic hydrocarbons. J Geophys Res 96: 7341−7394.
Rubin, JI; Kean, AJ; Harley, RA; et al. (2006) Temperature dependence of volatile organic compound evaporative emissions from motor vehicles. J Geophys Res 111:D03305, doi: 10.1029/2005JD006458.
Russell, A; Dennis, R. (2000) NARSTO critical review of photochemical models and modeling. Atmos Environ 34:2283−2324.
Russell, GL; Miller, JR; Rind, D. (1995) A coupled atmosphere ocean model for transient climate change studies. Atmos Ocean 33:683−730.
Sillman, S; Samson, PJ. (1995) Impact of temperature on oxidant photochemistry in urban, polluted rural and remote environments. J Geophys Res 100:11497−11508.
Sitch, S; Cox, PM; Collins, WJ; et al. (2007) Indirect radiative forcing of climate change through ozone effects on the land-carbon sink. Nature 448:791−794.
Snyder, MA; Bell, JL; Sloan, LC; et al. (2002) Climate responses to a doubling of atmospheric carbon dioxide for a climatically vulnerable region. Geophys Res Lett 29:1514, doi:10.1029/2001GL014431.
Steiner, AL; Tonse, S; Cohen, RC; et al. (2006) Influence of future climate and emissions on regional air quality in California. J Geophys Res 111:D18303, doi:10.1029/2005JD006935.
Stevenson, DS; Denterner, FJ; Schultz, MG; et al. (2006) Multimodel ensemble simulations of present-day and near future tropospheric ozone. J Geophys Res 111:D08301, doi:10.1029/2005JD006338.
Stockwell, WR; Middleton, P; Chang, JS; et al. (1990) The second generation Regional Acid Deposition Model chemical mechanism for regional air quality modeling. J Geophys Res 95:16343−16367.
Stratton, RA; Pope, VD. (2004) Modelling the climatology of storm tracks - Sensitivity to resolution. In: The Second Phase of the Atmospheric Model Intercomparison Project (AMIP2) [Gleckler, P. (ed.)]. Proceedings of the WCRP/WGNE Workshop, Toulouse, pp. 207-210.
Szopa, S; Hauglustaine, DA. (2007) Relative impacts of worldwide tropospheric ozone changes and regional emission modifications on European surface-ozone levels. Comptes rendus Geo 339:96pp.
R-6

Tagaris, E; Manomaiphiboon, K; Liao, K-J; et al. (2007) Impacts of global climate change and emissions on regional ozone and fine particulate matter concentrations over the United States. J Geophys Res 112:D14312, doi:10.1029/2006JD008262.
Tao, Z; Williams, A; Huang, H-C; et al. (2007) Sensitivity of U.S. surface ozone to future emissions and climate changes. Geophys Res Lett 34:L08811, doi:10.1029/2007GL029455.
Tao, Z; Williams, A; Huang, H-C; et al. (2008) Sensitivity of surface ozone simulation to cumulus parameterization. J Appl Meteor Clim:47, 1456−1466.
Thompson, ML; Reynolds, J; Cox, LH; et al. (2001) Review of statistical methods for the meteorological adjustment of tropospheric ozone. Atmos Environ 35:617−630.
U.K. Royal Society. (2008) Ground-level ozone in the 21st century: future trends, impacts and policy implications. UK Royal Society Policy Document 15/08, London, 132 pp.
U.S. EPA (U.S. Environmental Protection Agency). (1989) The Potential Effects of Global Climate Change on the United States. Appendix F: Air Quality. Report to Congress, EPA Office of Policy, Planning, and Evaluation. U.S. Environmental Protection Agency, Washington, DC, EPA-230-05-89-056.
U.S. EPA (U.S. Environmental Protection Agency). (1992) Procedures for Emission Inventory Preparation Volume IV: Mobile Sources. Report prepared by the Emission Planning and Strategies Division, Office of Mobile Sources, and the Technical Support Division, Office of Air Quality Planning and Standards of the U.S. Environmental Protection Agency. U.S. Environmental Protection Agency, Washington, DC, EPA420-R-92-009.
U.S. EPA (U.S. Environmental Protection Agency). (1999) Guideline for Developing an Ozone Forecasting System. Report prepared by the Office of Air Quality Planning and Standards. U.S. Environmental Protection Agency, Research Triangle Park, NC, EPA-454/R-99-009.
U.S. EPA (U.S. Environmental Protection Agency). (2006) Air Quality Criteria for Ozone and Related Photochemical Oxidants. U.S. Environmental Protection Agency, Washington, DC, EPA/600/R-05/004aF-cF.
U.S. EPA (U.S. Environmental Protection Agency). (2008) National Air Quality: Status and Trends through 2007. U.S. Environmental Protection Agency, Washington, DC, EPA-454/R-08-06.
von Storch, H; Langenberg, H; Feser, F. (2000) A spectral nudging technique for dynamical downscaling purposes. Mon Wea Rev 128:3664−3673. Wang W-C; Yung, YL; Lacis, AA; et al. (1976) Greenhouse effects due to man-made perturbation of trace gases. Science 194:685−690.
White, AB; Darby, LS; Senff, CJ; et al. (2007) Comparing the impact of meteorological variability on surface ozone during the NEAQS (2002) and ICARTT (2004) field campaigns. J Geophys Res 112:D10S14, doi:10.1029/2006JD007590.
Woo, J-H; He, S; Amar, P; et al. (2007) Development of North American emission inventories for air quality modeling under climate change. J Air Waste Manage Assoc 58:1483−1494.
Wu, S; Mickley, LJ; Jacob, DJ; et al. (2007) Why are there large differences between models in global budgets of tropospheric ozone? J Geophys Res 112:D05302. doi:10.1029/2006JD007801.
Wu, S; Mickley, LJ; Leibensperger, EM; et al. (2008a) Effects of 2000-2050 global change on ozone air quality in the United States. J Geophys Res 113:D06302, doi:10.1029/2007JD008917.
R-7

R-8
Wu, S; Mickley, LJ; Jacob, DJ; et al. (2008b) Effects of 2000-2050 changes in climate and emissions on global tropospheric ozone and the policy relevant surface background ozone in the United States. J Geophys Res 113:D18312, doi:10.1029/2007JD009639.
Zeng, G; Pyle, JA; Young, PJ. (2008) Impact of climate change on tropospheric ozone and its global budgets. Atmos Chem Phys 8:369−387.
Zhang, Y; Hu, X-M; Leung, LR; et al. (2008) Impacts of regional climate change on biogenic emissions and air quality. J Geophys Res 113:D18310, doi:10.1029/2008JD009965.
Related Documents