WP GLM|LIC Working Paper No. 36 | October 2017 Can Africa Be a Manufacturing Destination? Labor Costs in Comparative Perspective Vijaya Ramachandran (Center for Global Development) Alan Gelb (Center for Global Development) Christian Meyer (European University Institute) Divyanshi Wadhwa (Center for Global Development)

Welcome message from author
This document is posted to help you gain knowledge. Please leave a comment to let me know what you think about it! Share it to your friends and learn new things together.
Transcript

WP
GLM|LIC Working Paper No. 36 | October 2017
Can Africa Be a Manufacturing Destination?Labor Costs in Comparative Perspective
Vijaya Ramachandran (Center for Global Development)Alan Gelb (Center for Global Development)Christian Meyer (European University Institute)
Divyanshi Wadhwa (Center for Global Development)

GLM|LICc/o IZA – Institute of Labor EconomicsSchaumburg-Lippe-Straße 5–953113 Bonn, Germany
Phone: +49-228-3894-0Fax: +49-228-3894-510
Email: [email protected]
GLM|LIC Working Paper No. 36 | October 2017
Can Africa Be a Manufacturing Destination?Labor Costs in Comparative Perspective
Vijaya Ramachandran (Center for Global Development)Alan Gelb (Center for Global Development)Christian Meyer (European University Institute)
Divyanshi Wadhwa (Center for Global Development)

ABSTRACT
GLM|LIC Working Paper No. 36 | October 2017
Can Africa Be a Manufacturing Destination?Labor Costs in Comparative Perspective*
Our central question is whether African countries can break into global manufacturing in a substantial way. Using a newly-constructed panel of firm-level data from the World Bank’s Enterprise Surveys, we look at labor costs in a range of low and middle income countries in Africa and elsewhere. Using fixed effects and random effects models, we estimate a set of labor costs, both actual and hypothetical – what would labor costs for Sub-Saharan African firms look like if they were located outside of Africa? What would Bangladesh’s labor costs be if it was located on the African continent? Our results suggest that for any given level of GDP, labor is more costly for firms that are located in Sub-Saharan Africa. However, we also find that there are a few countries in Africa that, on a labor cost basis, may be potential candidates for manufacturing – Ethiopia in particular stands out. We conclude with thoughts on the future of manufacturing in Africa.
JEL Classification:D2, L6, O14
Keywords:Africa, industrialization, labor, manufacturing
Corresponding author:Vijaya RamachandranCenter for Global Development2055 L Street NWWashington DC 20036USAE-mail: [email protected]
* The authors are grateful to Tom Bundervoet, Ranil Dissanayake, Louise Fox, Matthew Johnson-Idan, David Lam, Todd Moss, Maryam Nejad, Alexis Smallridge, Francis Teal, an anonymous external reviewer, and seminar participants at the DFID-IZA Growth and Labor Markets in Low Income Countries Workshop at Oxford University, the DFID economist seminar series, the World Bank’s Trade and Competitiveness Learning Week, and the Research in Progress series at the Center for Global Development. We owe a special debt to Joshua Wimpey at the World Bank for his guidance regarding the Enterprise Surveys dataset. All errors are, of course, ours alone.
Contents
Abstract . . . . . . . . . . . . . . . . . . . . . . . . . . . . . . . . . . . . . . . . . . . . 2
Acknowledgements . . . . . . . . . . . . . . . . . . . . . . . . . . . . . . . . . . . . . 3
Introduction . . . . . . . . . . . . . . . . . . . . . . . . . . . . . . . . . . . . . . . . . 7
Data . . . . . . . . . . . . . . . . . . . . . . . . . . . . . . . . . . . . . . . . . . . . . . 9
Descriptive Results . . . . . . . . . . . . . . . . . . . . . . . . . . . . . . . . . . . . . 12
Statistical Analysis . . . . . . . . . . . . . . . . . . . . . . . . . . . . . . . . . . . . . 16
Regression Results . . . . . . . . . . . . . . . . . . . . . . . . . . . . . . . . . . . . . 21
Can Ethiopia Be The New China? . . . . . . . . . . . . . . . . . . . . . . . . . . . . 30
Conclusion . . . . . . . . . . . . . . . . . . . . . . . . . . . . . . . . . . . . . . . . . . . 33
Appendix A: Results of Fixed Effects Models . . . . . . . . . . . . . . . . . . . . . 36
Appendix B: Results from a Survey of Manufacturing Workers in Ethiopia . . 39
References . . . . . . . . . . . . . . . . . . . . . . . . . . . . . . . . . . . . . . . . . . . 51
4
List of Tables
1 Variables Definitions . . . . . . . . . . . . . . . . . . . . . . . . . . . . . . . . . 12
2 Descriptive statistics . . . . . . . . . . . . . . . . . . . . . . . . . . . . . . . . . 13
3 Comparing countries . . . . . . . . . . . . . . . . . . . . . . . . . . . . . . . . . 16
4 Weighting scheme . . . . . . . . . . . . . . . . . . . . . . . . . . . . . . . . . . . 20
5 Random effects model . . . . . . . . . . . . . . . . . . . . . . . . . . . . . . . . 26
6 Random effects model: Unit labor cost . . . . . . . . . . . . . . . . . . . . . . . 27
7 Random effects model: weighted (synthetic control) . . . . . . . . . . . . . . . . 29
A1 Fixed effects model: Africa . . . . . . . . . . . . . . . . . . . . . . . . . . . . . . 37
A2 Fixed effects model: Comparator . . . . . . . . . . . . . . . . . . . . . . . . . . 38
A3 Age . . . . . . . . . . . . . . . . . . . . . . . . . . . . . . . . . . . . . . . . . . . 40
5

List of Figures
1 Analytical sample . . . . . . . . . . . . . . . . . . . . . . . . . . . . . . . . . . . 11
2 Median labor cost v. GDP per capita . . . . . . . . . . . . . . . . . . . . . . . . 15
3 Ratio of labor cost and GDP per capita v. GDP per capita . . . . . . . . . . . . 15
4 Methodology flow chart . . . . . . . . . . . . . . . . . . . . . . . . . . . . . . . . 18
5 Predicted labor cost per worker (Full sample) . . . . . . . . . . . . . . . . . . . 22
6 Predicted labor cost per worker (Africa sample) . . . . . . . . . . . . . . . . . . 23
7 Predicted labor cost per worker (Comparator sample) . . . . . . . . . . . . . . . 23
8 Median predicted labor cost per worker using random effects coefficients . . . . . 32
9 Number of Children (Female Respondents) . . . . . . . . . . . . . . . . . . . . . 40
10 Highest level of education completed . . . . . . . . . . . . . . . . . . . . . . . . 41
11 Safety net vs. long-term career . . . . . . . . . . . . . . . . . . . . . . . . . . . 42
12 Status of Dwelling . . . . . . . . . . . . . . . . . . . . . . . . . . . . . . . . . . 46
13 Pressure to Share Income . . . . . . . . . . . . . . . . . . . . . . . . . . . . . . . 48
14 Family turns to worker for help . . . . . . . . . . . . . . . . . . . . . . . . . . . 49
15 Worker turns to family for help . . . . . . . . . . . . . . . . . . . . . . . . . . . 50
6

Introduction
Industrial location responds to many factors, including geography, transport, logistics and
ease of integration into global value chains, domestic market size and agglomeration potential,
labor and management skills, policy quality, and more recently ICT readiness (digitization,
robotics, AI). On most of these measures, African countries do not perform strongly. Certain
industries can of course, draw on a rich and diverse natural resource base. As the Africa
Mining Vision emphasizes, resource-rich African countries can encourage forward and backward
linkages, especially to small and medium size enterprises, in these industries (Hausmann et al.,
2008). Tourism, another rapidly-growing export sector, can also stimulate local industrial and
service firms.
The “footloose” industries that have typically served as the entry point for industrialization
generally involve labor-intensive segments of industrial value chains. For the African manufac-
turing sector to succeed, labor costs need to be competitive. Given that poor countries usually
have cheap labor, African countries should have some of the cheapest labor in the world. The
question is—do they, and if so, is African labor cheap enough to compensate for other, less fa-
vorable, factors? Several papers have shed light on these questions. Fox et al (2017) argue that
the past decade has seen economic activity shift into higher-productivity sectors but that this
structural transformation has seen labor shift into services rather than into industry. Soderbom
and Teal, along with various coauthors, have written extensively on the efficiency of firms in
the manufacturing sector in Africa as well as on the relationship between workers skills and the
ability to export (Siba et al., 2012; Soderbom and Teal, 2004; Soderbom, 2003; Soderbom and
Teal, 2000). Page (2012) argues that industrialization in Africa can be sped up by focusing on
exports, agglomeration externalities and investments in the capabilities of the firm. Tybout
(2000) and Van Biesebrock (2005) explore the determinants of productivity of firms including
the relationship between firm size and productivity.
7

Labor costs cannot be considered in isolation as a determinant of competitiveness. Switzerland,
for example, ranks at the top of the World Economic Forum’s Global Competitiveness Index
(GCI). With an outstanding business environment, rich technical and management skills and
excellent location, it can sustain a large manufacturing industry, and one not based on natural
resources, despite very high costs of labor. Policy quality and predictability, administrative
capacity, human, institutional and governance capital, physical and financial infrastructure, and
location can be taken as important indicators of the quality and sophistication of a country’s
business environment. Some of these indicators are difficult to measure and there is no unique
way to combine them into a single index, but many of them correlate quite strongly with GDP
per capita. One option, then, is to take this as a proxy for the physical and institutional
capacity of the country and the human capital embedded in its workforce. Thus, a comparison
of labor cost per worker, given GDP per capita, may help to indicate how well a country can
compete on the basis of low labor costs, taking into account its general level of development
relative to competitors.
An alternative approach could be to take an indicator like the GCI to represent the physical,
human and institutional capital of the country; this correlates strongly, and approximately
linearly, with logged GDP per capita. The approach is less useful here because of the small size
of the country sample; various factors can cause sizable deviations between countries’ income
and GCI rankings. One factor is dualism: South Africa, for example, ranks far higher on the
GCI than in terms of GDP per head; its high formal wage levels coexist with unemployment
estimated at 27 percent, one of the highest rates in the world. It is therefore less useful to
consider South Africa’s enclave wage levels in relation to its GCI than relative to the broader,
income-based, measure of its economy.
In 2013, we made an attempt to understand African labor costs in the global context using
cross-sectional data from the World Bank’s Enterprise Surveys (Gelb et al., 2013). Following
on from previous research on external costs (Eifert et al., 2008), we compared labor costs and
productivity in selected African countries relative to comparators using data for 25 countries
from the World Bank’s Enterprise Surveys. We concluded that industrial labor costs are far
higher in Africa than one might expect, given levels of Gross Domestic Product (GDP) per
capita. We argued that part of this was an “enclave effect”: both labor costs and labor
8

productivity are far higher for formal industry in Africa, relative to GDP per capita than in
comparator countries. In addition, we found that as firms became larger and more productive
their labor costs increased more in Africa than elsewhere.
In this earlier exercise, we did not have panel data and had to rely on a cross sectional analysis,
which has its limitations. For the work described in this paper, we are able to construct panel
data, using information from the same firm at two different points in time, for a number of
countries in Africa and elsewhere. Section 2 describes the data used in our analysis. Sections
3 and 4 discuss the key variables and the methodology used in our analysis. Section 5 contains
the results of our econometric analysis. Section 6 concludes.
We also extend the analysis in two directions. One difficulty of comparing Sub-Saharan Africa
with other developing regions is that most African countries are far poorer than most of their
actual and potential competitors, resulting in an unbalanced comparison. We approach this
by creating a simple synthetic control, re-weighting the comparator countries by income group
to as to more closely resemble the African income profile (Abadie et al., 2007). The other
extension is to take into account the heterogeneity of the African countries by distinguishing
three groups: middle-income (essentially South Africa and Botswana); lower income (most of
the rest) and countries like Ethiopia and the Democratic Republic of Congo that are so poor,
relative to external comparators that they can be considered in a distinct class. Even if African
labor costs are high, relative to GDP/head, the low income levels of that group suggest the
possibility that some of these countries could be attractive to industries seeking to compete on
the basis of low wages. Investors may choose to leapfrog over most of Africa to settle only in
the poorest countries.
9

Data
The World Bank has been conducting surveys at the firm level since the 1990s in most countries,
often at intervals of three to four years. In each survey round, the Enterprise Analysis Unit at
the World Bank, which administers the Enterprise Surveys, aims to survey about fifty percent
of firms that have been surveyed in the previous round.1 This enables them to construct panel
data but, due to numerous country-specific questions in the survey, a full panel data set has to
be constructed separately for each economy. We use this data to build a multi-economy panel
that includes a more limited set of variables that is common across countries.
We include data for all available African economies and all low-, lower-middle-, and upper-
middle- income countries outside of Africa that could be considered as competing manufacturing
destinations. Since our analysis focuses on labor costs in the manufacturing sector, we use data
from manufacturing firms only. Each country has firms that have been followed over time and
firms that have been surveyed only in one round. We take only the subset of firms that were
followed over time to create a balanced panel of firms that have been surveyed in at least two
survey rounds.
As shown in Figure 1, the final sample comprises of firms from 17 comparator countries and
12 African countries. Of these, two comparator countries and four African countries include
firms from more than two rounds. For example, Turkish firms were surveyed in 2006, 2010
and 2013. We identify firms from the 2006 survey that were also surveyed in 2010, and include
them, and we identify firms from the 2010 survey that were also surveyed in 2013, and include
them—such that there are Turkish firms from two panel years: 2006-2010 and 2010-2013. We
note at the outset that on average the comparator countries have higher incomes than the
African countries. Most are established middle-income economies, a status enjoyed by only
1For example, of 100 firms in Afghanistan interviewed in 2006, 50 firms would have been surveyed in 2002as well.
10
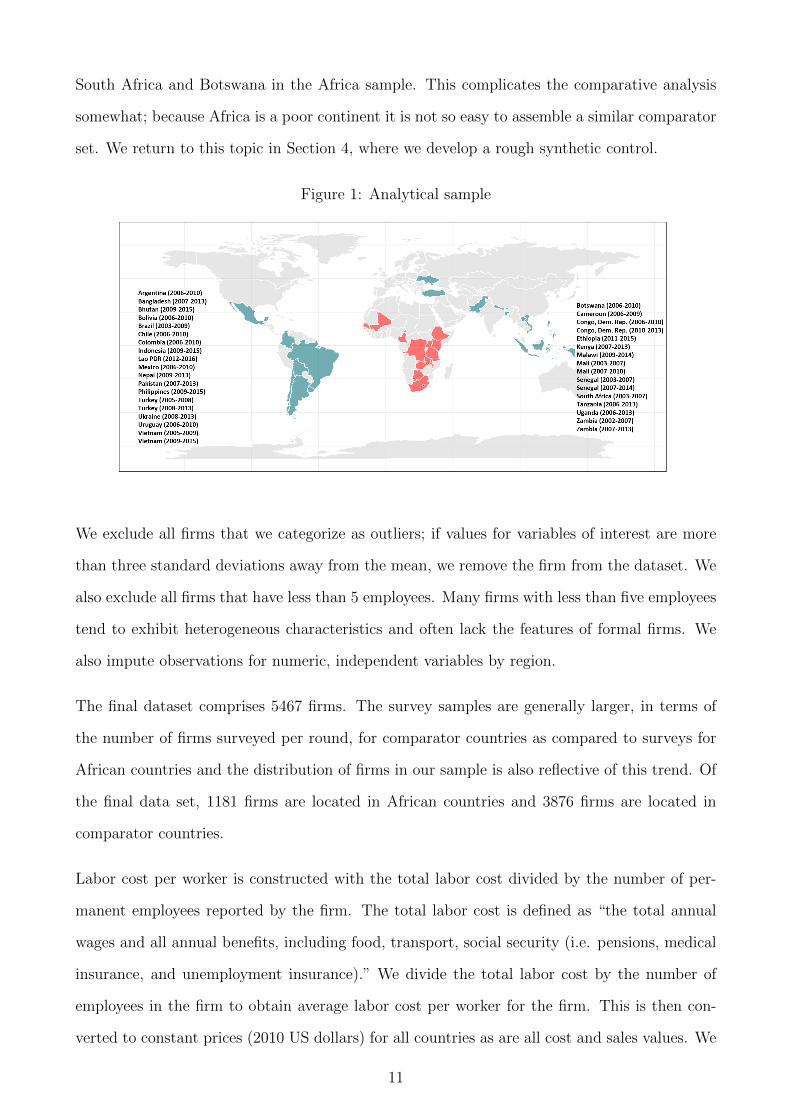
South Africa and Botswana in the Africa sample. This complicates the comparative analysis
somewhat; because Africa is a poor continent it is not so easy to assemble a similar comparator
set. We return to this topic in Section 4, where we develop a rough synthetic control.
Figure 1: Analytical sample
We exclude all firms that we categorize as outliers; if values for variables of interest are more
than three standard deviations away from the mean, we remove the firm from the dataset. We
also exclude all firms that have less than 5 employees. Many firms with less than five employees
tend to exhibit heterogeneous characteristics and often lack the features of formal firms. We
also impute observations for numeric, independent variables by region.
The final dataset comprises 5467 firms. The survey samples are generally larger, in terms of
the number of firms surveyed per round, for comparator countries as compared to surveys for
African countries and the distribution of firms in our sample is also reflective of this trend. Of
the final data set, 1181 firms are located in African countries and 3876 firms are located in
comparator countries.
Labor cost per worker is constructed with the total labor cost divided by the number of per-
manent employees reported by the firm. The total labor cost is defined as “the total annual
wages and all annual benefits, including food, transport, social security (i.e. pensions, medical
insurance, and unemployment insurance).” We divide the total labor cost by the number of
employees in the firm to obtain average labor cost per worker for the firm. This is then con-
verted to constant prices (2010 US dollars) for all countries as are all cost and sales values. We
11
also carry out regression analysis using unit labor cost as the dependent variable. Unit labor
cost is defined in two ways: the ratio of labor cost to total sales or the ratio of labor cost to
value added. We calculate value added by subtracting the cost of raw materials, electricity
and fuel from sales. In addition to location in Africa as a 0-1 dummy, our regression models
incorporate a variety of controls, that include firm characteristics and country characteristics.
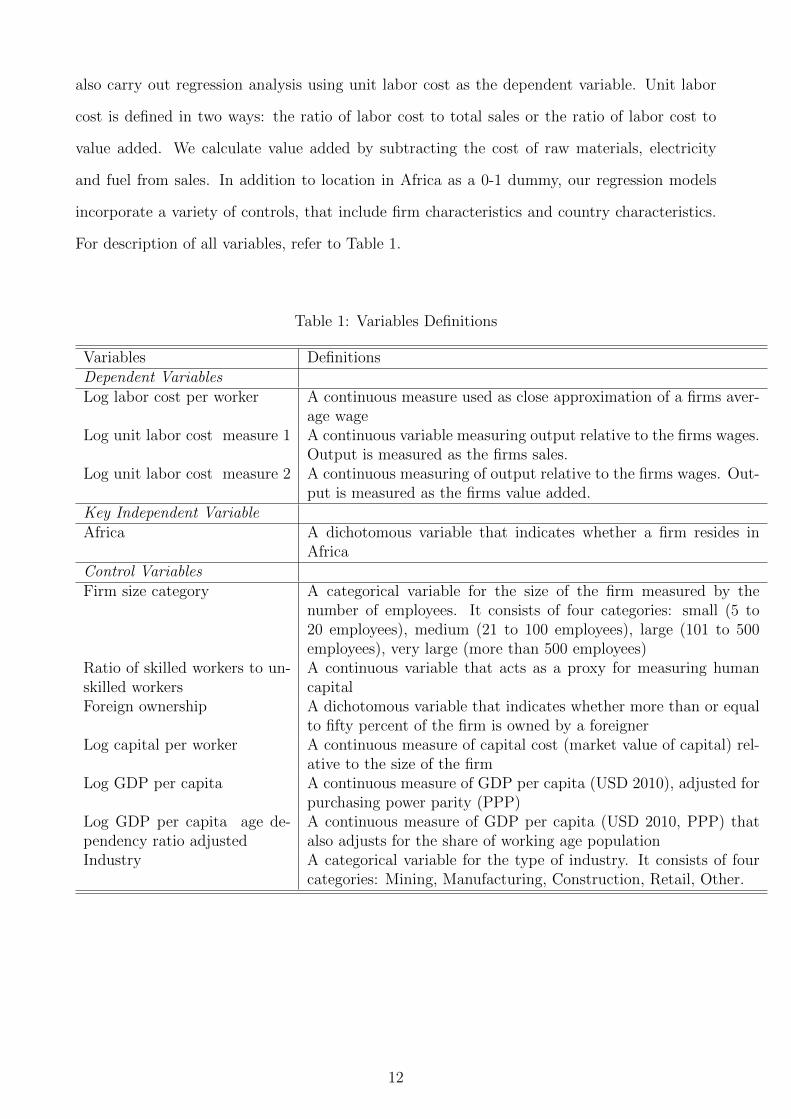
For description of all variables, refer to Table 1.
Table 1: Variables Definitions
Variables DefinitionsDependent VariablesLog labor cost per worker A continuous measure used as close approximation of a firms aver-
age wageLog unit labor cost measure 1 A continuous variable measuring output relative to the firms wages.
Output is measured as the firms sales.Log unit labor cost measure 2 A continuous measuring of output relative to the firms wages. Out-
put is measured as the firms value added.Key Independent VariableAfrica A dichotomous variable that indicates whether a firm resides in
AfricaControl VariablesFirm size category A categorical variable for the size of the firm measured by the
number of employees. It consists of four categories: small (5 to20 employees), medium (21 to 100 employees), large (101 to 500employees), very large (more than 500 employees)
Ratio of skilled workers to un-skilled workers
A continuous variable that acts as a proxy for measuring humancapital
Foreign ownership A dichotomous variable that indicates whether more than or equalto fifty percent of the firm is owned by a foreigner
Log capital per worker A continuous measure of capital cost (market value of capital) rel-ative to the size of the firm
Log GDP per capita A continuous measure of GDP per capita (USD 2010), adjusted forpurchasing power parity (PPP)
Log GDP per capita age de-pendency ratio adjusted
A continuous measure of GDP per capita (USD 2010, PPP) thatalso adjusts for the share of working age population
Industry A categorical variable for the type of industry. It consists of fourcategories: Mining, Manufacturing, Construction, Retail, Other.
12

Descriptive Results
The analytical sample comprises of 5467 firms, 29 countries, and 35 country-year panels. In
this section, we discuss some key descriptors of our sample, comparing values for African firms
and their comparators outside the region.
From Table 2, the representative African firm is younger, smaller, and more likely to be owned
by foreigners than the average comparator firm. The median age does not differ too much;
for African firms it is 14 years versus 19 for comparator firms. But 17 percent of the African
firms in our sample are owned by foreigners, compared with only 9 percent of comparator firms.
The median African firm is also smaller with 38 employees, while the median comparator has
47. However, the average proportion of skilled to unskilled production workers in the firms is
nearly the same. This could signal that the human capital of African firms is not significantly
different than that of comparator firms, and that the level of technology used in production is
similar. But it could also mean—as suggested by some observers—that African firms have to
operate with higher levels of oversight and supervisory staff than firms in other parts of the
world.
Table 2: Descriptive statistics
Africa ComparatorsAge 14 19Share of firms with foreign ownership >= 50 percent 0.17 0.09Number of employees 38 47Ratio of skilled to unskilled production workers 1.07 1Sales per worker (2010 USD, constant) $15,615.51 $22,334.94Value Added per worker (2010 USD, constant) $5,202.67 $11,371.83Observations 2362 7752Note: All values are medians except share of foreign ownershipNote: Values for value added per worker are not available for the entiresample. The median is representative of a smaller sample.
In contrast to these modest differences, there are striking productivity and structural differ-
13
entials. The median African firm has sales per worker of $15,615 compared with the median
comparator firm at $22,335. Even more striking, value added per worker is only $5,203 for the
median African firm but $11,372 for the comparator firm. Among the firms for which we could
calculate value added per worker, we find that African firms’ value added is 50 percent of sales,
nearly the same as comparator firms. Labor costs constitute 25 percent of value added per
worker and 15 percent of sales per worker for African firms. For comparator firms, the numbers
are 35 percent and 17 percent respectively.
Capital costs per worker in African firms are high. The median African and median comparator
firms have capital costs per worker of $5,163 and $4,218, respectively, even though African
countries are, on average, far poorer than the comparators. Higher capital cost per worker,
lower value added per worker, and relatively similar levels of human capital suggest that African
firms have lower productivity and/or pay a higher premium for technology and access to capital
than comparator firms.
African labor costs are lower in absolute terms but not as low as we might expect (See Figure
2). Figure 3 shows that poorer countries have higher labor costs than their income levels would
suggest. In addition, the African countries in our sample have an even higher ratio of mean
labor cost per worker relative to GDP per capita. Even the poorer comparator countries in our
sample have a ratio that is below 1, while nearly all African countries are above this threshold.2
The ratio in Figure 3 is calculated using the logged values of mean labor cost per worker and
mean GDP per capita, giving the ratio a narrow range. However, if we take a look at the ratio
of raw values of mean labor cost per worker and mean GDP per capita, we find that the range
of the ratio is from 0.5 to 13. This means that some countries mean labor cost is as low as half
of the GDP per capita (or average wage), while others have labor costs 13 times that of the
country’s average wage.
2Value of 1 on y-axis indicates that a country’s median labor cost per worker is equal to the country’s meanwage (defined by the country’s GDP per capita).
14

Figure 2: Median labor cost v. GDP per capita
Note: Data for each country shows values for the median, 25th and 75th percentile
Figure 3: Ratio of labor cost and GDP per capita v. GDP per capita
Note: K/GDP refers to the ratio of logged capital cost per worker to logged GDP per capita
Table 3 helps us to better understand these patterns by comparing selected countries: Tanzania,
Ethiopia, Kenya, and Senegal, with Bangladesh. The African countries are sometimes cited
as among the more competitive while, among the comparator group, Bangladesh is a major
manufacturer and has comparable GDP per capita. Indeed, the WEF Global Competitiveness
15

rankings are similar for all of the countries (Schwab and Sala-i Martın, 2016). The labor cost
per worker for Bangladesh is $835, almost identical to its GDP per capita. However, for the
four African countries, labor costs per worker are twice or more the level of GDP per capita.
Only Ethiopia, at $909—is comparable with Bangladesh.
Table 3: Comparing countries
Labor costper worker
Capital costper worker
GDPper capita
WEF competi-tiveness rankings
Bangladesh $835.31 $1,069.84 $853.02 106Kenya $2,118.01 $9,775.45 $1,116.69 96Tanzania $1,776.65 $5,740.99 $1,094.95 116Senegal $1,561.64 $2,421.98 $775.45 112Ethiopia $909.28 $6,137.98 $471.19 109
The differences in capital cost per worker are even more striking. For Bangladesh, capital cost
per worker is $1069, only marginally higher than its GDP per capita and far below the levels
in the African countries. In contrast, Ethiopia’s capital cost per worker is as high as $6000,
and Kenya’s is close to $10,000. Senegal has the lowest capital cost per worker among the four
countries, $2421, but still more than twice its GDP per capita.
16

Statistical Analysis
We estimate a series of Ordinary Least Squares multivariate regression models with firm fixed
effects and with firm random effects with increasing complexity of control variables.3 The fixed
effects model is estimated separately for African firms and for comparator firms; we will not
observe any effect for an Africa dummy in a pooled fixed effects model as it is a time-invariant
firm-specific characteristic.
We estimate the following fixed effects regression models with the Africa and comparator sam-
ples:
• Model 1: (Log labor cost per worker)fi = β0 + β1(Firm size category)fi + β2Ratio of
skilled workers to unskilled workers)fi + β3(Foreign ownership)fi
• Model 2: (Log labor cost per worker)fi = β0 + β1(Firm size category)fi + β2(Ratio of
skilled workers to unskilled workers)fi + β3(Foreign ownership)fi + β4(Log capital per
worker)fi
• Model 3: (Log labor cost per worker)fi = β0 + β1(Firm size category)fi + β2(Ratio of skilled
workers to unskilled workers)fi + β3(Foreign ownership)fi + β4(Log GDP per capita)fi
• Model 4: (Log labor cost per worker)fi = β0 + β1(Firm size category)fi + β2(Ratio of
skilled workers to unskilled workers)fi + β3(Foreign ownership)fi + β4(Log capital per
worker)fi + β5(Log GDP per capita)fi
• Model 5: (Log labor cost per worker)fi = β0 + β1(Firm size category)fi + β2(Ratio of
skilled workers to unskilled workers)fi + β3(Foreign ownership)fi + β4(Log capital per
worker)fi + β5(Log GDP per capita age dependency ratio adjusted)fi
3For models that include country-level variables, such as GDP per capita, we cluster the standard errors atthe country level. For all other models, we report robust standard errors.
17
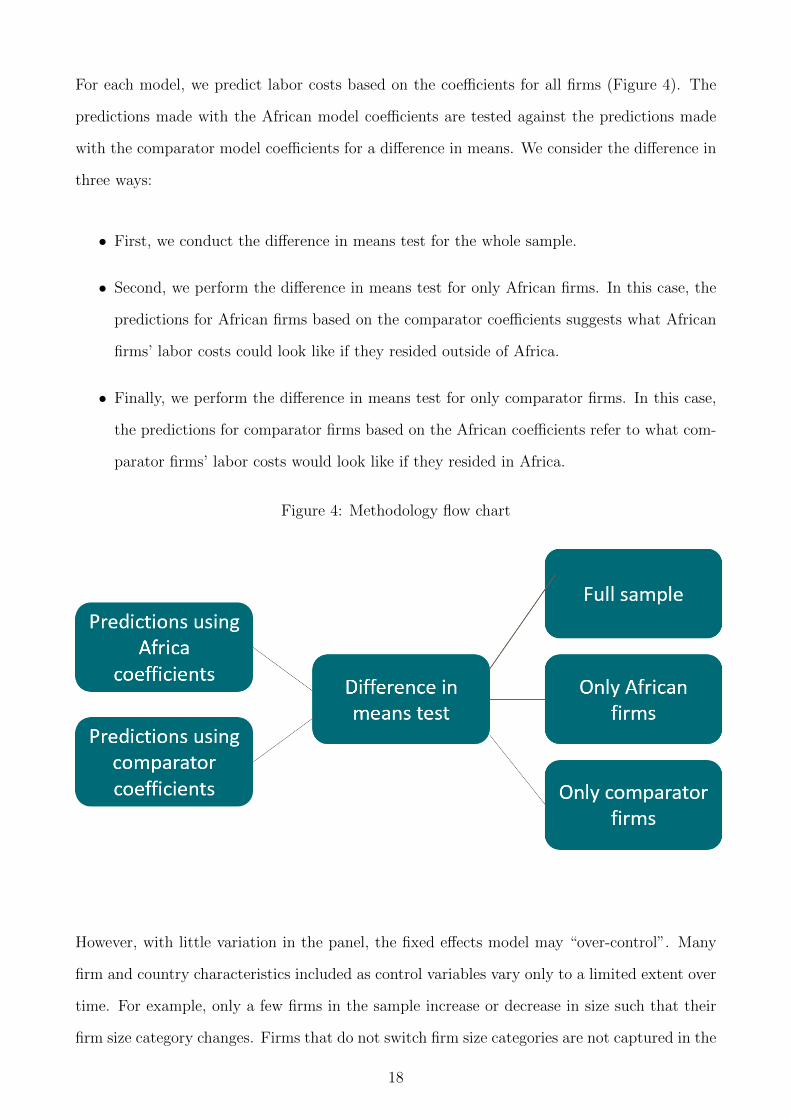
For each model, we predict labor costs based on the coefficients for all firms (Figure 4). The
predictions made with the African model coefficients are tested against the predictions made
with the comparator model coefficients for a difference in means. We consider the difference in
three ways:
• First, we conduct the difference in means test for the whole sample.
• Second, we perform the difference in means test for only African firms. In this case, the
predictions for African firms based on the comparator coefficients suggests what African
firms’ labor costs could look like if they resided outside of Africa.
• Finally, we perform the difference in means test for only comparator firms. In this case,
the predictions for comparator firms based on the African coefficients refer to what com-
parator firms’ labor costs would look like if they resided in Africa.
Figure 4: Methodology flow chart
However, with little variation in the panel, the fixed effects model may “over-control”. Many
firm and country characteristics included as control variables vary only to a limited extent over
time. For example, only a few firms in the sample increase or decrease in size such that their
firm size category changes. Firms that do not switch firm size categories are not captured in the
18

coefficient for firm size categories in a fixed effects model. A random effects approach allows us
to ease these problems and may provide better estimates. Therefore, we also estimate random
effects models, allowing for more flexibility.
We estimate random effects regression models for all the above-mentioned equations and addi-
tionally the following two models:
• Model 6: (Log ratio of labor cost to sales)fi = β0 + β1(Firm size category)fi + β2(Ratio
of skilled workers to unskilled workers)fi + β3(Foreign ownership)fi + β4(Log GDP per
capita)fi
• Model 7: (Log ratio of labor cost to value added)fi = β0 + β1(Firm size category)fi +
β2(Ratio of skilled workers to unskilled workers)fi + β3(Foreign ownership)fi + β4(Log
GDP per capita)fi
We also control for the type of industry and introduce an interaction term between the Africa
dummy and the firm size category to allow for the possibility that the pay gradient by firm size
could be different for African and comparator firms.
Towards a Synthetic Control
While comparisons are useful, they suffer from a less-than-ideal set of comparator countries and
comparator firms. Being poorer than other regions, Africa is strongly represented at the low-
income end of the spectrum. In our sample, only two (out of seventeen) comparator countries
have GDP per capita below $1000, while there are six (out of twelve) African countries with
GDP per capita below this level. It could be argued that such an imbalance makes it difficult
to compare the two groups of countries and that a simple comparison of the African countries
and the others may be misleading.
One approach could be to simply restrict the number of comparator countries, disregarding
cases such as Turkey or Chile to reduce the disparity. However, these are credible competitors
as manufacturing destinations, at least for the few (but important) middle-income African
countries, and this would also introduce an element of arbitrariness into the analysis. Instead,
19
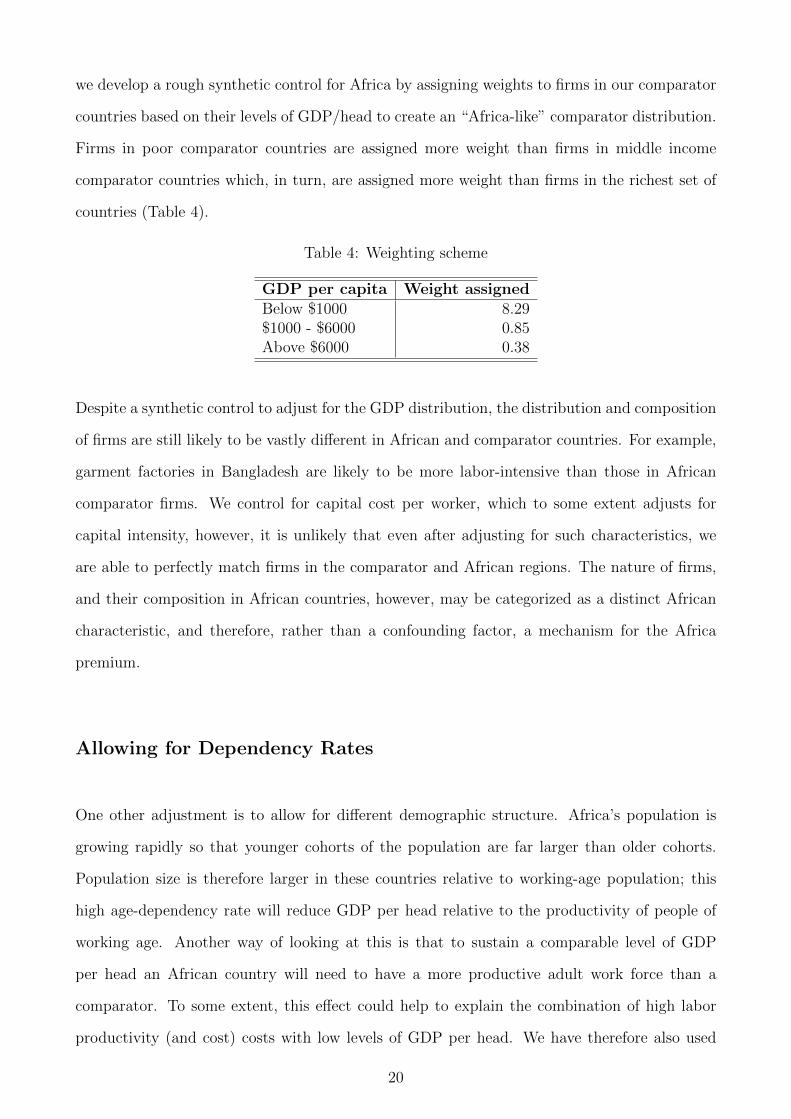
we develop a rough synthetic control for Africa by assigning weights to firms in our comparator
countries based on their levels of GDP/head to create an “Africa-like” comparator distribution.
Firms in poor comparator countries are assigned more weight than firms in middle income
comparator countries which, in turn, are assigned more weight than firms in the richest set of
countries (Table 4).
Table 4: Weighting scheme
GDP per capita Weight assignedBelow $1000 8.29$1000 - $6000 0.85Above $6000 0.38
Despite a synthetic control to adjust for the GDP distribution, the distribution and composition
of firms are still likely to be vastly different in African and comparator countries. For example,
garment factories in Bangladesh are likely to be more labor-intensive than those in African
comparator firms. We control for capital cost per worker, which to some extent adjusts for
capital intensity, however, it is unlikely that even after adjusting for such characteristics, we
are able to perfectly match firms in the comparator and African regions. The nature of firms,
and their composition in African countries, however, may be categorized as a distinct African
characteristic, and therefore, rather than a confounding factor, a mechanism for the Africa
premium.
Allowing for Dependency Rates
One other adjustment is to allow for different demographic structure. Africa’s population is
growing rapidly so that younger cohorts of the population are far larger than older cohorts.
Population size is therefore larger in these countries relative to working-age population; this
high age-dependency rate will reduce GDP per head relative to the productivity of people of
working age. Another way of looking at this is that to sustain a comparable level of GDP
per head an African country will need to have a more productive adult work force than a
comparator. To some extent, this effect could help to explain the combination of high labor
productivity (and cost) costs with low levels of GDP per head. We have therefore also used
20

GDP per head adjusted for the age dependency ratio as an indicator of the level of productivity
and development.
21

Regression Results
Fixed Effects
The results of the fixed effects regression estimations are presented in Table A1 for the sample
of African firms and in Table A2 for the sample of comparator firms (Appendix A).
Our results show that labor cost per worker for African firms is higher than that of comparator
firms. Figure A1 shows the predictions for the full sample based on Model 1. These suggest
that the average African firm’s labor cost per worker is approximately 60 percent that of the
average comparator firm. However, after also controlling for GDP per capita, the relationship
is reversed and the average African firm’s labor cost per worker is 190 percent that of the
comparator firm.
Figure 5: Predicted labor cost per worker (Full sample)
Predictions made using only coefficients from the African sample (see figure A2) show that
after controlling for GDP per capita, the median labor cost per worker with the African model
22
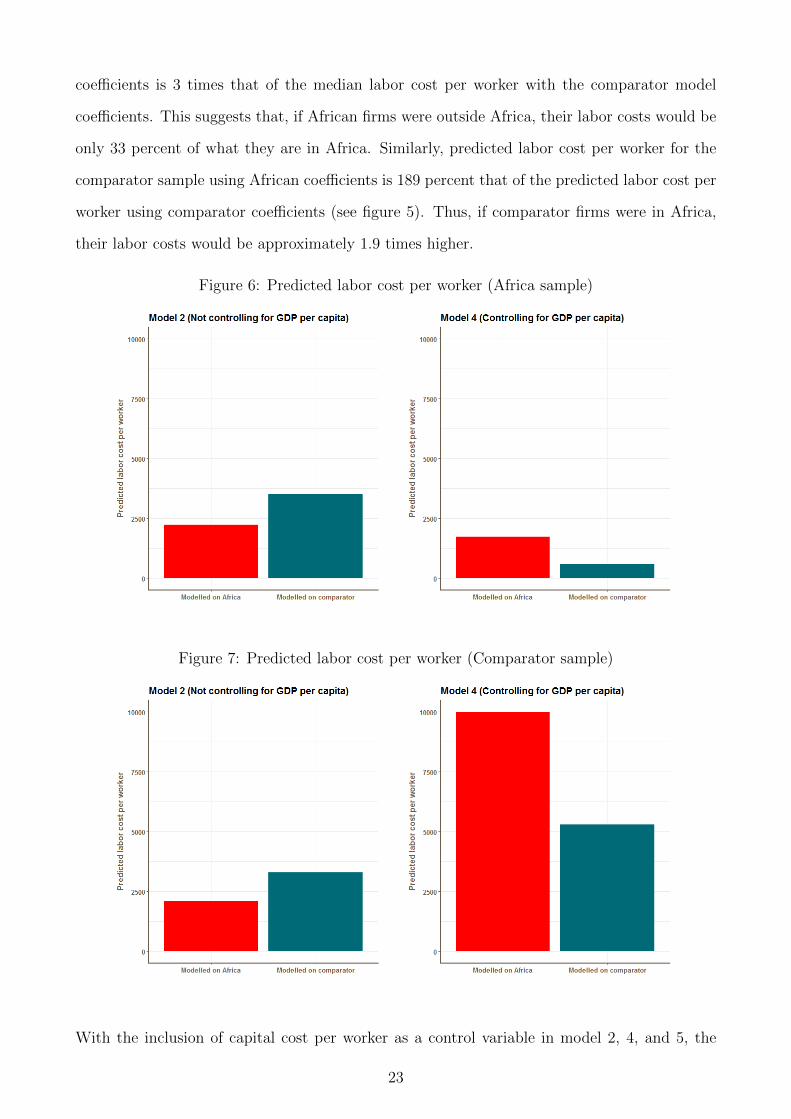
coefficients is 3 times that of the median labor cost per worker with the comparator model
coefficients. This suggests that, if African firms were outside Africa, their labor costs would be
only 33 percent of what they are in Africa. Similarly, predicted labor cost per worker for the
comparator sample using African coefficients is 189 percent that of the predicted labor cost per
worker using comparator coefficients (see figure 5). Thus, if comparator firms were in Africa,
their labor costs would be approximately 1.9 times higher.
Figure 6: Predicted labor cost per worker (Africa sample)
Figure 7: Predicted labor cost per worker (Comparator sample)
With the inclusion of capital cost per worker as a control variable in model 2, 4, and 5, the
23

coefficients for other independent variables do change but only slightly. The coefficient for
change in capital cost per worker is highly significant and has a positive relationship with
change in labor cost per worker for both African firms and comparator firms. This relationship
is as expected—firms that shift towards higher capital intensity tend to have more skilled
employees, which would generally contribute to higher labor costs. A ten percent increase
in cost of capital per worker correlates with 2.3 percent increase in labor cost per worker for
African firms and with 2.14 percent increase in labor cost per worker for comparator firms.
This difference indicates that an increase in capital costs is associated with higher labor costs
in African firms more so than in comparator firms, perhaps because of a premium associated
with high skill labor in Africa.
The data also suggest that differences in human capital, measured as the ratio of skilled pro-
duction workers to unskilled production workers, are significantly related to change in labor
costs in comparator firms, but not in African firms. However, this relationship is lost with
inclusion of capital cost and GDP per capita as control variables.
A number of firms change categories—firms shift from being minority to major foreign owned
and vice versa. The shift towards majority foreign ownership is correlated, with marginal signif-
icance, with higher labor costs for African firms (but not for comparators). The relationship of
foreign ownership with labor cost persists even with inclusion of more control variables. Many
more firms in Africa are foreign-owned than comparator firms. Such an “enclave effect” may
contribute to the difference in the relationship for African firms vs. comparators. In addition,
it is believed that foreign-owned firms in Africa are more sophisticated than domestic firms.
However, even after controlling for capital, a close proxy for level of sophistication, the rela-
tionship persists. If an African firm shifts towards majority foreign ownership, then the labor
cost per worker is 32.7 percent higher than an African firm that is owned by a local.
Finally, we include controls for any changes in firm size category. With little variation, we find
nearly all of the firm size category coefficients to be insignificant. However, in the comparator
sample, the coefficient for very large firms is significant and negative. GDP per capita also
varies only slightly over time, and is therefore not significant for African firms. It is significant
for comparator firms possibly because there is more variation in the comparator countries. In
24

addition, GDP per capita adjusted for age dependency ratio is used instead of only GDP per
capita to capture a more accurate proxy for a country’s productivity. We find no significant
difference with the inclusion of the adjusted measure of GDP per capita as opposed to the
ordinary measure.
Random Effects
Table 5 presents the results of random effects regressions with labor cost per worker as the
dependent variable and table 6 presents the results of the random effects regressions with unit
labor cost as the dependent variable. The “Africa premium” estimates the difference in the
coefficient for African firms and for comparator firms within the same firm size category.
The random effects model reiterates the pattern of the fixed effects regressions. Without con-
trolling for GDP, the Africa premium is negative, thus signaling that in absolute terms, the
labor cost per worker is lower in African firms. However, after controlling for GDP per capita,
the labor cost per worker for African firms is found to be much higher than those for comparator
firms.
Our estimates also suggest that the Africa premium is always positive. While a small African
firm is 39 percent more expensive than a small comparator firm, a medium African firm is 52.3
percent more expensive than a medium comparator firm. Medium and large African firms have
similar premiums associated with them—a large African firm is 49.7 percent more expensive
than a large comparator firm. A very large African firm is most expensive with a premium of
54.7 percent over a very large comparator firm.
We find evidence of a pay gradient in comparator firms—that labor in larger firms is more
expensive than in smaller firms. However, the Africa pay gradient is almost always steeper.
Labor in a medium-sized African firm, is on average, 26.6 percent more expensive than a
small firm, this difference is only 6 percent for comparator firms. The pay gradient is steeper
for comparator firms when we compare large firms to medium sized firms (14 percent for
comparator firms vs. 5.8 percent for African firms).
25

Table 5: Random effects model
(1) (2) (3) (4) (5)Log labor cost
per workerAfrica
premiumLog labor cost
per workerAfrica
premiumLog labor cost
per workerAfrica
premiumLog labor cost
per workerAfrica
premiumLog labor cost
per workerAfrica
premium
Africa small firm -1.036*** -1.036*** -0.782*** -0.782*** 0.413* 0.413* 0.271 0.271 0.390** 0.39**(0.0947) (0.0828) (0.219) (0.217) (0.177)
Comparatormedium firm
-0.0398 - -0.0153 - 0.0608+ - 0.0660+ - 0.0499 -
(0.0570) (0.0539) (0.0415) (0.0422) (0.0454)Africa medium firm -0.510*** -0.470*** -0.452*** -0.437*** 0.726*** 0.665*** 0.603*** 0.537*** 0.573*** 0.523***
(0.0816) (0.0763) (0.188) (0.196) (0.153)Comparatorlarge firm
-0.115* - -0.117* - 0.194** - 0.207*** - 0.126** -
(0.0679) (0.0644) (0.0769) (0.0768) (0.0532)Africa large firm -0.0609 0.054 -0.159+ -0.042 0.899*** 0.705*** 0.802*** 0.595** 0.623*** 0.497**
(0.108) (0.102) (0.230) (0.245) (0.214)Comparatorvery large firm
-0.449*** - -0.286*** - 0.0993 - 0.123 - 0.111 -
(0.106) (0.0945) (0.106) (0.106) (0.0950)Africa very large firm -0.0182 0.431** -0.0235 0.263 0.893*** 0.794*** 0.811*** 0.688*** 0.658*** 0.547***
(0.198) (0.210) (0.180) (0.194) (0.184)Log GDP per capita 0.796*** 0.659***
(0.0819) (0.0625)Log GDP per capita(age dep. adj.)
0.817***
(0.0853)
N 5467 5467 4565
Standard errors in parentheses+ p<0.15 * p<0.1 ** p<0.05 *** p<0.01
26
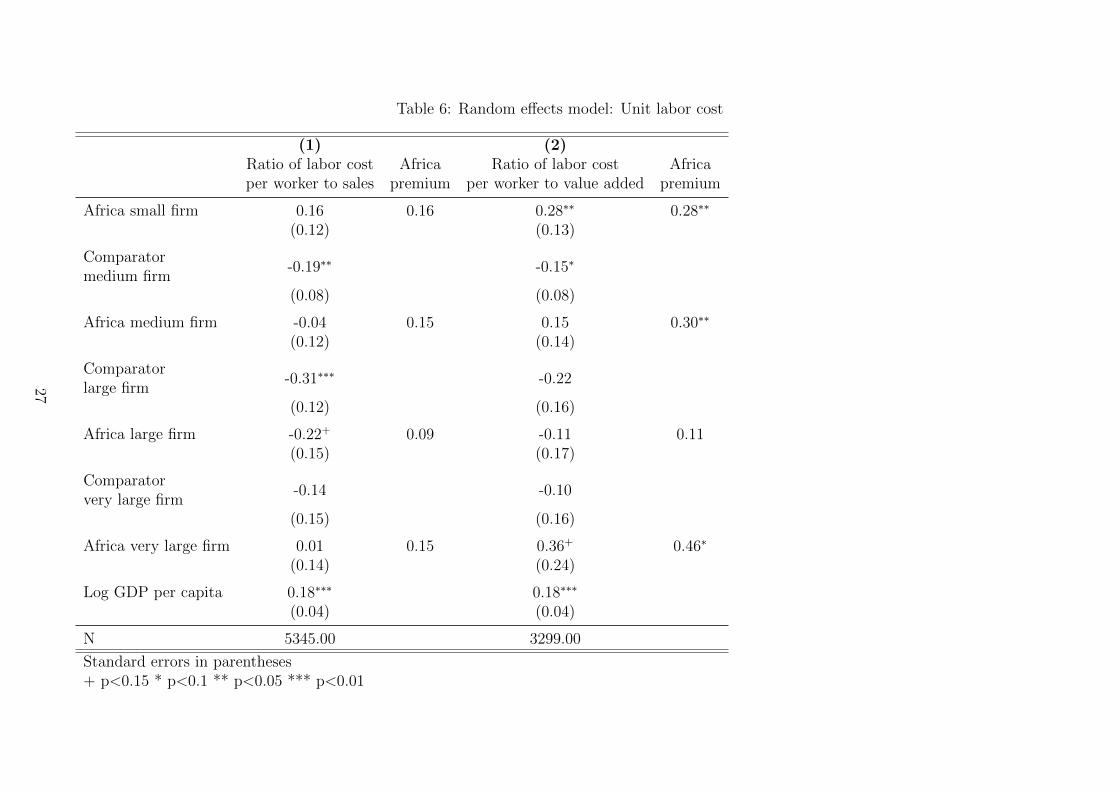
Table 6: Random effects model: Unit labor cost
(1) (2)Ratio of labor costper worker to sales
Africapremium
Ratio of labor costper worker to value added
Africapremium
Africa small firm 0.16 0.16 0.28∗∗ 0.28∗∗
(0.12) (0.13)
Comparatormedium firm
-0.19∗∗ -0.15∗
(0.08) (0.08)
Africa medium firm -0.04 0.15 0.15 0.30∗∗
(0.12) (0.14)
Comparatorlarge firm
-0.31∗∗∗ -0.22
(0.12) (0.16)
Africa large firm -0.22+ 0.09 -0.11 0.11(0.15) (0.17)
Comparatorvery large firm
-0.14 -0.10
(0.15) (0.16)
Africa very large firm 0.01 0.15 0.36+ 0.46∗
(0.14) (0.24)
Log GDP per capita 0.18∗∗∗ 0.18∗∗∗
(0.04) (0.04)
N 5345.00 3299.00
Standard errors in parentheses+ p<0.15 * p<0.1 ** p<0.05 *** p<0.01
27

Finally, we estimate weighted random effects regression models using the synthetic control as
the comparator. The results are shown in table 7. They are essentially the same as those for the
unweighted regressions, suggesting that observed differences between manufacturing in Africa
and elsewhere is not simply due to an unbalanced comparison. Similarly, we find results are
little changed if we use age-dependency adjusted GDP per head in the regressions.
28
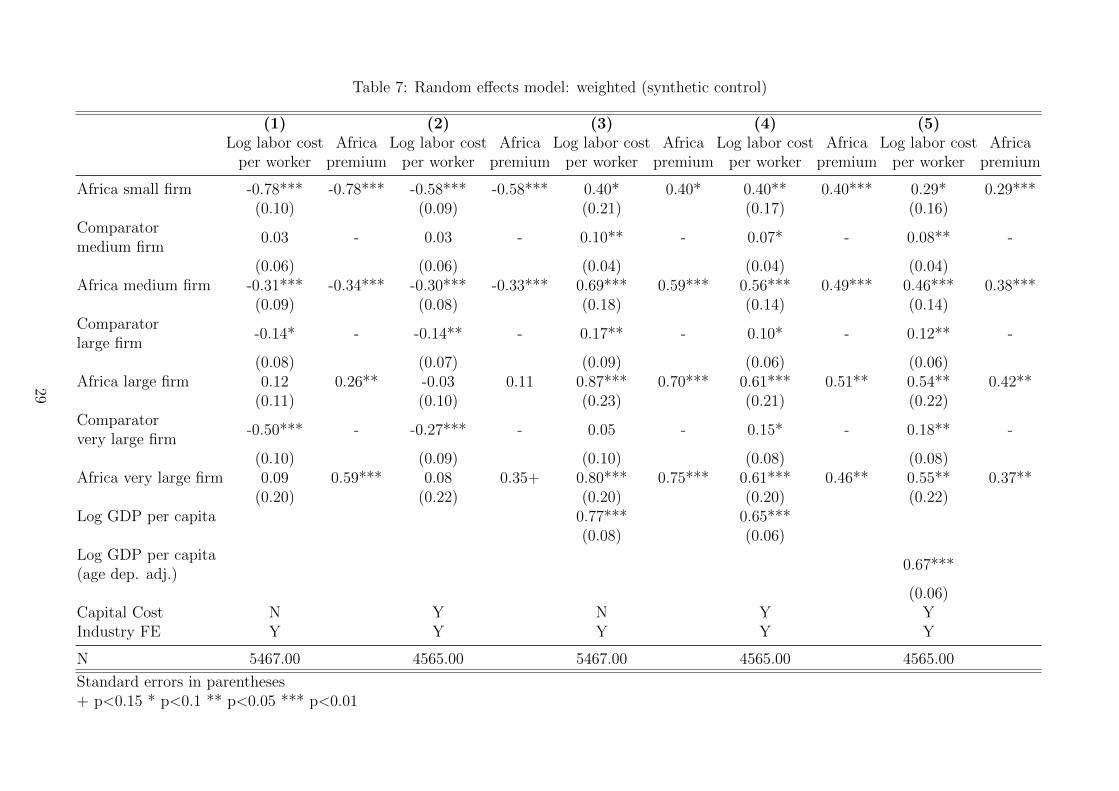
Table 7: Random effects model: weighted (synthetic control)
(1) (2) (3) (4) (5)Log labor cost
per workerAfrica
premiumLog labor cost
per workerAfrica
premiumLog labor cost
per workerAfrica
premiumLog labor cost
per workerAfrica
premiumLog labor cost
per workerAfrica
premium
Africa small firm -0.78*** -0.78*** -0.58*** -0.58*** 0.40* 0.40* 0.40** 0.40*** 0.29* 0.29***(0.10) (0.09) (0.21) (0.17) (0.16)
Comparatormedium firm
0.03 - 0.03 - 0.10** - 0.07* - 0.08** -
(0.06) (0.06) (0.04) (0.04) (0.04)Africa medium firm -0.31*** -0.34*** -0.30*** -0.33*** 0.69*** 0.59*** 0.56*** 0.49*** 0.46*** 0.38***
(0.09) (0.08) (0.18) (0.14) (0.14)Comparatorlarge firm
-0.14* - -0.14** - 0.17** - 0.10* - 0.12** -
(0.08) (0.07) (0.09) (0.06) (0.06)Africa large firm 0.12 0.26** -0.03 0.11 0.87*** 0.70*** 0.61*** 0.51** 0.54** 0.42**
(0.11) (0.10) (0.23) (0.21) (0.22)Comparatorvery large firm
-0.50*** - -0.27*** - 0.05 - 0.15* - 0.18** -
(0.10) (0.09) (0.10) (0.08) (0.08)Africa very large firm 0.09 0.59*** 0.08 0.35+ 0.80*** 0.75*** 0.61*** 0.46** 0.55** 0.37**
(0.20) (0.22) (0.20) (0.20) (0.22)Log GDP per capita 0.77*** 0.65***
(0.08) (0.06)Log GDP per capita(age dep. adj.)
0.67***
(0.06)Capital Cost N Y N Y YIndustry FE Y Y Y Y Y
N 5467.00 4565.00 5467.00 4565.00 4565.00
Standard errors in parentheses+ p<0.15 * p<0.1 ** p<0.05 *** p<0.01
29
Can Ethiopia be the New China?
These results do not suggest a particularly bright future for footloose, labor-intensive manufac-
turing in Africa. However, “Africa” encompasses a very wide range of countries and conditions.
The statistical picture suggests breaking down the African sample countries in three groups.
The first group consists of the solidly middle-income countries , dominated by South
Africa but also including Botswana. Relative to middle-income comparators, South Africa’s
labor costs are very high; they are the highest in the sample even though it includes some richer
countries.4 Even in the face of unemployment levels of between 20 and 30 percent, its industrial
sector is highly capital intensive. There are few small informal firms and those that do exist
have low productivity, even relative to firms in other, poorer, African countries (Gelb et al.,
2009). Irrespective of whether the cause of this dualism reflects structural factors or restrictive
labor laws and high statutory minimum wages, the country is not likely to emerge as a strong
competitor in labor-intensive industry in the foreseeable future. The furor over the Newcastle
experiment suggests that pay levels low enough to compete with poor countries are politically
unacceptable (Nattrass and Seekings, 2014).5
The second group includes leading low and lower-middle lower-income African coun-
tries like Kenya, Tanzania and Senegal—coastal, relatively stable, and with a strong business
sector, particularly in the case of Kenya. If any countries were to feature in an African man-
ufacturing take-off, these countries would surely be expected to be in the vanguard. Indeed,
there may be some local and regional stimulus from the growth in intra-African trade. Yet,
4Nattrass and Seekings (2013) describe how an alliance between organized labor, the state and some firmshas led to lower levels of employment in South Africa.
5In 2010 South Africa’s National Bargaining Council for the clothing industry launched an aggressive compli-ance drive against firms that were not compliant with the escalating wage levels set by the Council and Ministryof Labor. Many were concentrated in Newcastle, an area with few alternative employment options. The unionaccepted that there would be job losses when non-compliant firms were closed, but this was justified in termsof ensuring that the industry only provided ‘decent work’. Many firms were forced to close their doors, despitethe protests from local workers who saw no other employment possibilities.
30
taking the broader global picture, as shown in Table 3, their manufacturing labor appears costly
relative to that of Bangladesh, a country with comparable income level and WEF competitive-
ness rating. On average, the firms in these countries are also smaller; to the extent that they
confront a sharp pay gradient the picture is even more clouded since successful, expanding,
firms will probably need to pay still higher wages.
The third group consists of countries at the very low end of the income spectrum , so
poor that there are almost no real comparators. In our sample, the DRC, Ethiopia and, to a
lesser degree, Malawi, appear to fit the bill. As a destination for footloose manufacturing the
DRC is implausible. Rich in natural resources, the governance failings that have depressed its
business climate and income leave little opportunity for investors in such sectors; like Malawi,
the DRC is also very low on the WEF rankings.6 Ethiopia is another matter however. Though
landlocked, it has been moving towards easing logistics constraints through road and rail con-
nections; it also has good air connections. It benefits from a stable administration, that sees
the manufacturing as a central part of its growth strategy. It also benefits from generally low
costs. As measured by Purchasing-Power Parity, the general level of prices in Ethiopia is below
the level in India and comparable to that of in Bangladesh. The firm surveys also suggest
comparable levels of labor costs and a similar WEF Global Competitiveness ranking despite its
far lower income level.
Could Ethiopia become the new China? For the last several decades, Asian countries such
as China, India, and more recently, Bangladesh have been attractive destinations for low-wage
manufacturing. However, with labor costs now rising faster than gains in productivity, and with
the strengthening of their local currencies, large manufacturing firms have started exploring
opportunities for production outside Asia. Recently, Huajian International, a manufacturer of
shoes based in China, has been receiving complaints from workers about long hours (Bradsher,
2017); workers have also been seeking more pay. The young population of China is shrinking,
largely attributed to the “one child” policy; more youth are attending college and wanting office
jobs, instead of jobs in manufacturing. This shift in the demographic profile is contributing to
a fall in new labor entrants and a more expensive workforce for manufacturing jobs.
6The 2017 WEF competitiveness rankings for DRC and Malawi are 129 and 134 respectively.
31

Fashion brands like H&M, Guess, J. Crew, and Naturalizer are now finding potential in
Ethiopia, one of the few African countries being proclaimed for having cheap labor (Hansegard
and Vogt, 2013). Their optimism appears to be supported by the data—Figure 8 depicts the
median predicted labor costs per worker for all African countries and for Bangladesh, modeled
as if it was located in Africa. Ethiopia’s labor cost is reasonable compared to other African
countries as well as to Bangladesh, and appears similar to China in the 1980s.
Figure 8: Median predicted labor cost per worker using random effects coefficients
To provide further confirmation, we carried out a small survey of production workers in a typical
garment factory (Appendix B). Most were female, all had at least primary education and were
literate. For many, this was their first formal job. Wages were uniformly low, averaging around
$2 per day, but after allowing for the cost of local accommodation (which in this case was
not provided by the firm) this fell to little over $1 per day. At these pay levels, the cost of
industrial labor in Ethiopia would be only about 25% that of China today. From the employees’
responses, there is little prospect of supply and demand factors resulting in a rapid tightening
labor market. A common refrain was the desperate need for employment to absorb surplus
labor from the countryside. Ethiopia is one of the least urbanized countries, and, much like
China in the 1980s can offer a young, abundant, and well-educated workforce.
A recent McKinsey survey administered to Chief Procurement Officers of large apparel com-
panies, asked questions regarding which countries would serve as the top manufacturing desti-
32
nations in the next five years (Berg et al., 2015). While Bangladesh seemed to take the place
of China as the most attractive manufacturing location, this was the first time that several
survey respondents also expressed interest in African countries. Ethiopia was ranked seventh
in the world, and first among African countries, followed by Egypt and Tunisia, but none of
the leading lower-middle income countries made the grade. It seems that another reason why
some manufacturers are seeking to diversify away from Asian industrial locations is the ongo-
ing reputational problem of poor working conditions. Some claim that manufacturing working
conditions in Ethiopia—though far from ideal—are better than in Bangladesh and Cambodia
(Young, 2016). In the International Trade Union Global Rights Index, Ethiopia fared better
than Mexico and Malaysia (ibid.). Our survey results were mixed in this area, with some voic-
ing health and safety concerns but others appreciating their jobs despite low pay and expressing
good relationships with supervisors.
Nevertheless, certain factors could derail industrialization in Ethiopia. Political unrest could
unsettle investment in the manufacturing sector if repeated on the scale seen in 2015 and 2016.
Even with some of the cheapest electricity in Africa, grid failure and power outages are severe
issues. Manufacturing firms often have to rely on generators that are four times more expensive
than grid electricity. There has been some support from the Ethiopian government to improve
electricity access by setting up a grid for industrial zones and ensuring its reliability, as well
as major investments to tap the country’s abundant hydroelectric potential. If successful in
these areas, Ethiopia could as well emerge as the China of Africa. In fact, H& M has already
begun its factory operations in Mekelle, promising 4000 jobs to locals (Scarano, 2016). Some
are hopeful that this high-profile venture will attract many more investors to the country.
33

Conclusion: Can Manufacturing Drive Africa’s
Development?
It is always risky to speculate on the future, especially considering evolving trends in technology
which will shape the evolution of comparative and absolute advantage in manufacturing, among
other sectors (Norton, 2017). However, based on the survey data, Africa does not, in general,
appear to be poised to embark on a manufacturing-led take-off, stepping into the shoes of
emerging Asia. The results described in this paper confirm that lower-income Africa, including
countries that have come to be thought of as leaders in development, has high manufacturing
labor costs relative to GDP as well as high capital costs relative to low-income comparators.
Labor in middle-income Africa is also very expensive relative to comparator middle income
countries. Re-balancing the comparators through a simple synthetic control and adjusting for
demographic differences does not change these conclusions.
Breaking “Africa” down into sub-groups suggests a more nuanced picture. Within the sample,
Ethiopia stands out as distinctive. Its income level is so low that there is no real external
comparator; its costs also appear to be low. This opens up the question of whether the investors
migrating out of emerging Asia will pass over middle and lower-middle income Africa to find
a landing place in the poorest countries, provided that these countries can provide a stable
platform for the industry. The survey results suggest that this is not impossible, and they are
supported by other, emerging, evidence.
Our results suggest further avenues of research. We do not really understand the factors behind
prices and costs, whether for industrial labor or, more generally, in terms of purchasing-power
parity price levels, and why so many African countries appear to be costly relative to their
income levels.7 It would also be useful to understand better the determinants of industrial
7Gelb and Diofasi (2015) find a number of factors associated with higher, or lower, purchasing-power pricelevels but fail to account for the Africa differential.
34

investment and development in the poorest countries where carefully designed industrial policy
can possibly unleash the potential for manufacturing and rapid industrialization, as well as the
impact on living standards.
35

Appendix A: Results of Fixed Effects Models
36

Table A1: Fixed effects model: Africa
(1) (2) (3) (4) (5)Log labor cost
per workerLog labor cost
per workerLog labor cost
per workerLog labor cost
per workerLog labor cost
per workerRatio of skilled to unskilled workers 0.0138 0.00488 0.0116∗∗∗ 0.00406 0.00431
(0.0100) (0.0107) (0.00377) (0.0103) (0.0103)Foreign ownership of firm >= 50 percent 0.255+ 0.292+ 0.293+ 0.327+ 0.327+
(0.171) (0.196) (0.191) (0.188) (0.188)Medium -0.197 -0.381 -0.217 -0.407 -0.408
(0.263) (0.305) (0.327) (0.369) (0.368)Large -0.179 -0.481 -0.247 -0.550 -0.557
(0.303) (0.355) (0.443) (0.522) (0.521)Very Large -0.771∗ -0.724+ -0.889∗ -0.881∗ -0.892∗
(0.399) (0.472) (0.493) (0.464) (0.460)Log Capital/w 0.244∗∗∗ 0.238∗∗∗ 0.239∗∗∗
(0.0452) (0.0745) (0.0746)Log GDP in USD 2010 1.006 0.960
(1.038) (0.992)Log GDP (age dependency adjusted) 1.054
(1.010)Constant 7.721∗∗∗ 5.914∗∗∗ 0.440 -1.001 -2.332
(0.200) (0.428) (7.439) (7.171) (7.919)N 1367 1161 1367 1161 1161r2 0.0198 0.166 0.0328 0.177 0.178
Standard errors in parentheses+ p<0.15, ∗ p<0.1, ∗∗ p<0.05, ∗∗∗ p<0.01
37

Table A2: Fixed effects model: Comparator
(1) (2) (3) (4) (5)Log labor cost
per workerLog labor cost
per workerLog labor cost
per workerLog labor cost
per workerLog labor cost
per workerRatio of skilled to unskilled workers -0.00532∗∗∗ -0.00138 -0.00556∗∗∗ -0.00117 -0.00129
(0.000213) (0.00447) (0.000322) (0.00656) (0.00642)Foreign ownership of firm >= 50 percent 0.216 0.0249 0.126 -0.0638 -0.0570
(0.185) (0.194) (0.167) (0.0899) (0.0881)Medium -0.150 -0.147 -0.164+ -0.175+ -0.170+
(0.119) (0.127) (0.0952) (0.113) (0.112)Large -0.377∗∗ -0.229 -0.429∗ -0.293+ -0.286+
(0.176) (0.184) (0.216) (0.179) (0.177)Very Large -1.107∗∗∗ -0.511∗ -1.125∗∗∗ -0.578∗∗∗ -0.574∗∗∗
(0.309) (0.297) (0.335) (0.179) (0.174)Log Capital/w 0.226∗∗∗ 0.214∗∗∗ 0.215∗∗∗
(0.0303) (0.0522) (0.0517)Log GDP in USD 2010 1.461∗∗∗ 1.117∗
(0.440) (0.620)Log GDP (age dependency adjusted) 1.232∗
(0.691)Constant 8.251∗∗∗ 6.359∗∗∗ -4.106 -3.052 -4.567
(0.108) (0.285) (3.672) (4.885) (5.784)N 4363 3512 4363 3512 3512r2 0.0370 0.117 0.0606 0.133 0.132
Standard errors in parentheses+ p<0.15, ∗ p<0.1, ∗∗ p<0.05, ∗∗∗ p<0.01
38
Appendix B: Results from a Survey of Manufacturing
Workers in Ethiopia
Christian J. Meyer
European University Institute
This appendix summarizes data from a qualitative survey of 30 randomly chosen manufacturing
workers in Ethiopia. The survey was conducted between December 2016 and January 2017 with
workers in a foreign-owned factory outside of Ethiopia’s capital Addis Ababa.8
In addition to collecting basic socioeconomic and demographic information, the survey focused
on four areas:
1. Employment Search, Application, Motivation
2. Type of Work, Satisfaction, and Stress on the Job
3. Transportation and Housing
4. Your Job and Your Family and Community
Summary of the Survey Protocol
After obtaining consent, workers were asked if they preferred to be interviewed in a private room
on the factory premises or outside the factory in their homes or in a public space. Most inter-
views (76 percent) were conducted on factory premises. Interviews were conducted by trained
female qualitative enumerators in the native language of the respondents, either Oromiffa or
Amharic. Only the worker and the enumerator were present during the interview. For conver-
sations on factory premises, special care was taken to ensure that the conversation was private
8Detailed information about the firm are available from the authors upon request.
39

and confidential. Interviews lasted between 60 to 90 minutes.
Enumerators recorded the interviews using a voice recorder and took notes in especially marked
notebooks that were provided to them for this purpose. After the interview was concluded,
enumerators transcribed the voice recording and their notes into a Word document. A research
assistant additionally checked all transcriptions against the original notes and voice recordings.
Sample Characteristics
Respondents of the survey are on average 25 years old. 70 percent are female. They are largely
not married (63 percent not married) or have any children (71 percent have no children).
Table A3: Age
Mean Median SD
Female 24 23 4.82Male 28 28 4.24
Figure 9: Number of Children (Female Respondents)
More than half of all respondents have completed at least secondary education. 100 percent
40

of the sample are literate. For 73 percent of respondents, their current job represents the first
time that they work in formal firm.
Figure 10: Highest level of education completed
Employment Search, Application, Motivation
Before taking their current job, 47 percent of respondents were not employed—they were either
unemployed and actively looking for work (30 percent) or in education (17 percent). Another
27 percent were employed in the private sector and 13 percent worked in their own household.
Hiring
Vacancies are posted on the factory gate. The application process involves presenting a Kebele
ID card and educational certificate. More recent hires report being asked to present a reference
letter for good personal standing in the Kebele and health certificate (in particular a pregnancy
and vision test). More recent hires seem to go through a short interview about previous work
experience, education, personal background. Other jobs than machine operator appear to have
more extensive interviews and practical tests. There are numerous reports of hiring based on
physical attractiveness, height, origin, or language. Factory management appears to be (or
have been) the driving force behind selecting candidates based on physical attractiveness.
41
There appears to be minimal or no on-the-job training. 50 percent of respondents report having
received no training whatsoever, neither soft skill nor hard skill training. The median number of
training days reported across all respondents is 0.5. Workers report receiving an introduction
to basic sanitation, work safety, HIV, and sexual harassment training. Job-related training
appears to be conducted by supervisors directly.
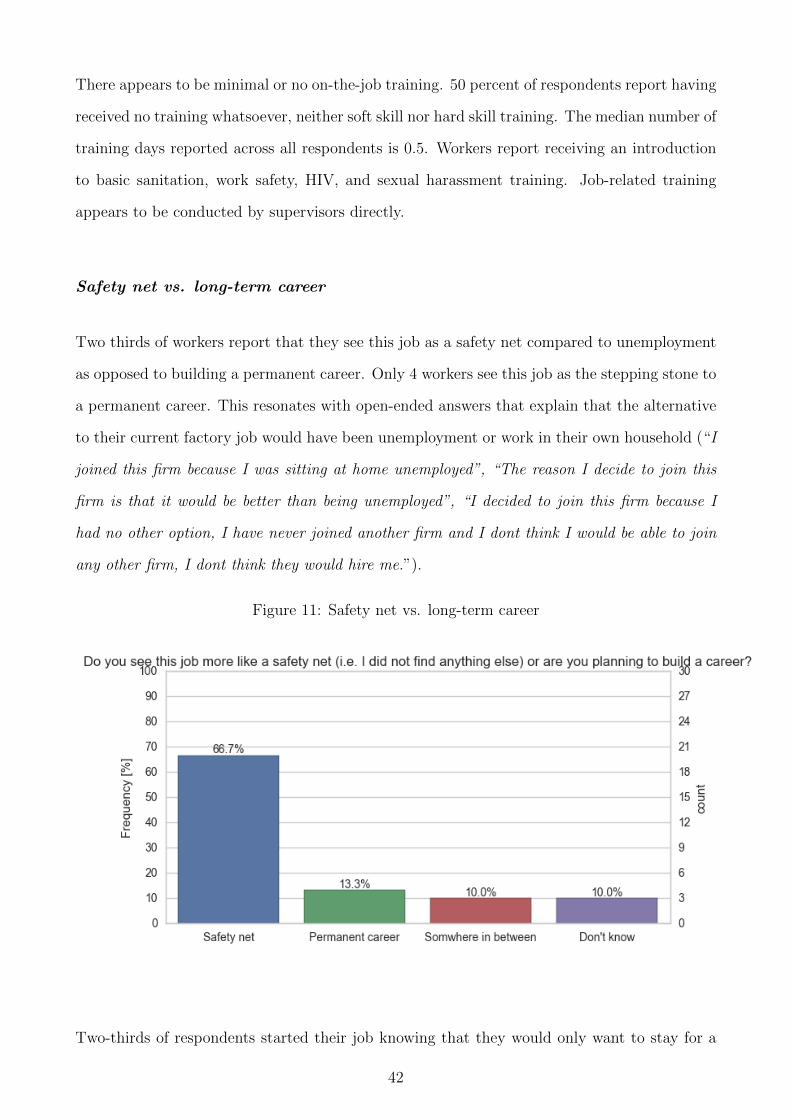
Safety net vs. long-term career
Two thirds of workers report that they see this job as a safety net compared to unemployment
as opposed to building a permanent career. Only 4 workers see this job as the stepping stone to
a permanent career. This resonates with open-ended answers that explain that the alternative
to their current factory job would have been unemployment or work in their own household (“I
joined this firm because I was sitting at home unemployed”, “The reason I decide to join this
firm is that it would be better than being unemployed”, “I decided to join this firm because I
had no other option, I have never joined another firm and I dont think I would be able to join
any other firm, I dont think they would hire me.”).
Figure 11: Safety net vs. long-term career
Two-thirds of respondents started their job knowing that they would only want to stay for a
42
specific amount of time. Of these respondents, the average length of expected employment was
slightly more than a year.
Alternatives to this job
In their answers to open-ended questions about the job, most workers did not regret taking
this job. Many emphasize that they had no other opportunity, except for unemployment (see
previous paragraph). On the one hand, most workers do not like the job per se and/or highlight
many downsides—most importantly the low wage. On the other hand, most workers cannot
get themselves to take a different job, either because they think they would not qualify, because
they do not have time to look for another job, or because they do not have sufficient capital
to start their own business. Some workers seem resigned and are not hopeful that they would
find a better job.
Numerous workers discuss other manufacturing firms in the region in comparison to their cur-
rent job. Some of them reportedly have better pay, better working hours, or better bene-
fits—though answers that mention specific firms are mixed and inconsistent. Some workers
also describe their current job as better (cleaner environment, less stressful, less dangerous)
compared to similar manufacturing jobs in the region. Overall, workers do not appear to have
full information over the available options and the specific packages that they offer (“firm X is
better because they pay more, firm X is worse because they pay less”).
Irrespective of specific alternatives, the vast majority of respondents criticize the low wage that
they receive. Several respondents note that this job is better than being a day laborer for the
safety that the contract affords them. Workers also highlight the benefits package (free food
and transportation) as a plus of their current job compared to others.
When asked about specific alternatives, almost all workers mention small-scale (subsistence)
entrepreneurship such as selling items, driving a car, trading, artisanal production of fabrics, etc.
as their preferred alternative to factory employment—but cite insufficient capital as constraint.
Flexibility of working hours and higher potential earnings are two main reasons cited in favor
of subsistence entrepreneurship.
43
Several workers describe specific manufacturing firms in the area as because of what is perceived
to be a better benefits package. Some workers report obtaining more education as the most
relevant alternative to their current job.
Attrition
Attrition as reported in the coded question of our survey does not stand out as particularly
high. When asked about friends and colleagues that left the company, 43 percent of respondents
in our survey indicated that they had stayed for a “long time, usually more than a year”, while
another 43 percent indicated that the time varied. In an open-ended question about worker
attrition, most respondents suggest that a significant number of workers are quitting their jobs
every month and that attrition tends to be high.
Almost all respondents indicated that the biggest reason for attrition is the low pay. In addition
to the base pay that is found to be very low, many workers indicate that the progression over
time is very low and does not incentivize longer tenure. Salary progression not only appears to
be very low, but pay raises—if they happen—are also seen as not transparent and arbitrary.
Seniority in general does not appear to be rewarded (“If I work in this factory for about 5 years
and [...] one day I did something [wrong] they do not consider what I have been doing well [in
the past but only] see what I did [...] wrong”). Many workers characterize the raise that they get
after their first year as lower than expected. There appears to be no long-term perspective for
professional development. It appears to be that workers are clearly not hyperbolic discounters,
but that they are leaving because they are looking for jobs that offer better opportunities for
future salary increases.
The pay levels are seen as low compared to the overall cost of living (“In relation to our salary
the cost of life is high”), compared to the amount of money that workers want to send home
(“[I] need to send about 200 birr home, [and my] salary [is] not enough to cover this”), and
compared to the demands of the job. Several workers report that when they raised concerns
over low pay or low wage progression with the company, the management threatened to, or in
some cases did, call the Ethiopian Federal Police to shut down any industrial action.
44

Interestingly, only few respondents explicitly mention the poor working conditions (e.g. unsafe
conditions, health risks, inflexible shifts) as reasons for leaving the job. The most common
reason that is not directly related to pay appears to be that workers do not feel respected by
company management. Based on the open-ended answers, one could get the impression that
the overall working conditions are almost expected—but that the conditions would be more
acceptable if workers felt more appreciated by company management. This can be illustrated,
for example, by the attitude of management to workers seeking education. Several respondents
indicate that there is not only a lack of flexibility in shift assignments around worker needs,
but that management actively discourages combining education and work.
It appears that working conditions in the Gulf might be even worse, but that better pay there
(at least partly) compensates for this. For the workers in Ethiopia, poor working conditions,
very little pay, lack of perspective, and lack of appreciation by company management appear
to reduce the job to a mere safety net.
Type of Work, Satisfaction, and Stress on the Job
When asked about their overall satisfaction with the job, an overwhelming majority of respon-
dents indicate that they are unhappy. There is a lot of support for the view that this job is
a safety net and the last option before unemployment. Many workers do not think they have
other opportunities, or see their job as a temporary position until they can find something
better. For their country, most workers think that manufacturing firms like theirs are good for
the country because they reduce the unemployment rate. There is very little to no support for
the notion that these jobs allow for skill upgrading or can be seen as “ladders” for employees.
Many respondents criticize unsafe working conditions, particularly the lack of safety gear and
exposure to hazardous substances.
With regards to relations with their coworkers and management, most respondents indicate
that they do not feel respected or recognized by company management. Reports on immediate
supervisors are mixed. In line with reasons listed for attrition, it appears that more perceived
goodwill on the part of company management could go a long way in making the job more
45
bearable. There are repeat mentions of discrimination based on ethnicity, gender, and physical
attractiveness. The workers association is seen as broadly ineffective.
As outlined above, low salary and low salary progression are frequently highlighted by respon-
dents.
Transportation and Housing
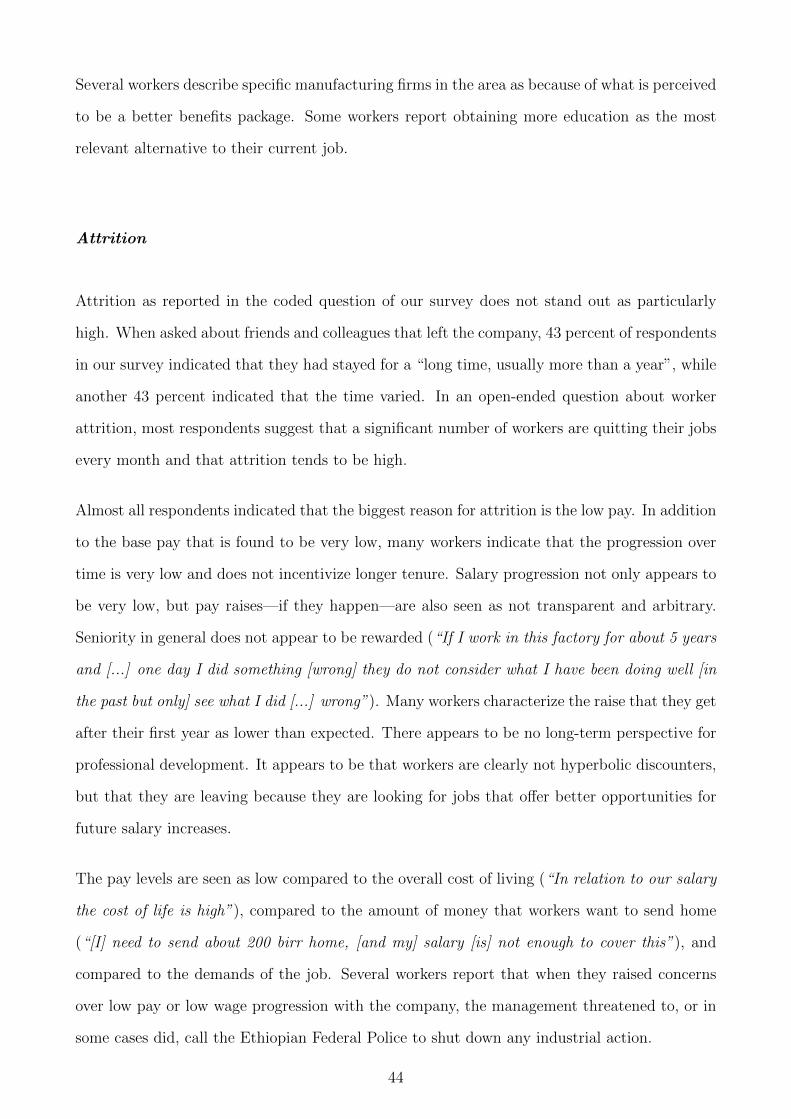
Most of the respondents report living in a privately rented apartment or house (Figure 4, top
panel). Of the respondents that rent their dwelling, half pay for it themselves. Only one
respondent reports the dwelling to be paid for by another family member. Irrespective of the
type of dwelling, 40 percent of respondents live alone, 30 percent of respondents live with family
(Figure 4, bottom panel).
Figure 12: Status of Dwelling
46

Almost all respondents use the free company bus service to travel from their homes to the
factory. On average, respondents report spending 77 minutes in transit (round trip) every day.
Your Job and Your Family and Community
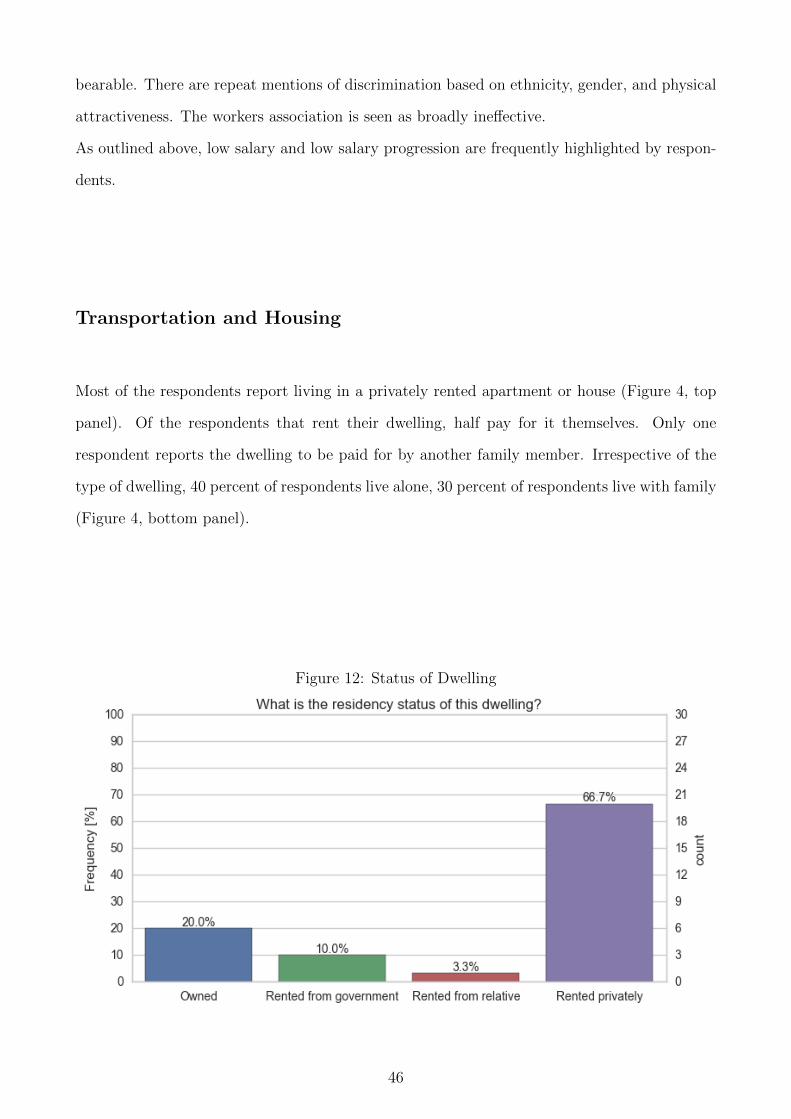
Pressure to Share Income
We directly address the question of whether workers feel more pressure to share income with
their family or community in their current job than in other jobs. About two thirds of respon-
dents say that this is indeed the case. However, it is important to note that respondents also
note that this pressure arises from the salary being too low rather than too high.
47
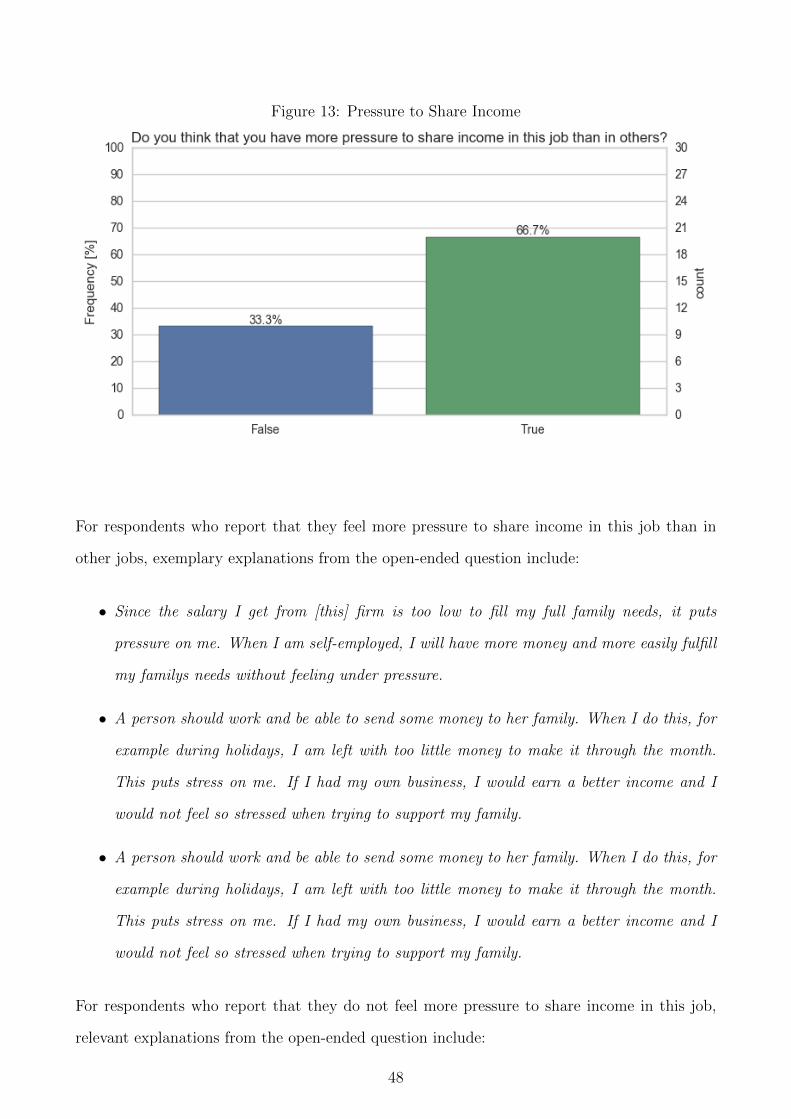
Figure 13: Pressure to Share Income
For respondents who report that they feel more pressure to share income in this job than in
other jobs, exemplary explanations from the open-ended question include:
• Since the salary I get from [this] firm is too low to fill my full family needs, it puts
pressure on me. When I am self-employed, I will have more money and more easily fulfill
my familys needs without feeling under pressure.
• A person should work and be able to send some money to her family. When I do this, for
example during holidays, I am left with too little money to make it through the month.
This puts stress on me. If I had my own business, I would earn a better income and I
would not feel so stressed when trying to support my family.
For respondents who report that they do not feel more pressure to share income in this job,
relevant explanations from the open-ended question include:
48

• Irrespective of my job, I have the same pressures to share my income with my family.
Industry does not make a difference.
• Since the income I earn is not enough to sustain my own life for a whole month, let alone
share it with others.
Half of all respondents reported that in this current job, their family or community turns to
them for financial or non-financial help, or for both (Figure 5). From the open-ended question,
it appears that respondents find it difficult to provide financial help due to their low salary.
This is in line with workers reporting that if they do help, they like to provide in-kind support
or help with their family with labor whenever they are not working in the factory.
Figure 14: Family turns to worker for help
Slightly more than half (53.5 percent) of all respondents reported that before they had their
current job, their family similarly helped them. Of those who reported that their family helped
them, the largest share said that they received both financial and non-financial support.
How has that changed now that workers have their job? The overall percentage of workers
reporting that their family or community helps them only decreases slightly, from 53.5 percent
before they had the job to 46.6 percent now. As one would expect, of the workers that still
turn to their family or community for help, most of them now do so for non-financial help.
This suggests that having the job decreased financial reliance on family/community. At the
49
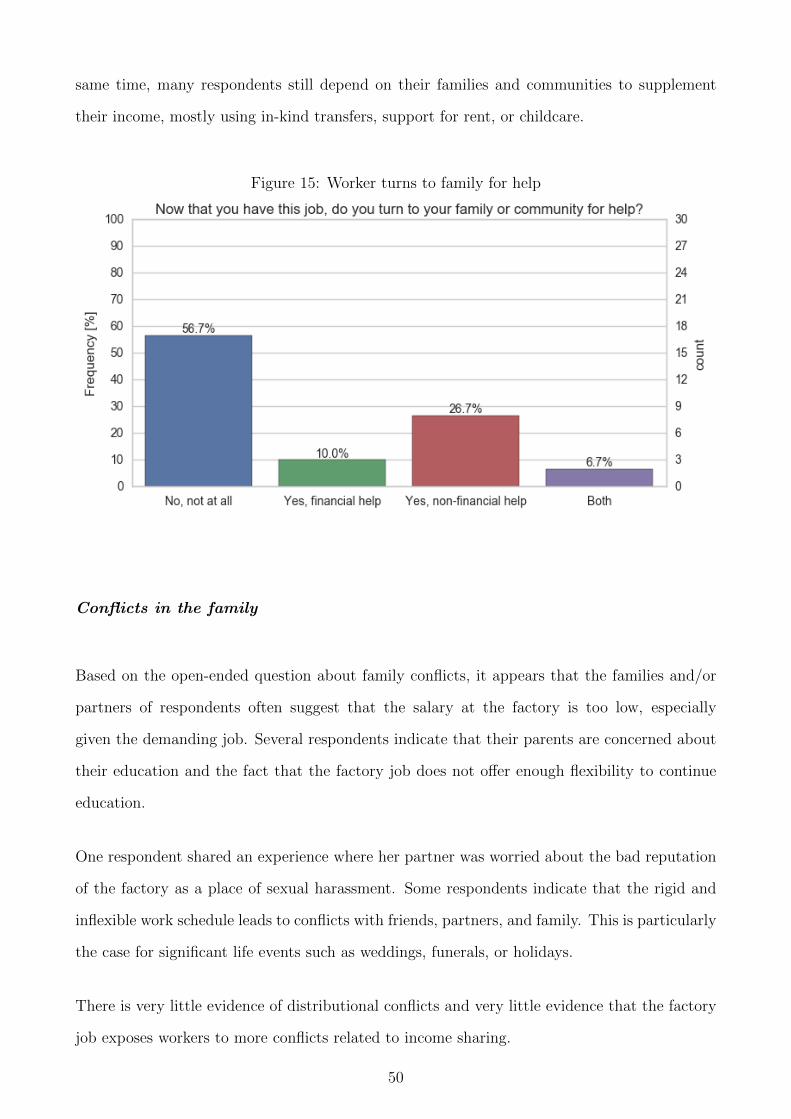
same time, many respondents still depend on their families and communities to supplement
their income, mostly using in-kind transfers, support for rent, or childcare.
Figure 15: Worker turns to family for help
Conflicts in the family
Based on the open-ended question about family conflicts, it appears that the families and/or
partners of respondents often suggest that the salary at the factory is too low, especially
given the demanding job. Several respondents indicate that their parents are concerned about
their education and the fact that the factory job does not offer enough flexibility to continue
education.
One respondent shared an experience where her partner was worried about the bad reputation
of the factory as a place of sexual harassment. Some respondents indicate that the rigid and
inflexible work schedule leads to conflicts with friends, partners, and family. This is particularly
the case for significant life events such as weddings, funerals, or holidays.
There is very little evidence of distributional conflicts and very little evidence that the factory
job exposes workers to more conflicts related to income sharing.
50
What the family, community, or employer could do
The most commonly-cited requests by workers to their family, partner, or community include
in-kind support, help with domestic work and childcare.
Workers appear to be severely capital constrained. They frequently mention that their families
could support them more financially. Several respondents indicate that family-provided seed
funding for their own business would be helpful. They appear to prefer their families to help
them with capital instead of financing for day-to-day consumption. Families either seem to
be understanding and supportive of workers, or concerned that workers do not earn enough.
Again, there is no evidence that workers are hyperbolic discounters. Investments in education
is another area where workers are looking for support from their families.
In line with comments about factory management that does not appreciate the workers, a strik-
ingly large number of respondents indicate that they would like to see the company demonstrate
more goodwill vis-a-vis workers. These include in-kind gifts (such as defective products and food
items) and charitable and corporate social responsibility activities (such as water treatment in
nearby communities, support for elderly, orphans, education, parties).
Respondents indicate that trust issues would make a company-sponsored savings program diffi-
cult to implement. Respondents also indicate that their salary is already so low that they would
not be interested in part of that income to be allocated to a savings fund. This is particularly
exacerbated by workers facing pressure to redistribute income.
There appears to be demand for programs that educate the communities of the workers about
the type of work that respondents engage in (“the factory can call our family or community, one
family member per worker [to arrange] a program and to introduce [...] work situation so that
our family understands our working condition/nature better and give us needed consideration”).
Respondents indicate that the company would likely only consider such programs if it was in
their commercial interest.
Several respondents indicate that company-provided housing would be helpful. Similarly, sev-
eral respondents indicate that they would like to see more training programs. One respondent
indicated that employer-sponsored savings groups could be worthwhile.
51

References
Abadie, A., Diamond, A., and Hainmueller, J. (2007). Synthetic control methods for compar-
ative case studies: Estimating the effect of california’s tobacco control program. National
Bureau of Economic Research.
Berg, A., Hedrich, S., and Russo, B. (2015). East Africa: The next hub for apparel sourcing?
McKinsey & Company.
Bradsher, K. (2017). Chinese Maker of Ivanka Trumps Shoes Looks for Cheaper Labor. The
New York Times.
Economic Commission for Africa (2007). Economic Report on Africa 2007: Accelerating Africa’s
Development through Diversification. United Nations Economic Commission for Africa.
Eifert, B., Gelb, A., and Ramachandran, V. (2008). The Cost of Doing Business in Africa:
Evidence from Enterprise Survey Data. World Development Report, 36(9):1531–1546.
Fox, Louise, Thomas, Alun, and Haines, Cleary (2017). Structural Transformation in Employ-
ment and Productivity : What Can Africa Hope For? International Monetary Fund.
Gelb, A. and Diofasi, A. (2015). What Determines Purchasing Power Parity Exchange Rates?
- Working Paper 416. Center for Global Development.
Gelb, A., Mengistae, T., Ramachandran, V., and Shah, M. K. (2009). To Formalize or Not to
Formalize? Comparisons of Microenterprise Data from Southern and East Africa - Working
Paper 175. Center for Global Development.
Gelb, A., Meyer, C. J., and Ramachandran, V. (2013). Does Poor Mean Cheap? A Compar-
ative Look at Africa’s Industrial Labor Costs - Working Paper 325. Center For Global
Development.
52

Hansegard, J. and Vogt, H. (2013). H&M Looks to Source Clothing From Ethiopia. Wall Street
Journal.
Hausmann, R., Klinger, B., and Lawrence, R. (2008). Examining Beneficiation.
Nattrass, N. and Seekings, J. (2014). Job destruction in newcastle: minimum wage-setting and
low-wage employment in the south african clothing industry. Transformation journal.
Nattrass, N., Seekings, J., and Centre for Development and Enterprise (2013). Job destruction
in the South African clothing industry: how an alliance of organised labour, the state and
some firms is undermining labour-intensive growth. Centre for Development and Enter-
prise, Johannesburg, South Africa. OCLC: 936077705.
Norton, A. (2017). Automation and inequality: the changing world of work in the global South.
International Institute for Environment and Development.
Page, J. (2012). Can Africa Industrialise? Journal of African Economies, 21(suppl 2):ii86–ii124.
Scarano, G. (2016). H&M Commits to 4,000 New Jobs in Ethiopia. Sourcing Journal.
Schwab, K. and Sala-i Martın, X. (2016). The global competitiveness report 2016-2017: insight
report. World Economic Forum, Geneva. OCLC: 989119813.
Siba, E., Soderbom, M., Bigsten, A., and Gebreeyesus, M. (2012). Enterprise agglomeration,
output prices, and physical productivity: Firm-level evidence from Ethiopia. WIDER
Working Paper, (2012/85).
Soderbom, M. (2003). Are Manufacturing Exports the Key to Economic Success in Africa?
Journal of African Economics, 12(1):1–29.
Soderbom, M. and Teal, F. (2000). Skills, Investment and Exports from Manufacturing Firms
in Africa. CSAE-UNIDO.
Soderbom, M. and Teal, F. (2004). Size and efficiency in African manufacturing firms: evidence
from firm-level panel data. Journal of Development Economics, 73(1):369–394.
Swedfund (2016). Swedfund, H&M and DBL Group create 4,000 jobs in Ethiopia.
53

Tybout, J. R. (2000). Manufacturing Firms in Developing Countries: How Well Do They Do,
and Why? Journal of Economic Literature, 38(1):11–44.
Van Biesebroeck, J. (2005). Firm Size Matters: Growth and Productivity Growth in African
Manufacturing. Economic Development and Cultural Change, 53(3):545–83.
World Bank (2012). World Development Report 2013: Jobs. The World Bank. DOI:
10.1596/978-0-8213-9575-2.
Young, R. (2016). Made in Ethiopia: Fashion’s Next Sourcing Hub? The Business of Fashion.
54
Related Documents