pubs.acs.org/Macromolecules Published on Web 11/02/2010 r 2010 American Chemical Society Macromolecules 2010, 43, 9937–9944 9937 DOI: 10.1021/ma102031k Glassy Dynamics and Glass Transition in Nanometric Thin Layers of Polystyrene Martin Tress, † Michael Erber, ‡ Emmanuel U. Mapesa, † Heiko Huth, ^ Jan M€ uller, ‡ Anatoli Serghei, §, ) Christoph Schick, ^ Klaus-Jochen Eichhorn, ‡ Brigitte Voit, ‡ and Friedrich Kremer* ,† † Institute for Experimental Physics I, University of Leipzig, 04103 Leipzig, Germany, ‡ Leibniz-Institut f € ur Polymerforschung Dresden e.V., 01069 Dresden, Germany, § Department of Polymer Science and Engineering, University of Massachusetts Amherst, Amherst, Massachusetts 01003, United States, and ^ Physics Institute, University of Rostock, 18051 Rostock, Germany. ) Present address: Universit e Lyon 1, CNRS, UMR 5223, Ing enierie des Mat eriaux Polym eres, F-69622 Villeurbanne, France Received September 1, 2010; Revised Manuscript Received October 18, 2010 ABSTRACT: Broadband dielectric spectroscopy (BDS), spectroscopic vis-ellipsometry (SE), X-ray reflec- tometry (XRR), and alternating current (ACC) as well as differential scanning calorimetry (DSC) are combined to study glassy dynamics and the glass transition in nanometric thin (g5 nm) layers of polystyrene (PS) having widely varying molecular weights (27 500-8 090 000 g/mol). For the dielectric measurements two sample geometries are employed, the common technique using evaporated electrodes and a recently developed approach taking advantage of nanostructures as spacers. All applied methods deliver the concurring result that deviations from glassy dynamics and from the glass transition of the bulk do not exceed margins of (3K independent of the layer thickness and the molecular weight of the polymer under study. Our findings are discussed in the context of the highly controversial literature and prove that an appropriate sample preparation is of paramount importance. 1. Introduction The nature of the glass transition remains a subject of intense study for material as well as theoretical scientists. Several theo- retical approaches 1-3 have been suggested to explain this phenom- enon. The most recognized of these concepts is the idea of cooperative motion as empirically formulated by Adams and Gibbs. 1 Here, it is reasoned that for a sufficiently supercooled liquid, structural relaxation may occur if and only if a number of constituent molecules rearrange collectively. This cooperativity therefore suggests a certain length scale defining the cooperative region which grows with decreasing temperature. The existence of such a length scale of cooperative motion then points to finite size effects, that is, changes in the dynamics and glass transition temperature when the material is confined to length scales near the cooperative size. Such confinement can be achieved and studied using, inter alia, nanopores, 4 entangled polymers, 5 or thin films. 6 The latter provide an ideal sample geometry since the confinement dimension can be remarkably diminished by simply reducing the thickness of the films. Assuming the existence of finite size effects, the challenge then is quantifying a characteristic length scale for glass transition dynamics. In their work on cis-polyisoprene, a material which exhibits two distinct modes (a segmental mode resulting from configura- tional transitions of a few monomer segments and a normal mode associated with the fluctuations of the end-to-end distance of the chain) of relaxation processes, Bahar et al. 7 showed that the length scale of the segmental relaxation and hence the structure size underlying the dynamic glass transition is just about three repeat units (polymer segments). This result is supported by many reports that find no shifts in the dynamic glass transition and no change of T g down to film thicknesses of about 5 nm of polystyrene 8-19 and other polymers like poly(methyl methacrylate), 20 polysul- fone, 21 or poly(2-vinylpyridine). 22 Nonetheless, there are contra- dicting results 23-39 —especially from ellipsometric measurements— ever since the first reports of Keddie et al. 23,24 on polystyrene and poly(methyl methacrylate). In a recent work 19 on PS (M w = 319 000 g/mol) studied by combined BDS and SE, we showed that—compared to bulk— glassy dynamics in layers as thin as ∼5 nm (BDS) and ∼20 nm (SE) is not shifted. In the current work—using similar annealing procedures (in inert gas atmosphere well above T g for at least 12 h) for both techniques—we now extend this study to different molecular weights of polystyrene (27 000 < M w < 8 090 000 g/mol) and probe the M w dependence of the glassy dynamics. Further, we report in this article AC calorimetry (ACC) and X-ray reflectometry (XRR) measurements; the results are in quantita- tive agreement with the BDS and SE findings. 2. Experimental Details 2.1. Materials. Six different samples of atactic polystyrene (purchased from Polymer Standards Service GmbH) with vary- ing molecular weights and polydispersity indices (Table 1) were studied by BDS and SE. Highly polished (monocrystal 100) silicon wafers (purchased from microFab and www.University- Wafer.com for BDS and SE, respectively) with a native oxide layer of about 2 nm were used as substrates for film preparation. These wafers have ultraflat surfaces (with a root-mean-square roughness better than 6 A ˚ ) and, in the case of the ones used for BDS experiments, a typical resistivity less than 5 mΩ cm. Glass (microscope) slides (Carl Roth GmbH & Co. KG) were also used as substrates in some of the BDS measurements. Toluene (99.9% pure) and acetone (99.8% pure) were used as solvents for film preparation and cleaning purposes, respectively, and were obtained from Sigma-Aldrich GmbH. Except for filtering (Millex syringe filters, PTFE membrane with 0.2 μm pore size) *Corresponding author. E-mail: [email protected].

Welcome message from author
This document is posted to help you gain knowledge. Please leave a comment to let me know what you think about it! Share it to your friends and learn new things together.
Transcript
pubs.acs.org/MacromoleculesPublished on Web 11/02/2010r 2010 American Chemical Society
Macromolecules 2010, 43, 9937–9944 9937
DOI: 10.1021/ma102031k
Glassy Dynamics and Glass Transition in NanometricThin Layers of Polystyrene
Martin Tress,† Michael Erber,‡ Emmanuel U. Mapesa,† Heiko Huth,^ Jan M€uller,‡
Anatoli Serghei,§, ) Christoph Schick,^ Klaus-Jochen Eichhorn,‡ Brigitte Voit,‡ and
Friedrich Kremer*,†
†Institute for Experimental Physics I, University of Leipzig, 04103 Leipzig, Germany, ‡Leibniz-Institut f€urPolymerforschung Dresden e.V., 01069 Dresden, Germany, §Department of Polymer Science and Engineering,University of Massachusetts Amherst, Amherst, Massachusetts 01003, United States, and ^Physics Institute,University of Rostock, 18051 Rostock, Germany. )Present address: Universit�e Lyon 1, CNRS, UMR 5223,Ing�enierie des Mat�eriaux Polym�eres, F-69622 Villeurbanne, France
Received September 1, 2010; Revised Manuscript Received October 18, 2010
ABSTRACT: Broadband dielectric spectroscopy (BDS), spectroscopic vis-ellipsometry (SE), X-ray reflec-tometry (XRR), and alternating current (ACC) as well as differential scanning calorimetry (DSC) arecombined to study glassy dynamics and the glass transition in nanometric thin (g5 nm) layers of polystyrene(PS) havingwidely varyingmolecular weights (27 500-8 090 000 g/mol). For the dielectric measurements twosample geometries are employed, the common technique using evaporated electrodes and a recentlydeveloped approach taking advantage of nanostructures as spacers. All applied methods deliver theconcurring result that deviations from glassy dynamics and from the glass transition of the bulk do notexceed margins of (3 K independent of the layer thickness and the molecular weight of the polymer understudy. Our findings are discussed in the context of the highly controversial literature and prove that anappropriate sample preparation is of paramount importance.
1. Introduction
The nature of the glass transition remains a subject of intensestudy for material as well as theoretical scientists. Several theo-retical approaches1-3 have been suggested to explain this phenom-enon. The most recognized of these concepts is the idea ofcooperative motion as empirically formulated by Adams andGibbs.1 Here, it is reasoned that for a sufficiently supercooledliquid, structural relaxation may occur if and only if a number ofconstituent molecules rearrange collectively. This cooperativitytherefore suggests a certain length scale defining the cooperativeregionwhich growswithdecreasing temperature. The existence ofsuch a length scale of cooperativemotion then points to finite sizeeffects, that is, changes in the dynamics and glass transitiontemperature when the material is confined to length scales nearthe cooperative size. Such confinement can be achieved andstudied using, inter alia, nanopores,4 entangled polymers,5 orthin films.6 The latter provide an ideal sample geometry since theconfinement dimension can be remarkably diminished by simplyreducing the thickness of the films. Assuming the existence offinite size effects, the challenge then is quantifying a characteristiclength scale for glass transition dynamics.
In their work on cis-polyisoprene, a material which exhibitstwo distinct modes (a segmental mode resulting from configura-tional transitions of a fewmonomer segments and a normalmodeassociated with the fluctuations of the end-to-end distance of thechain) of relaxation processes, Bahar et al.7 showed that the lengthscale of the segmental relaxation and hence the structure sizeunderlying the dynamic glass transition is just about three repeatunits (polymer segments). This result is supported bymany reportsthat find no shifts in the dynamic glass transition and no changeof Tg down to film thicknesses of about 5 nm of polystyrene8-19
and other polymers like poly(methyl methacrylate),20 polysul-fone,21 or poly(2-vinylpyridine).22 Nonetheless, there are contra-dicting results23-39—especially from ellipsometric measurements—ever since the first reports of Keddie et al.23,24 on polystyrene andpoly(methyl methacrylate).
In a recent work19 on PS (Mw = 319000 g/mol) studied bycombined BDS and SE, we showed that—compared to bulk—glassy dynamics in layers as thin as ∼5 nm (BDS) and ∼20 nm(SE) is not shifted. In the current work—using similar annealingprocedures (in inert gas atmosphere well above Tg for at least12 h) for both techniques—we now extend this study to differentmolecular weights of polystyrene (27000<Mw<8090000 g/mol)and probe the Mw dependence of the glassy dynamics. Further,we report in this article AC calorimetry (ACC) and X-rayreflectometry (XRR) measurements; the results are in quantita-tive agreement with the BDS and SE findings.
2. Experimental Details
2.1. Materials. Six different samples of atactic polystyrene(purchased from Polymer Standards Service GmbH) with vary-ing molecular weights and polydispersity indices (Table 1) werestudied by BDS and SE. Highly polished (monocrystal 100)silicon wafers (purchased from microFab and www.University-Wafer.com for BDS and SE, respectively) with a native oxidelayer of about 2 nmwere used as substrates for film preparation.These wafers have ultraflat surfaces (with a root-mean-squareroughness better than 6 A) and, in the case of the ones used forBDS experiments, a typical resistivity less than 5 mΩ cm. Glass(microscope) slides (Carl Roth GmbH & Co. KG) were alsoused as substrates in some of the BDS measurements. Toluene(99.9%pure) and acetone (99.8%pure)were used as solvents forfilm preparation and cleaning purposes, respectively, and wereobtained from Sigma-Aldrich GmbH. Except for filtering(Millex syringe filters, PTFE membrane with 0.2 μm pore size)*Corresponding author. E-mail: [email protected].

9938 Macromolecules, Vol. 43, No. 23, 2010 Tress et al.
of the solutions before spin-casting, the polymer materials andsolvents were used as received without further purification.
2.2. Sample Preparation.Regarding BDS measurements, twosample geometries were used. In the first geometry—the conven-tional approach—evaporated aluminum electrodes (thickness:∼80 nm; root-mean-square (rms) roughness: e1 nm) were usedas counter electrodes as schematically represented in Figure 1a.The preparation and cleaning procedure we used is available in
the literature.8 In the second geometry (Figure 1b) silicon wafers(rms roughness: e0.6 nm) were used as electrodes. Here, in-sulating silica nanostructures serve as spacers, keeping the twowafers separated by about 110 nm; a detailed description of thistechnique is published elsewhere.41 For both geometries, thefilms were always annealed at 430 K (i.e., Tgþ 50 K) for at least24 h in oil-free high vacuum (10-6 mbar) before dielectric mea-surements. This treatment is necessary to remove any remainingsolvent and to relax the chains after the spin-coating procedure.
For ellipsometric measurements, an alkaline cleaning proce-dure was used for purifying the silicon substrate surfaces. First,the wafers were cleaned in an ultrasonic bath of CH2Cl2 at roomtemperature for 15min.Then, theywere transferred toanalkalinehydroperoxide solution (Millipore water, resistivity g18 MΩcm, H2O2 (30%) and NH3 solution (25%) in the ratio 20:1:0.2)for 20 min at 354 K. Thereafter, the wafers were carefully rinsedby Millipore water, dried by argon flow, and directly used. Thesample geometry used for SEmeasurements is shown in Figure 1c.
The layers (for both BDS and SE studies) were deposited byspin-casting at 3000 rpm for 20 s; the layer thickness was adjustedby varying the toluene-polystyrene concentration anddeterminedby means of atomic force miscroscopy (AFM) to be within avariability of(10% for layers down to∼20 nmand up to(20%for thinner samples.
2.3. Measurement and Data Analysis. Dielectric measure-ments were carried out using a high-resolution Alpha analyzerand an Andeen-Hagerling impedance bridge; for both instru-ments, a Quattro temperature controller (Novocontrol Technol-ogies) was used for temperature regulation, ensuring a relative
Figure 1. Schemes for the sample geometries applied for the dielectricand ellipsometric measurements: (a) capped geometry: use of evapo-rated aluminum electrodes; (b) uncapped geometry: novel approachwhere insulating silica nanostructures serve as spacers; and (c) geometryfor ellipsometric measurements. Note: in (a) and (b) the native oxidelayers on the electrodes are not shown for graphical clarity.
Table 1. Characteristics of PS Samples Studied in This Worka
sample Mw (kg/mol) Mw/Mn Rg (nm)
1 27.5 1.03 4.62 58.9 1.01 6.73 319 1.05 15.74 749 1.10 24.05 1103 1.14 29.16 8090 1.17 78.8aRadii of gyration in Θ solvent were calculated according to the
literature.40
Figure 2. Ellipsometric anglesψ andΔ as functions of temperature fora 76 nm thin PS film (Mw= 319000 g/mol) on native silicon oxide at asensitive wavelength λ of 450 nm. The solid lines are a guide to the eye toillustrate the two linear regimes (glassy and rubbery) whose intersectionpoint indicates the glass transition temperatureTg as highlighted by thedashed line. The insets show the second derivatives of the interpolateddata (as described in the text), the maxima of which also occur at Tg.
Article Macromolecules, Vol. 43, No. 23, 2010 9939
error of e0.1 K and an absolute error of <1 K. Measurementswere made in the frequency range 50 Hz-20 kHz at tempera-tures between 380 and 430 K. During measurement, sampleswere always kept in a pure nitrogen atmosphere. In a tempera-ture representation of the dielectric spectra, the R-relaxationpeak for polystyrene is clearly seen in the temperature windowmentioned above. Therefore, we are able to obtain the charac-teristic (maximum loss) temperature TR, at a chosen frequency,which effectively corresponds to the relaxation rate at thistemperature.
Temperature-dependent spectroscopic ellipsometry measure-ments were carried out at a fixed angle of incidence (70�) using amultiwavelength (λ = 370-1680 nm) rotating compensatorellipsometer (RCE) M2000VI (J.A. Woollam Co., Inc.) con-nected to a closed heat cell (INSTEC Inc.). The real temperatureon the surface of a silicon wafer was checked in a separateexperiment by different melt transition standards from Perkin-Elmer (Sn, Pb, In, Zn) commonly used for calorimetry. Thestandards were melted to the wafer surface at appropriatetemperature, then cooled, and reheated to record the melttransition and corresponding thermometer reading. By visuallyobserving the consecutivemelting points for the compounds at aramp of 2 K/min, the temperature was checked within anaccuracy of(1K in the temperature range 300-690K.Recordingof the ellipsometric data and heating/cooling were coordinatedand controlled by software (Complete Ease, J.A. Woollam Co.,Inc.). Real-time spectroscopic measurements were performed at
amoderate scanning rate of 2K/min. Annealing was carried outat 30 K above bulk (calorimetric) Tg under argon flow duringwhich the thickness d and refractive index n of the sample werecontinuously monitored until sample stability was reached inabout 15 h. Immediately after this treatment, the measurementsfor Tg determination were started under argon flow withoutexposing the samples to ambient air again. The layer thickness dand the refractive index nwere calculated from the ellipsometricangles Ψ and Δ measured in the entire wavelength rangeassuming the layer stack Si/SiO2/PS/ambient as optical model.A Cauchy dispersion (k= 0) for the wavelength dependence ofthe polymer refractive index n(λ) was assumed. The temperatureposition of the discontinuity (commonly referred to as kink) ineitherψ(T) orΔ(T) (Figure 2) (or d(T) or n(T)) is known to occurat the ellipsometric glass transition temperature. For betteraccuracy,42 the extrema of interpolated curves of the secondderivatives ∂ψ2/∂T2 or ∂Δ2/∂T2 (or ∂d2/∂T2 or ∂n2/∂T2) (inter-polation was done by applying a ninth-order polynomial fit)were used to determine Tg (Figure 2); values thus obtained inseveral heating and cooling cycles lie consistentlywithin an errormargin of (2 K.
It should be noted that changes in the optical properties of theSi substrate with temperature can have significant impact on theaccuracy of thickness determination in thin films.43 Therefore,to evaluate the heating/cooling cycles, temperature-dependentdata were used from the Woollam Complete Ease software44 inwhich the optical properties of Si are stored as a function oftemperature.
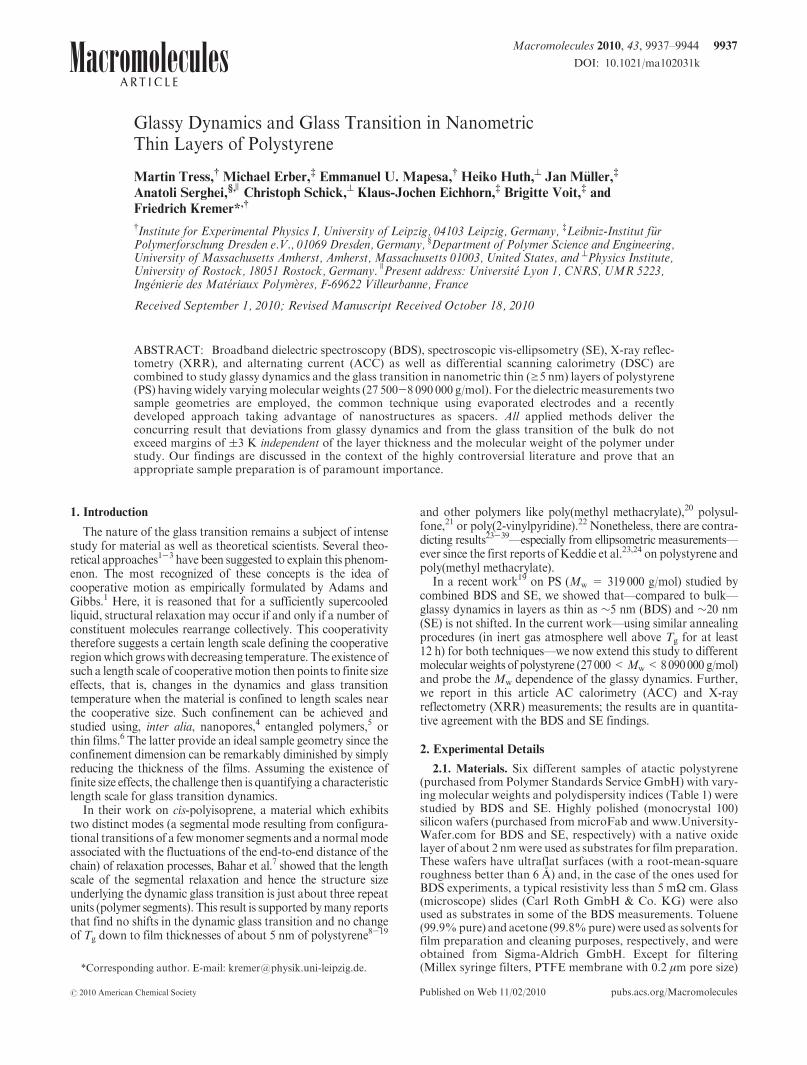
2.4. Reproducibility. For both BDS and SE measurements,AFM was applied to check the surface topography for as-prepared and annealed samples—before and after measurement
Figure 3. 10 by 10 μm2 AFM pictures of the surface of a 5 nm thick PSfilm (Mw = 319000 g/mol) on a silicon wafer as-prepared (a) and afterthe annealing (at 430 K for 24 h in oil-free high vacuum) and measure-ment (in a dry nitrogen atmosphere) procedure (b), with root-mean-square roughnesses of 2.0 and 1.7 nm, respectively.
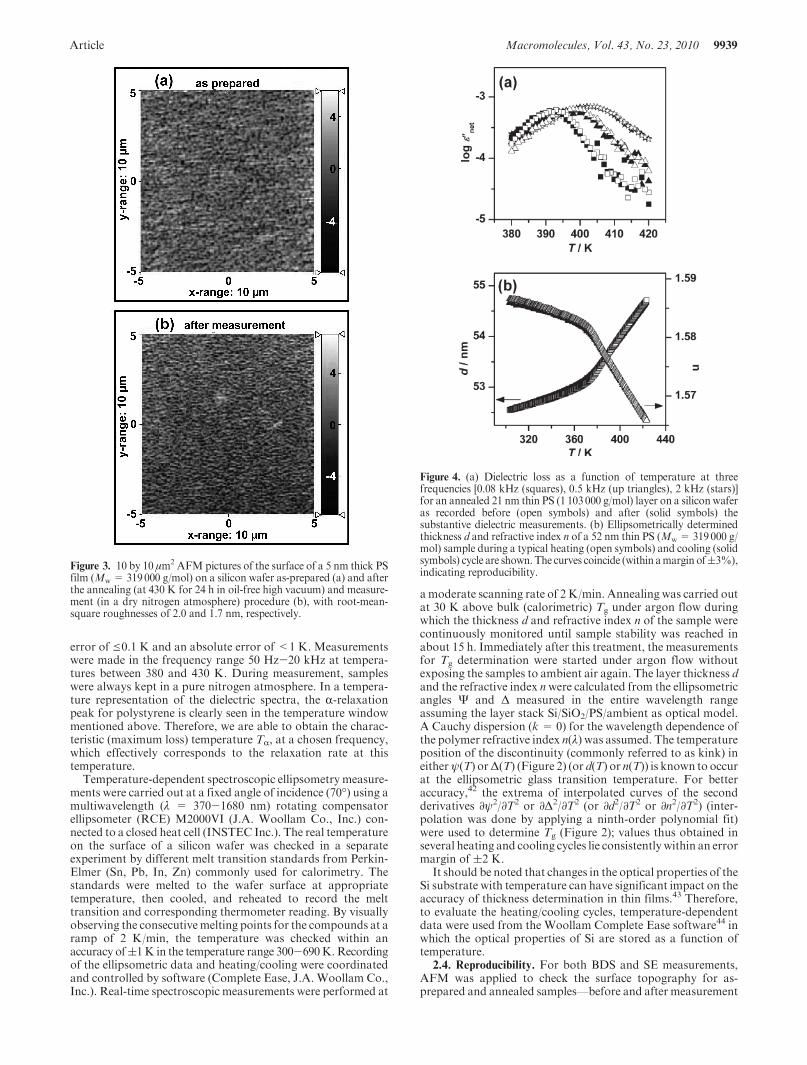
Figure 4. (a) Dielectric loss as a function of temperature at threefrequencies [0.08 kHz (squares), 0.5 kHz (up triangles), 2 kHz (stars)]for an annealed 21 nm thin PS (1 103000 g/mol) layer on a silicon waferas recorded before (open symbols) and after (solid symbols) thesubstantive dielectric measurements. (b) Ellipsometrically determinedthickness d and refractive index n of a 52 nm thin PS (Mw = 319000 g/mol) sample during a typical heating (open symbols) and cooling (solidsymbols) cycle are shown.The curves coincide (within amargin of(3%),indicating reproducibility.
9940 Macromolecules, Vol. 43, No. 23, 2010 Tress et al.
(see Figure 3). In order to exclude artifacts due to dewetting,only samples exhibiting a root-mean-square roughness less than3 nm (on a lateral length scale of 10 μm) were considered forfurther analysis. To check the reproducibility of BDS results, thedielectric loss as a function of temperature was monitored (after
annealing) before and after measurement (Figure 4a). Similarly,for SE several heating and cooling cycles were carried out on thesamples after annealing and the data recorded as presented inFigure 4b (only one cycle is drawn for graphical clarity since thecurves almost completely coincide). As shown in the aforemen-tioned figures, reproducibility of results within amargin of(3%is ascertained for both BDS and SE measurements.
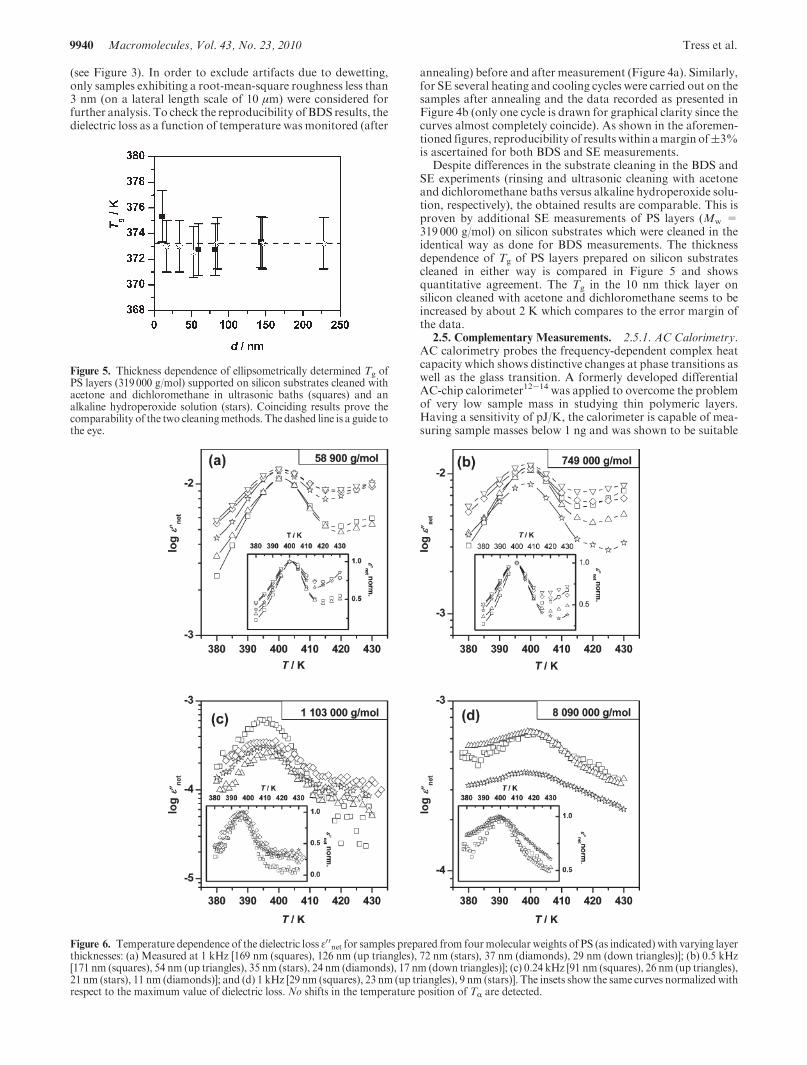
Despite differences in the substrate cleaning in the BDS andSE experiments (rinsing and ultrasonic cleaning with acetoneand dichloromethane baths versus alkaline hydroperoxide solu-tion, respectively), the obtained results are comparable. This isproven by additional SE measurements of PS layers (Mw =319 000 g/mol) on silicon substrates which were cleaned in theidentical way as done for BDS measurements. The thicknessdependence of Tg of PS layers prepared on silicon substratescleaned in either way is compared in Figure 5 and showsquantitative agreement. The Tg in the 10 nm thick layer onsilicon cleaned with acetone and dichloromethane seems to beincreased by about 2 K which compares to the error margin ofthe data.
2.5. Complementary Measurements. 2.5.1. AC Calorimetry.AC calorimetry probes the frequency-dependent complex heatcapacity which shows distinctive changes at phase transitions aswell as the glass transition. A formerly developed differentialAC-chip calorimeter12-14 was applied to overcome the problemof very low sample mass in studying thin polymeric layers.Having a sensitivity of pJ/K, the calorimeter is capable of mea-suring sample masses below 1 ng and was shown to be suitable
Figure 5. Thickness dependence of ellipsometrically determined Tg ofPS layers (319000 g/mol) supported on silicon substrates cleaned withacetone and dichloromethane in ultrasonic baths (squares) and analkaline hydroperoxide solution (stars). Coinciding results prove thecomparability of the two cleaningmethods. The dashed line is a guide tothe eye.
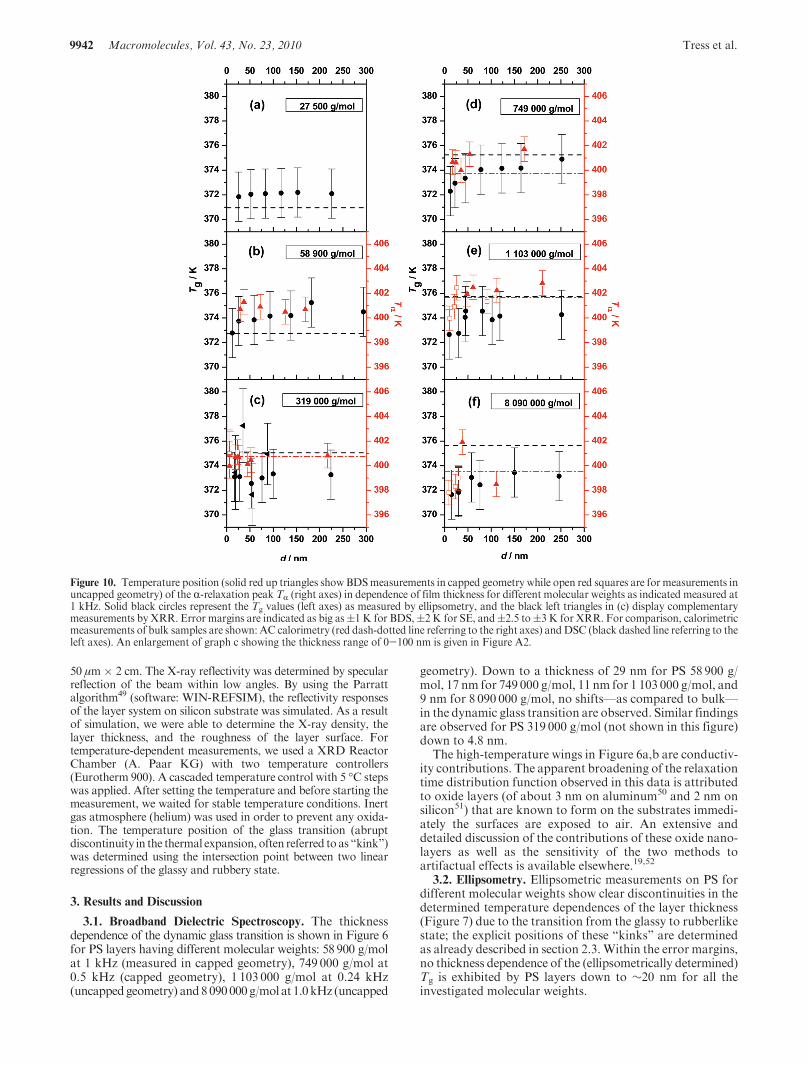
Figure 6. Temperature dependence of the dielectric loss ε0 0net for samples prepared from fourmolecular weights of PS (as indicated) with varying layerthicknesses: (a) Measured at 1 kHz [169 nm (squares), 126 nm (up triangles), 72 nm (stars), 37 nm (diamonds), 29 nm (down triangles)]; (b) 0.5 kHz[171 nm (squares), 54 nm (up triangles), 35 nm (stars), 24 nm (diamonds), 17 nm (down triangles)]; (c) 0.24 kHz [91 nm (squares), 26 nm (up triangles),21 nm (stars), 11 nm (diamonds)]; and (d) 1 kHz [29 nm (squares), 23 nm (up triangles), 9 nm (stars)]. The insets show the same curves normalized withrespect to the maximum value of dielectric loss. No shifts in the temperature position of TR are detected.

Article Macromolecules, Vol. 43, No. 23, 2010 9941
for the determination of the glass transition temperature in thinpolymer layers.12-16 Commercially available gas sensors suit-able for fast scanning (XEN-39390 fromXensor Integration bv,Netherlands) having an effective sample area of about 30 �30 μm2 on a silicon nitride membrane (thickness∼1 μm) coatedby a silica layer were employed in the differential setup.
The sample preparation was done (comparable to the pre-viously described procedures) by spin-coating of toluene solu-tions of PS onto the sensors. Subsequently, the samples wereannealed at 430 K for at least 24 h in oil-free high vacuum(10-6 mbar) and measured in a nitrogen atmosphere in a tem-perature range of 350-430 K at frequencies of 80 Hz and 1 kHz.The datawere recorded during continuous heating and cooling ata rate of 1 K/min; for the analysis only data from the secondheating and cooling cycle were used. In the investigated tempera-ture range, the amplitude of the complex heat capacity exhibits astep while the phase shows a peak at the same position. The glasstransition temperature is indicated by the half step heights or themaximum position of the peak (as exemplified in Figure A1).Before the extraction of the peak position by a Gaussian fit, themeasured phase was corrected by a baseline subtraction.45
AFM measurements of the surface topology of the PS layersprepared on the calorimetry sensors revealed pronounced dewett-ing in thin samples (<50 nm). This instability inhibited reason-able measurements, and consequently, AC calorimetry was onlyapplied to study bulklike samples. Considering the successfulpreparation of thin layers on the other silica-coated substrates, alikely cause for the dewetting could be the roughness of the
sensor which is comparably high (rms roughness of∼6 nm) andhence might initiate agglomeration.
2.5.2. X-ray Reflectometry. X-ray reflectometry (XRR) is asurface-sensitive analytical technique suitable for determiningthe physical parameters of thin layers (about 1-100 nm). To dothis, the superposition of reflected radiation with Bragg-likescattering effects caused by a layered structure is recorded. Amore detailed description of thismethod is given elsewhere.46-48
For our investigations, we used a XRD3003 T/T (Seifert FPM)with a copper anode. The X-ray beam was monochromated(Cu KR, wavelength 1.54 A), parallelized, and collimated to
Figure 7. Ellipsometrically determined temperature dependence of thethicknesses d of PS layers normalized for layer thickness at 300 K fortwo molecular weights (a) 27500 g/mol [thicknesses: 234 nm (squares),121 nm (up triangles), 86 nm (stars), 54 nm (diamonds), 26 nm (downtriangles)] and (b) 58 900 g/mol [thicknesses: 360 nm (squares), 138 nm,(up triangles), 59 nm (stars), 26 nm (diamonds), 12 nm (downtriangles)]. The insets show the respective second derivatives of theinterpolated data (ninth-order polynomial fits).
Figure 8. Temperature dependence of the normalized thickness dnormof PS layers (Mw = 319000 g/mol) having thicknesses of 35 nm (solidsquares), 54 nm (open circles), and 87 nm (solid stars) as measured byXRR. The solid lines are linear fits to the data in the glassy and rubberystate for the 35 nm thick sample. The intersection point indicates theglass transition Tg.
Figure 9. Activation plot of themean relaxation rate of a selected set ofmeasurements of various thickness and molecular weight samples asdetermined by several experimental methods as indicated. Within theerror margins, the measurements carried out by BDS in two differentsample geometries (capped and uncapped), AC calorimetry and DSC,are coinciding.Additionally,VFT fits to the data of two samples (Mw=58900 g/mol) having thicknesses of 169 nm (solid line) and 37 nm(dashed line) are displayed. The inset shows the molecular weightdependence of TR as measured at a frequency of 1 kHz by BDS inuncapped and capped geometry and AC calorimetry as well as Tg
determined by SE, XRR, andDSC for the thickest investigated samples(symbols as indicated). The dotted and dash-dotted lines at 400 and373 K, respectively, are guides to the eye.
9942 Macromolecules, Vol. 43, No. 23, 2010 Tress et al.
50 μm� 2 cm. The X-ray reflectivity was determined by specularreflection of the beam within low angles. By using the Parrattalgorithm49 (software: WIN-REFSIM), the reflectivity responsesof the layer system on silicon substrate was simulated. As a resultof simulation, we were able to determine the X-ray density, thelayer thickness, and the roughness of the layer surface. Fortemperature-dependent measurements, we used a XRD ReactorChamber (A. Paar KG) with two temperature controllers(Eurotherm 900). A cascaded temperature control with 5 �C stepswas applied. After setting the temperature and before starting themeasurement, we waited for stable temperature conditions. Inertgas atmosphere (helium) was used in order to prevent any oxida-tion. The temperature position of the glass transition (abruptdiscontinuity in the thermal expansion, often referred to as “kink”)was determined using the intersection point between two linearregressions of the glassy and rubbery state.
3. Results and Discussion
3.1. Broadband Dielectric Spectroscopy. The thicknessdependence of the dynamic glass transition is shown in Figure 6for PS layers having different molecular weights: 58 900 g/molat 1 kHz (measured in capped geometry), 749 000 g/mol at0.5 kHz (capped geometry), 1 103 000 g/mol at 0.24 kHz(uncappedgeometry) and8090000g/mol at 1.0kHz (uncapped
geometry). Down to a thickness of 29 nm for PS 58 900 g/mol, 17 nm for 749 000 g/mol, 11 nm for 1 103 000 g/mol, and9 nm for 8 090 000 g/mol, no shifts—as compared to bulk—in the dynamic glass transition are observed. Similar findingsare observed for PS 319 000 g/mol (not shown in this figure)down to 4.8 nm.
The high-temperature wings in Figure 6a,b are conductiv-ity contributions. The apparent broadening of the relaxationtime distribution function observed in this data is attributedto oxide layers (of about 3 nm on aluminum50 and 2 nm onsilicon51) that are known to form on the substrates immedi-ately the surfaces are exposed to air. An extensive anddetailed discussion of the contributions of these oxide nano-layers as well as the sensitivity of the two methods toartifactual effects is available elsewhere.19,52
3.2. Ellipsometry. Ellipsometric measurements on PS fordifferent molecular weights show clear discontinuities in thedetermined temperature dependences of the layer thickness(Figure 7) due to the transition from the glassy to rubberlikestate; the explicit positions of these “kinks” are determinedas already described in section 2.3.Within the error margins,no thickness dependence of the (ellipsometrically determined)Tg is exhibited by PS layers down to ∼20 nm for all theinvestigated molecular weights.
Figure 10. Temperature position (solid red up triangles showBDSmeasurements in capped geometry while open red squares are for measurements inuncapped geometry) of the R-relaxation peak TR (right axes) in dependence of film thickness for different molecular weights as indicated measured at1 kHz. Solid black circles represent the Tg values (left axes) as measured by ellipsometry, and the black left triangles in (c) display complementarymeasurements by XRR. Error margins are indicated as big as(1 K for BDS,(2 K for SE, and(2.5 to(3 K for XRR. For comparison, calorimetricmeasurements of bulk samples are shown: AC calorimetry (red dash-dotted line referring to the right axes) andDSC (black dashed line referring to theleft axes). An enlargement of graph c showing the thickness range of 0-100 nm is given in Figure A2.
Article Macromolecules, Vol. 43, No. 23, 2010 9943
3.3. Calorimetry and X-ray Reflectometry.AC calorimetrywas only employed to determine the Tg of thick (bulklike)samples. In the inset of Figure 8 the Tg as measured by ACcalorimetry at 1 kHz is plotted versus molecular weight; inthe range studied here, no molecular weight dependence isestablished for TR. On the contrary, the Tg as measured byDSC reduces by about 7Kwith decreasingmolecularweight.
X-ray reflectometry was applied to measure thin layers(20-88 nm) of PS of a molecular weight of 319 000 g/mol. Inall investigated samples the temperature dependence of therecorded layer thickness shows a distinct discontinuity in-dicating the glass transition temperature (exemplified inFigure 8). Themeasurements reveal no thickness dependenceof Tg within the error margins of(3 K and coincide with theellipsometrically determined Tg values as displayed in graphc of Figure 10.
3.4. Summary and Comparison. The mean relaxation rateas measured by various experimental techniques versusinverse temperature is displayed in Figure 9 for a selectionof the investigated samples. This shows, over a range ofmorethan 2 decades of relaxation rate, that both sample geome-tries applied in the BDS experiments deliver coincidingresults which are in full agreement with the AC calorimetrymeasurements. No deviation from the bulklike glassy dy-namics in layers down to 5 nm is revealed in these measure-ments. Further, ellipsometry andX-ray reflectometry delivercoinciding Tg values which are in good agreement with theDSC measurements and the expected Tg extrapolated byfitting a Vogel-Fulcher-Tammann (VFT) equation53-55 tothe BDS data.
In the inset of Figure 9 the TR and Tg values of bulklikesamples as determined by the experimental techniques em-ployed in this study are plotted versus molecular weight.Again, the coincidence of BDS and ACCmeasurements andthe absence of a molecular weight dependence are shown.Similarly, theTg valuesof thebulkasmeasuredbyellipsometry,
X-ray reflectometry, and DSC are in agreement, but incontrast to the first two, the results obtained by DSC exhibita Tg reduction of about 5 K with decreasing molecularweight.
Figure 10 summarizes the experimental results for all thesix molecular weights investigated in this work. Here, thethickness dependencies for the temperature position of theR-relaxation peak TR (as measured by BDS at specifiedfrequencies) and for Tg (as measured by SE) are explicitlyshown. It is clear that alterations of dielectrically determinedTR and ellipsometrically determinedTg are mostly within theerrormargins of(1 and(2K, respectively, andnever exceeda difference of (3 K from the thickest (bulklike) sample.However, it is remarkable that in four of the six investigatedmolecular weights (58 900, 749 000, 1 103 000, and 8 090 000g/mol) there are slight thickness dependencies in Tg thoughwithin the error margins. With decreasing layer thickness,the Tg reduces instead of being randomly scattered aroundthe bulk value. In contrast, this trend is not observed in anintermediate molecular weight of 319 000 g/mol which hin-ders the general conclusion of a thickness dependent shift ofTg. In summary, we prove that down to layer thicknesses of 5nm the glassy dynamics is not altered by more than (3 Kover a wide range of molecular weights of polystyrene.
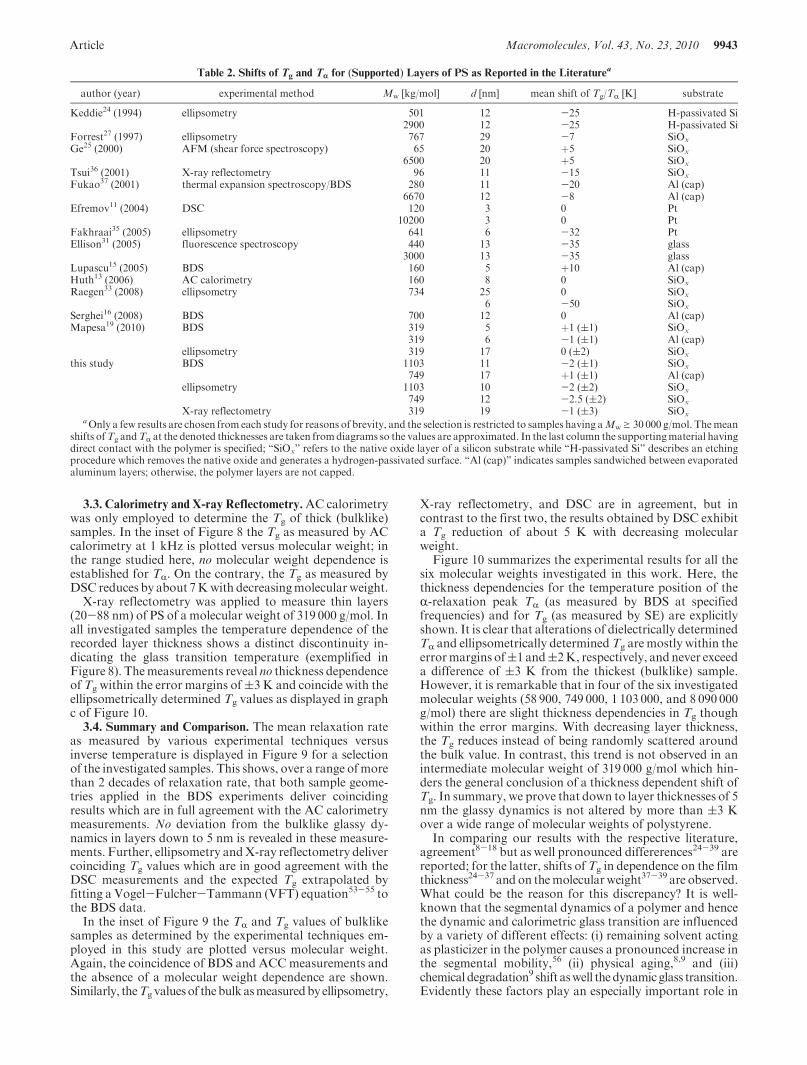
In comparing our results with the respective literature,agreement8-18 but as well pronounced differerences24-39 arereported; for the latter, shifts ofTg in dependence on the filmthickness24-37 and on themolecularweight37-39 are observed.What could be the reason for this discrepancy? It is well-known that the segmental dynamics of a polymer and hencethe dynamic and calorimetric glass transition are influencedby a variety of different effects: (i) remaining solvent actingas plasticizer in the polymer causes a pronounced increase inthe segmental mobility,56 (ii) physical aging,8,9 and (iii)chemical degradation9 shift aswell thedynamicglass transition.Evidently these factors play an especially important role in
Table 2. Shifts of Tg and Tr for (Supported) Layers of PS as Reported in the Literaturea
author (year) experimental method Mw [kg/mol] d [nm] mean shift of Tg/TR [K] substrate
Keddie24 (1994) ellipsometry 501 12 -25 H-passivated Si2900 12 -25 H-passivated Si
Forrest27 (1997) ellipsometry 767 29 -7 SiOx
Ge25 (2000) AFM (shear force spectroscopy) 65 20 þ5 SiOx
6500 20 þ5 SiOx
Tsui36 (2001) X-ray reflectometry 96 11 -15 SiOx
Fukao37 (2001) thermal expansion spectroscopy/BDS 280 11 -20 Al (cap)6670 12 -8 Al (cap)
Efremov11 (2004) DSC 120 3 0 Pt10200 3 0 Pt
Fakhraai35 (2005) ellipsometry 641 6 -32 PtEllison31 (2005) fluorescence spectroscopy 440 13 -35 glass
3000 13 -35 glassLupascu15 (2005) BDS 160 5 þ10 Al (cap)Huth13 (2006) AC calorimetry 160 8 0 SiOx
Raegen33 (2008) ellipsometry 734 25 0 SiOx
6 -50 SiOx
Serghei16 (2008) BDS 700 12 0 Al (cap)Mapesa19 (2010) BDS 319 5 þ1 ((1) SiOx
319 6 -1 ((1) Al (cap)ellipsometry 319 17 0 ((2) SiOx
this study BDS 1103 11 -2 ((1) SiOx
749 17 þ1 ((1) Al (cap)ellipsometry 1103 10 -2 ((2) SiOx
749 12 -2.5 ((2) SiOx
X-ray reflectometry 319 19 -1 ((3) SiOxaOnly a few results are chosen from each study for reasons of brevity, and the selection is restricted to samples having aMwg 30 000 g/mol. Themean
shifts ofTg andTR at the denoted thicknesses are taken fromdiagrams so the values are approximated. In the last column the supportingmaterial havingdirect contact with the polymer is specified; “SiOx” refers to the native oxide layer of a silicon substrate while “H-passivated Si” describes an etchingprocedure which removes the native oxide and generates a hydrogen-passivated surface. “Al (cap)” indicates samples sandwiched between evaporatedaluminum layers; otherwise, the polymer layers are not capped.

9944 Macromolecules, Vol. 43, No. 23, 2010 Tress et al.
nanometric thin polymer layers as demonstrated in detail bySerghei and Kremer.57 Recently, Perlich et al.58 studied thesolvent content in thin spin-coated PS homopolymer layersby neutron reflectrometry and found in freshly preparedsamples (before annealing) a pronounced thickness andmolecular weight dependence. Annealing for 8 h in vacuum(10-2 mbar) at a temperature of 20 K above Tg reduced thesolvent content by only 1.0 vol % while at 60 K above Tg a3.2 vol % effect was observed. Furthermore, an enrichmentof solvent at the polymer/substrate interface was revealed. Inview of these multiple parameters influencing the dynamicglass transition, it is not surprising that the shifts in Tg
reported in the literature vary a lot (Table 2). It is most likelythat this is due to artifacts of preparation.
4. Conclusion
In this work, the dynamic and calorimetric glass transition innanometer-thin layers of PS having molecular weights between27500 and 8 090 000 g/mol has been investigated by multipleexperimental techniques such as BDS, SE, XRR, DSC, and ACcalorimetry. The glassy dynamics and the glass transition tem-perature under conditions of one-dimensional confinement inthin polymer layers are found to be independent of the molecularweight and of the layer thickness (g5 nm) within margins of(3 K.
Acknowledgment. The authors are grateful for funding byDFG(SPP1369andEI317/4-1). Furthermore, the authors thankLiane H€aussler for carrying out the DSC measurements.
Supporting Information Available: Figures A1 andA2. Thismaterial is available free of charge via the Internet at http://pubs.acs.org.
References and Notes
(1) Adam, G.; Gibbs, J. H. J. Chem. Phys. 1965, 43, 139.(2) Cohen, M. H.; Grest, G. S. Phys. Rev. B 1979, 20, 1077.(3) G€otze, W.; Sj€ogren, L. Rep. Prog. Phys. 1992, 55, 241.(4) Iacob, C.; Sangoro, J. R.; Papadopoulos, P.; Schubert, T.;
Naumov, S.; Valiullin, R.; K€arger, J.; Kremer, F., Phys. Chem.Chem. Phys. 2010, 12, 13798.
(5) Rizos, A. K.; Ngai, K. L. Phys. Rev. E 1999, 59, 612.(6) Hartmann, L.; Fukao, K.; Kremer, F. In Broadband Dielectric
Spectroscopy; Kremer, F., Sch€onhals, A., Eds.; Springer: Berlin, 2003;pp 433-473.
(7) Bahar, I.; Erman, B.; Kremer, F.; Fischer, E.Macromolecules 1992,25, 826.
(8) Serghei, A.; Kremer, F. InProgress in Colloid and Polymer Science;Grundke, K., Stamm, M., Adler, H.-J., Eds.; Springer: Berlin, 2006; pp33-40.
(9) Serghei, A.; Huth, H.; Schellenberger, M.; Schick, C.; Kremer, F.Phys. Rev. E 2005, 71, 061801.
(10) Liu, Y.; Russell, T. P.; Samant, M. G.; St€ohr, J.; Brown, H. R.;Cossy-Favre, A.; Diaz, J. Macromolecules 1997, 30, 7768.
(11) Efremov, M. Y.; Olson, E. A.; Zhang, M.; Zhang, Z.; Allen, L. H.Macromolecules 2004, 37, 4607.
(12) Huth, H.; Minakov, A.; Schick, C. Netsu Sokutei 2005, 32, 69.(13) Huth, H.; Minakov, A.; Schick, C. J. Polym. Sci., Part B: Polym.
Phys. 2006, 44, 2996.(14) Huth, H.;Minakov, A. A.; Serghei, A.; Kremer, F.; Schick, C.Eur.
Phys. J.: Spec. Top. 2007, 141, 153.(15) Lupascu, V.; Huth, H.; Schick, C.; W€ubbenhorst,M.Thermochim.
Acta 2005, 41, 222.
(16) Serghei, A.; Huth, H.; Schick, C.; Kremer, F. Macromolecules2008, 41, 3639.
(17) Robertson, C. G.; Hogan, T. E.; Rackaitis, M.; Puskas, J. E.;Wang, X. J. Chem. Phys. 2010, 132, 104904.
(18) Weber, R.; Zimmerman, K.-M.; Tolan, M.; Stettner, J.; Seeck,O. H.; Erichsen, J.; Zaporojtchenko, V.; Strunskus, T.; Faupel, F.Phys. Rev. E 2001, 64, 061508–1.
(19) Mapesa, E. U.; Erber, M.; Tress, M.; Eichhorn, K.-J.; Serghei, A.;Voit, B.; Kremer, F. Eur. Phys. J.: Spec. Top. 2010, 189, 173.
(20) Erber, M.; Tress, M.; Mapesa, E.; Serghei, A.; Eichhorn, K.-J.;Voit, B.; Kremer, F. Macromolecules 2010, 43, 7729.
(21) Labahn, D.; Mix, R.; Sch€onhals, A. Phys. Rev. E 2009, 79, 011801.(22) Serghei, A. Macromol. Chem. Phys. 2008, 209, 1415.(23) Keddie, J. L.; Jones, R. A. L.; Cory, R. Faraday Discuss. Chem.
Soc. 1994, 98, 219.(24) Keddie, J. L.; Jones, R.A. L.; Cory,R.Europhys. Lett. 1994, 27, 59.(25) Ge, S.; Pu, Y.; Zhang,W.; Rafailovich,M.; Sokolov, J.; Buenviaje,
C.; Buckmaster, R.;Overney,R.M.Phys.Rev. Lett. 2000, 85, 2340.(26) Wallace,W.E.; vanZanten, J.H.;Wu,W.-L.Phys.Rev. E 1995, 52,
3329.(27) Forrest, J. A.; Dalnoki-Veress, K.; Dutcher, J. R. Phys. Rev. E
1997, 56, 5705.(28) Fryer, D.; Nealey, P.; Pablo, J. Macromolecules 2000, 33, 6439.(29) Tsui, O. K. C.; Zhang, H. F. Macromolecules 2001, 34, 9139.(30) Kawana, S.; Jones, R. Phys. Rev. E 2001, 63, 02150.(31) Ellison, C. J.; Mundra, M. K.; Torkelson, J. M. Macromolecules
2005, 38, 1769.(32) Koh, Y. P.; McKenna, G. B.; Simon, S. L. J. Polym. Sci., Part B:
Polym. Phys. 2006, 44, 3518.(33) Raegen, A. N.; Massa, M. V.; Forrest, J. A.; Dalnoki-Veress, K.
Eur. Phys. J. E 2008, 27, 375.(34) Yang, Z.; Fujii, Y.; Lee, F. K.; Lam, C.-H.; Tsui, O. K. C. Science
2010, 328, 1676.(35) Fakhraai, Z.; Forrest, J. Phys. Rev. Lett. 2005, 95, 025701.(36) Tsui, O. K. C.; Russell, T. P.; Hawker, C. J.Macromolecules 2001,
34, 5535.(37) Fukao, K.; Miyamoto, Y. Phys. Rev. E 2001, 64, 011803.(38) Santangelo, P. G.; Roland, C. M. Macromolecules 1998, 31, 4581.(39) Fukao, K.; Miyamoto, Y. Phys. Rev. E 2000, 61, 1743.(40) Terao, K.; Mays, J. W. Eur. Polym. J. 2004, 40, 1623.(41) Serghei, A.; Kremer, F. Rev. Sci. Instrum. 2008, 79, 026101.(42) Erber,M.;Khalyavina, A.; Eichhorn,K.-J.; Voit, B.Polymer 2010,
51, 129.(43) Kahle, O.; Wielsch, U.; Metzner, H.; Bauer, J.; Uhlig, C.; Zawatzki,
C. Thin Solid Films 1998, 313, 803.(44) Complete EASE Software Manual Version 3.18, J.A. Woollam
Co., Inc., 2007.(45) Weyer, S.; Hensel, A.; Schick, C. Thermochim. Acta 1997, 305, 267.(46) Meyer, D. C.; Paufler, P. In Encyclopedia of Nanoscience and
Nanotechnology; Nalwa, H. S., Ed.; American Scientific Publishers:Los Angeles, 2004; Vol. 10.
(47) Gutmann,E.;Meyer,D.C.; Levin,A.A.; Paufler, P.Appl. Phys. A:Mater. Sci. Process. 2005, 81, 249.
(48) Chason, E. In In Situ Real-Time Characterisation of Thin Films;Auciello, O., Krauss, A. R., Eds.; John Wiley & Sons, Inc.: New York,2000.
(49) Parratt, L. G. Phys. Rev. 1954, 95, 359.(50) Konstadinidis, K.; Thakkar, B.; Chakraborty, A.; Potts, L.;
Tannenbaum, R.; Tirrell, M. Langmuir 1992, 8, 1307.(51) Morita,M.; Ohmi, T.; Hasegawa, E.; Kawakami,M.; Ohwada,M.
J. Appl. Phys. 1990, 68, 1272.(52) Serghei, A.; Tress,M.;Kremer, F. J. Chem. Phys. 2009, 131, 154904.(53) Vogel, H. Phys. Z. 1921, 22, 645.(54) Fulcher, G. S. J. Am. Chem. Soc. 1925, 8, 3701.(55) Tammann, G.; Hesse, G. Z. Anorg. Allg. Chem. 1926, 156, 245.(56) Zorn, R.; Monkenbusch, M.; Richter, D.; Alegria, A.; Colmenero,
J.; Farago, B. J. Chem. Phys. 2006, 125, 154904.(57) Serghei, A.; Kremer, F. Macromol. Chem. Phys. 2008, 209, 810.(58) Perlich, J.; K€orstgens, V.; Metwalli, E.; Schulz, L.; Georgii, R.;
M€uller-Buschbaum, P. Macromolecules 2009, 42, 337.
Related Documents


