Glacier changes in the Koshi River basin, central Himalaya, from 1976 to 2009, derived from remote-sensing imagery SHANGGUAN Donghui, 1,3 LIU Shiyin, 1 DING Yongjian, 1 WU Lizong, 1 DENG Wei, 2 GUO Wanqin, 1 WANG Yuan, 1 XU Junli, 1 YAO Xiaojun, 1 GUO Zhilong, 1 ZHU Wanwan 1 1 State Key Laboratory of Cryospheric Science, Cold and Arid Regions Environmental and Engineering Research Institute, Chinese Academy of Sciences, Lanzhou, China E-mail: [email protected] 2 Institute of Mountain Hazards and Environment, Chinese Academy of Sciences, Chengdu, China 3 Department of Geography, University of Zu ¨rich, Zu ¨ rich, Switzerland ABSTRACT. We use remote-sensing and GIS technologies to monitor glacierchanges in the Koshi River basin, central Himalaya. The results indicate that in 2009 there were 2061 glaciers in this region, with a total area of 3225 90.3 km 2 . This glacier population is divided into 1290 glaciers, with a total area of 1961 54.9 km 2 , on the north side of the Himalaya (NSH), and 771 glaciers, with a total area of 1264 35.4 km 2 , on the south side of the Himalaya (SSH). From 1976 to 2009, glacier area in the basin decreased by about 19 5.6% (0.59 0.17% a –1 ). Glacier reduction was slightly faster on SSH (20.3 5.6%) than on NSH (18.8 5.6%). The maximum contribution to glacier area loss came from glaciers within the 1–5 km 2 area interval, which accounted for 32% of total area loss between 1976 and 2009. The number of glaciers in the Koshi River catchment decreased by 145 between 1976 and 2009. Glacier area on SSH decreased at a rate of 6.2 3.2% (0.68 0.36% a –1 ), faster than on NSH, where the rate was 2.5 3.2% (0.27 0.36% a –1 ) during 2000–09. Based on records from Tingri weather station, we infer that temperature increase and precipitation decrease were the main causes of glacier thinning and retreat during the 1976–2000 period. Glacier retreat during the 2000–09 period appears to be controlled by temperature increase, since precipitation increase over this period did not offset ice losses to surface melting. KEYWORDS: glacier fluctuations, glacier mapping, remote sensing INTRODUCTION Glaciers are an important indicator of global climate change, and additionally have important roles in various feedbacks and amplifications associated with climate change (Cheng, 1996; Allison and others, 2001; Parry and others, 2007). According to the Fourth Assessment Report (AR4) of the Intergovernmental Panel on Climate Change (Parry and others, 2007), over the past 100 years (1906– 2005) global average surface temperature has increased by 0.748C. Against the background of global warming, sea- level rise, water security problems, other natural disaster risks, permafrost carbon emissions and other environmental problems caused by the retreat of the cryosphere have had a serious impact on socio-economic development, arousing worldwide concern (Haeberli and Beniston, 1998; Richard- son and Reynolds, 2000). The Himalaya possess a huge snow and ice resource that constitutes an important freshwater source for countries in this region. This water resource has a high impact on the water balance and agricultural irrigation in the arid and semi-arid areas of China (Walter and others, 2010; Yao and others, 2012). Previous studies have shown that the Hima- layan glaciers are retreating and thinning (Jin and others, 2005; Ren and others, 2006; Kulkarni and others, 2007; Bajracharya and Mool, 2009; Nie and others, 2010; Bolch and others, 2011, 2012; Fujita and Naimura, 2011). Due to the remote location and wide spatial distribution of these glaciers, monitoring their changes has been difficult (Frey and others, 2012; Yao and others, 2012). The lack of sufficient numbers of in situ measurements has led to recent controversy about future Himalayan glacier change in AR4 (Parry and others, 2007). An additional problem is that mass balances of glacier resources in the Himalaya derived from in situ observation and from the Gravity Recovery and Climate Experiment (GRACE) are inconsistent or even conflicting (Fujita and Naimura, 2011; Kargel and others, 2011; Jacob and others, 2012; Yao and others, 2012). Errors also arise from the fact that researchers use different measurements and techniques to estimate glacier mass loss (Jacob and others, 2012; Gardner and others, 2013). Consequently, glacier change is perhaps more uncertain in the Himalaya than elsewhere in the world. Many Himalayan glaciers have extensive supraglacial debris covers in their ablation zones, which impact upon both rates and spatial patterns of melting. Debris-covered areas show considerable lowering rates that vary significantly over short spatial scales and that depend on local slope and the existence of glacial lakes (Nuimura and others, 2012). Scherler and others (2011) believe that supraglacial debris cover affects the terminus dynamics and modifies glacier response to climate change. The mass loss of supraglacial debris cover occurs by melting of clean ice, glacier fragmentation, backwasting and downwasting of surface debris and calving into deep proglacial lakes (Han and others, 2006, 2010; Schomacker, 2008; Benn and others, 2012). However, a study of debris-covered glaciers in the Hindu Kush showed that thinning of debris-covered ice is not statistically different from that of clean ice (Ka ¨a ¨b and others, Annals of Glaciology 55(66) 2014 doi: 10.3189/2014AoG66A057 61

Welcome message from author
This document is posted to help you gain knowledge. Please leave a comment to let me know what you think about it! Share it to your friends and learn new things together.
Transcript
Glacier changes in the Koshi River basin, central Himalaya, from1976 to 2009, derived from remote-sensing imagery
SHANGGUAN Donghui,1,3 LIU Shiyin,1 DING Yongjian,1 WU Lizong,1 DENG Wei,2
GUO Wanqin,1 WANG Yuan,1 XU Junli,1 YAO Xiaojun,1 GUO Zhilong,1
ZHU Wanwan1
1State Key Laboratory of Cryospheric Science, Cold and Arid Regions Environmental and Engineering Research Institute,Chinese Academy of Sciences, Lanzhou, China
E-mail: [email protected] of Mountain Hazards and Environment, Chinese Academy of Sciences, Chengdu, China
3Department of Geography, University of Zurich, Zurich, Switzerland
ABSTRACT. We use remote-sensing and GIS technologies to monitor glacier changes in the Koshi River
basin, central Himalaya. The results indicate that in 2009 there were 2061 glaciers in this region, with a
total area of 3225� 90.3 km2. This glacier population is divided into 1290 glaciers, with a total area of
1961� 54.9 km2, on the north side of the Himalaya (NSH), and 771 glaciers, with a total area of
1264� 35.4 km2, on the south side of the Himalaya (SSH). From 1976 to 2009, glacier area in the basin
decreased by about 19� 5.6% (0.59� 0.17%a–1). Glacier reduction was slightly faster on SSH
(20.3�5.6%) than on NSH (18.8� 5.6%). The maximum contribution to glacier area loss came from
glaciers within the 1–5 km2 area interval, which accounted for 32% of total area loss between 1976 and
2009. The number of glaciers in the Koshi River catchment decreased by 145 between 1976 and 2009.
Glacier area on SSH decreased at a rate of 6.2�3.2% (0.68�0.36%a–1), faster than on NSH, where
the rate was 2.5�3.2% (0.27�0.36%a–1) during 2000–09. Based on records from Tingri weather
station, we infer that temperature increase and precipitation decrease were the main causes of glacier
thinning and retreat during the 1976–2000 period. Glacier retreat during the 2000–09 period appears to
be controlled by temperature increase, since precipitation increase over this period did not offset ice
losses to surface melting.
KEYWORDS: glacier fluctuations, glacier mapping, remote sensing
INTRODUCTION
Glaciers are an important indicator of global climatechange, and additionally have important roles in variousfeedbacks and amplifications associated with climatechange (Cheng, 1996; Allison and others, 2001; Parry andothers, 2007). According to the Fourth Assessment Report(AR4) of the Intergovernmental Panel on Climate Change(Parry and others, 2007), over the past 100 years (1906–2005) global average surface temperature has increased by0.748C. Against the background of global warming, sea-level rise, water security problems, other natural disasterrisks, permafrost carbon emissions and other environmentalproblems caused by the retreat of the cryosphere have had aserious impact on socio-economic development, arousingworldwide concern (Haeberli and Beniston, 1998; Richard-son and Reynolds, 2000).
The Himalaya possess a huge snow and ice resource thatconstitutes an important freshwater source for countries inthis region. This water resource has a high impact on thewater balance and agricultural irrigation in the arid andsemi-arid areas of China (Walter and others, 2010; Yao andothers, 2012). Previous studies have shown that the Hima-layan glaciers are retreating and thinning (Jin and others,2005; Ren and others, 2006; Kulkarni and others, 2007;Bajracharya and Mool, 2009; Nie and others, 2010; Bolchand others, 2011, 2012; Fujita and Naimura, 2011). Due tothe remote location and wide spatial distribution of theseglaciers, monitoring their changes has been difficult (Freyand others, 2012; Yao and others, 2012).
The lack of sufficient numbers of in situ measurementshas led to recent controversy about future Himalayan glacierchange in AR4 (Parry and others, 2007). An additionalproblem is that mass balances of glacier resources in theHimalaya derived from in situ observation and from theGravity Recovery and Climate Experiment (GRACE) areinconsistent or even conflicting (Fujita and Naimura, 2011;Kargel and others, 2011; Jacob and others, 2012; Yao andothers, 2012). Errors also arise from the fact that researchersuse different measurements and techniques to estimateglacier mass loss (Jacob and others, 2012; Gardner andothers, 2013). Consequently, glacier change is perhaps moreuncertain in the Himalaya than elsewhere in the world.
Many Himalayan glaciers have extensive supraglacialdebris covers in their ablation zones, which impact uponboth rates and spatial patterns of melting. Debris-coveredareas show considerable lowering rates that vary significantlyover short spatial scales and that depend on local slope andthe existence of glacial lakes (Nuimura and others, 2012).Scherler and others (2011) believe that supraglacial debriscover affects the terminus dynamics and modifies glacierresponse to climate change. The mass loss of supraglacialdebris cover occurs by melting of clean ice, glacierfragmentation, backwasting and downwasting of surfacedebris and calving into deep proglacial lakes (Han andothers, 2006, 2010; Schomacker, 2008; Benn and others,2012). However, a study of debris-covered glaciers in theHindu Kush showed that thinning of debris-covered ice is notstatistically different from that of clean ice (Kaab and others,
Annals of Glaciology 55(66) 2014 doi: 10.3189/2014AoG66A057 61

2012). Glacier variation in the Himalayawill increase the riskof glacier lake outburst floods and contributes to sea-levelrise (Bajracharya and Mool, 2009; Benn and others, 2012).
In this work, we use topographic maps and satelliteimagery from Landsat Multispectral Scanner/Thematic Map-per/Enhanced Thematic Mapper Plus (MSS/TM/ETM+) toinvestigate glacier changes and document the similaritiesand differences between the north and south sides ofHimalayan regions of the Koshi River area during 1976,2000 and 2009/10.
STUDY SITE
Koshi River is located in southern Tibet, central Himalaya, at268470–298120N, 858220–888210 E. It originates in the Hima-layan region of China (north side of the Himalaya (NSH))and flows into Nepal and India (south side of the Himalaya(SSH)). Its drainage area is �71 500 km2. Of this area,28 500 km2 is located in Tibet, 31,600 km2 is located inNepal, and 11 400 km2 is located in India. Glaciers aredistributed in those parts of the river basin located in Chinaand Nepal (Fig. 1), where there are three major tributaries:Sunkosi River, Arum River (Pumqu River in China) andTamor River. The basin areas of Sunkosi River and ArumRiver are 36 000 and 19000 km2, respectively. Several peaksabove 8000ma.s.l. (e.g. Qomolangma (Mount Everest;8844m), Cho Oyu (8201m) and Lhotse (8501m)) are inthe catchment of the Koshi River. Large glaciers and alsoglacial lakes are found in the study area.
The Himalaya separate the regional climate into twodistinct categories located on the north and south sides. Thesouth side is subject to the Indian Ocean monsoon and thePacific Ocean southeast monsoon and is thus characterizedby a pronounced summer rainfall maximum and has amaritime climate. The north side is mainly affected by theHimalaya and has a typical plateau, i.e. continental, climate.
Records from two weather stations, Tingri station(28.63338N, 87.08338 E) and Nyalam station (28.18338N,85.96678 E), show that mean temperature and precipitationat these locations from 1976 to 2006 were 3.08C and286.3mm, and 3.88C and 658.8mm, respectively (Fig. 1).Records from Dingboche station (27.898N, 86.838 E;4355ma.s.l.) on SSH show an annual average temperatureof –0.38C and an annual average precipitation of �500mmduring the 1988–2008 period (Rajchal, 2006; Salerno andothers, 2008; Wang, 2013). The elevation difference leads todecreasing precipitation as altitude increases. For example,the annual average precipitation at Namche Bazar station(27.838N, 86.728 E; 3450ma.s.l.) on SSH is �1000mm,which is more than at Dingboche station. The precipitationon SSH is more than on NSH, leading to a lower snowlineon SSH (5500m) than on NSH (6000m).
DATA AND METHODS
Topographic maps and remote-sensing images
Our study uses 39 topographic maps at scales of 1 : 50 000and 1 : 100 000. These maps were derived from aerialphotographs acquired between 1971 and 1980 by theChinese military geodetic service. They were scanned, geo-referenced and rectified with a kilometer grid. The mapcoordinates were expressed using the Albers conic equal-area projection. Glacier outlines, digitized using ArcMapsoftware, formed the basic reference data for changes in theKoshi River glaciers. Glaciers in Nepal are documented inthe Nepal glacier inventory (Mool and others, 2001), derivedfrom topographic maps of India and Nepal between the1960s and 1980s. However, the period covered by thetopographic maps is almost 20 years, rather than the shortperiod of a few years that would allow glacier reference dataof nearly the same time to be produced; in addition, the
Fig. 1. Glacier distribution in the Koshi River basin (background derived from global digital elevation model (GDEM)).
Shangguan and others: Glacier changes in the Koshi River basin62

topographic maps information was missed. Our study alsouses four Landsat MSS images acquired in 1976 and 1977which cover a period of <1 month (Table 1), to generate areference inventory of glaciers in Nepal that fall within theKoshi River basin by manual delineation.
We also use six Landsat ETM+ scenes with 15m resolutionacquired in 2000, and Landsat TM data with 30m resolutionacquired in 2009/10, to monitor glacier extent in 2000 and2009/10. Unfortunately, it was difficult to select availableimages in 2009/10 due to the snow cover in Koshi River,especially on SSH. Therefore, our study uses several LandsatETM+ scan-line corrector off (SLC OFF) data with 15mresolution, acquired in 2009 (Table 1), as supplementary datato check the glacier extent covered by snow in 2009. Thiswork will help reduce the glacier extent errors caused bysnow. Landsat images are provided by the US GeologicalSurvey (USGS; http://glovis.usgs.gov) and the Global LandCover Facility. The image data were orthorectified or rectifiedusing the Universal Transverse Mercator (UTM) coordinatesystem referenced to the World Geodetic System 1984ellipsoidal elevation (WGS84). All images were subsequentlyreprojected in the Albers conic equal-area projection to beconsistent with the topographic maps described previously.
Currently, different criteria can be used to extract glacierboundaries from satellite images, such as those based onspectral ratio (band4/band5, band3/band5, normalized-difference snow index (NDSI)), supervised classificationand unsupervised classification (Li and others, 1998; Pauland others, 2000, 2002; Zhang and others, 2001). Further-more, Advanced Spaceborne Thermal Emission and Re-flection Radiometer (ASTER) imagery combined with digitalelevation model (DEM) and thermal infrared ASTER imagerycan be used to delineate glacier debris-cover extent semi-automatically (Paul and others, 2004; Shukla and others,2010). Although the delineation methods were applied asaccurately as possible, it is still difficult to detect glacieroutlines correctly due to debris cover and snow cover.Consequently, manual digitizing of glacier extents was usedfor the multispectral images (MSS in 1976, Landsat ETM in2000 and Landsat5 TM/Landsat7 ETM) in 2009/10.
Meteorological data
Meteorological data in China are obtained from the ChinaMeteorological Data Sharing Service System (http://cdc.cma.gov.cn/home.do). Two weather stations (Tingriand Nyalam) were used to analyze climate changes during1972–2010. Meteorological data in Nepal are provided bythe International Centre for Integrated Mountain Develop-ment (ICIMOD; Rajchal, 2006). They span the period 1988–2008; some years have data missing.
Precision evaluation
Our study uses different spatial and temporal resolution datasources (Table 1). Hence, it is necessary to assess theuncertainty of the results to ascertain the accuracy. Numer-ous factors affect the certainty of glacier delineation inmountain regions (e.g. clouds and snow cover; the sensor’sspatial resolution; spectral characteristics; mountainshadows; mixed-pixel problems; image-processing prob-lems; and disagreements between manually and automatic-ally derived outlines). Glacier mapping uncertainty dependsmainly on the spatial and radiometric resolution of theimage sources and the conditions at the time of acquisition(Bhambri and others, 2013); less than half-pixel accuracy isusually achieved (Bolch and others, 2010).
The analyst’s misinterpretation of glacier imagery alsoleads to inaccuracy, though guidelines were developedwithin the framework of the Global Land Ice Measurementsfrom Space (GLIMS) initiative (Raup and Khalsa, 2007). Forexample, lateral moraine and end moraine should not beincluded as part of the glacier, while debris-covered iceshould be included, but neither of these conventions isfollowed (Nie and others, 2010). However, assessment of theuncertainty is difficult because images are not usuallyacquired at the same time or with the same spatial resolution(Paul and others, 2013).
Previous experience suggests that debris cover and spatialresolution are two key causes of uncertainty (Williams andothers, 1997; Silverio and Jaquet, 2005; Paul and others,2013). The uncertainty associated with resolution concen-trates on the edge of the glacier and the region of intersectionbetween rock and glacier, so it is evaluated by analyzing theglacier’s edge pixels (Wang, 2013). We used a buffer areawith half the sensor resolution to calculate the uncertainty inthe software package ArcMap. The results show that thehigher the sensor resolutions, the smaller the uncertainty. Theglacier outlines derived from Landsat ETM+ in 2000 thus havea smaller uncertainty than those derived from Landsat MSS in1976 and Landsat TM in 2009. Furthermore, the larger theglacier, the smaller the uncertainty. Glaciers less than 1 km2
typically have an uncertainty larger than 8.2%; the maximumuncertainty is 33%, derived from Landsat MSS. Theuncertainty associated with our analysis is shown in Table 2.
Standard uncertainty propagation was used to calculatethe overall uncertainty during 1976–2009:
� ¼ffiffiffiffiffiffiffiffiffiffiffiffiXn
i¼1�2i
sð1Þ
where � is the overall uncertainty in this study and �i is theuncertainty component at different times
The uncertainties estimated for the time periods 1976–2000, 2000–09 and 1976–2009 are 5.1%, 3.1% and 5.6%,respectively. The overall uncertainty in 1976, 2000 and2009 is 5.8%.
Table 1. Overview of the satellite image data sources applied
Satellite Path, row Image resolution Acquisition date
Landsat MSS
150r40 57 19 Dec 1976150r41 57 19 Dec 1976151r40 57 7 Jan 1977151r41 57 20 Dec 1976
Landsat 5 TM
139r40 30 9 Nov 2009139r41 30 9 Nov 2009140r40 30 31 Oct 2009140r41 30 10 Jan 2010141r40 30 7 Nov 2009
Landsat ETM+ 139r40 15 8 Nov 2000139r41 15 26 Dec 2000140r41 15 30 Oct 2000141r40 15 22 Nov 2000141r41 15 27 Dec 2001140r40 15 30 Oct 2000
Landsat 7 TM+,SCL OFF
139r40 15 16 Oct 2009139r41 15 10 Feb 2009140r40 15 23 Oct 2009140r41 15 8 Nov 2009141r40 15 30 Oct 2009
Shangguan and others: Glacier changes in the Koshi River basin 63
RESULTS
Inventory of glaciers in the Koshi River catchment
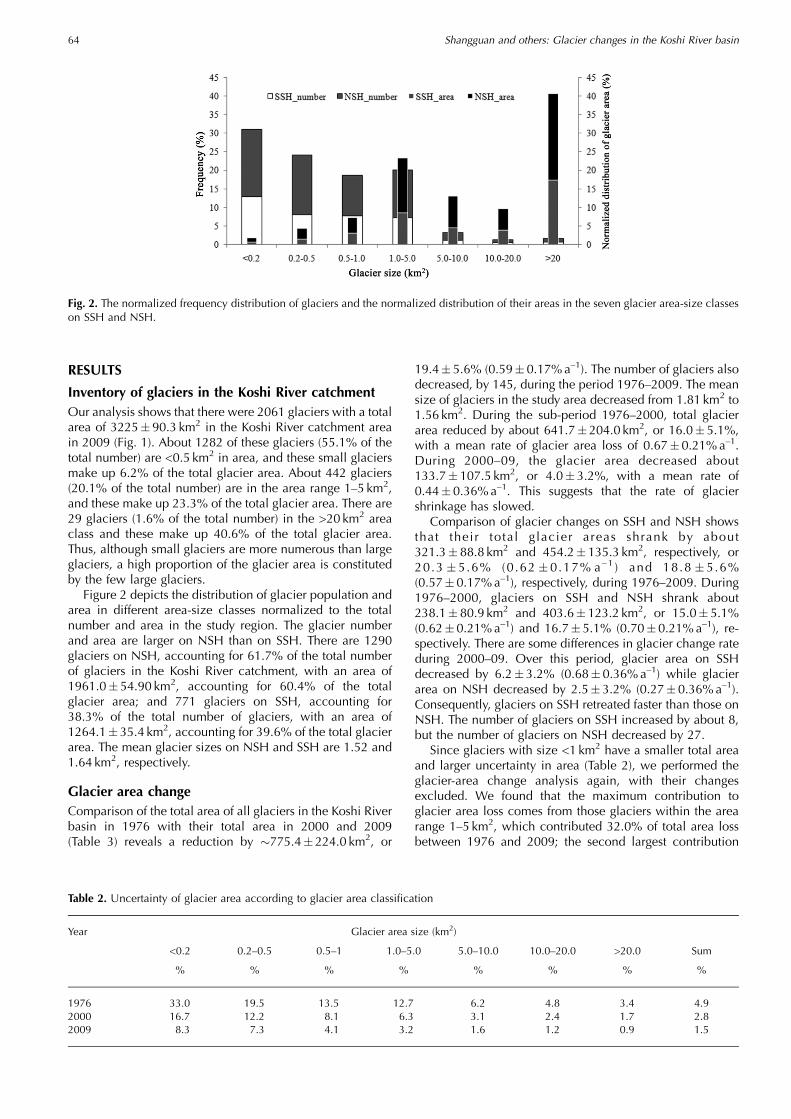
Our analysis shows that there were 2061 glaciers with a totalarea of 3225� 90.3 km2 in the Koshi River catchment areain 2009 (Fig. 1). About 1282 of these glaciers (55.1% of thetotal number) are <0.5 km2 in area, and these small glaciersmake up 6.2% of the total glacier area. About 442 glaciers(20.1% of the total number) are in the area range 1–5 km2,and these make up 23.3% of the total glacier area. There are29 glaciers (1.6% of the total number) in the >20 km2 areaclass and these make up 40.6% of the total glacier area.Thus, although small glaciers are more numerous than largeglaciers, a high proportion of the glacier area is constitutedby the few large glaciers.
Figure 2 depicts the distribution of glacier population andarea in different area-size classes normalized to the totalnumber and area in the study region. The glacier numberand area are larger on NSH than on SSH. There are 1290glaciers on NSH, accounting for 61.7% of the total numberof glaciers in the Koshi River catchment, with an area of1961.0�54.90 km2, accounting for 60.4% of the totalglacier area; and 771 glaciers on SSH, accounting for38.3% of the total number of glaciers, with an area of1264.1� 35.4 km2, accounting for 39.6% of the total glacierarea. The mean glacier sizes on NSH and SSH are 1.52 and1.64 km2, respectively.
Glacier area change
Comparison of the total area of all glaciers in the Koshi Riverbasin in 1976 with their total area in 2000 and 2009(Table 3) reveals a reduction by �775.4�224.0 km2, or
19.4� 5.6% (0.59� 0.17%a–1). The number of glaciers alsodecreased, by 145, during the period 1976–2009. The meansize of glaciers in the study area decreased from 1.81 km2 to1.56 km2. During the sub-period 1976–2000, total glacierarea reduced by about 641.7�204.0 km2, or 16.0�5.1%,with a mean rate of glacier area loss of 0.67�0.21%a–1.During 2000–09, the glacier area decreased about133.7� 107.5 km2, or 4.0� 3.2%, with a mean rate of0.44� 0.36%a–1. This suggests that the rate of glaciershrinkage has slowed.
Comparison of glacier changes on SSH and NSH showsthat their total glacier areas shrank by about321.3� 88.8 km2 and 454.2� 135.3 km2, respectively, or20.3 �5.6% (0.62 �0.17% a–1) and 18.8 � 5.6%(0.57�0.17%a–1), respectively, during 1976–2009. During1976–2000, glaciers on SSH and NSH shrank about238.1� 80.9 km2 and 403.6� 123.2 km2, or 15.0�5.1%(0.62�0.21%a–1) and 16.7�5.1% (0.70�0.21%a–1), re-spectively. There are some differences in glacier change rateduring 2000–09. Over this period, glacier area on SSHdecreased by 6.2�3.2% (0.68�0.36%a–1) while glacierarea on NSH decreased by 2.5� 3.2% (0.27�0.36%a–1).Consequently, glaciers on SSH retreated faster than those onNSH. The number of glaciers on SSH increased by about 8,but the number of glaciers on NSH decreased by 27.
Since glaciers with size <1 km2 have a smaller total areaand larger uncertainty in area (Table 2), we performed theglacier-area change analysis again, with their changesexcluded. We found that the maximum contribution toglacier area loss comes from those glaciers within the arearange 1–5 km2, which contributed 32.0% of total area lossbetween 1976 and 2009; the second largest contribution
Table 2. Uncertainty of glacier area according to glacier area classification
Year Glacier area size (km2)
<0.2 0.2–0.5 0.5–1 1.0–5.0 5.0–10.0 10.0–20.0 >20.0 Sum
% % % % % % % %
1976 33.0 19.5 13.5 12.7 6.2 4.8 3.4 4.92000 16.7 12.2 8.1 6.3 3.1 2.4 1.7 2.82009 8.3 7.3 4.1 3.2 1.6 1.2 0.9 1.5
Fig. 2. The normalized frequency distribution of glaciers and the normalized distribution of their areas in the seven glacier area-size classeson SSH and NSH.
Shangguan and others: Glacier changes in the Koshi River basin64
comes from glaciers larger than 20 km2 which contributed18.6%. The glacier area loss between 2000 and 2009accounts for 52% and 24% of the total area loss during theperiod 1976–2009 on SSH and NSH, respectively. Glacierslarger than 5 km2 account for 27.0% of the area loss on SSH.We observed that most debris-covered glacier tongues largerthan 10 km2 on SSH do not retreat as much as other glaciersbecause the debris keeps them stagnant or limits theirrecession. Nevertheless, glaciers on SSH retreat at a higherrate (0.68�0.36%a–1) from 2000 to 2009 because massloss is focused in the clean ice or middle parts of glacierablation zones.
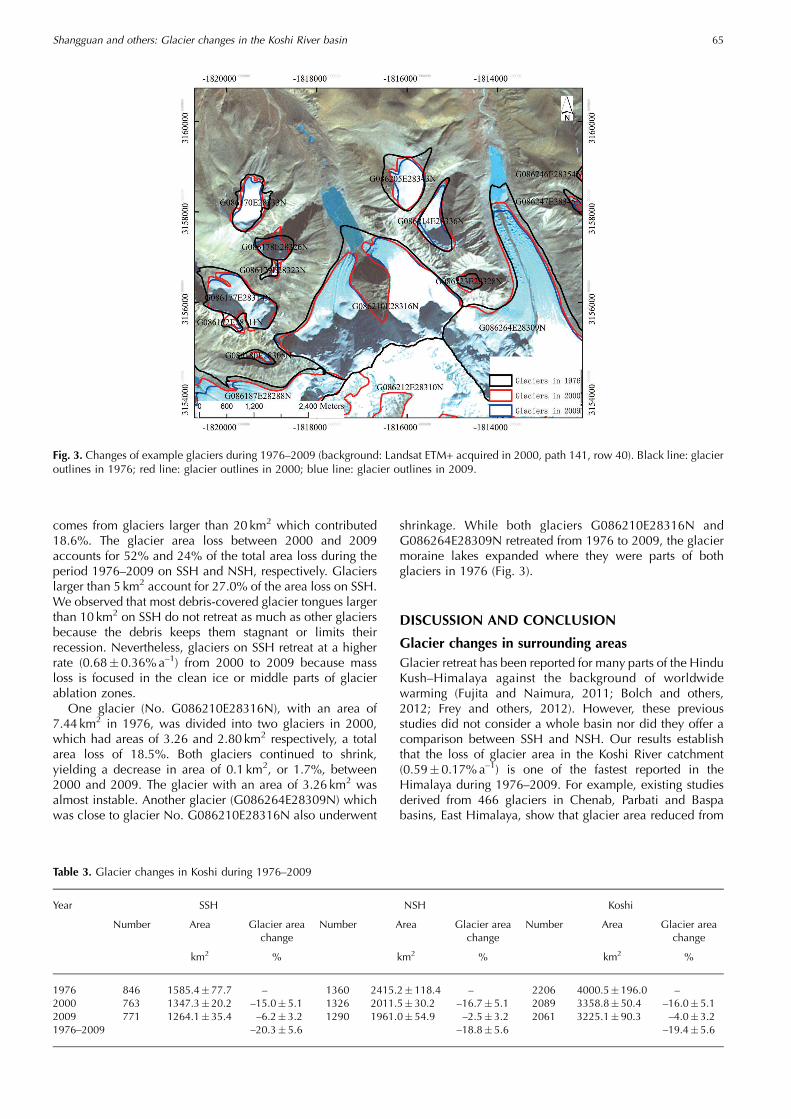
One glacier (No. G086210E28316N), with an area of7.44 km2 in 1976, was divided into two glaciers in 2000,which had areas of 3.26 and 2.80 km2 respectively, a totalarea loss of 18.5%. Both glaciers continued to shrink,yielding a decrease in area of 0.1 km2, or 1.7%, between2000 and 2009. The glacier with an area of 3.26 km2 wasalmost instable. Another glacier (G086264E28309N) whichwas close to glacier No. G086210E28316N also underwent
shrinkage. While both glaciers G086210E28316N andG086264E28309N retreated from 1976 to 2009, the glaciermoraine lakes expanded where they were parts of bothglaciers in 1976 (Fig. 3).
DISCUSSION AND CONCLUSION
Glacier changes in surrounding areas
Glacier retreat has been reported for many parts of the HinduKush–Himalaya against the background of worldwidewarming (Fujita and Naimura, 2011; Bolch and others,2012; Frey and others, 2012). However, these previousstudies did not consider a whole basin nor did they offer acomparison between SSH and NSH. Our results establishthat the loss of glacier area in the Koshi River catchment(0.59�0.17%a–1) is one of the fastest reported in theHimalaya during 1976–2009. For example, existing studiesderived from 466 glaciers in Chenab, Parbati and Baspabasins, East Himalaya, show that glacier area reduced from
Table 3. Glacier changes in Koshi during 1976–2009
Year SSH NSH Koshi
Number Area Glacier areachange
Number Area Glacier areachange
Number Area Glacier areachange
km2 % km2 % km2 %
1976 846 1585.4� 77.7 – 1360 2415.2� 118.4 – 2206 4000.5� 196.0 –2000 763 1347.3� 20.2 –15.0� 5.1 1326 2011.5� 30.2 –16.7� 5.1 2089 3358.8� 50.4 –16.0� 5.12009 771 1264.1� 35.4 –6.2� 3.2 1290 1961.0� 54.9 –2.5� 3.2 2061 3225.1� 90.3 –4.0� 3.21976–2009 –20.3� 5.6 –18.8� 5.6 –19.4� 5.6
Fig. 3. Changes of example glaciers during 1976–2009 (background: Landsat ETM+ acquired in 2000, path 141, row 40). Black line: glacieroutlines in 1976; red line: glacier outlines in 2000; blue line: glacier outlines in 2009.
Shangguan and others: Glacier changes in the Koshi River basin 65
2077 km2 in 1962 to 1628 km2 in 2004, accounting for 21%of total glacier area (Kulkarni and others, 2007). Glacierchanges in West Himalaya were reported to be �8.4%shrinkage (0.33%a–1) from 1976 to 2003 (Ye and others,2006). Mool and others (2001) found that the area of 153glaciers in the Poiqu River basin decreased �12.28 km2 from1988 to 2000, accounting for 5% (0.41%a–1) of the totalarea. A total of 999 glaciers in the Pumqu basin with an areaof 1461.84 km2 decreased 10% (0.30%a–1) in area and 9%in number from 1970 to 2000/01 (Jin and others, 2005). Mooland others’ and Jin and others’ results reflected only part ofthe glacier change in the Koshi River basin. Similar work wasdone in the Qomolangma region, where the glacier recessionwas 0.30%a–1 during 1974–2008, with slower glacier retreatsince 2000 (Ye and others, 2009). Nie and others (2010)surveyed glacier changes in the Qomolangma nature reservewhere glacier area decreased 502�0.04 km2, or 15.6%,during 1976–2006. However, this result cannot be comparedwith our glacier change estimates for the Koshi basin, sincethese authors excluded potentially debris-covered regionsfrom their glacier mapping.
Bedrock outcrop
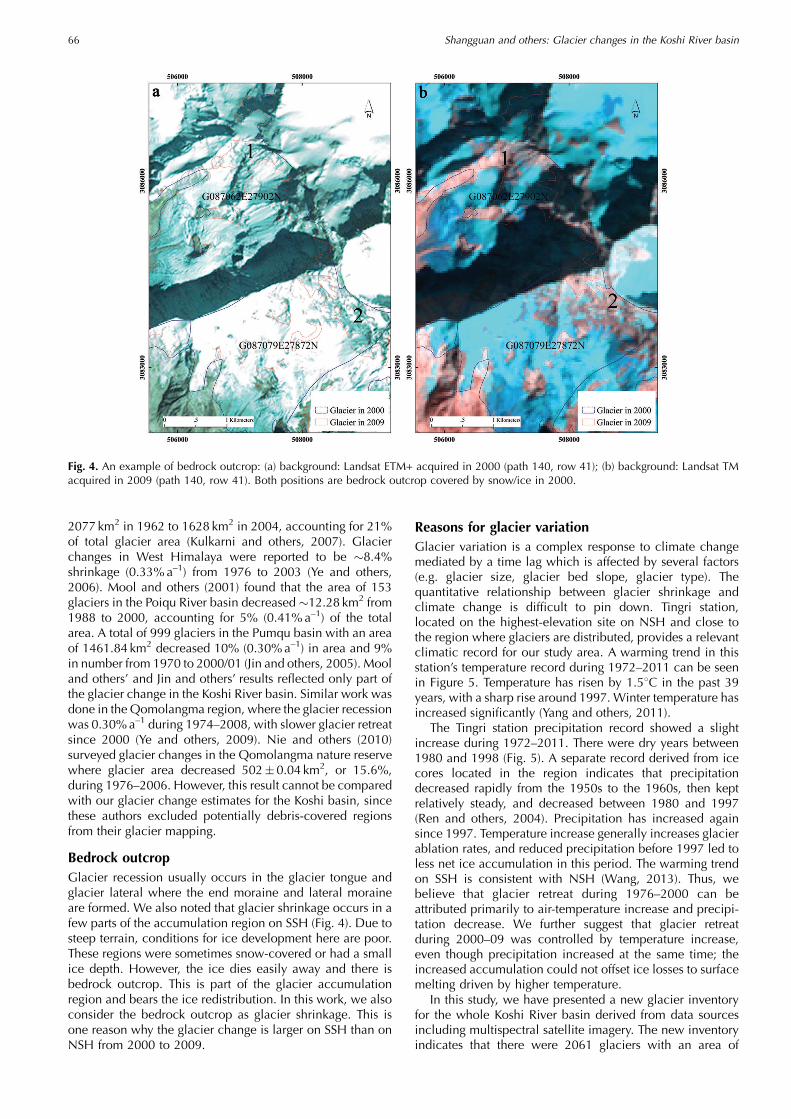
Glacier recession usually occurs in the glacier tongue andglacier lateral where the end moraine and lateral moraineare formed. We also noted that glacier shrinkage occurs in afew parts of the accumulation region on SSH (Fig. 4). Due tosteep terrain, conditions for ice development here are poor.These regions were sometimes snow-covered or had a smallice depth. However, the ice dies easily away and there isbedrock outcrop. This is part of the glacier accumulationregion and bears the ice redistribution. In this work, we alsoconsider the bedrock outcrop as glacier shrinkage. This isone reason why the glacier change is larger on SSH than onNSH from 2000 to 2009.
Reasons for glacier variation
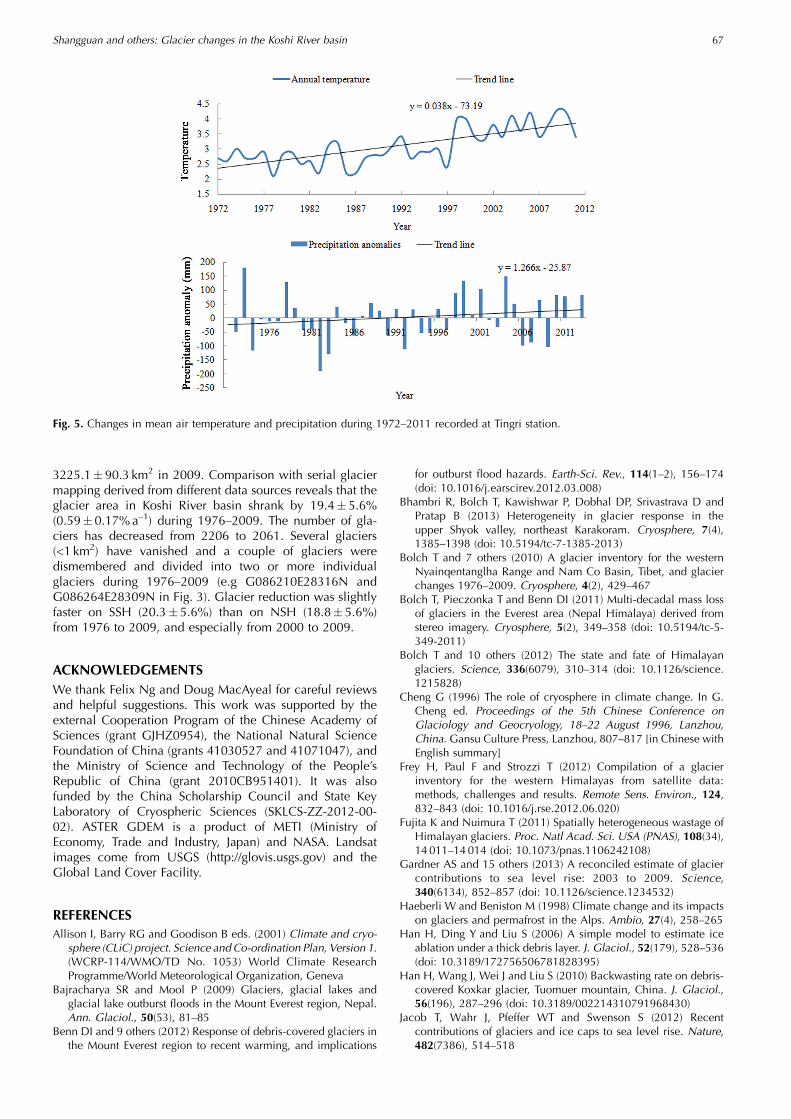
Glacier variation is a complex response to climate changemediated by a time lag which is affected by several factors(e.g. glacier size, glacier bed slope, glacier type). Thequantitative relationship between glacier shrinkage andclimate change is difficult to pin down. Tingri station,located on the highest-elevation site on NSH and close tothe region where glaciers are distributed, provides a relevantclimatic record for our study area. A warming trend in thisstation’s temperature record during 1972–2011 can be seenin Figure 5. Temperature has risen by 1.58C in the past 39years, with a sharp rise around 1997. Winter temperature hasincreased significantly (Yang and others, 2011).
The Tingri station precipitation record showed a slightincrease during 1972–2011. There were dry years between1980 and 1998 (Fig. 5). A separate record derived from icecores located in the region indicates that precipitationdecreased rapidly from the 1950s to the 1960s, then keptrelatively steady, and decreased between 1980 and 1997(Ren and others, 2004). Precipitation has increased againsince 1997. Temperature increase generally increases glacierablation rates, and reduced precipitation before 1997 led toless net ice accumulation in this period. The warming trendon SSH is consistent with NSH (Wang, 2013). Thus, webelieve that glacier retreat during 1976–2000 can beattributed primarily to air-temperature increase and precipi-tation decrease. We further suggest that glacier retreatduring 2000–09 was controlled by temperature increase,even though precipitation increased at the same time; theincreased accumulation could not offset ice losses to surfacemelting driven by higher temperature.
In this study, we have presented a new glacier inventoryfor the whole Koshi River basin derived from data sourcesincluding multispectral satellite imagery. The new inventoryindicates that there were 2061 glaciers with an area of
Fig. 4. An example of bedrock outcrop: (a) background: Landsat ETM+ acquired in 2000 (path 140, row 41); (b) background: Landsat TMacquired in 2009 (path 140, row 41). Both positions are bedrock outcrop covered by snow/ice in 2000.
Shangguan and others: Glacier changes in the Koshi River basin66
3225.1� 90.3 km2 in 2009. Comparison with serial glaciermapping derived from different data sources reveals that theglacier area in Koshi River basin shrank by 19.4�5.6%(0.59�0.17%a–1) during 1976–2009. The number of gla-ciers has decreased from 2206 to 2061. Several glaciers(<1 km2) have vanished and a couple of glaciers weredismembered and divided into two or more individualglaciers during 1976–2009 (e.g G086210E28316N andG086264E28309N in Fig. 3). Glacier reduction was slightlyfaster on SSH (20.3�5.6%) than on NSH (18.8�5.6%)from 1976 to 2009, and especially from 2000 to 2009.
ACKNOWLEDGEMENTS
We thank Felix Ng and Doug MacAyeal for careful reviewsand helpful suggestions. This work was supported by theexternal Cooperation Program of the Chinese Academy ofSciences (grant GJHZ0954), the National Natural ScienceFoundation of China (grants 41030527 and 41071047), andthe Ministry of Science and Technology of the People’sRepublic of China (grant 2010CB951401). It was alsofunded by the China Scholarship Council and State KeyLaboratory of Cryospheric Sciences (SKLCS-ZZ-2012-00-02). ASTER GDEM is a product of METI (Ministry ofEconomy, Trade and Industry, Japan) and NASA. Landsatimages come from USGS (http://glovis.usgs.gov) and theGlobal Land Cover Facility.
REFERENCES
Allison I, Barry RG and Goodison B eds. (2001) Climate and cryo-sphere (CLiC) project. Science and Co-ordination Plan, Version 1.(WCRP-114/WMO/TD No. 1053) World Climate ResearchProgramme/World Meteorological Organization, Geneva
Bajracharya SR and Mool P (2009) Glaciers, glacial lakes andglacial lake outburst floods in the Mount Everest region, Nepal.Ann. Glaciol., 50(53), 81–85
Benn DI and 9 others (2012) Response of debris-covered glaciers inthe Mount Everest region to recent warming, and implications
for outburst flood hazards. Earth-Sci. Rev., 114(1–2), 156–174(doi: 10.1016/j.earscirev.2012.03.008)
Bhambri R, Bolch T, Kawishwar P, Dobhal DP, Srivastrava D andPratap B (2013) Heterogeneity in glacier response in theupper Shyok valley, northeast Karakoram. Cryosphere, 7(4),1385–1398 (doi: 10.5194/tc-7-1385-2013)
Bolch T and 7 others (2010) A glacier inventory for the westernNyainqentanglha Range and Nam Co Basin, Tibet, and glacierchanges 1976–2009. Cryosphere, 4(2), 429–467
Bolch T, Pieczonka T and Benn DI (2011) Multi-decadal mass lossof glaciers in the Everest area (Nepal Himalaya) derived fromstereo imagery. Cryosphere, 5(2), 349–358 (doi: 10.5194/tc-5-349-2011)
Bolch T and 10 others (2012) The state and fate of Himalayanglaciers. Science, 336(6079), 310–314 (doi: 10.1126/science.1215828)
Cheng G (1996) The role of cryosphere in climate change. In G.Cheng ed. Proceedings of the 5th Chinese Conference onGlaciology and Geocryology, 18–22 August 1996, Lanzhou,China. Gansu Culture Press, Lanzhou, 807–817 [in Chinese withEnglish summary]
Frey H, Paul F and Strozzi T (2012) Compilation of a glacierinventory for the western Himalayas from satellite data:methods, challenges and results. Remote Sens. Environ., 124,832–843 (doi: 10.1016/j.rse.2012.06.020)
Fujita K and Nuimura T (2011) Spatially heterogeneous wastage ofHimalayan glaciers. Proc. Natl Acad. Sci. USA (PNAS), 108(34),14 011–14 014 (doi: 10.1073/pnas.1106242108)
Gardner AS and 15 others (2013) A reconciled estimate of glaciercontributions to sea level rise: 2003 to 2009. Science,340(6134), 852–857 (doi: 10.1126/science.1234532)
Haeberli W and Beniston M (1998) Climate change and its impactson glaciers and permafrost in the Alps. Ambio, 27(4), 258–265
Han H, Ding Y and Liu S (2006) A simple model to estimate iceablation under a thick debris layer. J. Glaciol., 52(179), 528–536(doi: 10.3189/172756506781828395)
Han H, Wang J, Wei J and Liu S (2010) Backwasting rate on debris-covered Koxkar glacier, Tuomuer mountain, China. J. Glaciol.,56(196), 287–296 (doi: 10.3189/002214310791968430)
Jacob T, Wahr J, Pfeffer WT and Swenson S (2012) Recentcontributions of glaciers and ice caps to sea level rise. Nature,482(7386), 514–518
Fig. 5. Changes in mean air temperature and precipitation during 1972–2011 recorded at Tingri station.
Shangguan and others: Glacier changes in the Koshi River basin 67
Jin R, Xin L, Che T, Wu L and Mool P (2005) Glacier area changesin the Pumqu river basin, Tibetan Plateau, between the 1970sand 2001. J. Glaciol., 51(175), 607–610 (doi: 10.3189/172756505781829061)
Kaab A, Berthier E, Nuth C, Gardelle J and Arnaud Y (2012)Contrasting patterns of early twenty-first-century glacier masschange in the Himalayas. Nature, 488(7412), 495–498 (doi:10.1038/nature11324)
Kargel JS, Cogley JG, Leonard GJ, Haritashya U and Byers A (2011)Himalayan glaciers: the big picture is a montage. Proc. NatlAcad. Sci. USA (PNAS), 108(36), 14 709–14 710
Kulkarni AV and 6 others (2007) Glacial retreat in Himalaya usingIndian remote sensing satellite data. Curr. Sci., 92(1), 69–75
Li Z, Sun W and Zeng Q (1998) Measurement of glacier variation inthe Tibetan Plateau using Landsat data. Remote Sens. Environ.,63(3), 258–264 (doi: 10.1016/S0034-4257(97)00140-5)
Mool PK, Bajracharya SR and Joshi SP (2001) Inventory of glaciers,glacial lakes and glacial lake outburst floods: monitoring andearly warning systems in the Hindu Kush–Himalayan region,Nepal. International Centre for Integrated Mountain Develop-ment with United Nations Environment Programme/RegionalResource Centre for Asia and the Pacific, Kathmandu
Nie Y, Zhang Y, Liu L and Zhang J (2010) Monitor glacier changebased on remote sensing in the Mt. Qomolangma NationalNature Preserve, 1976–2006. Acta Geogr. Sin., 65(1), 13–28 [inChinese with English summary]
Nuimura T, Fujita K, Yamaguchi S and Sharma RR (2012) Elevationchanges of glaciers revealed by multitemporal digital elevationmodels calibrated by GPS survey in the Khumbu region, NepalHimalayas, 1992–2008. J. Glaciol., 58(210), 648–656 (doi:10.3189/2012JoG11J061)
Parry ML, Canziani OF, Palutikof JP, Van der Linden PJ and HansonCE (2007) Climate change 2007: impacts, adaptation andvulnerability. Contribution of Working Group II to the FourthAssessment Report of the Intergovernmental Panel on ClimateChange. Cambridge University Press, Cambridge
Paul F (2000) Evaluation of different methods for glacier mappingusing Landsat TM. In A Decade of Trans-European RemoteSensing Cooperation. Proceedings of the 20th EARSeL Sympo-sium, 14–16 June 2000, Dresden, Germany. AA Balkema,Rotterdam, 239–245
Paul F, Kaab A, Maisch M, Kellenberger T and Haeberli W(2002) The new remote-sensing-derived Swiss glacier inventory:I. Methods. Ann. Glaciol., 34, 355–361 (doi: 10.3189/172756402781817941)
Paul F, Huggel C and Kaab A (2004) Combining satellite multi-spectral image data and a digital elevation model for mappingdebris-covered glaciers. Remote Sens. Environ., 89(4), 510–518(doi: 10.1016/j.rse.2003.11.007)
Paul F and 19 others (2013) On the accuracy of glacier outlinesderived from remote-sensing data. Ann. Glaciol., 54(63 Pt 1),171–182 (doi: 10.3189/2013AoG63A296)
Rajchal R (2006) Population status, distribution, management,threats and migration measures of Himalayan musk deer(Moschus chrysogaster) in Sagarmatha National Park. A reportsubmitted to DNPWC/TRPAP, Babarmahal, Kathmandu, Nepal.Institute of Forestry, Pokhara
Raup B and Khalsa SJS (2007) GLIMS data analysis tutorial. http://www.glims.org/MapsAndDocs/assets/GLIMS_Analysis_Tutorial_a4.pdf
Ren J, Qin D, Kang S, Hou S, Pu J and Jing Z (2004) Glacier variationsand climate warming and drying in the central Himalayas.Chinese Sci. Bull., 49(1), 65–69 (doi: 10.1007/BF02901744)
Ren J, Jing Z, Pu J and Qin X (2006) Glacier variations and climatechange in the central Himalaya over the past few decades. Ann.Glaciol., 43, 218–222 (doi: 10.3189/172756406781812230)
Richardson SD and Reynolds JM (2000) An overview of glacialhazards in the Himalayas. Quat. Int., 65/66, 31–47
Salerno F, Buraschi E, Bruccoleri G, Tartari G and Smiraglia C(2008) Glacier surface-area changes in Sagarmatha nationalpark, Nepal, in the second half of the 20th century, bycomparison of historical maps. J. Glaciol., 54(187), 738–752(doi: 10.3189/002214308786570926)
Scherler D, Bookhagen B and Strecker MR (2011) Spatially variableresponse of Himalayan glaciers to climate change affected bydebris cover. Nature Geosci., 4(3), 156–159 (doi: 10.1038/ngeo1068)
Schomacker A (2008) What controls dead-ice melting underdifferent climate conditions? A discussion. Earth-Sci. Rev.,90(3–4), 103–113 (doi: 10.1016/j.earscirev.2008.08.003)
Shukla A, Arora MK and Gupta RP (2010) Synergistic approach formapping debris-covered glaciers using optical–thermal remotesensing data with inputs from geomorphometric parameters.Remote Sens. Environ., 114(7), 1378–1387 (doi: 10.1016/j.rse.2010.01.015)
Silverio W and Jaquet J-M (2005) Glacial cover mapping (1987–1996) of the Cordillera Blanca (Peru) using satellite imagery.Remote Sens. Environ., 95(3), 342–350 (doi: 10.1016/j.rse.2004.12.012)
Walter F, O’Neel S, McNamara DE, Pfeffer T, Bassis J and FrickerHA (2010) Iceberg calving during transition from grounded tofloating ice: Columbia Glacier, Alaska. Geophys. Res. Lett.,37(15), L15501 (doi: 10.1029/2010GL043201)
Wang Y (2013) Variation analysis of glaciers and glacial lakes in thepast 46 years in Mt. Everest area: [D]. University of ChineseAcademy of Sciences, Beijing, 27–33 [in Chinese with Englishsummary]
Williams RS Jr, Hall DK and Chien JYL (1997) Comparison ofsatellite-derived with ground-based measurements of the fluc-tuations of the margins of Vatnajokull, Iceland, 1973–92. Ann.Glaciol., 24, 72–80
Yang X, Zhang T, Qin D, Kang S and Qin X (2011) Characteristicsand changes in air temperature and glacier’s response on thenorth slope of Mt. Qomolangma (Mt. Everest). Arct. Antarct. Alp.Res., 43(1), 147–160 (doi: 10.1657/1938-4246-43.1.147)
Yao T and 14 others (2012) Different glacier status with atmosphericcirculations in Tibetan Plateau and surroundings. NatureClimate Change, 2(9), 663–667 (doi: 10.1038/nclimate1580)
Ye Q, Yao T, Kang S, Chen F and Wang J (2006) Glacier variations inthe Naimona’nyi region, western Himalaya, in the last threedecades. Ann. Glaciol., 43, 385–389 (doi: 10.3189/172756406781812032)
Ye Q, Zhong Z, Kang S, Stein A, Wei Q and Liu J (2009) Monitoringglacier and supra-glacier lakes from space in Mt. Qomolangmaregion of the Himalayas on the Tibetan Plateau in China. J. Mt.Sci. [China], 6, 211–220 (doi: 10.1007/s11629-009-1016-4)
Zhang, W., Z. Su and T. Li (2001) Dynamic features of glacier in theHailuogou. In Zhong XH ed. Environment and ecosystem in theeastern edge of Qinghai–Xizang Plateau. Sichuan UniversityPress, Chengdu, 81–101 [in Chinese with English summary]
Shangguan and others: Glacier changes in the Koshi River basin68
Related Documents