Quaternary Science Reviews 23 (2004) 17–27 Glacial–interglacial organic carbon record from the Makassar Strait, Indonesia: implications for regional changes in continental vegetation Katherine Visser 1 , Robert Thunell*, Miguel A. Gon˜i Department of Geological Sciences, University of South Carolina, Columbia SC 29208, USA Received 24 February 2003; accepted 31 July 2003 Abstract Recent studies convincingly show that climate in the Western Pacific Warm Pool and other equatorial/tropical regions was significantly colder (by B3–4 C) during glacial periods, prompting a reexamination of the late Pleistocene paleoenvironments of these regions. This study examines changes in continental vegetation during the last two deglaciations (Terminations I and II) using a sediment core (MD9821-62) recovered from the Makassar Strait, Indonesia. Evidence based on the lignin phenol ratios suggests that vegetation on Borneo and other surrounding islands did not significantly change from tropical rainforest during the last two glacial periods relative to subsequent interglacial periods. This supports the hypothesis that the winter monsoon increased in strength during glacial periods, allowing Indonesia to maintain high rainfall despite the cooler conditions. r 2003 Elsevier Ltd. All rights reserved. 1. Introduction There is a growing consensus that tropical climates have varied significantly on both glacial–interglacial and millennial time-scales, and that the tropics may play a more important role in controlling climate variability on these timescales than previously thought (Cane, 1998; Cane and Clement, 1999; Pierrehumbert, 2000). While the CLIMAP Project members (1981) initially estimated that sea surface temperatures (SST) in the tropics were less than 2 C cooler than present during the last glacial maximum (LGM), more recent studies from both the Atlantic (Guilderson et al., 1994, 2001; N . urnberg et al., 2000) and Pacific (Patrick and Thunell, 1997; Mix et al., 1999; Lea et al., 2000; Kienast et al., 2001; Stott et al., 2002; Visser et al., 2003) report that glacial SST in tropical regions were 3–6 C cooler than present. These revised marine temperatures are more in line with observations that point to a steepening of the atmo- spheric lapse rate and a depression of snow lines in the tropics (Webster and Streeten, 1978), as well as d 18 O data from tropical high elevation ice cores (Thompson et al., 1995, 1998) that indicate a 5–6 cooling over the continents during the last glacial period. An important question to be answered is how did continental vegetation in tropical regions respond to such large-scale changes in climate? For the Indonesian region, previous studies of glacial–interglacial changes in vegetation, based primarily on pollen and d 13 C TOC (in an attempt to pinpoint a change from C3 to C4 vegetation) data, suggest that during glacial periods grasslands (i.e., C4 grasslands) dominated the Indone- sian (as well as the tropical) terrestrial landscape (van der Kaars, 1991; van der Kaars et al., 2000; Hope, 2001). This explanation requires the glacial climate to have been arid, most likely due to an increase in the length of the dry season, rather than the humid environment that typifies this region today (van der Kaars, 1991; van der Kaars et al., 2000; Gasse, 2000; Moss and Kershaw, 2000; Behling, 2002). However, a recent study illustrates that the link between the increased occurrence of Poaceae (grass) pollen and increased aridity may over- simplify glacial climate conditions due to the influence of numerous factors other than aridity in controlling the distribution of this vegetation (Bush, 2002). Emerging evidence suggests that many tropical regions were not significantly drier during glacial periods (Stuijts et al., 1988; Schlunz et al., 1999; Colinvaux and de Oliveira, 2000; Colinvaux et al., 2000; Sun et al., 2000; Cowling ARTICLE IN PRESS *Corresponding author. Tel.: +1-803-777-7593. E-mail address: [email protected] (R. Thunell). 1 Current Address: US Geological Survey, Woods Hole, MA 02543, USA. 0277-3791/$ - see front matter r 2003 Elsevier Ltd. All rights reserved. doi:10.1016/j.quascirev.2003.07.001

Welcome message from author
This document is posted to help you gain knowledge. Please leave a comment to let me know what you think about it! Share it to your friends and learn new things together.
Transcript

ARTICLE IN PRESS
*Correspondin
E-mail addres1Current Addr
USA.
0277-3791/$ - see
doi:10.1016/j.qua
Quaternary Science Reviews 23 (2004) 17–27
Glacial–interglacial organic carbon record from the Makassar Strait,Indonesia: implications for regional changes in continental vegetation
Katherine Visser1, Robert Thunell*, Miguel A. Goni
Department of Geological Sciences, University of South Carolina, Columbia SC 29208, USA
Received 24 February 2003; accepted 31 July 2003
Abstract
Recent studies convincingly show that climate in the Western Pacific Warm Pool and other equatorial/tropical regions was
significantly colder (by B3–4�C) during glacial periods, prompting a reexamination of the late Pleistocene paleoenvironments ofthese regions. This study examines changes in continental vegetation during the last two deglaciations (Terminations I and II) using
a sediment core (MD9821-62) recovered from the Makassar Strait, Indonesia. Evidence based on the lignin phenol ratios suggests
that vegetation on Borneo and other surrounding islands did not significantly change from tropical rainforest during the last two
glacial periods relative to subsequent interglacial periods. This supports the hypothesis that the winter monsoon increased in
strength during glacial periods, allowing Indonesia to maintain high rainfall despite the cooler conditions.
r 2003 Elsevier Ltd. All rights reserved.
1. Introduction
There is a growing consensus that tropical climateshave varied significantly on both glacial–interglacial andmillennial time-scales, and that the tropics may play amore important role in controlling climate variability onthese timescales than previously thought (Cane, 1998;Cane and Clement, 1999; Pierrehumbert, 2000). Whilethe CLIMAP Project members (1981) initially estimatedthat sea surface temperatures (SST) in the tropicswere less than 2�C cooler than present during the lastglacial maximum (LGM), more recent studies from boththe Atlantic (Guilderson et al., 1994, 2001; N .urnberget al., 2000) and Pacific (Patrick and Thunell, 1997; Mixet al., 1999; Lea et al., 2000; Kienast et al., 2001; Stottet al., 2002; Visser et al., 2003) report that glacial SST intropical regions were 3–6�C cooler than present. Theserevised marine temperatures are more in line withobservations that point to a steepening of the atmo-spheric lapse rate and a depression of snow lines in thetropics (Webster and Streeten, 1978), as well as d18Odata from tropical high elevation ice cores (Thompson
g author. Tel.: +1-803-777-7593.
s: [email protected] (R. Thunell).
ess: US Geological Survey, Woods Hole, MA 02543,
front matter r 2003 Elsevier Ltd. All rights reserved.
scirev.2003.07.001
et al., 1995, 1998) that indicate a 5–6� cooling over thecontinents during the last glacial period.An important question to be answered is how did
continental vegetation in tropical regions respond tosuch large-scale changes in climate? For the Indonesianregion, previous studies of glacial–interglacial changesin vegetation, based primarily on pollen and d13CTOC(in an attempt to pinpoint a change from C3 to C4vegetation) data, suggest that during glacial periodsgrasslands (i.e., C4 grasslands) dominated the Indone-sian (as well as the tropical) terrestrial landscape (vander Kaars, 1991; van der Kaars et al., 2000; Hope, 2001).This explanation requires the glacial climate to havebeen arid, most likely due to an increase in the length ofthe dry season, rather than the humid environment thattypifies this region today (van der Kaars, 1991; van derKaars et al., 2000; Gasse, 2000; Moss and Kershaw,2000; Behling, 2002). However, a recent study illustratesthat the link between the increased occurrence ofPoaceae (grass) pollen and increased aridity may over-simplify glacial climate conditions due to the influenceof numerous factors other than aridity in controlling thedistribution of this vegetation (Bush, 2002). Emergingevidence suggests that many tropical regions were notsignificantly drier during glacial periods (Stuijts et al.,1988; Schlunz et al., 1999; Colinvaux and de Oliveira,2000; Colinvaux et al., 2000; Sun et al., 2000; Cowling
ARTICLE IN PRESSK. Visser et al. / Quaternary Science Reviews 23 (2004) 17–2718
et al., 2001; Baker et al., 2001a, b; Taylor et al., 2001;Bush et al., 2002). For example, Sun et al. (2000) suggestthat humid glacial conditions in the Indonesian region,due in part to the increased strength of the wintermonsoon, allowed tropical rainforest to vegetate theexposed Sunda Shelf during the LGM.An increased awareness of the importance of the
tropics in the global climate system has prompted areexamination of the paleoenvironments of this region.The overall objective of this study is to use an organicgeochemical approach to evaluate the response of theterrestrial ecosystem in the Indonesian region to climatechange during the last two glacial–interglacial transi-tions. Specifically, a study of the lignin phenol ratiospreserved in a core from the Makassar Strait, Indonesiawas carried out in order to examine changes interrestrial vegetation on Borneo and Sulawesi associatedwith Terminations I and II.
2. Modern climatological setting
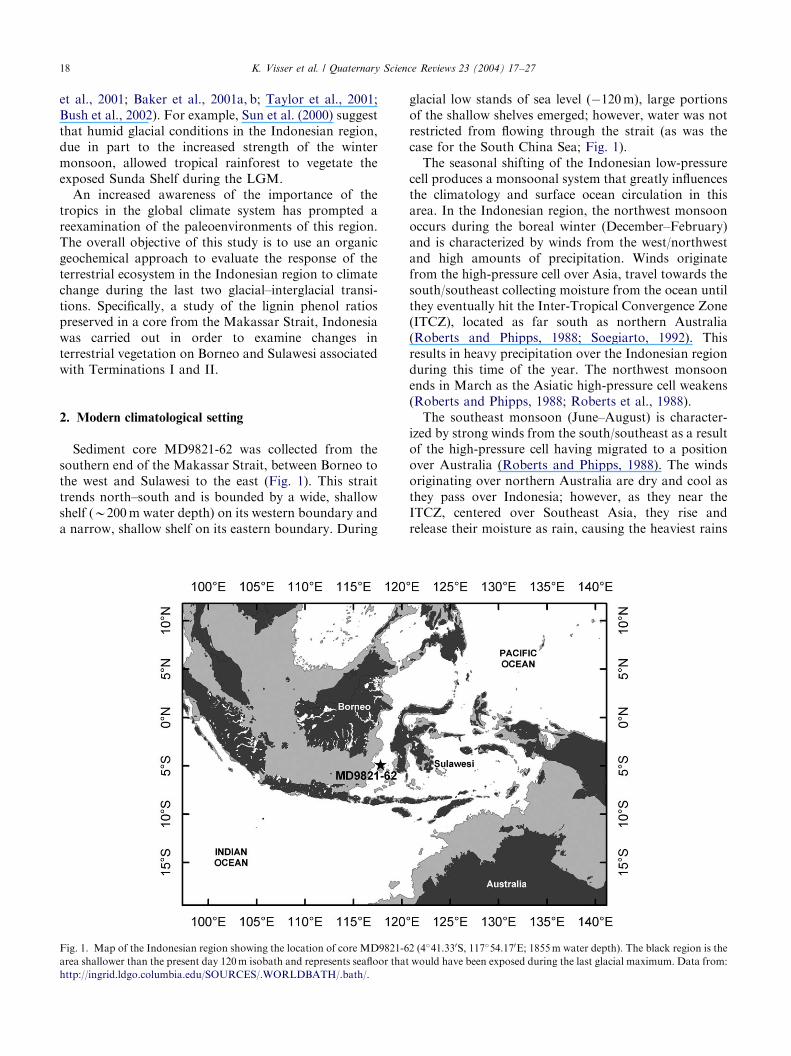
Sediment core MD9821-62 was collected from thesouthern end of the Makassar Strait, between Borneo tothe west and Sulawesi to the east (Fig. 1). This straittrends north–south and is bounded by a wide, shallowshelf (B200m water depth) on its western boundary anda narrow, shallow shelf on its eastern boundary. During
Fig. 1. Map of the Indonesian region showing the location of core MD9821-6
area shallower than the present day 120m isobath and represents seafloor that
http://ingrid.ldgo.columbia.edu/SOURCES/.WORLDBATH/.bath/.
glacial low stands of sea level (�120m), large portionsof the shallow shelves emerged; however, water was notrestricted from flowing through the strait (as was thecase for the South China Sea; Fig. 1).The seasonal shifting of the Indonesian low-pressure
cell produces a monsoonal system that greatly influencesthe climatology and surface ocean circulation in thisarea. In the Indonesian region, the northwest monsoonoccurs during the boreal winter (December–February)and is characterized by winds from the west/northwestand high amounts of precipitation. Winds originatefrom the high-pressure cell over Asia, travel towards thesouth/southeast collecting moisture from the ocean untilthey eventually hit the Inter-Tropical Convergence Zone(ITCZ), located as far south as northern Australia(Roberts and Phipps, 1988; Soegiarto, 1992). Thisresults in heavy precipitation over the Indonesian regionduring this time of the year. The northwest monsoonends in March as the Asiatic high-pressure cell weakens(Roberts and Phipps, 1988; Roberts et al., 1988).The southeast monsoon (June–August) is character-
ized by strong winds from the south/southeast as a resultof the high-pressure cell having migrated to a positionover Australia (Roberts and Phipps, 1988). The windsoriginating over northern Australia are dry and cool asthey pass over Indonesia; however, as they near theITCZ, centered over Southeast Asia, they rise andrelease their moisture as rain, causing the heaviest rains
2 (4�41.330S, 117�54.170E; 1855m water depth). The black region is the
would have been exposed during the last glacial maximum. Data from:
ARTICLE IN PRESSK. Visser et al. / Quaternary Science Reviews 23 (2004) 17–27 19
in Southeast Asia (north of Indonesia) during thesummer (Soegiarto, 1992; Barmawidjaja et al., 1993).The present day vegetation on Borneo and Sulawesi is
characterized by tropical lowland and montane rainforests (i.e., angiosperms; MacKinnon, 1997; van derKaars et al., 2001). The distribution of vegetation in theregion is dictated by the monsoon-controlled seasonalrainfall patterns. On Sulawesi, the rainfall amounts arenot drastically reduced during the ‘dry’ season; only onthe tip of southern Sulawesi is there a dry season thatlasts forB3–4 months (van der Kaars et al., 2001). Theaverage rainfall for Borneo and Sulawesi is greater than3000mm/yr (van der Kaars and Dam, 1995).
3. Glacial–interglacial paleoceanographic/paleoclimatic
changes in the Indonesian region
Numerous studies suggest that the boreal SoutheastAsian winter monsoon intensified during glacial periods,due perhaps to increased cooling of the Asian continentas a result of increased global albedo (e.g., Wang andWang, 1990; Huang et al., 1997a; Wang et al., 1999; Sunet al., 2000). Evidence for a stronger glacial wintermonsoon is found in Chinese loess sequences (An et al.,1991), Chinese lake sediment records (Huang et al.,1997b; Hodell et al., 1999), and deep-sea records (Huanget al., 1997b; Wang et al., 1999; Sun et al., 2000). As aresult of the increased winter monsoon, the northernreaches of the SE Asian monsoon (e.g., the northernSouth China Sea) were drier and colder, whereas theIndonesian region (and the southern South China Sea)was colder but as wet as or wetter than today (Pelejeroet al., 1999; Sun et al., 2000). Data from the Ontong-Java Plateau also suggests that sea surface salinities inthis region decreased during glacial periods due to anincrease in precipitation, as a result, perhaps, ofincreased water vapor transport into the Western Pacificby stronger glacial trade winds (Lea et al., 2000).In addition to these changes in the monsoon system,
recent stable isotope and Mg/Ca paleotemperaturestudies on core MD9821-62 indicate that glacialtemperatures (MIS 6 and 2) in the Makassar StraitwereB4�C cooler than those of the ensuing interglacialperiods (MIS 5e and 1) (Visser et al., 2003). Asmentioned previously, these relatively large glacial–interglacial SST changes in the Indonesian region arecorroborated by snowline reconstructions from tropicalAustralasia (Webster and Streeten, 1978).Some palynological studies suggest that parts of
Indonesia and northern Australia were drier duringthe LGM, as evidenced by an increase in grass pollen atthis time (e.g., Caratini and Tissot, 1988; van der Kaars,1991; Barmawidjaja et al., 1993; van der Kaars andDam, 1997; Moss and Kershaw, 2000; Dam et al., 2001).However, many of these studies acknowledge that the
pollen deposited in Indonesian Seas may have beentransported from nearby regions (e.g., northern Aus-tralia, southern China) that were more arid during theLGM. Other palynological studies report that theIndonesian region was colder, but not drier duringglacial periods (Stuijts, 1984; Stuijts et al., 1988). Sunet al. (2000) illustrated the highly variable nature of theregion, showing that the northern shelf of the SouthChina Sea experienced drier, colder conditions, while theSunda shelf in the southern South China Sea (adjacentto Borneo) was continuously vegetated by a tropicalhumid rainforest during the LGM. They show thatwhile the whole region cooled, the northern parts weremore arid and the southern parts were at least as moistas they are today. Similar evidence for cooler and humidconditions in the equatorial region of South Americaduring the LGM are now becoming widely accepted(Colinvaux and de Oliveira, 2000; Colinvaux et al., 2000;Baker et al., 2001a, b; Kastner and Goni, 2003),suggesting a global distribution of this climatic regime.
4. Materials and methods
4.1. Sample material
The sediment core used for this study was recoveredduring the IMAGES IV (International Marine GlobalChanges Study) cruise in June 1998 through theIndonesian archipelago and the easternmost IndianOcean. This study utilizes core MD9821-62 (4�41.330S,117�54.170E, 1855m water depth; Fig. 1) that is 55.33mlong and has an average sedimentation rate of B25 cm/kyr. This core is composed of homogeneous hemipelagicmud throughout, containing no visible turbidites orvolcanic ash layers. One centimeter thick samples(B10 cc) were collected every 10 cm over the upper40m of the core. A gap in the sediment, from 2230 to2330 cm, caused by stretching of the sediment core uponretrieval from the ocean floor was deleted from thestratigraphic sequence.The samples were freeze dried and approximately
two-thirds of each sample was wet sieved through a>63 mm sieve, dried at 50�C and further sieved to retainthe 250–355 mm size fraction for stable oxygen isotopeanalyses and radiocarbon dating. The remaining bulksample was ground to a homogeneous, fine powder in anagate pestle in order to be used for organic carbon,nitrogen, and lignin analyses.
4.2. Analytical techniques
Oxygen isotope analyses were conducted on shells ofthe planktonic foraminifer species Globigerinoides ruber
picked from the 250–355 mm size fraction. Approxi-mately 60–70 mg of sample was analyzed using a VG
ARTICLE IN PRESS
Table 1
AMS 14C and calendar year ages for core MD9821-62
Sample
depth
(cm)
Measured 14C age
(14C yrBP)a,bCalibrated 14C age
(cal yr BP)cCalibrated 1s agerange (cal yr)d
11 910740880
903–818
141 23307402400
2463–2348
341 36207404040
4078–3974
521 69707407820
7862–7772
661 954074010,800
10,838–10,583
698 10,59074012,619, 12,477,
12,383e
12,653–12,329
861 14,89074017,710
17,957–17,440
992 17,74075021,000
21,303–20,653
1111 22,58076027,290
27,436–27,136
1271 28,430711033,910
34,056–33,756
aAll 14C dates were determined on G. ruber.b 14C ages were corrected for an oceanic reservoir effect of �400
years (Bard, 1988).c 14C ages were converted to calendar years using the CALIB
software, version 4.3 (Stuiver and Reimer, 1993; Stuiver et al., 1998).d1s range encloses 68.3% of the area of probability (Stuiver and
Reimer, 1993).eThe average of these 3 calendar ages was used (12,490 cal yr BP).
K. Visser et al. / Quaternary Science Reviews 23 (2004) 17–2720
Optima stable isotope ratio mass spectrometer (IRMS)equipped with an automated carbonate system. Thesamples were reacted in a common acid bath of 100%phosphoric acid at 90�C. The evolved CO2 gas was thenanalyzed on the IRMS. Oxygen and carbon isotopicdata are reported in delta notation relative to the(Vienna) Pee Dee Belemnite (VPDB) standard via ourworking standard, Burgess Ferry. The long-term stan-dard reproducibility for oxygen (d18O) isotopes based onreplicate measurements of reference standard is70.07%.Organic carbon content was determined using
8–12mg of carbonate free bulk homogenized sediment.To remove the carbonate, the sediments were sonicatedwith 7.5ml of phosphoric acid (1M) for 8–9minand filtered through a glass fiber filter (retentiono1 mm) with deionized water. The filter was dried(at 50�C), folded into a tin disk and analyzed bycombustion on a Perkin Elmer 2400 CHN ElementalAnalyzer. Every 10th sample was run in triplicateand cystine standards were used to ensure preciseand accurate results, respectively. The mean precisionwas 70.06% organic carbon, based on triplicateanalyses.Total carbon and nitrogen contents were determined
on the same CHN analyzer. Approximately 8–11mg ofuntreated bulk sediment was place in a tin capsule andanalyzed. Triplicate analyses performed on every tenthsample show the mean precision to be 70.06% totalcarbon and 70.02% total nitrogen.Twenty samples (5 each from marine isotope stages 1,
2, 5e, and 6) were analyzed for lignin phenol concentra-tions using the alkaline CuO oxidation technique ofGoni and Montgomery (2000). Briefly, alkaline CuOoxidations were carried with oxygen-purged 2N NaOHat 150�C for 1.5 h using a microwave digestion system.After the oxidation, recovery standards (ethyl vanillin,trans-cinnamic acid) were added and the solution wasacidified to pH 1 with concentrated HCl. Samples werethen extracted with ethyl acetate. Extracts were evapo-rated to dryness under a stream of N2. The CuOreaction products were re-dissolved in pyridine andderivatized with bis trimethylsilyl trifluoroacetamide(BSTFA)+1% trimethylchlorosilane (TMCS) to silylateexchangeable hydrogens prior to injection in the gaschromatograph. Gas chromatographic analyses weredone in order to quantify the following cupric oxidationproducts: lignin-derived vanillyl, syringyl, and cinnamylphenols. The identities of all CuO reaction productswere confirmed by gas chromatography-mass spectro-metric analyses. Two samples were analyzed in triplicateand the standard deviation was calculated on thesesamples to estimate the precision of the measurements.The average of the standard deviation of the twosamples is: vanillyl: 0.021; syringyl: 0.033; cinnamyl:0.0089; syringyl/vanillyl: 0.128; cinnamyl/vannillyl: 0.41;
[Ad/Al]v (vanillic acid/vanillin): 0.086; [Ad/Al]s (syringicacid/syringealdehyde): 0.127.
4.3. Age model and stratigraphy
The age model for core MD9821-62 is based on 10accelerator mass spectrometry (AMS) 14C dates and theSPECMAP stacked d18O chronology developed byMartinson et al. (1987). The AMS 14C dates weredetermined on monospecific samples (4–10mg) ofthe planktonic foraminifer Globigerinoides ruber at theCenter for Accelerator Mass Spectrometry, LawrenceLivermore National Laboratory. The youngest eight 14Cages were converted to calendar ages using the calibra-tion program CALIB 4.3 (Stuiver and Reimer, 1993;Stuiver et al., 1998) and the oldest two 14C ageswere converted using the equation, �698.65E-3+1.2695(14Cc)–2.7039E-6(14Cc)2 (r2 ¼ 0:999; standarderror =7150 years), where 14Cc is the reservoircorrected 14C age (Guilderson et al., 2000; Table 1). Inorder to account for the difference in 14C compositionbetween the atmosphere and the surface ocean, areservoir correction of 400 years was subtracted fromthe 14C dates before converting them to calendar years

ARTICLE IN PRESS
Table 2
Tie points for first 160 kyr of the MD9821-62 core, based on the
Martinson et al. (1987) time scale
Sample depth
(cm)
Martinson age
(yr)
Marine isotope
stage
Error (yr)
1850 58,960 4 5560
2140 73,910 5 2590
2320 79,250 5.1 3580
2880 99,380 5.3 3410
3060 115,910 Btwn 5.4 and
5.51
6280
3320 125,190 5.53 2920
3370 129,840 6 3050
3470 135,100 6.2 4240
3610 142,280 6.3 5280
3900 157,000 End
Fig. 2. The Globigerinoides ruber d18O record, total organic carbon contenchronology for the upper part is based on 10 AMS radiocarbon dates (Table
d18O record to the SPECMAP d18O chronology (Martinson et al., 1987, Ta
K. Visser et al. / Quaternary Science Reviews 23 (2004) 17–27 21
(Broecker and Peng, 1982; Bard, 1988; Southon et al.,2003). The 14C ages range from 750 years (core top) to33,910 years (1271m). For ages older than 34 ka, theMD9821-62 G. ruber d18O record was graphicallycorrelated to the SPECMAP stacked d18O chronology(Martinson et al., 1987) using 10 tie points (Table 2).The d18O stratigraphy for core MD9821-62 (Fig. 2)matches that of other highly resolved cores from aroundthe world, with marine isotope stages (MIS) 1–6 beingwell developed. The entire time scale was constructedassuming constant sedimentation rates between radio-carbon dates and isotope tie points. Based on this agemodel, the average sedimentation rate for the core isB25 cm/kyr and the average sample spacing for the last160 ka is B400 years.
t (%) and (C/N)a ratio for core MD9821-62 plotted versus time. The
1). Below 34,000 years BP, the age model is based on correlating this
ble 2).
ARTICLE IN PRESSK. Visser et al. / Quaternary Science Reviews 23 (2004) 17–2722
5. Results and discussion
5.1. Organic matter sources: marine and terrestrial
The record of total organic carbon in core MD9821-62 shows a distinctive glacial-interglacial pattern(Fig. 2). The lowest TOC values occur during inter-glacial stages 5e and 1, while the last two glacial episodes(stages 2 and 6) are marked by high TOC values. Inaddition, there is a long term increase in TOC fromstage 5e to stage 2 that mirrors the increase in d18Ovalues that occurs during this time interval (Fig. 2). Dueto the close proximity of the study site to Borneo andSulawesi, the organic matter preserved in core MD9821-62 should be a mixture of both marine and terrestrialcarbon. With the data presently available, we are unableto quantify the proportions derived from each of thesesources and this precludes us from using the TOC recordto assess changes in surface water productivity in thisregion through time.Several lines of evidence suggest that the close
correspondence between the d18O and the TOC recordsmay be driven, at least in part, by a sea level controlledinput of terrestrial carbon. The atomic ratio of organiccarbon to nitrogen (C/N)a is one of a number of ways todifferentiate qualitatively between terrestrial or marinesources of organic matter (Muller, 1977). Terrestrialorganic matter typically has a ratio of greater than 20,while marine organic matter normally ranges between 6and 9 (Hedges and Oades, 1997; Kawahata et al.,2000b). Sediments collected from shallow sediment trapsnorth of New Guinea (B4�N, 136�E) have (C/N)a ratiosof 8–8.5 signifying a marine source for this material andgiving us a baseline value for marine organic matter inthis region (Kawahata et al., 2000a). For our core, the(C/N)a values range from B7 to 13 (Fig. 2). During theHolocene (MIS 1) and last interglacial (stage 5), (C/N)aratios were lower than during the last glacial maximum(MIS 2) and the penultimate glacial period (MIS 6)-8.5and 9.5, and 11 and 11.2, respectively (Fig. 2). Thehigher (C/N)a values during glacial MIS 2–4 and 6(average of 11.1) relative to interglacial MIS 1 and 5e(average of 9.0) suggest a slight increase in the input ofterrigenous organic carbon to our study site associatedwith the glacial lowering of sea level.The concentrations of lignin phenols in sediments
were also used to determine the presence of terrestrialorganic matter in the core. Lignin is found in the cellwalls of vascular plants (most of which are terrestrial)and is highly resistant to degradation (Goni and Hedges,1992; Hedges, 1992). For this reason, the totalconcentration of lignin phenols (the sum of vanillyl,syringyl and cinnamyl phenols) is a useful tracer ofterrigenous organic matter in marine environments. Thetotal lignin phenol concentrations (in units of mg/100mg sediment) in MD9821-62 are higher during
glacial periods relative to interglacial periods, suggestinga greater flux of terrigenous organic matter to the corelocation during these cold periods (Fig. 3). DuringMIS 2, average lignin concentrations (0.01170.004) areapproximately double those of the Holocene (0.00670.001). The average lignin concentrations in MIS 6(0.00770.001), the other glacial period we investigated,are 40% greater than those in MIS 5e (0.00570.001).Notably, the carbon normalized concentrations of ligninphenols (mg/100mg OC) exhibited comparable valuesduring both glacial and interglacial intervals. These dataindicate that although the total flux of terrigenousorganic matter were higher during glacial conditions, therelative contributions of marine versus terrigenoussources to the total organic matter present in thesesediments did not differ significantly between climaticstages. Most likely, the enhanced inputs of marinecarbon during glacial periods relative to interglacialperiods contribute to these observations. In all like-lihood, the increased input of terrigenous carbon duringglacial stages at our study site in the Makassar Strait isdue to enhanced erosion of exposed continental shelvesduring these times of lowered sea level.
5.2. Vegetation changes
Instead of using pollen assemblage data, we examinechanges in terrestrial vegetation on Borneo during thelast two interglacial and glacial periods using theconcentrations of different lignin phenols. Specifically,the ratios of the vanillyl (V), syringyl (S), and cinnamyl(C) phenols (specifically, S/V and C/V) derived fromcupric oxidation (Hedges and Ertel, 1982) can be used todifferentiate between different sources of terrestrialorganic matter, namely angiosperms versus gymnos-perms, and between nonwoody (leaves, grasses, needles)and woody tissue (Goni and Hedges, 1992; Goni, 1997).For example, elevated S/V ratios (0.6–4) indicate thepresence of angiosperms, while low S/V ratios (B0)indicate gymnosperm inputs, as these plants do notproduce syringyl phenols (Goni, 1997). Nonwoody andwoody tissues can be differentiated using the C/V ratio,since only nonwoody tissues produce cinnamyl phenols;nonwoody tissue have values of 0.1–0.8 and woodytissue have values less than 0.05 (Goni, 1997).In our core, total lignin concentrations are low and
dominated by the vanillyl and syringyl phenols (cinna-myl phenols are less than or equal to 0.03mg/100mgOC). The ratio of the syringyl to vanillyl phenols(S/V) ranges from 0.52 to 0.89, with an average of 0.73(Fig. 3). The cinnamyl: vanillyl ratio (C/V) ranges from0.0 to 0.18, with an average of 0.09 (Fig. 3). Thestandard deviation of the C/V ratios is quite large due tothe low concentrations of the cinnamyl phenol in thesediments. Two of the samples analyzed have almost nocinnamyl phenols. Overall, these results show no

ARTICLE IN PRESS
Fig. 3. Total lignin concentrations normalized to both 100mg organic carbon and 100mg sediment, and the lignin phenol ratios: syringyl/vanillyl
(S/V) and cinnamyl/vanillyl (C/V) ratios across Termination I (stages 1 (shaded) and 2) and Termination II (stages 5e (shaded) and 6). The error bars
are based on replicate analyses of the same sample.
K. Visser et al. / Quaternary Science Reviews 23 (2004) 17–27 23
significant differences between the lignin phenol com-positions of interglacial and glacial age sediments. Sincethe S/V and C/V ratios are comparable across bothterminations I and II, which have an age difference ofB100,000 years, it is unlikely that post-depositionaldegradation can explain the results obtained. Instead,these data suggest that the sources and composition ofthe lignin preserved in these sediments have not changedsignificantly over the age the core. The higher (C/N)avalues during glacial MIS 2–4 and 6 (mean=11.1)relative to interglacial MIS 1 and 5e (mean=9.0) (Fig. 2)are consistent with a slightly higher contribution ofterrestrial organic matter to the cores site during glacial,low sea level periods.The CuO products can be used to characterize the
extent of degradation of the lignin macromoleculepresent in sediment samples. Specifically, the ratios ofvanillic acid over vanillin (Ad/Al)v and syringic acid
over syringealdehyde (Ad/Ad)s have been shown toincrease as a result of the oxidative attack of lignin byfungi (Hedges et al., 1988; Goni et al., 1993, 1998).(Ad/Al)v ratios between 0.1 and 0.3 are indicative offresh plant tissue, whereas (Ad/Al)v and (Ad/Al)s ratiosgreater than 0.6 indicate that the material is highlydegraded (Goni, 1997). Such high elevated ratios areoften observed in humic substances and mineral soilsthat contain highly altered lignin remains (Goni et al.,1998). The vanillic acid:vanillin ratio (Ad/Al)v in coreMD2198-62 ranged between 0.40 and 0.82 (average:0.58) and the syringic acid: syringealdehyde ratio(Ad/Ad)s ranged between 0.50 and 1.07 (average: 0.67;Fig. 4). Hence, it appears that the lignin in our core ismoderately to highly degraded. Because the (Ad/Al)ratios remain fairly constant down core (Fig. 4), thedegradation of the lignin polymer is likely to haveoccurred on land, rather than after it was deposited on

ARTICLE IN PRESS
Fig. 4. A plot of acid: aldehyde ratios of syringyl (Ad/Al)s and vanillyl (Ad/Al)v phenols across Termination I (stages 1 (shaded) and 2) and
Termination II (stages 5e (shaded) and 6). Also plotted are the ranges for fresh/undegraded woods and highly degraded woods (Goni, 1997; Goni
et al., 1998).
K. Visser et al. / Quaternary Science Reviews 23 (2004) 17–2724
the ocean floor (Goni, 1997; Hu et al., 1999; Kastnerand Goni, 2003).In terms of climate-induced vegetation change, it is
critical to interpret the lignin phenol compositionsdescribed above in the context of previous studies.Presently, Borneo and Sulawesi are almost completelyvegetated by tropical lowland and montane humidevergreen rainforest, consisting almost entirely ofangiosperm trees (MacKinnon et al., 1997; van derKaars et al., 2001). In fact, grass pollen contributes lessthan 3% of the pollen in Mahakam delta surfacesamples (Caratini and Tissot, 1988), highlighting thepaucity of savanna vegetation in this region undermodern conditions. Investigations of glacial vegetationsuggest the expansion of montane forest (composed ofthe angiosperms Lithocarpus and Castanopsis) to loweraltitudes during glacial periods as a result of coldertemperatures (Barmawidjaja et al., 1993; van der Kaarset al., 2000). Furthermore, several pollen studiesconcluded that grasslands flourished at the expense ofrainforest vegetation in Indonesian during glacialperiods due to increased aridity and colder temperatures(van der Kaars, 1991, 1998; Barmawidjaja et al., 1993;van der Kaars and Dam, 1995, 1997; Dam et al., 2001).A plot of C/V versus S/V ratios (Fig. 5) can be used to
illustrate the possible vegetation sources that mayaccount for the lignin compositions measured in theanalyzed sediments. The high S/V ratios (0.52–0.89)during MIS 1, 2, 5e and 6 indicate that angiospermvegetation dominated this region over the last two
glacial and interglacial periods (Fig. 3), just as it doestoday. The C/V ratios (0.0–0.18) indicate that a similarmixture of woody and nonwoody material was trans-ported to the core location during MIS 1, 2, 5e and 6.The overall similarities in lignin compositions betweeninterglacial-and glacial-age sediments are a strongindicator of the lack of major vegetation change in thearea. In particular, we observe no evidence for a largeexpansion of savannas during glacial periods. Tropicalsavannas are enriched in C4 grasses, which would haveresulted in elevated C/V ratios. Instead, our resultsstrongly indicate that angiosperm tree vegetation was apersistent feature of the land masses adjacent to the coresite during glacial and interglacial periods of the last160 ka (Fig. 5). Unfortunately, the lignin compositionsobtained in this study do not allow us to differentiate thetypes of angiosperm trees that were present and thusconfirm the proposed glacial expansion of montanevegetation.The paired lignin phenol data provide evidence of
continuous angiosperm vegetation deposition at the corelocation arguing against a major vegetation change fromtropical rainforest to grasslands during glacial periods inthe Indonesian region (van der Kaars, 1991, 1998;Barmawidjaja et al., 1993; van der Kaars and Dam,1995, 1997; Dam et al., 2001), agreeing with studiesshowing evidence of continuous rainforest vegetation intropical regions (Stuijts et al., 1988; Schlunz et al., 1999;Colinvaux and de Oliveira, 2000; Colinvaux et al., 2000;Sun et al., 2000; Baker et al., 2001a, b; Cowling et al.,

ARTICLE IN PRESS
Fig. 5. A plot of cinnamyl:vanillyl (C/V) versus syringyl:vanillyl (S/V) phenol ratios for glacial and interglacial sediments. Also plotted are the values
of fresh angiosperm and gymnosperm woods and leaves/grasses (Goni, 1997; Goni et al., 1998).
K. Visser et al. / Quaternary Science Reviews 23 (2004) 17–27 25
2001; Taylor et al., 2001; Bush et al., 2002). The lack ofdrastic vegetation change evident from our results isconsistent with an increase in the intensity of the wintermonsoon during glacial periods, which would maintainhumid conditions in the area while still allowingtemperatures to decrease (Wang et al., 1999; Sun et al.,2000). Additional support for our explanation isprovided by a simulation of climate conditions duringthe last glacial maximum derived using a coupledatmosphere–ocean general circulation model, that pre-dicts an increase in rainfall in the Indonesian region atthis time (Bush and Philander, 1999).
6. Conclusions
1. The organic matter deposited at our core locationcontains a mixture of marine and terrestrial carbon.While the pronounced glacial–interglacial pattern intotal organic carbon content invariably contains
some surface water productivity signal, we concludethat the higher TOC values during the glacialepisodes is due to enhanced erosion of exposedcontinental shelves bordering the Makassar Strait.
2. There is no distinguishable difference in lignin phenolratios of glacial and interglacial samples and thus weconclude that the modern day/interglacial angios-perm rainforest vegetation on the islands of Borneoand Sulawesi persisted during the last two glacialperiods. This supports the idea that the wintermonsoon strength increased during glacial periods,allowing the area to maintain humid conditionsduring this time.
Acknowledgements
We would like to thank Heather Aceves for conduct-ing the lignin analyses, Eric Tappa for technicalassistance, and Mary Cathey and Stacey Russo for

ARTICLE IN PRESSK. Visser et al. / Quaternary Science Reviews 23 (2004) 17–2726
laboratory assistance. We thank the French PolarInstitute and the IMAGES Program for organizingand coordinating the 1998 cruise of the RV Marion
Dufresne to the Indonesian region. Oregon StateUniversity’s core facility is acknowledged for housingcore MD9821-62 (NSF grant: OCE97-12024). This workwas funded by NSF grant OCE-0094771 to R.Thunell.
References
Baker, P., Grove, M., Cross, S., Seltzer, G., Fritz, S., Dunbar, R.,
2001a. The history of South American tropical precipitation for the
past 25,000 years. Science 291, 640–643.
Baker, P., Rigsby, C., Seltzer, G., Fritz, S., Lowenstein, T., Bacher, N.,
Veliz, C., 2001b. Tropical climate changes at millennial and orbital
time-scales on the Bolivian Altiplano. Nature 409, 698–701.
Bard, E., 1988. Correction of accelerator mass spectrometry 14C ages
measured in planktonic foraminifer: paleoceanographic implica-
tions. Paleoceanography 3, 635–645.
Barmawidjaja, B., Rohling, E., van der Kaars, W., Vergnaud-Grazzini,
C., Zachariasse, W., 1993. Glacial conditions in the northern
Molucca Sea region (Indonesia). Palaeogeography, Palaeoclima-
tology, Palaeoecology 101, 147–167.
Behling, H., 2002. South and Southeast Brazilian grasslands during the
Late Quaternary times; a synthesis. Palaeogeography, Palaeocli-
matology, Palaeoecology 177, 19–27.
Broecker, W.S., Peng, T.H., 1982. Tracers in the Sea. Eldigio Press,
New York.
Bush, M., 2002. On the interpretation of fossil Poaceae pollen in the
lowland humid neotropics. Palaeogeography, Palaeoclimatology,
Palaeoecology 177, 5–17.
Bush, A., Philander, A.G., 1999. The climate of the last glacial
maximum: results from a coupled atmosphere–ocean general
circulation model. Journal of Geophysical Research 104,
24509–24525.
Bush, M., Miller, M., De Oliveira, P., Colinvaux, P., 2002. Orbital
forcing signal in sediments of two Amazonian lakes. Journal of
Paleolimnology 27, 341–352.
Cane, M., 1998. A role for the tropical Pacific. Science 282, 59–61.
Cane, M., Clement, A., 1999. A role for the Tropical Pacific coupled
ocean-atmosphere system on Milankovitch and millennial time-
scales, Part II: global impacts. In: Clark, P.U., Webb, R.S.,
Keigwin, L.D. (Eds.), Mechanisms of Global Climate Change at
Millennial Time Scales. American Geophysical Union, Washing-
ton, DC, pp. 373–383.
Caratini, C., Tissot, C., 1988. Paleogeographical evolution of the
Mahakam Delta in Kalimantan, Indonesia during the Quaternary
and Late Pliocene. Review of Palaeobotany and Palynology 55,
217–228.
CLIMAP Project members, 1981. Seasonal Reconstructions of the
Earth’s Surface at the Last Glacial Maximum. The Geological
Society of America, Map and Chart Series MC-36, I-18.
Colinvaux, P.A., De Oliveira, P.E., 2000. Palaeoecology and climate of
the Amazon basin during the last glacial cycle. Journal of
Quaternary Science 15, 347–356.
Colinvaux, P.A., De Oliveira, P.E., Bush, M.B., 2000. Amazonian and
neotropical plant communities on glacial time-scales: the failure of
the aridity and refuge hypotheses. Quaternary Science Reviews 19,
141–169.
Cowling, S., Maslin, M., Sykes, M., 2001. Paleovegetation Simulations
of Lowland Amazonia and Implications for Neotropical Allopatry
and Speciation. Quaternary Research 55, 140–149.
Dam, R., Fluin, J., Suparan, P., van der Kaars, S., 2001.
Palaeoenvironmental developments in the Lake Tondano area
(N. Sulawesi, Indonesia) since 33,000 yr BP. Palaeogeography,
Palaeoclimatology, Palaeoecology 171, 147–183.
Gasse, F., 2000. Hydrological changes in the African tropics since the
Last Glacial Maximum. Quaternary Science Reviews 19, 189–211.
Goni, M., 1997. Record of terrestrial organic matter composition in
Amazon Fan sediments. Proceedings of the Ocean Drilling
Program. Scientific Results 155, 519–530.
Goni, M., Hedges, J., 1992. Lignin dimers: structures, distribution and
potential geochemical applications. Geochimica et Cosmochimica
Acta 56, 4025–4043.
Goni, M., Montgomery, S., 2000. Alkaline CuO oxidation with a
microwave digestion system: a novel, rapid approach for lignin
analyses of geochemical samples. Analytical Chemistry 72,
3116–3121.
Goni, M., Nelson, B., Blanchette, R., Hedges, J., 1993. Fungal
degradation of wood lignins: geochemical perspectives from CuO-
derived phenolic dimers and monomers. Geochimica et Cosmochi-
mica Acta 57, 3985–4002.
Goni, M., Ruttenberg, K., Eglinton, T., 1998. A reassessment of the
sources and importance of land-derived organic matter in surface
sediments from the Gulf of Mexico. Geochimica et Cosmochimica
Acta 62, 3055–3075.
Guilderson, T., Fairbanks, R., Rubenstone, J., 1994. Tropical
temperature variations since 20,000 years ago: modulating inter-
hemispheric climate change. Science 263, 663–665.
Guilderson, T., Burckle, L., Hemming, S., Peltier, W., 2000. Late
Pleistocene sea level variations derived from the Argentine Shelf.
Geochemistry, Geophysics, Geosystems 1, paper number
2000GC000098.
Guilderson, T., Fairbanks, R., Rubenstone, J., 2001. Tropical Atlantic
coral oxygen isotopes; glacial-interglacial sea surface temperatures
and climate change. Marine Geology 172, 75–89.
Hedges, J., 1992. Global biogeochemical cycles; progress and
problems. Marine Chemistry 39, 67–93.
Hedges, J., Ertel, J., 1982. Characterization of lignin by gas capillary
chromatography of cupric oxide oxidation products. Analytical
Chemistry 54, 174–178.
Hedges, J., Oades, J., 1997. Comparative organic geochemistries of
soils and marine sediments. Organic Geochemistry 27, 319–361.
Hedges, J., Blanchette, R., Weliky, K., Devol, A., 1988. Effects of
fungal degradation on the CuO oxidation products of lignin; a
controlled laboratory study. Geochimica et Cosmochimica Acta
52, 2717–2726.
Hodell, D., Brenner, M., Kanfoush, S., Curtis, J., Stoner, J., Xueliang,
S., Yuan, W., Whitmore, T., 1999. Paleoclimate of Southwestern
China for the past 50,000 yr inferred from lake sediment records.
Quaternary Research 52, 369–380.
Hope, G., 2001. Environmental change in the Late Pleistocene and
later Holocene at Wanda site, Soroako, South Sulawesi, Indonesia.
Palaeogeography, Palaeoclimatology, Palaeoecology 171,
129–145.
Hu, F., Hedges, J., Gordon, E., Brubaker, L., 1999. Lignin biomarkers
and pollen in postglacial sediments of an Alaskan Lake.
Geochimica et Cosmochimica Acta 63, 1421–1430.
Huang, C-Y., Wu, S., Zhao, M., Chen, M., Want, C., Tu, X., Yuan,
P., 1997a. Surface ocean and monsoon climate variability in the
South China Sea since the last glaciation. Marine Micropaleontol-
ogy 32, 71–94.
Huang, C-Y., Liew, P-M., Zhao, M., Chang, T-C., Kuo, C-M., Chen,
M-T., Wang, C-H., Zheng, L-F., 1997b. Deep sea and lake records
of the Southeast Asian paleomonsoons for the last 25 thousand
years. Earth and Planetary Science Letters 146, 59–72.
Kastner, T., Goni, M., 2003. Constancy in the vegetation of the
Amazon Basin during the Late Pleistocene: evidence from the
organic matter composition of Amazon Deep Sea Fan sediments.
Geology 31, 291–294.
ARTICLE IN PRESSK. Visser et al. / Quaternary Science Reviews 23 (2004) 17–27 27
Kawahata, H., Suzuki, A., Ohta, H., 2000a. Export fluxes in
the Western Pacific Warm Pool. Deep-Sea Research 47,
2061–2091.
Kawahata, H., Okamoto, T., Matsumoto, E., Ujiie, H., 2000b.
Fluctuations of eolian flux and ocean productivity in the mid-
latitude North Pacific during the last 200 kyr. Quaternary Science
Reviews 19, 1279–1291.
Kienast, M., Steinke, S., Stattegger, K., Calvert, S., 2001. Synchronous
tropical South China Sea SST change and Greenland warming
during deglaciation. Science 291, 2132–2134.
Lea, D., Pak, D., Spero, H., 2000. Climate Impact of Late Quaternary
Equatorial Pacific Sea Surface Temperature Variations. Science
289, 1719–1924.
MacKinnon, K. (Ed.), 1997. The Ecology of Kalimantan (Indonesian
Borneo). Periplus Editions, Singapore.
Martinson, D., Pisias, N., Hays, J., Imbrie, I., Moore, T., Shackleton,
N., 1987. Age dating and the orbital theory of the ice-ages:
development of a high-resolution 0–300,000 year chronostratigra-
phy. Quaternary Research 27, 1–29.
Mix, A., Morey, A., Pisias, N., Hostetler, S., 1999. Foraminiferal
faunal estimates of paleotemperature: circumventing the no-
analog problem yields cool ice age tropics. Paleoceanography 14,
350–359.
Moss, P., Kershaw, A., 2000. The last glacial cycle from the humid
tropics of northeastern Australia: comparison of a terrestrial and a
marine record. Palaeogeography, Palaeoclimatology, Palaeoecol-
ogy 155, 155–176.
Muller, P., 1977. C/N ratios in Pacific deep-sea sediments:
effect of inorganic ammonium and organic nitrogen compounds
sorbed by clays. Geochimica et Cosmochimica Acta 41,
765–776.
N .urnberg, D., M .uller, A., Schneider, R., 2000. Paleo-sea surface
temperature calculations in the equatorial east Atlantic from Mg/
Ca ratios in planktic foraminifera: a comparison to sea surface
temperature estimates from Uk0
37, oxygen isotopes, and foraminif-
eral transfer functions. Paleoceanography 15, 124–134.
Patrick, A., Thunell, R., 1997. Tropical Pacific sea surface tempera-
tures and upper water column thermal structure during the Last
Glacial Maximum. Paleoceanography 12, 649–657.
Pelejero, C., Kienast, M., Wang, L., Grimalt, J., 1999. The flooding of
Sundaland during the last deglaciation; imprints in hemipelagic
sediments from the southern South China Sea. Earth and Planetary
Science Letters 171, 661–671.
Pierrehumbert, R., 2000. Climate change and the tropical Pacific: the
sleeping dragon wakes. Proceedings of the National Academy of
Sciences 97, 1355–1358.
Roberts, H., Phipps, C., 1988. Proposed oceanographic controls on
modern Indonesian Reefs: a turn-off/turn-on mechanism in a
monsoonal setting. Proceedings of the Sixth International Coral
Reef Symposium, Vol. 3, pp. 529–534.
Roberts, H., Aharon, P., Phipps, C., 1988. Morphology and
sedimentology of Halimeda bioherms from the eastern Java Sea
(Indonesia). Coral Reefs 6, 161–172.
Schlunz, B., Schneider, R., Muller, P., Showers, W., Wefer, G., 1999.
Terrestrial organic carbon accumulation on the Amazon deep sea
fan during the last glacial sea level low stand. Chemical Geology
159, 263–281.
Soegiarto, A., 1992. The role of the Southeast Asian Seas in regional
and global climate change. Global Change 22, 32–37.
Southon, J., Kashgarian, M., Fontugne, M., Metivier, B., Yim, W.,
2003. Marine reservoir corrections for the Indian Ocean and
Southeast Asia. Radiocarbon 44, 167–180.
Stott, L., Poulsen, C., Lund, S., Thunell, R., 2002. Super ENSO
and global climate oscillations at millenial time scales. Science 297,
222–226.
Stuijts, I., 1984. Palynological study of Situ Bayongbong, West Java.
Modern Quaternary Research Southeast Asia 30, 297–312.
Stuijts, I., Newsome, J., Flenley, J., 1988. Evidence for Late
Quaternary vegetational change in the Sumatran and Javan
highlands. Review of Palaeobotany and Palynology 55, 207–216.
Stuiver, M., Reimer, P., 1993. Extended 14C database and revised
CALIB radiocarbon calibration program. Radiocarbon 35,
215–230.
Stuiver, M., Reimer, P., Bard, E., Beck, J., Burr, G., Hughen, K.,
Kromer, B., McCormac, F., v.d. Plicht, J., Spurk, M., 1998.
INTCAL98 Radiocarbon age calibration 24,000–0 cal BP. Radio-
carbon 40, 1041–1083.
Sun, X., Li, X., Luo, Y., Chen, X., 2000. The vegetation and climate at
the last glaciation on the emerged continental shelf of the South
China Sea. Palaeogeography, Palaeoclimatology, Palaeoecology
160, 301–316.
Taylor, D., Yen, O.H., Sanderson, P.G., Dodson, J., 2001. Late
Quaternary peat formation and vegetation dynamics in a lowland
tropical swamp: Nee Soon, Singapore. Palaeogeography, Palaeo-
climatology, Palaeoecology 171, 269–287.
Thompson, L., Mosley-Thompson, E., Davis, M., Lin, P., Henderson,
K., Cole-Dai, J., Bolzan, J., Liu, K., 1995. Late glacial stage and
Holocene tropical ice core records from Huascaran, Peru. Science
269, 46–50.
Thompson, L., Davis, M., Mosley-Thompson, E., Sowers, T., Hender-
son, K., Zagorodnov, V., Lin, P., Mikhalenko, V., Campen, R.,
Bolzan, J., Cole-Dai, J., Francou, B., 1998. A 25,000-year Tropical
Climate History from Bolivian Ice Cores. Science 282, 1858–1864.
van der Kaars, W., 1991. Palynology of eastern Indonesian piston
cores: a Late Quaternary vegetational and climatic record for
Australasia. Palaeogeography, Palaeoclimatology, Palaeoecology
85, 239–302.
van der Kaars, S., 1998. Marine and terrestrial pollen records of the
last glacial cycle from the Indonesia region: Bandung basin and
Banda Sea. Paleoclimates: Data Modeling 3, 209–219.
van der Kaars, W., Dam, M., 1995. A 135,000 year record of
vegetational and climatic change from the Nadung area, West-
Java, Indonesia. Palaeogeography, Palaeoclimatology, Palaeoecol-
ogy 117, 55–72.
van der Kaars, W., Dam, R., 1997. Vegetation and climate change in
West-Java, Indonesia during the last 135,000 years. Quaternary
International 37, 67–71.
van der Kaars, S., Wang, X., Kershaw, A.P., Guichard, F., Setiabudi,
D.A., 2000. A Late Quaternary palaeoecological record from the
Banda Sea, Indonesia: patterns of vegetation, climate and biomass
burning in Indonesia and northern Australia. Palaeogeography,
Palaeoclimatology, Palaeoecology 155, 135–153.
van der Kaars, W., Penny, D., Tibby, J., Fluin, J., Dam, R., Suparan,
P., 2001. Late Quaternary palaeoecology, palynology and palaeo-
limnology of a tropical lowland swamp: Rawa Danau, West-Java,
Indonesia. Palaeogeography, Palaeoclimatology, Palaeoecology
171, 185–212.
Visser, K., Thunell, R., Stott, L., 2003. Magnitude and timing of
temperature change in the Indo-Pacific warm pool during
deglaciation. Nature 421, 152–155.
Wang, L., Wang, P., 1990. Late Quaternary paleoceanography of the
South China Sea: glacial-interglacial contrast in an enclosed basin.
Paleoceanography 5, 77–90.
Wang, L., Sarnthein, M., Grootes, P., Erlenkeuse, H., 1999. Millennial
reoccurrence of century-scale abrupt events of East Asian
monsoon: a possible heat conveyor for the global deglaciation.
Paleoceanography 14, 725–731.
Webster, P., Streten, N., 1978. Late Quaternary ice age climate of
tropical Australia: interpretations and reconstructions. Quaternary
Research 10, 279–309.
Related Documents