1 GIST Overview

GIST Overview
Dec 30, 2015
GIST Overview. GIST: Definition. Mesenchymal (connective tissue) neoplasms Located primarily in the GI tract, omentum, and mesentery 0.2% of all GI tumors 80% of GI sarcomas Usually stain positive for KIT. GI, gastrointestinal; HU, Hounsfield units. - PowerPoint PPT Presentation
Welcome message from author
This document is posted to help you gain knowledge. Please leave a comment to let me know what you think about it! Share it to your friends and learn new things together.
Transcript

1
GIST Overview

2
GIST: Definition
Mesenchymal (connective tissue) neoplasms
Located primarily in the GI tract, omentum, and mesentery
0.2% of all GI tumors
80% of GI sarcomas
Usually stain positive for KIT
GI, gastrointestinal; HU, Hounsfield units.
Images adapted with permission from Choi H et al. Am J Roentgenol. 2004;183:1619-1628.
Miettinen M et al. Arch Pathol Lab Med. 2006;130:1466-1478.

3
GIST: Incidence
1. Miettinen M et al. Virchows Arch. 2001;438:1-12. 2. Fletcher CDM et al. Hum Pathol. 2002;33:459-465. 3. Goettsch WG et al. Eur J Cancer. 2005;41:2868-2872. 4. Nilsson B et al. Cancer. 2005;103:821-829.
An estimated 10 to 20 cases of GIST per million persons are diagnosed in the United States each year1
– 5000 to 6000 cases per year are diagnosed in the United States2
Incidence in Europe3-7 is estimated between 6.6 and 14.5 cases per million
Highest incidence among group aged 50 to 65 years1
– Similar male/female incidence, although some reports suggest higher incidence in men
Prevalence in Sweden: 129 cases per million4
5. Tryggvason G et al. Int J Cancer. 2005;117:289-293. 6. Rubio J et al. Eur J Cancer. 2007;43:144-148. 7. Mucciarini C et al. BMC Cancer. 2007;7:230.

4
GIST: Clinical Presentation
Most patients present with nausea, vomiting, pain, weight loss, palpable tumor masses, and bleeding leading to anemia2
Average duration of presenting symptoms is 4 to 6 months2
1. Miettinen M et al. Hum Pathol. 1999;30:1213-1220.2. Ghanem N et al. Eur Radiol. 2003;13:1669-1678.
Symptoms of GIST at Diagnosis1
Symptom Occurrence Rate
Abdominal pain 50%-70%
GI bleeding 50%

5
Circumstances of GIST Detection
Incidental
Symptomatic
Autopsy
69%21%
10%
1. Kindblom LG. http://www.asco.org/portal/site/ASCO/menuitem.d3934b88626d03a781d54d10ee37a01d/?vgnextoid=8a7ca1f903878010VgnVCM100000f2730ad1RCRD&spk=Kindblom%2C+Lars-Gunnar+%5Bfau%5D.
2. Miettinen M et al. Hum Pathol. 1999;30:1213-1220.
Approximately one-third of GISTs are asymptomatic1,2

6
Common Tumor Sites
1. Corless CL et al. Annu Rev Pathol. 2008;3:557-586.
Colon, rectum, esophagus, mesentery, omentum
60%
15%
25%Small intestine
Stomach
GIST may arise anywhere along the GI tract or elsewhere in the abdomen or retroperitoneum1

7
KIT and PDGFR Receptor Structures
Type 3 receptor tyrosine kinases
Extracellular domain binds ligand
– SCF for KIT
– PDGF for PDGFR Downstream effects of ligand
binding to KIT or PDGR are proliferative and antiapoptotic
Intracellular domain has– 2 tyrosine kinase domains
– Multiple autophosphorylation sites
− SCF or PDGF binding site
− 5 IgG domains
Cell membrane
Tyrosine kinasedomains
SCF, stem cell factor; PDGF, platelet-derived growth factor; IgG, immunoglobulin G.1. Taylor ML et al. Hematol Oncol Clin North Am. 2000;14:517-535.2. Corless CLet al. Annu Rev Pathol. 2008;3:557-586.

Normal KIT Signaling
PP P
ADP P
P
PP P
ATP
SIGNALING
Kinasedomains
Substrate
Effector
ADP, adenosine diphosphate.
1. Savage DG et al. N Engl J Med. 2002;346:683-693.2. Scheijen B et al. Oncogene. 2002;21:3314-3333.
Activation of the substrate initiates a signaling cascade,
culminating in cell proliferation and survival1,2
A substrate protein (eg, PI3 kinase) is phosphorylated by KIT kinase1,2

9
Normal Biologic Function of KIT Receptor Tyrosine Kinase
1. Taylor ML et al. Hematol Oncol Clin North Am. 2000;14:517-535. 2. Beghini A et al. Cancer. 2001;92:657-662.
KIT plays an essential role1,2 in
Activation of KIT is critical in cell functions, including1
Hematopoiesis Proliferation
Skin pigment Differentiation
Fertility Apoptosis/survival
Gut motility (pacemaker cells)
Adhesion/chemotaxis

10
KIT Mutations
Up to 95% GISTs stained positive for KIT1
– A subset (2% to 5%) of GIST stain negative for KIT expression2
Mutant forms of KIT are constitutively active3
Knock-in mice studies with KIT mutations showed4
– Constitutive KIT signaling is sufficient to induce GIST
– Parallel pathology is seen with familial KIT mutations (eg, mastocytosis)
Microscopic GISTs are thought to be common in the general population5-7
– Some micro-GISTs harbor mutations in KIT or PDGFRA genes
– Genetic events that transform these micro-GISTs into clinically important disease are not well understood
1. Corless CL et al. Annu Rev Pathol. 2008;3:557-586.2. Heinrich CM et al. J Clin Oncol. In press.3. Hirota S et al. Science. 1998;279:577-580.4. Sommer G et al. Proc Natl Acad Sci U S A. 2003;100:6706-6711.
5. Agaimy A et al. Am J Surg Pathol. 2007;31:113-120.6. Kawanowa K et al. Hum Pathol. 2006;37:1527-1535.7. Abraham SC et al. Am J Surg Pathol. 2007;31:1629-
1635.

11
Histopathology
1. Fletcher CD et al. Hum Pathol. 2002;33:459-456.2.Corless CL et al. Annu Rev Pathol. 2008;3:557-586.
GISTs range in size from 1 to 40 cm (average ~5 cm)2
GIST can be classified into 3 broad categories1
– Spindle-cell type (70%)– Epithelioid-cell type (20%)– Mixed spindle-cell and epithelioid-cell type (nested morphology) (10%)
Spindle cell Epithelioid cell Mixed morphology1

12
Imatinib Treatment for Unresectable or Metastatic GIST

13
Algorithm: Imatinib Treatment in Unresectable or Metastatic GIST1,2
OR, overall response; RFA, radiofrequency ablation; SD, stable disease.
1. Reichardt P. EJC Suppl. 2006;4(suppl 1):19-26.2. NCCN. Clinical practice guidelines. Soft tissue sarcoma. V.2.2008. www.nccn.org.3. Demetri GD et al. J Natl Compr Canc Netw. 2007;5(suppl 2):S1-S29.
Progression
Progression
MetastaticKIT exon 9+
Imatinib 800 mg/d
Dose-escalateImatinib 800 mg/d
Metastatic
Imatinib 400 mg/d
Unresectable
Imatinib 400 mg/d
OR or SD
Secondary surgery
Continue imatinib
OR or SD
Continue imatinib
OR or SD
Continue imatinib
• Continue imatinib at same dose or • Increase imatinib dose as tolerated or • Switch to alternate TKI• Consider surgery, RFA
• Increase imatinib dose as tolerated or • Change to sunitinib• Consider clinical trial (eg, nilotinib)
Limited/Local Generalized/ Systemic

14
Imatinib in GIST: Rationale
1. Manley PW et al. Eur J Cancer. 2002;38(suppl 5):S19-S27.2. Heinrich MC et al. Hum Pathol. 2002;33:484-495.
As a specific inhibitor of tyrosine kinase activity, imatinib blocks kinase-mediated downstream signaling1
Mutations ~90% of GIST harbor mutations in KIT or PDGFRA genes2
Mutations occur early in the development of GIST1,2
– Incidental tumors 1 cm have KIT mutations
– Germ-line KIT mutations are associated with multiple GISTs
– Cytogenetic changes in GIST are preceded by KIT mutations
Hypothesis Use of imatinib to selectively inhibit KIT and PDGFRA receptor
tyrosine kinases will be effective in the treatment of GIST1
15
Inhibition of KIT Signaling by Imatinib
P
PP P
ATP
SIGNALING
Imatinib mesylate
Kinasedomains
1. Savage DG et al. N Engl J Med. 2002;346:683-693.2. Scheijen B et al. Oncogene. 2002;21:3314-3333.
The ATP binding pocket of the KIT kinase domain is occupied by imatinib1
Substrate phosphorylation is prevented and signaling is inhibited1
With signaling inhibited, proliferation and survival are interrupted1,2

16
Pivotal Phase 2 Trial: Design
PD
Continue to treat as long as patient benefits and
drug-related safety concerns are absent
Imatinib(400 mg/d)
Imatinib(600 mg/d)
CT, computed tomography; MRI, magnetic resonance imaging.
Demetri GD et al. N Engl J Med. 2002;347:472-480.
Metastatic or unresectable
GIST (N = 147)
Imaging was performed with CT scanning or MRI PET imaging was performed at the discretion of the investigator

17
03
6965
1418
0
10
20
30
40
50
60
70
Pat
ien
ts,
%
Pivotal Phase 2 Trial: Best Observed Rates of Response to Imatinib
CR, complete response.
Blanke CD et al. J Clin Oncol. 2008;26:620-625.
Tumor Control
63 Months’ Median Follow-up2
400 mg/d (n = 73)
600 mg/d (n = 74)
PR SD CR PR SDCR
Based on Slide 53 from IM TX deck

18
Pivotal Phase 2 Trial: Kaplan-Meier Estimate of OS Since Start of Study by Best Response
CI, confidence interval; LL, lower limit; N/A, not available; UL, upper limit.
Adapted with permission of Blanke CD et al. J Clin Oncol. 2008;26:620-625.
B2222 Study (63 Months’ Median Follow-up)
19
Pivotal Phase 2 Trial: Summary
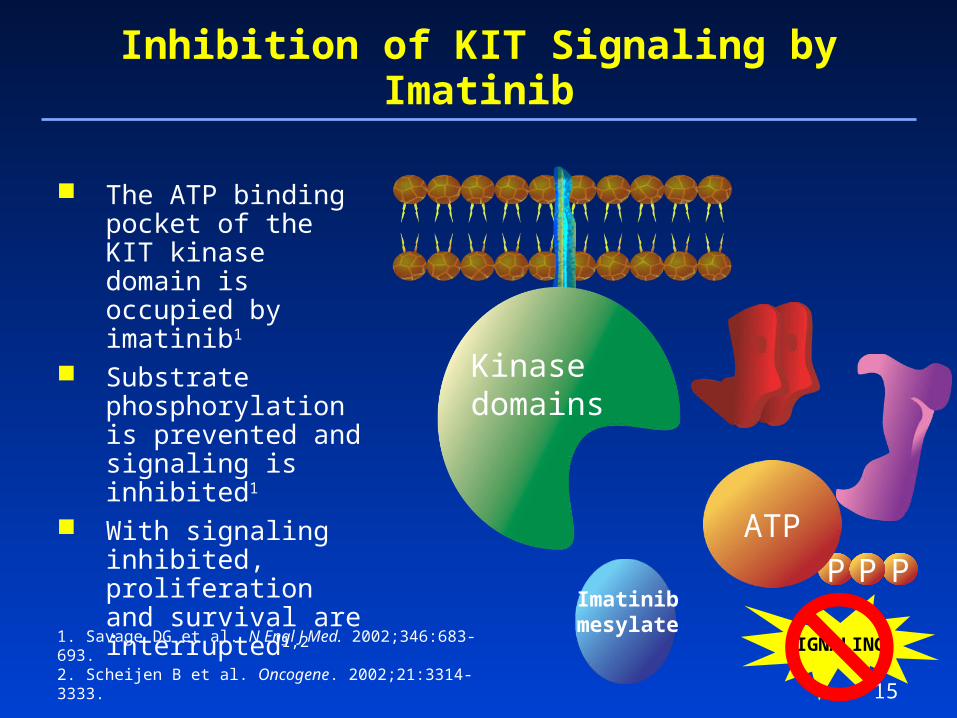
147 patients randomized to 400 or 600 mg/d1
At 5-year follow-up, 84% of patients showed clinical benefit2
– 68% PR or CR
– 16% SD
Median TTP was 2 years2
The median OS was 4.8 years (57 months)– Similar OS in patients with PR and SD suggests similar clinical benefit
across SWOG categories
Although low tumor bulk predicted improved OS, a substantial proportion of patients with highest tumor bulk remained alive at 64 months of follow-up3
Maintenance of imatinib plasma trough levels (Cmin) above 1110 ng/ mL is associated with best rates of clinical benefit and longest TTP4
SWOG, Southwest Oncology Group; TTP, time to progression.
1. Demetri GD et al. N Engl J Med. 2002;347:472-480.2. Blanke CD et al. J Clin Oncol. 2008;26:620-625.
3. Blanke C et al. ASCO Gastrointestinal Cancers Symposium; 2007. Abstract 21.
4. Demetri GD et al. ASCO Gastrointestinal Cancers Symposium; 2008. Abstract 3.

20
Phase 3 Trials: Design
Followfor
PFS
Imatinib(400 mg/d)
Imatinib(800 mg/d)
PD
1. Verweij J et al. Lancet. 2004;364:1127-1134.2. Blanke CD et al. J Clin Oncol. 2008;26:626-632.
Metastatic or unresectable
GIST
EORTC/ISG/AGITG Study 620051
North American Intergroup Study S00332
21
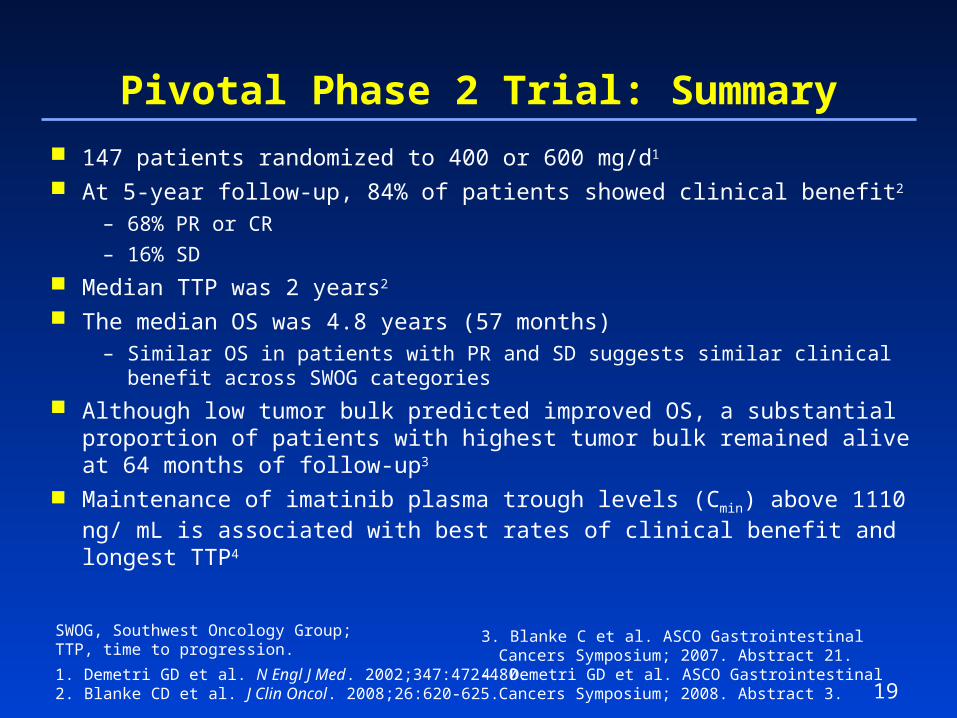
EORTC 62005 Studies and Intergroup S0033: PFS (Primary End Point)
1. Verweij J et al. Lancet. 2004;364:1127-1134. 2. Blanke CD et al. J Clin Oncol. 2008;26:626-632.
EORTC 62005 Study1
(N = 946)North American Intergroup
S0033 Study2 (N = 694)
Adapted with permission from Verweij J et al. Lancet. 2004;364:1127-1134.
Adapted with permission from Blanke CD et al. J Clin Oncol. 2008;26:626-632.

22
MetaGIST: Overall PFS Advantage Among Patients Treated With Imatinib 800 mg/d in Phase 3 Trials
Median PFS, years3 Years Estimated
(Kaplan-Meier)
400 mg/d 800 mg/d 400 mg/d 800 mg/d HR P value
PFS
All patients (N = 1640) 1.58 1.95 30% 34% 0.89 0.041
EORTC (N = 946) 1.74 2.02 31% 35% 0.89 0.12
SWOG 0033 (N = 649)
1.46 1.64 29% 33% 0.89 0.18
OS (N = 1640) 4.08 4.05 60% 61% 1.00 0.97
PFS According to KIT Exon 9 Mutation Status
400 mg/d 800 mg/d 400 mg/d 800 mg/d HR P value
All patients (N = 91) 0.5 1.59 5% 17% 0.58 0.017
EORTC (N = 59) 0.35 1.62 0% 25% 0.43 0.0023
SWOG 0033 (N = 32) 0.78 1.4 14% 6% 0.99 0.97
Adapted with permission from Van Glabbeke MM et al. J Clin Oncol. 2007;25(18S):546s. Abstract 10004.
45-Month Follow-up

23
Monitoring GIST and Assessing Response to Treatment

24
CT Imaging of Advanced Disease
Hepatic metastasis ( )
Hyperdense or rim-enhancing lesions
Hepatic metastasis and peritoneal implants ( )Hyperdense masses filled with enhancing tumor nodules or nodules at the periphery
Notice small tumor vessels ( )
Peritoneal implants and a subcutaneous mass ( )
Multiple hyperdense enhancing masses
Images courtesy of H. Choi.

25
18FDG-PET Imaging
Images courtesy A.D. Van den Abbeele.
Large hepatic metastasis Hepatic, abdominal, and pelvic metastases

26
Limitations of Conventional Response (RECIST/SWOG) Evaluation in GIST
Tumor shrinkage may evolve slowly
Focal progressive lesions may develop, even with decrease in tumor bulk1
Fluid expansion in responding necrotic GIST may result in increase in tumor size1
Criteria do not capture change in tumor density1
Criteria underestimate overall clinical benefit by not including stable disease in the evaluation1,2
– Survival of patients with stable disease similar to that of patients with objective response (Study B2222)3
1. Choi H. Curr Oncol Rep. 2005;7:307-311. 2. LeCesne A et al. J Clin Oncol. 2006;24(suppl):522s. Abstract 9510.3. Blanke CD et al. J Clin Oncol. 2008;26:620-625.

27
RECIST Did Not Predict Outcome in a Phase 3 Imatinib Trial (62005)
2 Months(n = 852)
4 Months(n = 681)
6 Months(n = 642)
Category TTP (y)
3-Year OS (%)
TTP (y)
3-Year OS (%)
TTP (y)
3-Year OS (%)
CR/MR/PRresponders
2.43 69.7 2.52 71.8 2.54 71
NC+/NC– 1.73 53.6 1.8 56.3 2.04 70.9
PDnonresponders
0.15 13.6 0.31 25.6 0.48 19.7
TTP, time to tumor progression; CR, complete response; MR, major response; NC, no change; OS, overall survival; y, years.
LeCesne A et al. J Clin Oncol. 2006;24(suppl):522s. Abstract 9510.
N = 906.
28
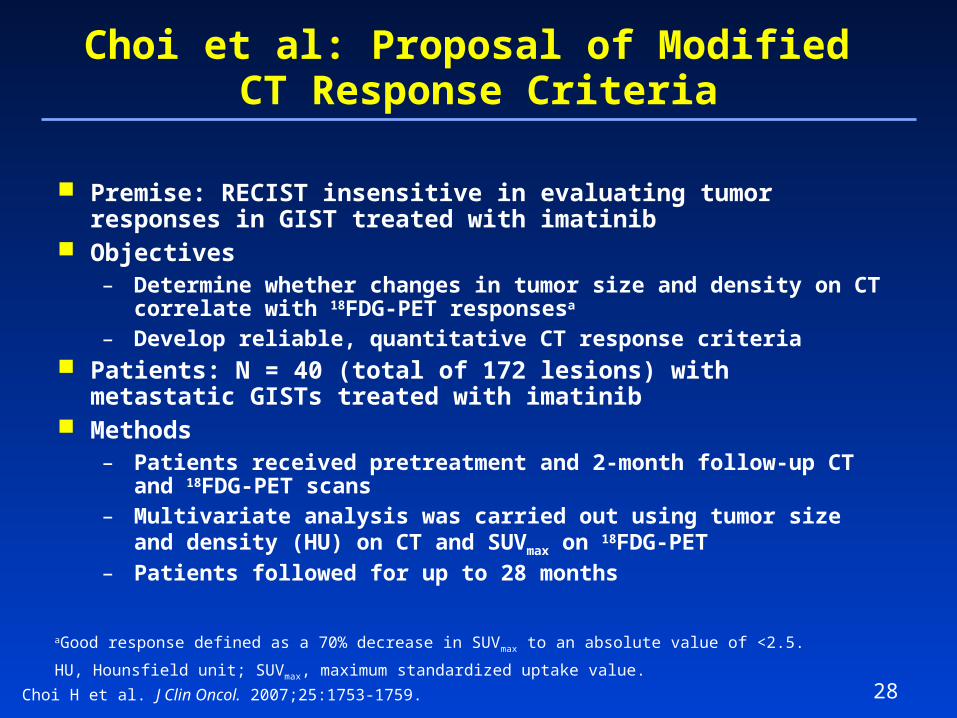
Choi et al: Proposal of Modified CT Response Criteria
Choi H et al. J Clin Oncol. 2007;25:1753-1759.
Premise: RECIST insensitive in evaluating tumor responses in GIST treated with imatinib
Objectives– Determine whether changes in tumor size and density on CT correlate
with 18FDG-PET responsesa – Develop reliable, quantitative CT response criteria
Patients: N = 40 (total of 172 lesions) with metastatic GISTs treated with imatinib
Methods – Patients received pretreatment and 2-month follow-up CT and 18FDG-
PET scans – Multivariate analysis was carried out using tumor size and density
(HU) on CT and SUVmax on 18FDG-PET– Patients followed for up to 28 months
aGood response defined as a 70% decrease in SUVmax to an absolute value of <2.5.
HU, Hounsfield unit; SUVmax, maximum standardized uptake value.

29
Choi et al: Modified CT Response Evaluation Criteria
Response Definition
CR Disappearance of all lesions
No new lesions
PR
A decrease in sizea of ≥10% or a decrease in tumor density (HU) of ≥15% on CT
No new lesions
No obvious progression of nonmeasurable disease
SD Does not meet the criteria for CR, PR, or PD
No symptomatic deterioration attributed to tumor progression
PD
Increase in tumor size of ≥10% and does not meet criteria of PR by tumor density (HU) on CT
New lesions
New intratumoral nodules or increase in the size of the existing intratumoral nodules
aSum of the longest diameters of target lesions as defined in RECIST.
Adapted with permission from Choi H et al. J Clin Oncol. 2007;25:1753-1759.

30
Summary: Monitoring GIST and Assessing Response to Treatment
CT and 18FDG-PET are the primary methods of assessing response to imatinib
Modified CT response criteria (Choi criteria) are a sensitive and specific method for assessing tumor response to imatinib
– Based on changes in tumor size and density– Outperform conventional size-based criteria (RECIST, SWOG)
18FDG-PET provides an effective tool for rapid assessment of response to imatinib
– Can be used to clarify equivocal CT results NCCN guidelines/ESMO consensus recommend
– Regular CT monitoring of patients with GIST after surgery– 18FDG-PET as a tool to be used also in surveillance
CT and 18FDG-PET are useful in early recognition of the signs of PD– CT may be used to detect focal recurrence and clonal resistance– 18FDG-PET effective in visualizing reactivated tumor cells when
imatinib is withdrawn

31
Practical Management of Imatinib Therapy for GIST

32
Practical Management of Imatinib Therapy for GIST
Management of AEs is key to compliance with therapy1
Interruption of imatinib therapy often results in rapid tumor progression2
Imatinib differs from IV chemotherapy– Oral daily administration– Typically taken for long periods of time
Long-term adherence to oral cancer therapies problematic3
Adherence with imatinib in CML shown to decline over time4,5
CML, chronic myeloid leukemia; IV, intravenous.
1. Van Glabbeke M et al. Eur J Cancer. 2006;42:2277-2285.2. Blay JY et al. J Clin Oncol. 2007;25:1107-1113.3. Partridge AH et al. J Natl Cancer Inst. 2002;94:652-661. 4. Tsang J et al. J Clin Oncol. 2006;24:330s. Abstract 6119.5. Feng W et al. J Clin Oncol. 2006;24:310s. Abstract 6038.
33
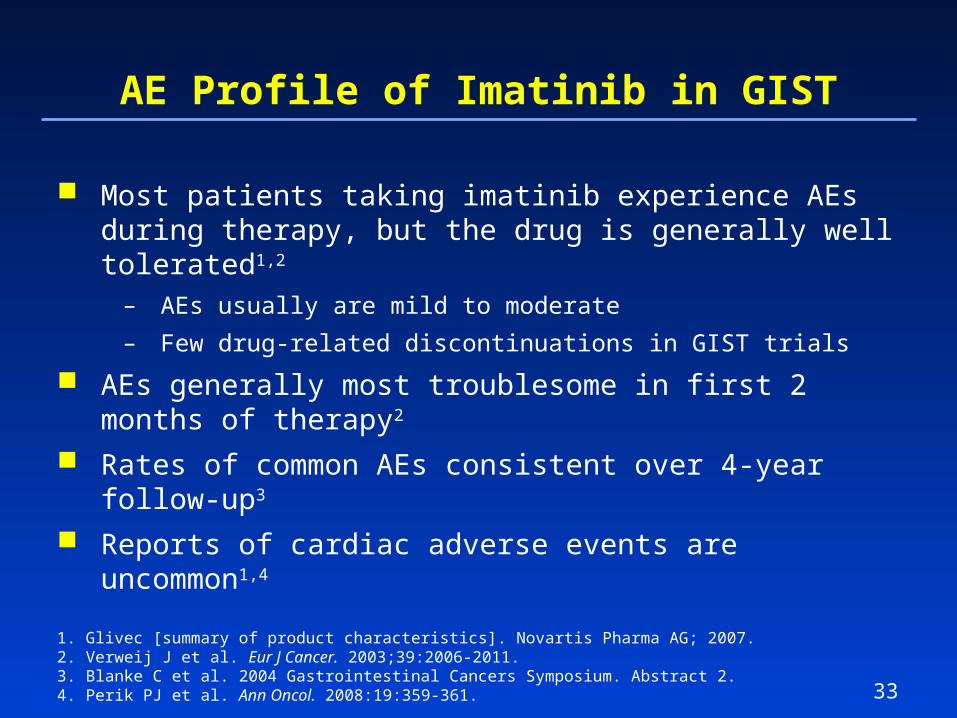
AE Profile of Imatinib in GIST
Most patients taking imatinib experience AEs during therapy, but the drug is generally well tolerated1,2
– AEs usually are mild to moderate
– Few drug-related discontinuations in GIST trials
AEs generally most troublesome in first 2 months of therapy2
Rates of common AEs consistent over 4-year follow-up3
Reports of cardiac adverse events are uncommon1,4
1. Glivec [summary of product characteristics]. Novartis Pharma AG; 2007.2. Verweij J et al. Eur J Cancer. 2003;39:2006-2011.3. Blanke C et al. 2004 Gastrointestinal Cancers Symposium. Abstract 2.4. Perik PJ et al. Ann Oncol. 2008:19:359-361.

34
Imatinib 800 mg/d: Tolerability and Safety
EORTC, European Organisation for Research and Treatment of Cancer; SAEs, serious adverse events.
1. Reichardt P. EJC Suppl. 2006;4(suppl 1):19-26.2. Blanke CD et al. J Clin Oncol. 2008;26:626-632.3. Verweij J et al. Lancet. 2004;364:1127-1134.4. Van Glabbeke M et al. Eur J Cancer. 2006;42:2277-2285.
Phase 3 results demonstrate that doses up to 800 mg/d are generally well tolerated1-3
– EORTC 62005: rates of SAEs similar in high- and low-dose groups (38% vs 37%, respectively)
Toxicities dose dependent4
Patients who dose-escalate from 400 to 800 mg/d appear to tolerate high dose better2,4
– US-Finland S0033: SAEs more common with high vs low dose (63% vs 43%)

35
Management of AEs
1. Guilhot F. Oncologist. 2004;9:271-281. 2. Demetri GD et al. J Natl Compr Canc Netw. 2004;2(suppl 1):S1-S26. 3. Blay JY et al. Proc Am Soc Clin Oncol. 2004;23:815. Abstract 9006.
Most AEs associated with imatinib therapy1,2
Mild to moderate (grade 1 or 2) Manageable without dose reduction
or discontinuation
AEs improve with time on imatinib treatment
Management of AEs is vital to maintaining response
If toxicity necessitates interruption2,3
Reinitiate therapy without dose reduction
Interruption and subtherapeutic dosing may increase risk of progression and resistance

36
Managing Progressive Disease

37
Discontinuation of Imatinib Increases Risk of GIST Progression
CI, confidence interval; CONT, continuous; GIST, gastrointestinal stromal tumor; INT, interrupted; PD, progressive disease; PFS, progression-free survival.
Adapted with permission from Adenis A et al. J Clin Oncol. 2008;26:558s.
Patients who achieved clinical benefit after 12 months were randomized to continue or interrupt imatinib therapy
Interrupt-therapy arm was discontinued due to high rates of disease progression Reintroduction of imatinib restored tumor control in all but 1 progressing patient
who refused to restart imatinib therapy

38
Causes of GIST Progression
Causes of tumor progression– Therapy interruption or discontinuation– Lack of compliance– Patient-specific pharmacokinetic factors causing
subtherapeutic drug levels– Mutations
Pharmacokinetic factors– Low imatinib plasma trough levels correlate with poor clinical
outcome
von Mehren M et al. Hematol Oncol Clin North Am. 2005;19:547-564.
39
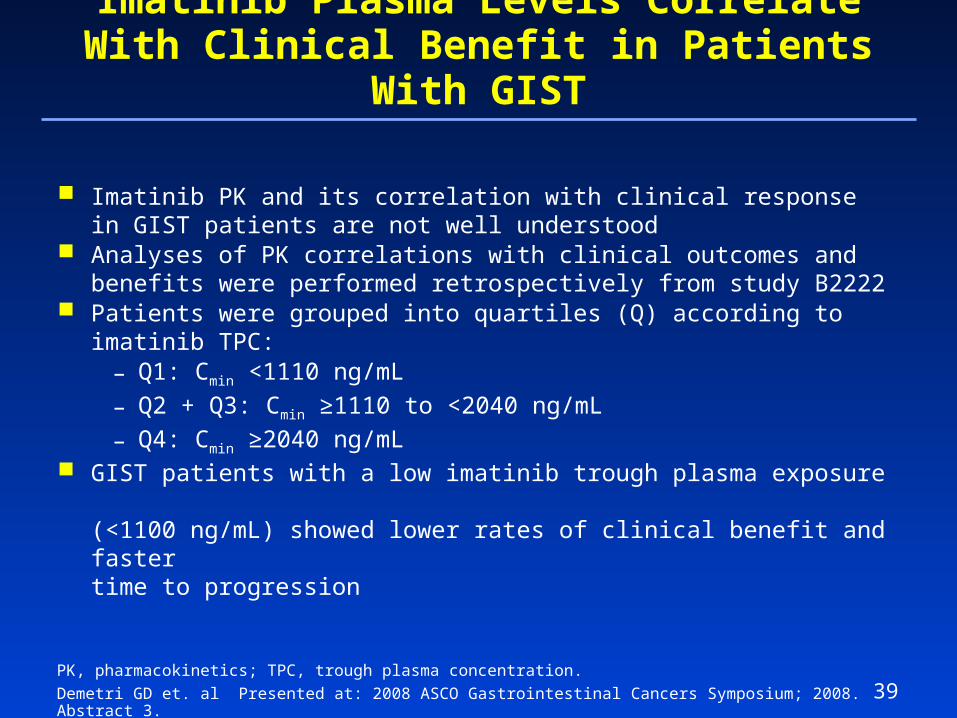
Imatinib Plasma Levels Correlate With Clinical Benefit in Patients With GIST
Imatinib PK and its correlation with clinical response in GIST patients are not well understood
Analyses of PK correlations with clinical outcomes and benefits were performed retrospectively from study B2222
Patients were grouped into quartiles (Q) according to imatinib TPC: – Q1: Cmin <1110 ng/mL
– Q2 + Q3: Cmin ≥1110 to <2040 ng/mL
– Q4: Cmin ≥2040 ng/mL GIST patients with a low imatinib trough plasma exposure
(<1100 ng/mL) showed lower rates of clinical benefit and faster time to progression
PK, pharmacokinetics; TPC, trough plasma concentration.
Demetri GD et. al Presented at: 2008 ASCO Gastrointestinal Cancers Symposium; 2008. Abstract 3.

40
Pivotal Phase 2 Trial: Higher Imatinib Trough Plasma Level Correlates With Clinical Benefit
Q1 (n = 18)Q2-Q3 Combined
Q4 (n = 19)Q2 (n = 18) Q3 (n = 18)
Mean, ng/mL 797 ± 227 1250 ± 87 1640 ± 170 2550 ± 530
CV, % 28.4 6.9 10.5 20.9
Range 410-1110 1110-1390 1390-2040 2040-4180
Imatinib TPC Quartiles
Responsen (%)
Q1(n = 18)
Q2-Q3(n = 36)
Q4(n = 19)
CR + PR + SD 12 (67) 29 (81) 16 (84)
PD/unknown 6 (33) 7 (19) 3 (16)
Overall Objective Clinical Benefit by Imatinib TPC Quartiles
Q, quartile; CV, coefficient of variation; CR, complete response; PR, partial response; SD, stable disease.
von Mehren M et al. Presented at: 44th ASCO Annual Meeting; 2008. Abstract 4523.

41
Time to Progression in Patients With Imatinib PK by Cmin Quartiles
Cmin, minimum concentration.
Adapted with permission from Demetri GD et al. Presented at: ASCO Gastrointestinal Cancers Symposium; 2008. Abstract 3.

42
Primary and Secondary Resistance: Definition
1. von Mehren M et al. Hematol Oncol Clin North Am. 2005;19:547-564.2. Blay JY et al. Ann Oncol. 2005;16:566-578.
Primary Resistance1,2
(no response)
Secondary (Acquired) Resistance1,2
(loss of response) No response to therapy
Early progression – Within first 6 months
Affects small percentage of patients
Initial response to or stabilization on imatinib
Develop progressive disease – After 6 months

43
Mechanisms of Mutational Resistance to Imatinib (cont’d)
Overexpression or amplification of KIT or PDGFRA gene1-3
Activation of downstream signal pathways bypassing KIT1-3
P-glycoprotein overexpression1
Antiapoptosis1
Decrease in imatinib intracellularly due to increased metabolism (eg, p450, -1 acid glycoprotein)1
1. Chen LL et al. Curr Oncol Rep. 2005;7:293-299.2. Heinrich MC et al. J Clin Oncol. 2006;24:4764-4774. 3. Fletcher JA et al. Proc Am Soc Clin Oncol. 2003;22:815. Abstract 3275.

44
Phase 3 Studies: Response Rates After Phase 3 Studies: Response Rates After Crossover to Imatinib 800 mg/dCrossover to Imatinib 800 mg/d
AI, assessment inadequate.
1. Zalcberg JR et al. Eur J Cancer. 2005;41:1751-1757.2. Blanke CD et al. J Clin Oncol. 2008:26:626-632.
62005 Trial1 S0033 Trial2
One-third of patients benefited from dose increase at progression
0 2
27
59
10
10
20
30
40
50
60
70
CR PR SD PD AI
Pat
ien
ts, %
3
42
22
1015
0
10
20
30
40
50
60
70
CR PR SD PD AI
Pat
ien
ts, %

45
Imatinib Dose Optimizing in GIST
Phase 3 studies have demonstrated the feasibility of dose escalation in PD1,2
Approximately one-third of patients with PD achieve clinical benefit (objective response or stable disease) after dose increase1,2
Available safety data suggest that dose escalation to 800 mg/d has no adverse effect on safety and tolerability3
1. Zalcberg JR et al. Eur J Cancer. 2005;41:1751-1757.2. Blanke CD et al. J Clin Oncol. 2008;26:626-632.3. Glivec [summary of product characteristics]. Novartis Pharma AG; 2007.

46
Use of Surgery and Imatinib Therapy in Recurrent Disease
Recurrent GIST should be managed as metastatic disease and treated with imatinib1-3
Imatinib therapy may be complemented by surgical resection
– Provides survival benefit with continued use of imatinib4
– May provide a survival benefit even in imatinib-resistant patients5
– Recommended for isolated clonal progression1
1. Demetri GD et al. J Natl Compr Canc Netw. 2007;5(suppl 2):S1-S29.2. Blay JY et al. Ann Oncol. 2005;16:566-578. 3. Casali PG et al. Ann Oncol. 2008;19(suppl 2):ii35-ii38.4. Hohenberger P et al. J Clin Oncol. 2006;24(suppl):520s. Abstract 9500.5. Nishida T et al. J Clin Oncol. 2006;24(suppl):531s. Abstract 9548.
Conclusion: Continuation of imatinib is mandatory in recurrent and metastatic GIST. Imatinib may be used as an investigational adjuvant and neoadjuvant agent to surgery in primary disease1-5

47
Progressive GIST:When to Consider a Second-Line Agent
Steps to take to clarify cause of resistance1
– Verify imatinib compliance and check blood level
– Identify possible pharmacokinetic factors
Continue imatinib therapy: effective KIT/PDGFRA suppression must be maintained1
Use of second-line inhibitor therapy1
– Imatinib dose optimization
– Surgical debulking of progressive lesions (where feasible) Consider use of KIT-PDGFR inhibitors
– After imatinib dose optimization • Local therapy may be considered
– Sunitinib is currently the second option after imatinib dose optimization or in patients intolerant to imatinib
Consider using promising new inhibitors (nilotinib, dasatinib) currently under investigation
1. von Mehren M et al. Hematol Oncol Clin North Am. 2005;19:547-564. 2. Blanke CD et al. J Clin Oncol. 2008;26:626-632.

48
Imatinib Treatment for Adjuvant GIST

49
ACOSOG Z9001: Trial Schema
(Phase III)778 patients
Placebo(354 randomized)
(345 treated)
87 discontinued treatment early
Imatinib (359 randomized)
(337 treated)
97 discontinued treatment early
30 events
5 GIST-unrelated deaths
713 patients randomized
• Phase III, randomized, double-blind, placebo-controlled multi-center trial
Eligibility:
• Patients >18 years with localized and primary GIST; KIT-positive tumors (>3 cm ); complete
surgical resection
Endpoints:• Primary: RFS; secondary: OS and safety
• Dose modifications upon grade 3 or 4 events
• PD patients unblinded: If placebo IM 400 mg/d; or If IM 400 mg/d IM 800 mg/d
IM 400 mg/day or placebo for 1 yr
70 events
5 GIST-related deaths
3 GIST-unrelated deaths

50
ParametersPlacebo(n=354)
Imatinib(n=359)
Age, median (range) 58 (18-91) 59 (18-88)
Gender, n (%) Female 163 (46.0%) 189 (52.6%)
Male 191 (54.0%) 170 (47.4%)
Performance Status, n (%)
0 265 (74.9%) 281 (78.3%)
1 81 (22.9%) 74 (20.6%)
2 8 (2.3%) 4 (1.1%)
Days between resection & randomization; median (range)
59 (15-96) 57 (20-74)
Patient characteristics
51
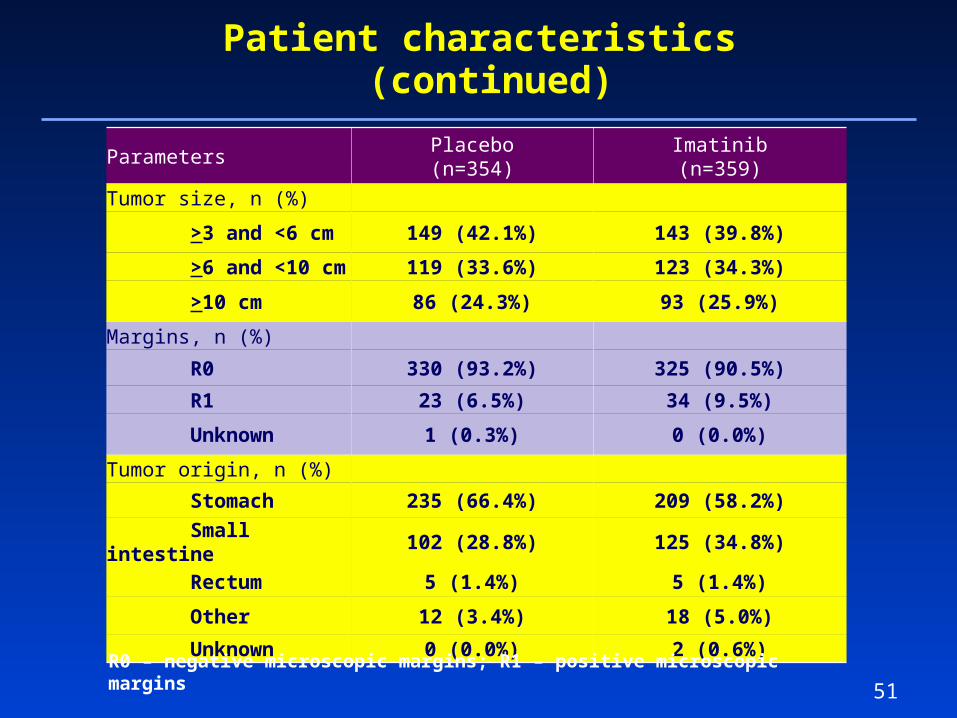
ParametersPlacebo(n=354)
Imatinib(n=359)
Tumor size, n (%)
>3 and <6 cm 149 (42.1%) 143 (39.8%)
>6 and <10 cm 119 (33.6%) 123 (34.3%)
>10 cm 86 (24.3%) 93 (25.9%)
Margins, n (%)
R0 330 (93.2%) 325 (90.5%)
R1 23 (6.5%) 34 (9.5%)
Unknown 1 (0.3%) 0 (0.0%)
Tumor origin, n (%)
Stomach 235 (66.4%) 209 (58.2%)
Small intestine 102 (28.8%) 125 (34.8%)
Rectum 5 (1.4%) 5 (1.4%)
Other 12 (3.4%) 18 (5.0%)
Unknown 0 (0.0%) 2 (0.6%)R0 – negative microscopic margins; R1 – positive microscopic margins
Patient characteristics (continued)

52
Median follow-up: 19.7 months
Estimated 1-year RFS (95% CI):
Imatinib: 98% (96-100)Placebo: 83% (78-88)
HR = 0.35 (0.22-0.53)P < 0.0001
CI, confidence interval; HR, hazard ratio
Events experienced:
Imatinib: 8.0% (30) Placebo: 20.0% (70)
Recurrence-free Survival (RFS)*
*All randomized patients were included in the analysis; recurrence-free survival was defined as the time frompatient registration to the development of tumor recurrence or death from any cause. Intention-to-treat analyses were done for recurrence-free survival (ie, analyzed patients by randomized group).

53
Imatinib adjuvant therapy results in significantly longer RFS in each of the tumor size categories compared to placebo
Patients with tumor size >10 cm have the longest survival on imatinib therapy at 2 years
Recurrence-free Survival (Tumor size)
size >10cm
size >3 and <6 cm size >6cm and <10cm

54
No difference in OS between imatinib and placebo adjuvant therapies
Longer follow-up might reveal a longer OS
Overall Survival (OS)*
*All randomized patients were included in the analysis; Overall survival was defined as the time from patient registration to death from any cause. Intention-to-treat analyses were done for overall survival (ie, analyzed patients by randomized group).

55
184 (26%) patients discontinued therapy; the main reasons included :
– Adverse events (AEs): imatinib (n=57) vs. placebo (n=11) (P < 0.0001) – Tumor recurrence: imatinib (n=1) vs. placebo (n=41) (P < 0.0001)
Reduction / interruption of treatment
Placebo (n=354)345 received treatment
9 did not receive treatment33 ineligible patients
Grade 3 or 4 AEs:
31.0% (n=104)
Grade 3 or 4 AEs:
18.0% (n=63)
97 (27.0%) discontinued treatment early57 (15.9%) for adverse events1 (<1%) for disease recurrence15 (4.2%) for patient withdrawal
24 (6.7%) for other/missing reasons
87 (24.6%) discontinued treatment early11 (3.1%) for adverse events
41 (11.6%) for disease recurrence20 (5.6%) for patient withdrawal
15 (4.2%) for other/missing reasons
Imatinib (n=359)337 received treatment
22 did not receive treatment32 ineligible patients
713 patientsrandomized

56
Safety / Tolerability
Adverse Event
Placebo(n=345)
Imatinib(n=337)
Grade 3 Grade 4 Grade 3 Grade 4
Neutropenia 3 (<1%) 1 (<1%) 7 (2%) 5 (1%)
Fatigue 4 (1%) 0 5 (1%) 2 (<1%)
Dermatitis 0 0 11 (3%) 0
Abdominal pain 6 (1%) 0 12 (3%) 0
Nausea 4 (1%) 0 8 (2%) 0
Vomiting 2 (<1%) 0 8 (2%) 0
Diarrhea 5 (1%) 0 10 (2%) 0
ALT 0 0 7 (2%) 2 (<1%)
AST 0 0 4 (1%) 3 (<1%)
Edema 1 (<1%) 0 7 (2%) 0
Hyperglycemia 7 (2%) 0 2 (<1%) 0
Hypokalemia 3 (<1%) 0 4 (1%) 0
Syncope 0 0 4 (1%) 0
Dyspnea 2 (<1%) 0 4 (1%) 0
ALT, alanine aminotransferase; AST, aspartate aminotransferase
57
Imatinib at 400 mg/d is safe and well tolerated when administered as adjuvant therapy after complete resection of primary GIST
Adjuvant imatinib resulted in a significant improvement in RFS in patients with all tumor sizes– Especially relevant for high-risk patients (e.g. tumor size ≥10 cm
or high mitotic rate) since this patient population has a 50% higher chance of recurrence at 2 years without adjuvant therapy
OS between imatinib and placebo groups comparable at this time
– A longer follow-up period is likely required to observe differences
Ongoing trials in the adjuvant setting are under way to determine appropriate treatment duration of imatinib and impact on OS
– SSGXVIII/AIO – EORTC 62024
Summary
Related Documents