Building lifetime relationships with our clients and employees. Using GIS to Manage and Analyze a Landfill Mike Michels, Vice President Aaron Weier, GIS Director March 6, 2015

GIS - using GIS to manage and analyze a landfill
Jul 16, 2015
Welcome message from author
This document is posted to help you gain knowledge. Please leave a comment to let me know what you think about it! Share it to your friends and learn new things together.
Transcript

Building lifetime relationships
with our clients and employees.
Using GIS to Manage and Analyze a LandfillMike Michels, Vice PresidentAaron Weier, GIS Director
March 6, 2015

Overview
• GIS to Manage Data
• GIS to Analyze Leachate and Temperature in
LFG Wells
• GIS to Analyze Gas Flow in LFG Wells
• GIS for Environmental Compliance
• GIS in the Field
© 2014 Cornerstone. All rights reserved.
Building lifetime relationships
with our clients and employees.
GIS to Manage Data
March 6, 2015

Finding Your Boring Log is Easy
© 2014 Cornerstone. All rights reserved.

Differentiating Active and Inactive Wells
© 2014 Cornerstone. All rights reserved.
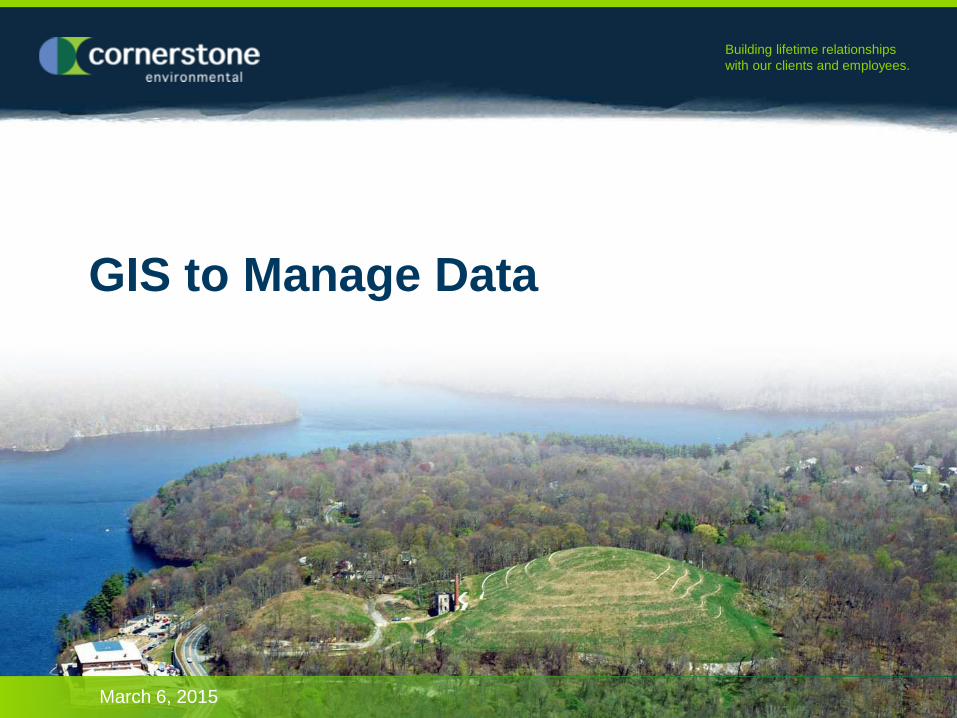
Compare Ground Surface to Top of Well from Boring Log
© 2014 Cornerstone. All rights reserved.

Where are the Horizontals Gas Collectors in Relation to Verticals?
2D: Appears to be some
overlap
© 2014 Cornerstone. All rights reserved.
3D: Reveals
depths and
no overlap
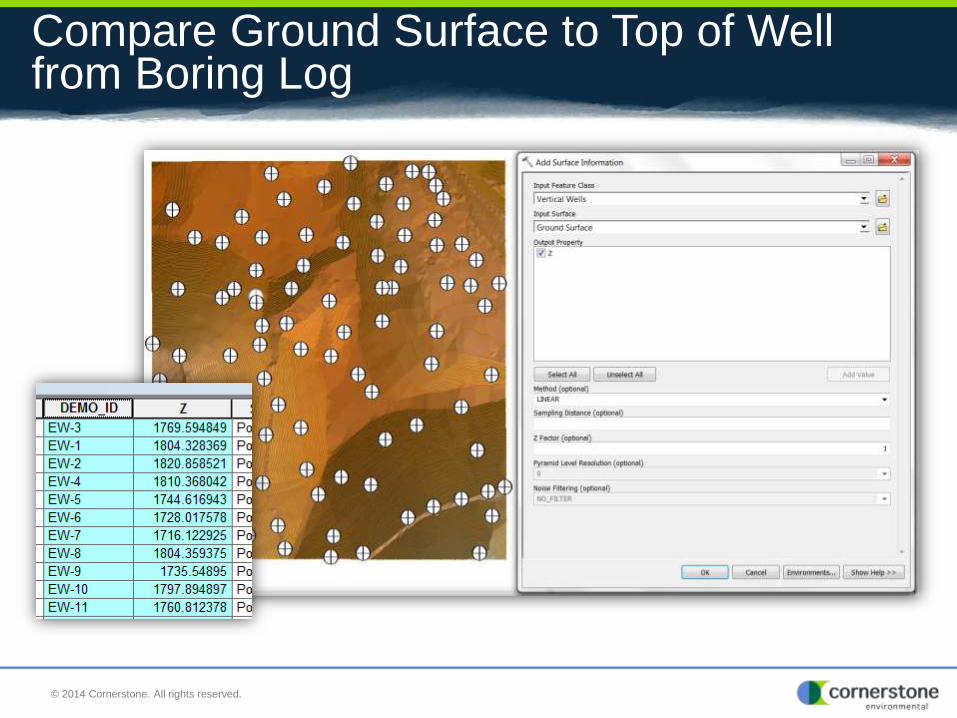
Where is the Asbestos Buried? Can we Drill LFG Wells Above Them?
© 2014 Cornerstone. All rights reserved.
Building lifetime relationships
with our clients and employees.
GIS to Analyze Leachate and Temperature in LFG Wells
March 6, 2015

Where is Leachate Blocking Gas Flow?
© 2014 Cornerstone. All rights reserved.

© 2014 Cornerstone. All rights reserved.
Alternate Option
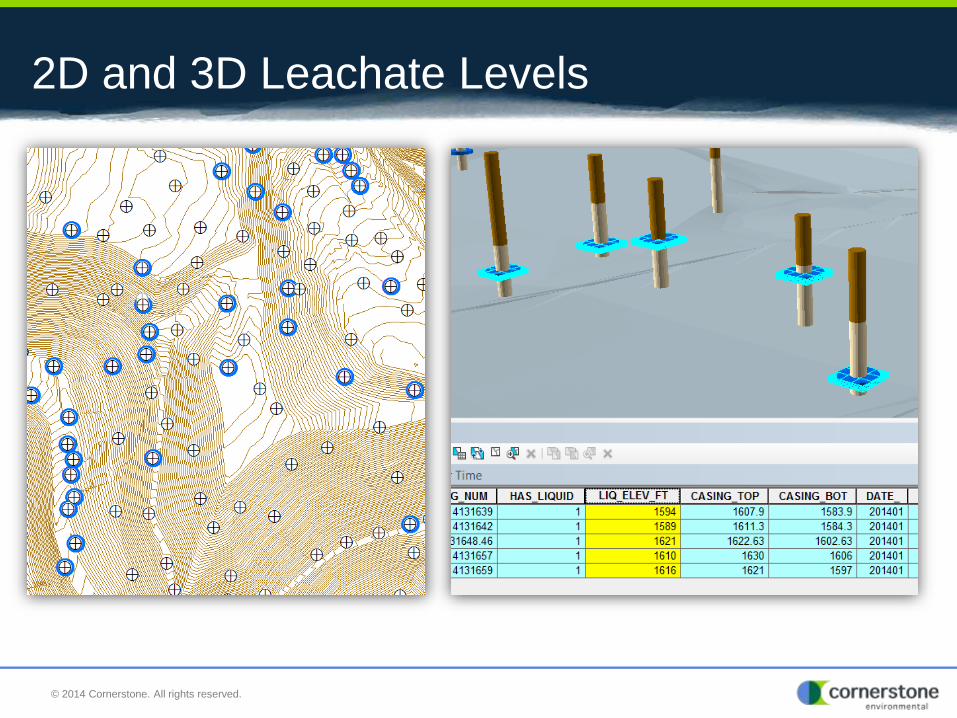
2D and 3D Leachate Levels
© 2014 Cornerstone. All rights reserved.

4th Dimension - Leachate Levels Over Time
Hover on image and click play.
© 2014 Cornerstone. All rights reserved.

Temperatures in LFG Wells
© 2014 Cornerstone. All rights reserved.

Building lifetime relationships
with our clients and employees.
GIS to Analyze Gas Flow in LFG Wells
March 6, 2015

2D Gas Flow
© 2014 Cornerstone. All rights reserved.
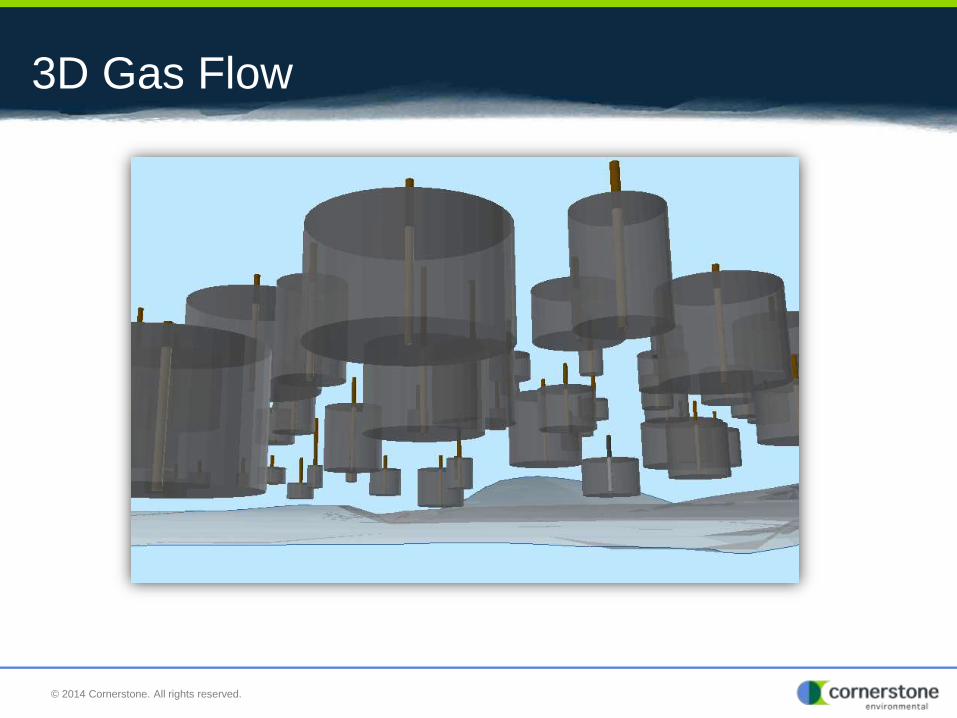
3D Gas Flow
© 2014 Cornerstone. All rights reserved.

2D & 3D Gas Flow with Methane Colors
© 2014 Cornerstone. All rights reserved.

Building lifetime relationships
with our clients and employees.
GIS for Environmental Compliance
March 6, 2015

Using GIS to Analyze Surface Emissions
© 2014 Cornerstone. All rights reserved.
Surface Emission Monitoring Points
Interpolated surface showing
potential hot spots across
landfill.
Seeing hot spots across the landfill will help
identify potential sources of odor, lack of soil
cover, and areas for new wells

When Was LFG Well 23 Last Inspected?
© 2014 Cornerstone. All rights reserved.
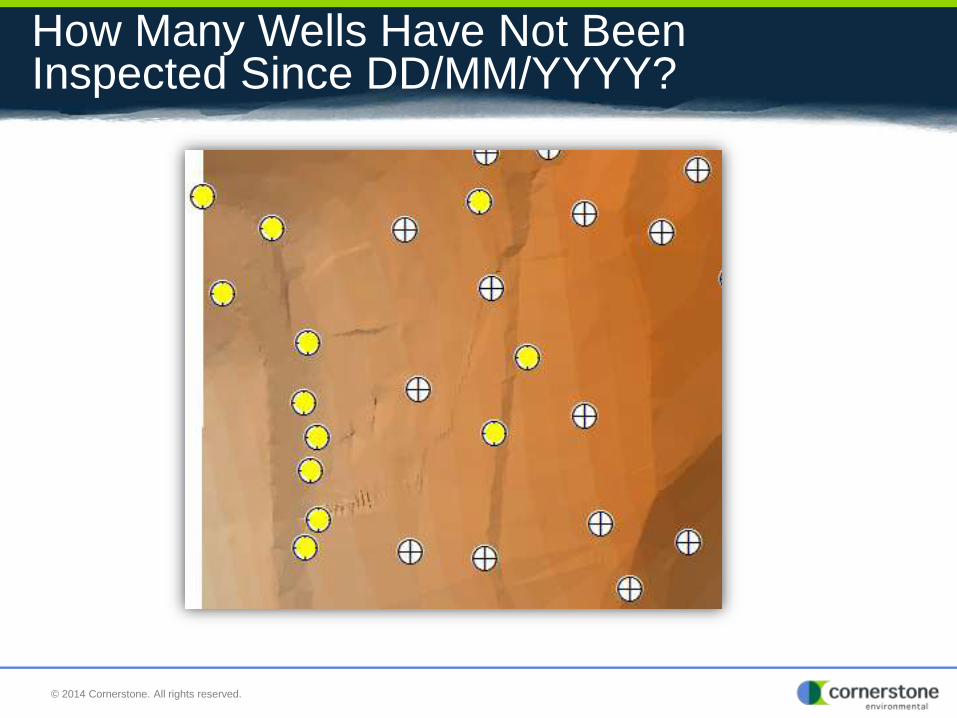
How Many Wells Have Not Been Inspected Since DD/MM/YYYY?
© 2014 Cornerstone. All rights reserved.

What Wells Have Oxygen Exceedances?
© 2014 Cornerstone. All rights reserved.

Building lifetime relationships
with our clients and employees.
GIS in the Field
March 6, 2015

2004
© 2014 Cornerstone. All rights reserved.

2012
© 2014 Cornerstone. All rights reserved.

Smart Phones/Tablets in the Wellfield
© 2014 Cornerstone. All rights reserved.

Building lifetime relationships
with our clients and employees.
How Can GIS Deliver More LFG to Energy ?
March 6, 2015

Recent Trends
© 2014 Cornerstone. All rights reserved29
0
10
20
30
40
50
60
70
2008 2009 2010 2011 2012 2013 2014
# o
f S
tart
ups
Year
LFG to Energy - Startups Per Year
Direct Electricity HBTU
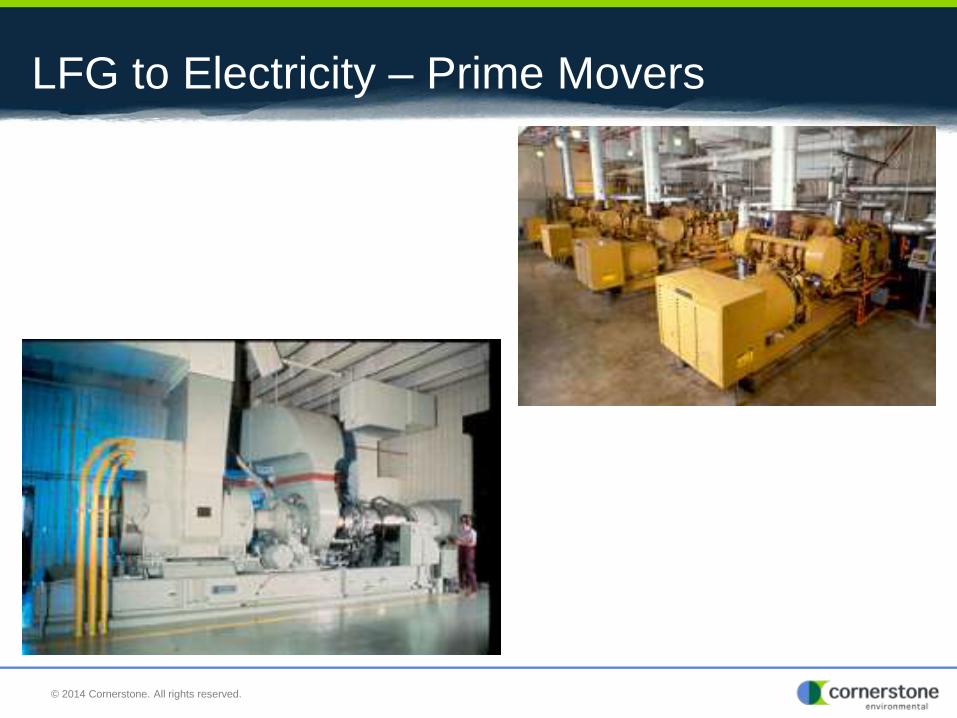
LFG to Electricity – Prime Movers
© 2014 Cornerstone. All rights reserved.
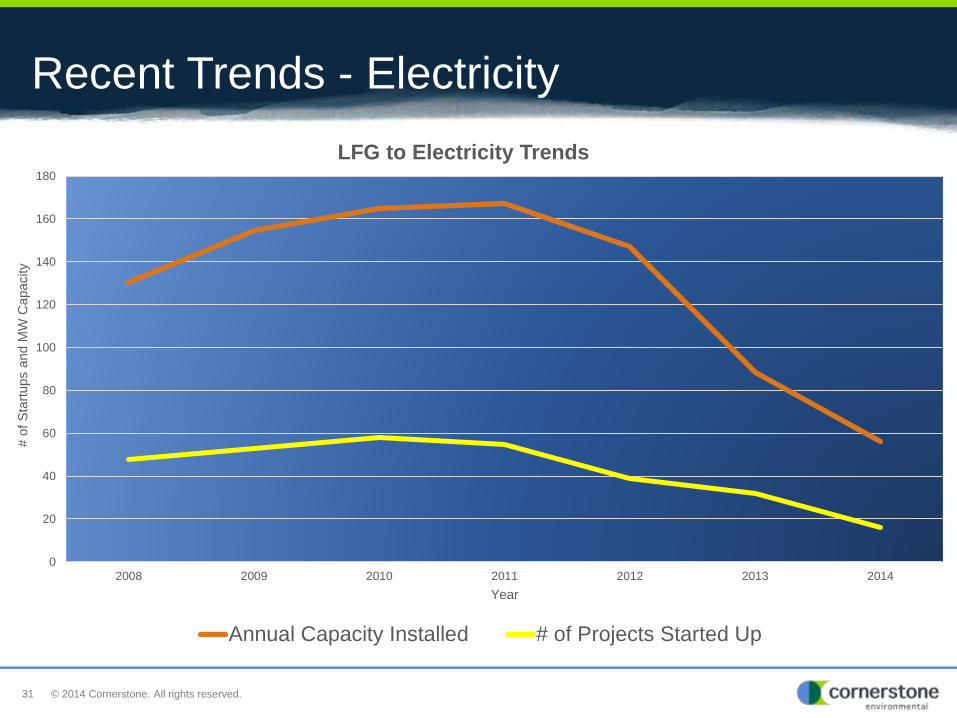
Recent Trends - Electricity
© 2014 Cornerstone. All rights reserved.31
0
20
40
60
80
100
120
140
160
180
2008 2009 2010 2011 2012 2013 2014
# o
f S
tart
ups a
nd M
W C
apacity
Year
LFG to Electricity Trends
Annual Capacity Installed # of Projects Started Up

Medium BTU LFG to Energy
© 2014 Cornerstone. All rights reserved.

Recent Trends – Medium BTU
© 2014 Cornerstone. All rights reserved. 33
0
5
10
15
20
25
30
35
2008 2009 2010 2011 2012 2013 2014
# o
f S
tart
ups a
nd M
MC
F/d
ay C
apacity
Year
LFG to Low BTU Trends
Annual Capacity Installed # of Projects Started Up
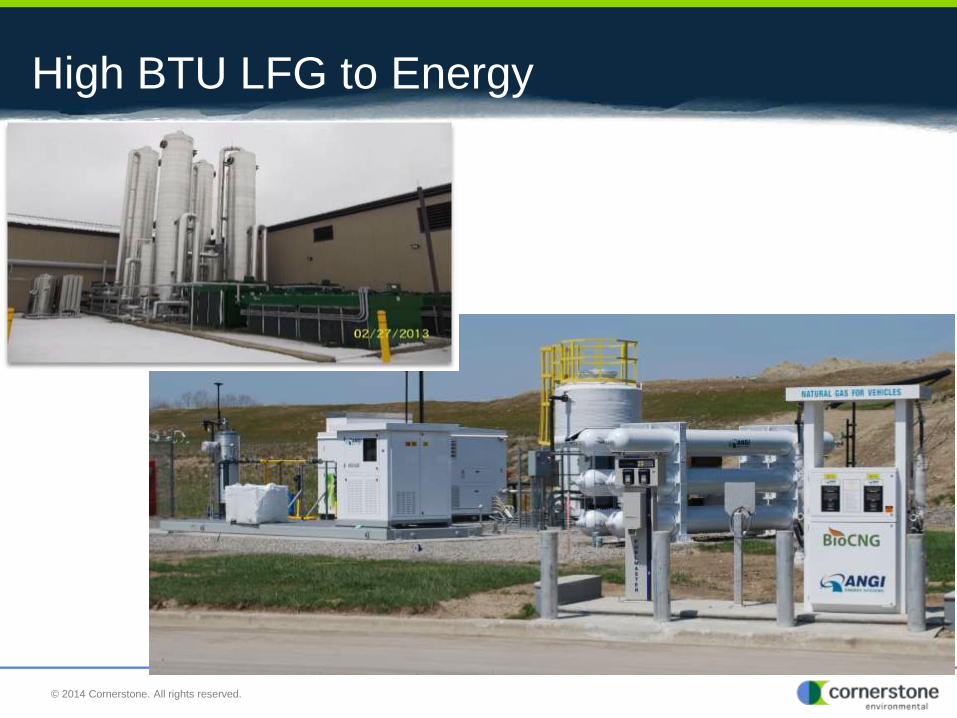
High BTU LFG to Energy
© 2014 Cornerstone. All rights reserved.

Recent Trends – High BTU
© 2014 Cornerstone. All rights reserved35
0
5
10
15
20
25
30
2008 2009 2010 2011 2012 2013 2014
# o
f S
tart
ups a
nd M
MC
F/d
ay C
apacity
Year
LFG to High BTU Trends
Annual Capacity Installed # of Projects Started Up

HBTU to CNG Example Revenue
• RCNG or RLNG
• Sell RNG for 65% of the
cost at the Chicago
Pump = $1.82/GGE or
$14/MMBTU +
• Collect RIN’s for
$1.50/GGE or
$17/MMBTU
• Results in $31/MMBTU
• LCFS –California
• Sell for $4/MMBTU
• Clean Truck & Bus
Program – CA

GIS and LFGTE
© 2014 Cornerstone. All rights reserved.

Thanks for watching!
If you’re interested in learning more about GIS
and Cornerstone’s other services, please visit
our website at www.CornerstoneEG.com.
© 2014 Cornerstone. All rights reserved.
Related Documents