UPDATE! orecast.weather.gov/MapClick.php?lon=-124.16121&lat=40.85186#.U_1mc

Welcome message from author
This document is posted to help you gain knowledge. Please leave a comment to let me know what you think about it! Share it to your friends and learn new things together.
Transcript
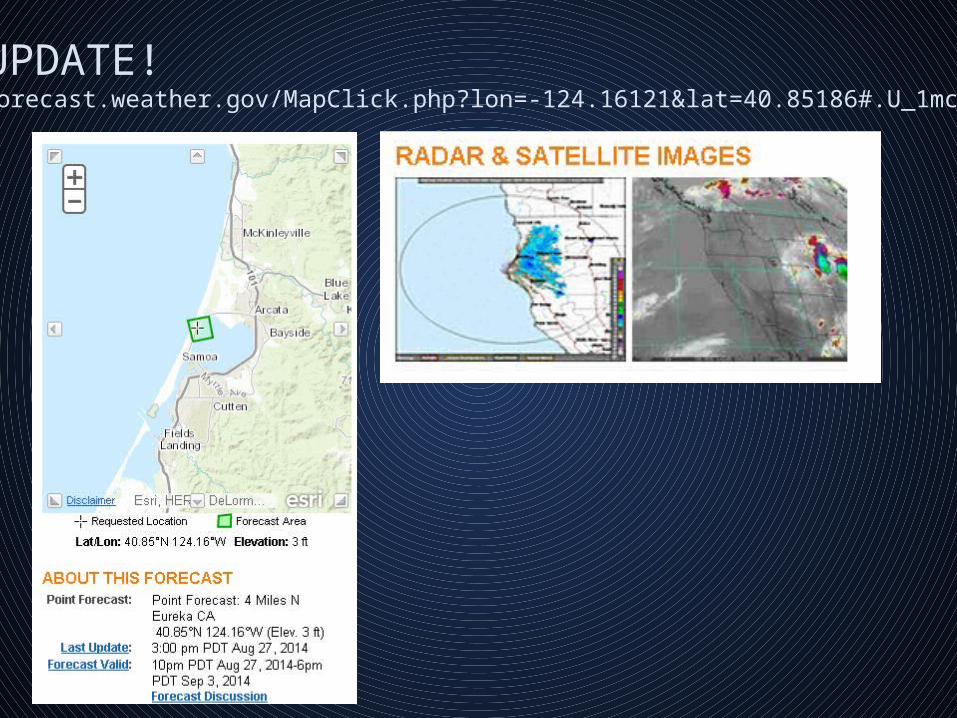
GIS UPDATE!http://forecast.weather.gov/MapClick.php?lon=-124.16121&lat=40.85186#.U_1mcfldV9j
TODAY:• What is GIS?• Map Scale
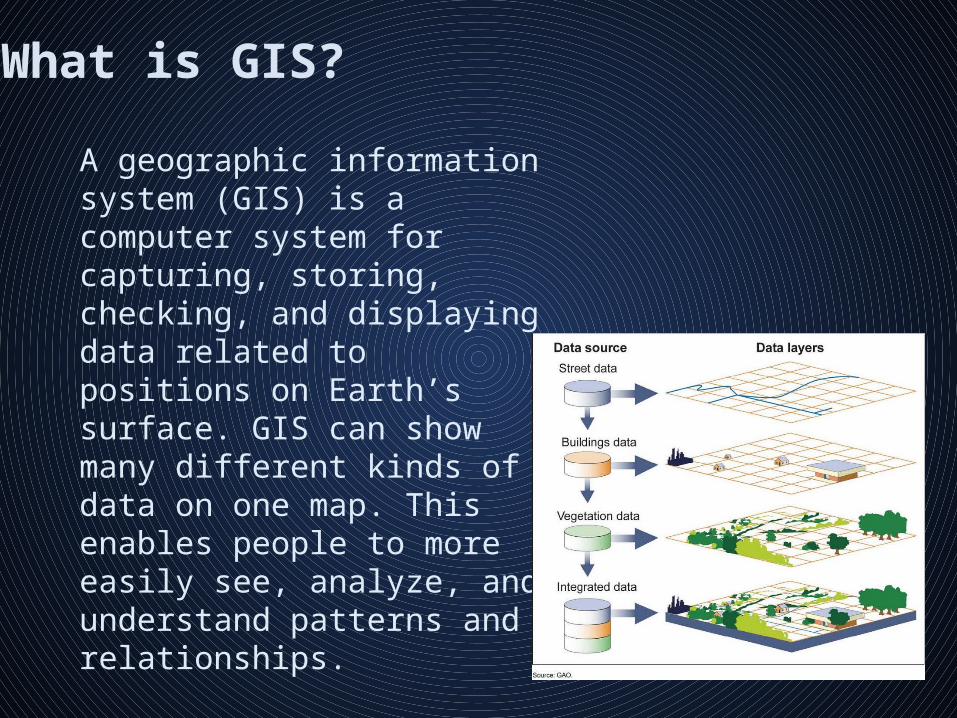
A geographic information system (GIS) is a computer system for capturing, storing, checking, and displaying data related to positions on Earth’s surface. GIS can show many different kinds of data on one map. This enables people to more easily see, analyze, and understand patterns and relationships.
What is GIS?
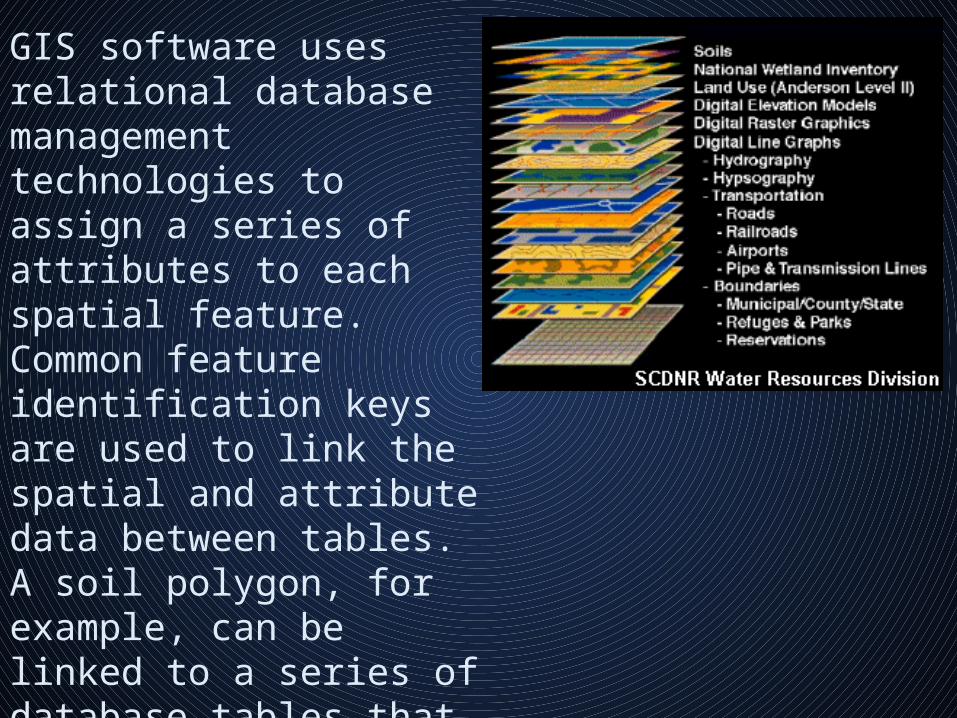
GIS software uses relational database management technologies to assign a series of attributes to each spatial feature. Common feature identification keys are used to link the spatial and attribute data between tables. A soil polygon, for example, can be linked to a series of database tables that define its mineral and chemical composition, crop yield, land use suitability, slope, and other characteristics.

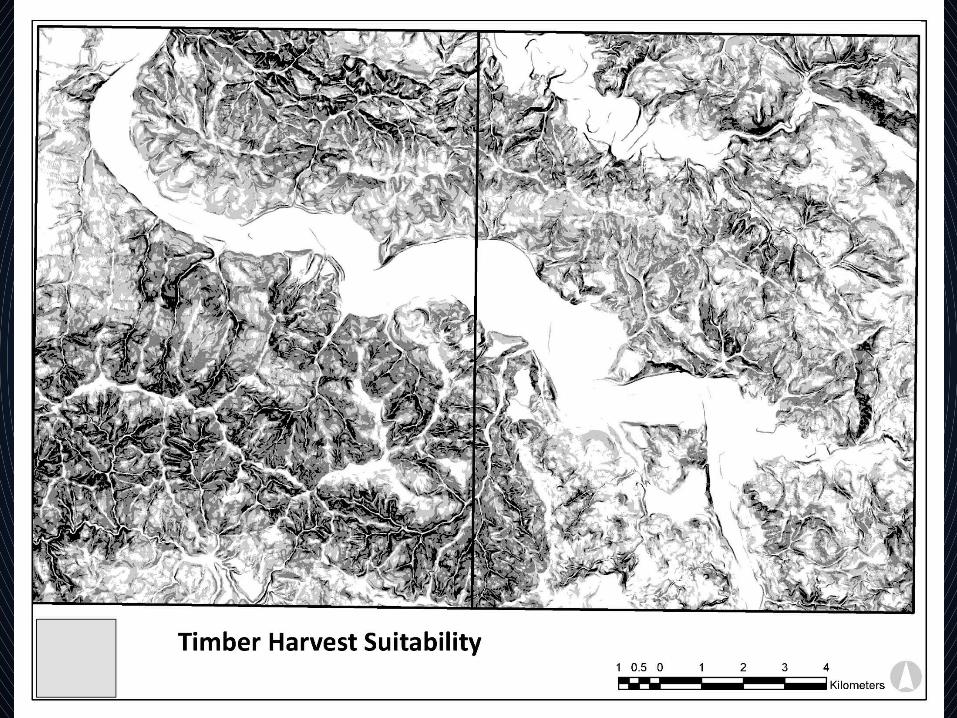
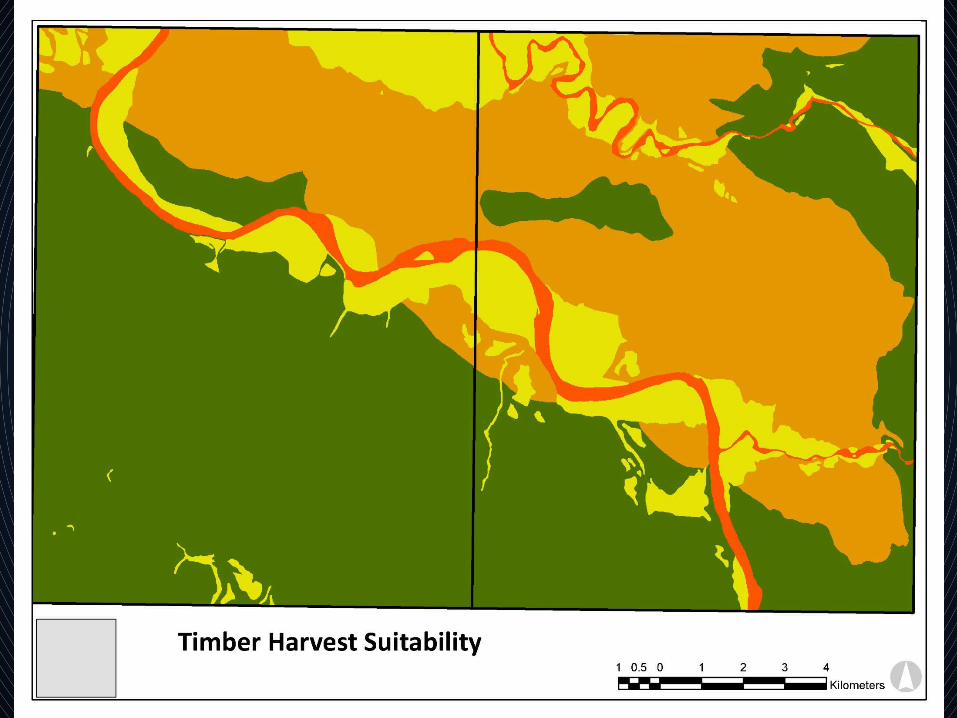
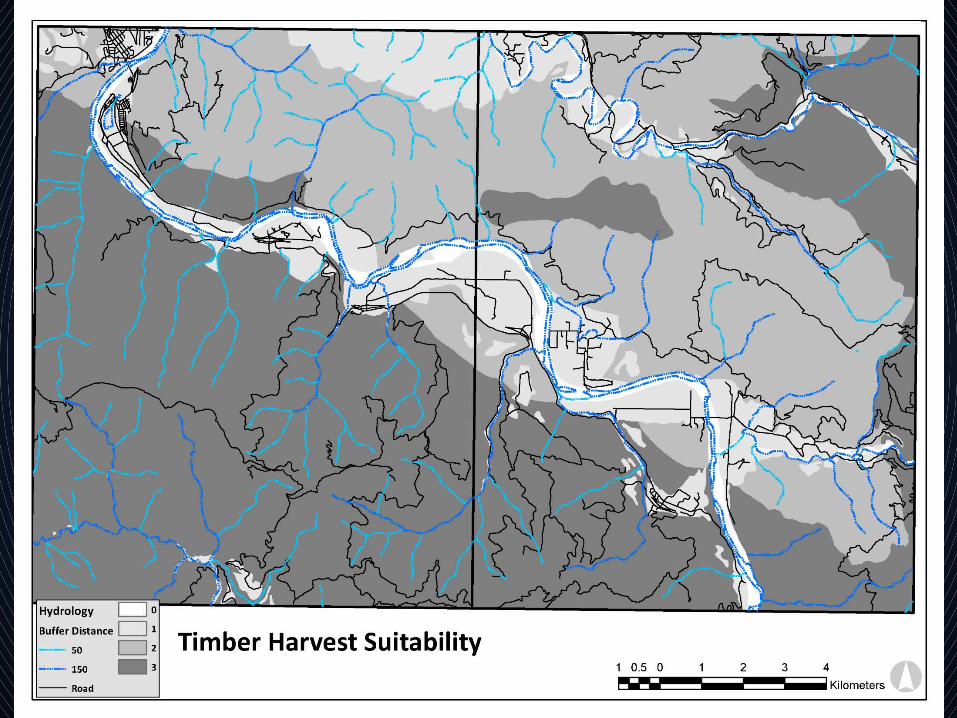
GIS provides the capability to combine various data into a composite data layer that may become a base layer in a database. For example, slope, soils, hydrography, demography, wetlands, and land use can be combined to develop a single layer of suitable hazardous waste storage sites. These data, in turn, may be incorporated into the permanent database of a local government and used for regulatory and planning decisions.
http://
www.epa.gov/region5fields/gis.html


The three families of map projections. They can be represented by a) cylindrical projections, b) conical projections or c) planar projections.
http://docs.qgis.org/2.0/en/docs/gentle_gis_introduction/coordinate_reference_systems.html
Projections
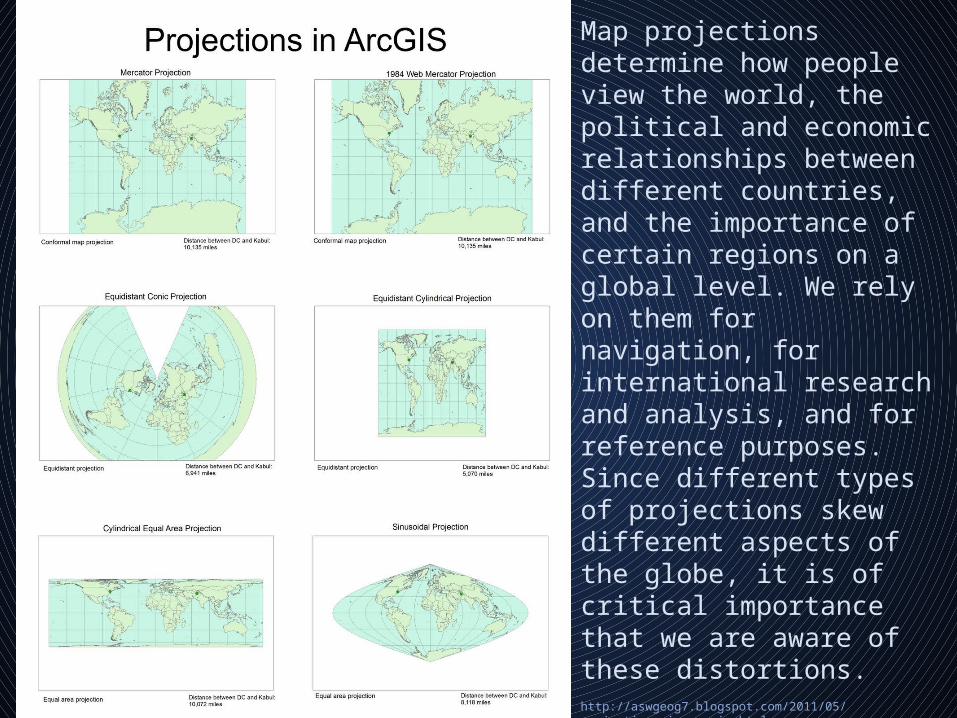
http://aswgeog7.blogspot.com/2011/05/projections-in-arcgis.html
Map projections determine how people view the world, the political and economic relationships between different countries, and the importance of certain regions on a global level. We rely on them for navigation, for international research and analysis, and for reference purposes. Since different types of projections skew different aspects of the globe, it is of critical importance that we are aware of these distortions.
http://www.geo.hunter.cuny.edu/~rdatta/gis2/lectures/Lecture2/lecture2.htm
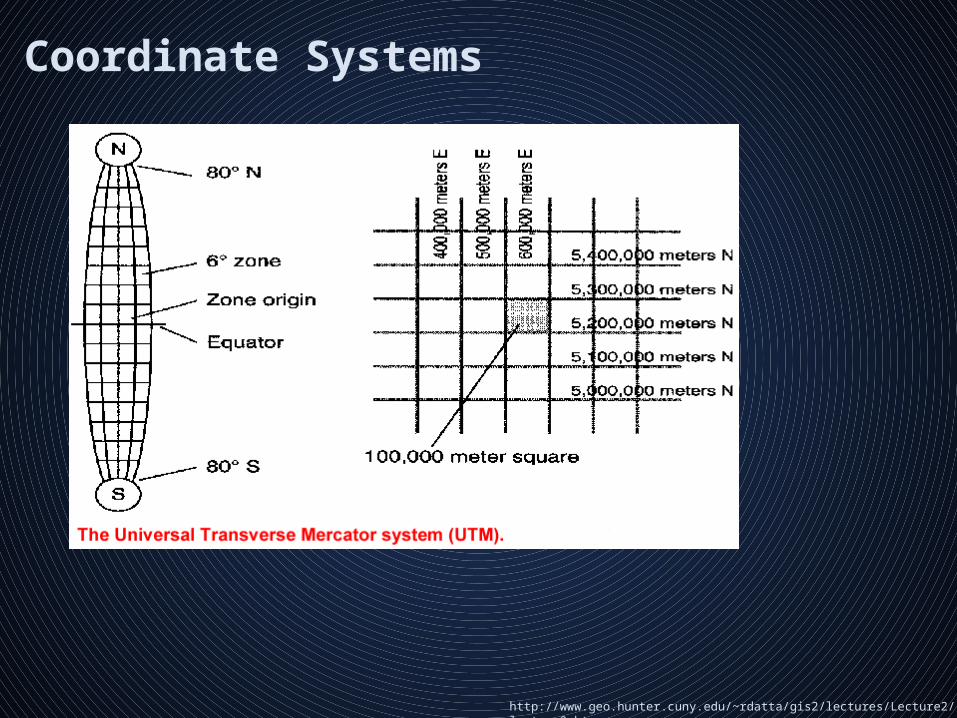
Coordinate Systems

Can anyone think of a use for a GIS?
Map scale refers to the relations (or ratio) between distance on a map and the corresponding distance on the ground. For example, on a 1:100,000 scale map, 1cm on the map equals 1km on the ground. (or 1 cm on the map equals 100,000 cm on the ground)
TODAY:• What is GIS?• Map Scale
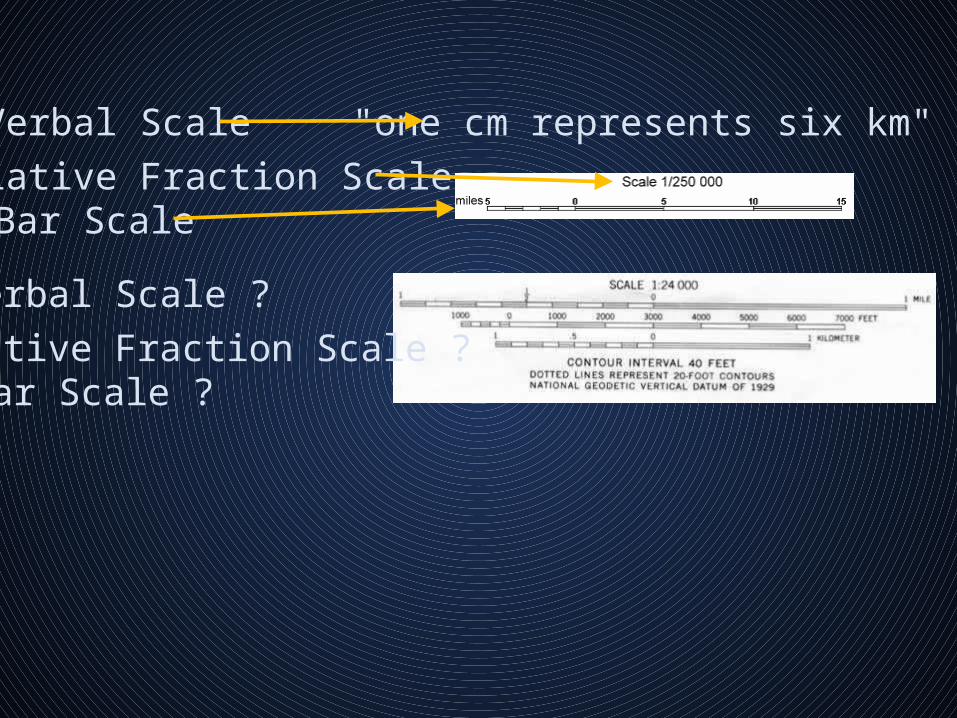
Relative Fraction ScaleBar Scale
Verbal Scale "one cm represents six km"
Relative Fraction Scale ?Bar Scale ?
Verbal Scale ?
Large scale maps or Small scale maps?A large scale map shows greater detail because the scale is a larger fraction than a small scale map.
• Large scale maps have a scale of 1:50,000 or greater (1:24,000, 1:10,000, ...).
• Small scale maps are those with scales smaller than 1:250,000.
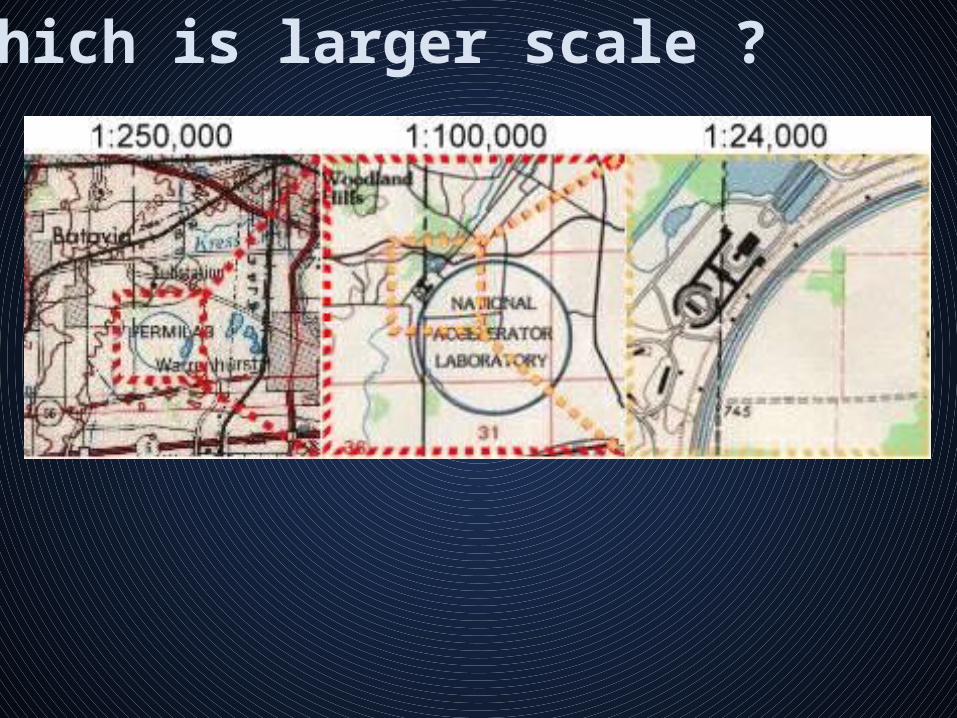
Which is larger scale ?
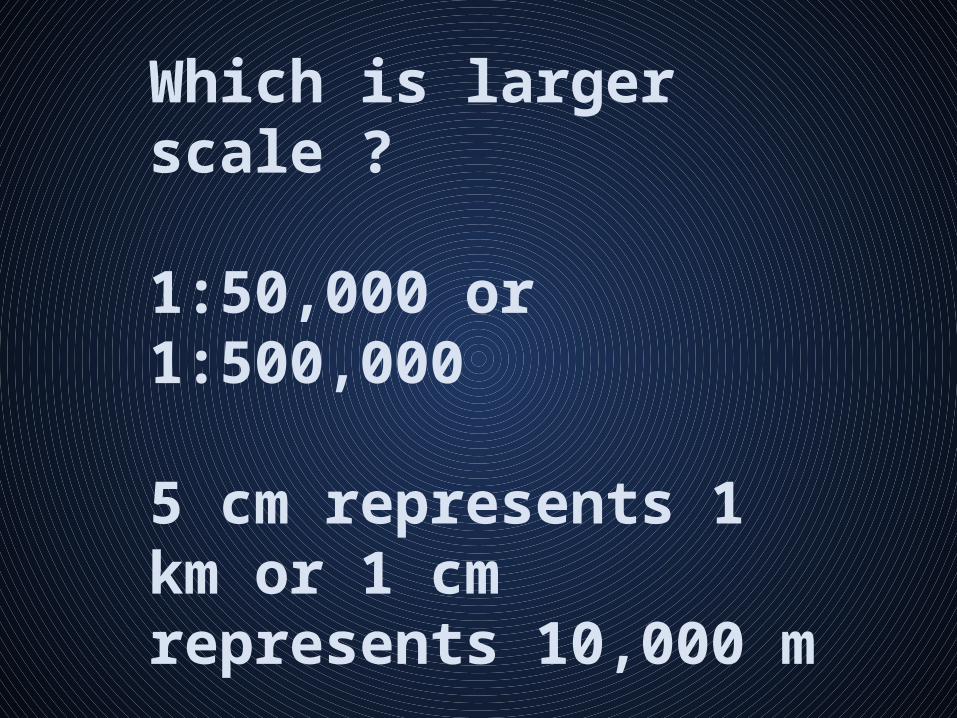
Which is larger scale ?
1:50,000 or 1:500,000
5 cm represents 1 km or 1 cm represents 10,000 m
––––––––– ––––––––– 0 1 km 0 1 cm

Express the following verbal scales as representative fractions:
2 cm represents 5 km
100 cm represents 2500 km
0.4 cm represents 0.1 km

Given a map scale of 1:30,000, how many cm would represent 9 km?
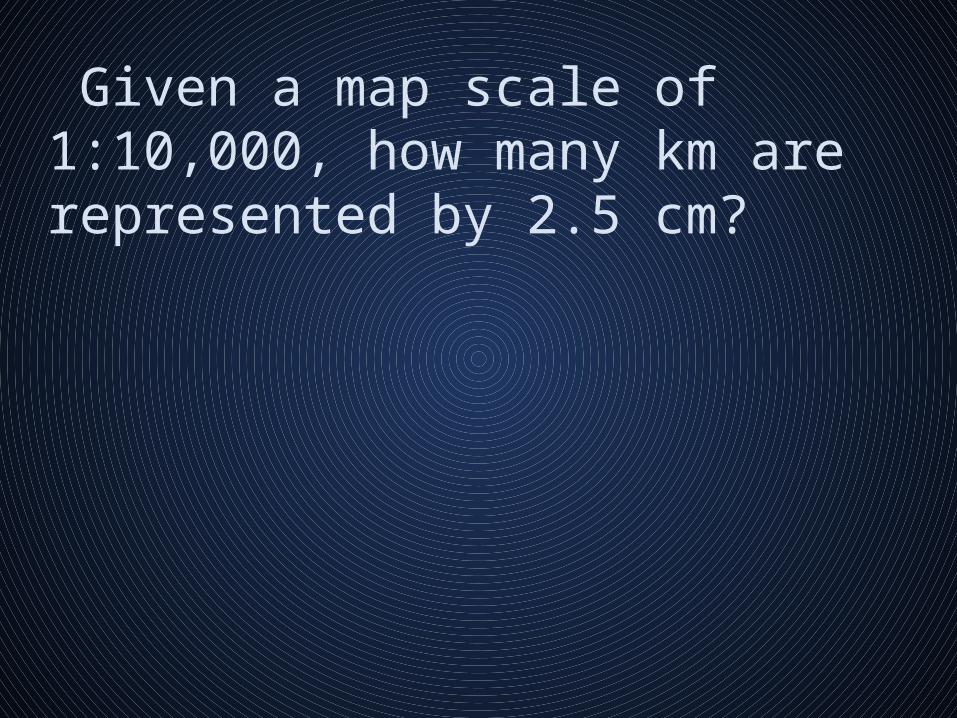
Given a map scale of 1:10,000, how many km are represented by 2.5 cm?
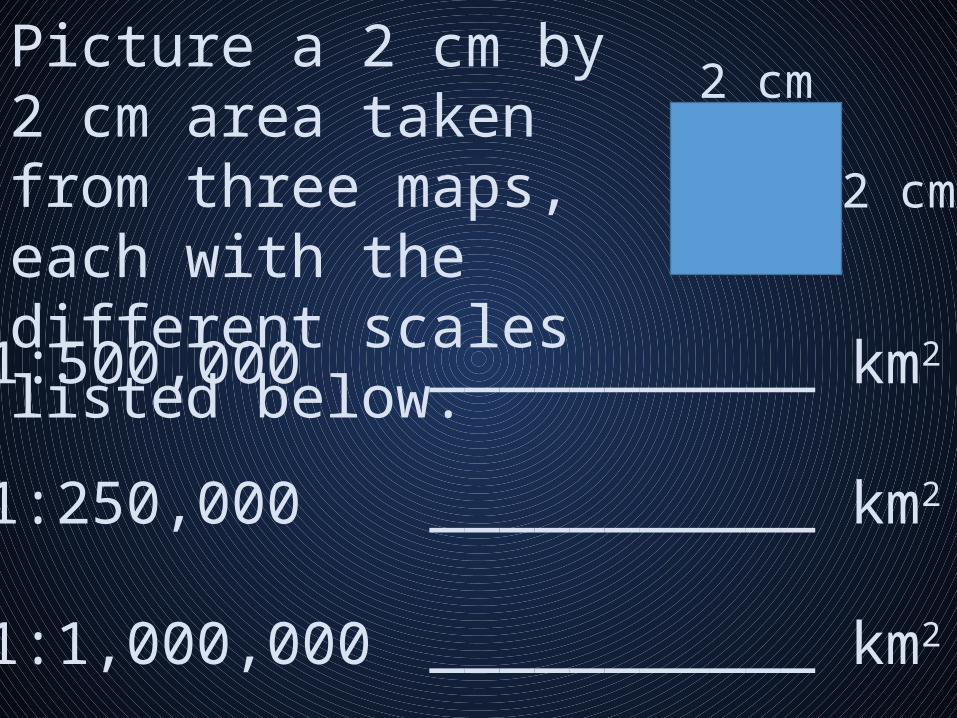
Picture a 2 cm by 2 cm area taken from three maps, each with the different scales listed below.
2 cm
2 cm
1:500,000
1:250,000
1:1,000,000
___________ km2
___________ km2
___________ km2
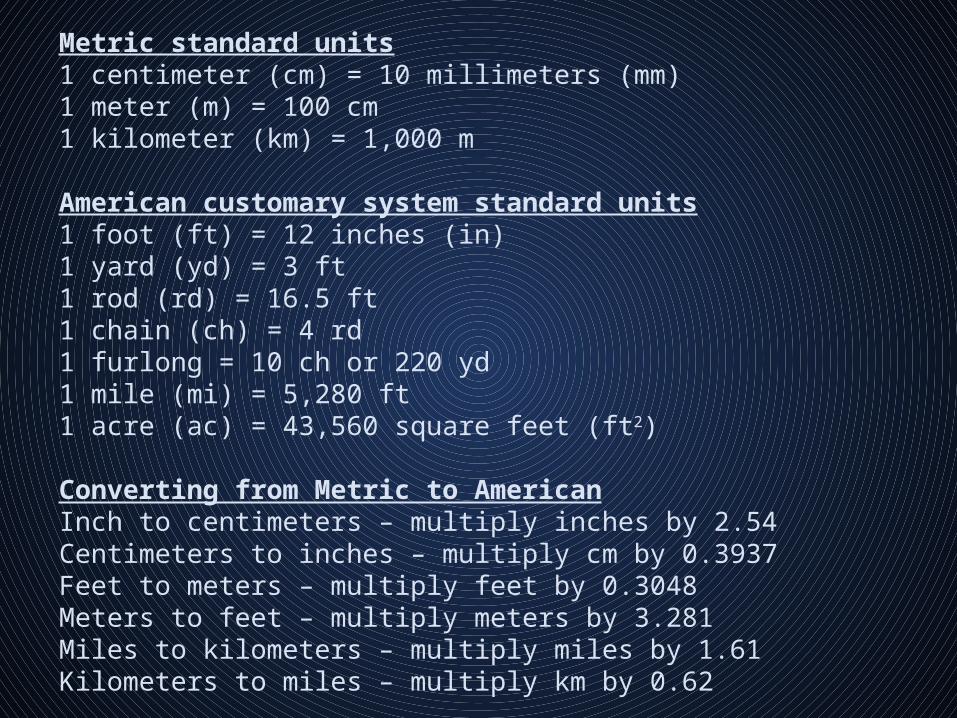
Metric standard units1 centimeter (cm) = 10 millimeters (mm)1 meter (m) = 100 cm1 kilometer (km) = 1,000 m
American customary system standard units1 foot (ft) = 12 inches (in)1 yard (yd) = 3 ft1 rod (rd) = 16.5 ft1 chain (ch) = 4 rd1 furlong = 10 ch or 220 yd1 mile (mi) = 5,280 ft 1 acre (ac) = 43,560 square feet (ft2)
Converting from Metric to AmericanInch to centimeters – multiply inches by 2.54Centimeters to inches – multiply cm by 0.3937Feet to meters – multiply feet by 0.3048Meters to feet – multiply meters by 3.281Miles to kilometers – multiply miles by 1.61Kilometers to miles – multiply km by 0.62

BREAK TIME!


Related Documents