GIS-BASED SITE SELECTION FOR UNDERGROUND NATURAL RESOURCES USING FUZZY AHP-OWA Sabzevari, A. R. a and M. R. Delavar b a GIS Dept., School of Surveying and Geospatial Eng., College of Eng., University of Tehran, Tehran, Iran- [email protected] b Center of Excellence in Geomatics Eng. in Disaster Management, School of Surveying and Geospatial Eng., College of Eng., University of Tehran, Tehran, Iran - [email protected] commission IV, WG IV/3 KEY WORDS: Site Selection, Natural Resource, Multi-Criteria Decision Making, Ordered Weighted Average, Fuzzy AHP, Fuzzy AHP-OWA ABSTRACT: Fuel consumption has significantly increased due to the growth of the population. A solution to address this problem is the underground storage of natural gas. The first step to reach this goal is to select suitable places for the storage. In this study, site selection for the underground natural gas reservoirs has been performed using a multi-criteria decision-making in a GIS environment. The “Ordered Weighted Average” (OWA) operator is one of the multi-criteria decision-making methods for ranking the criteria and consideration of uncertainty in the interaction among the criteria. In this paper, Fuzzy AHP_OWA (FAHP_OWA) is used to determine optimal sites for the underground natural gas reservoirs. Fuzzy AHP_OWA considers the decision maker’s risk taking and risk aversion during the decision-making process. Gas consumption rate, temperature, distance from main transportation network, distance from gas production centers, population density and distance from gas distribution networks are the criteria used in this research. Results show that the northeast and west of Iran and the areas around Tehran (Tehran and Alborz Provinces) have a higher attraction for constructing a natural gas reservoir. The performance of the used method was also evaluated. This evaluation was performed using the location of the existing natural gas reservoirs in the country and the site selection maps for each of the quantifiers. It is verified that the method used in this study is capable of modeling different decision-making strategies used by the decision maker with about 88 percent of agreement between the modeling and test data. 1. INTRODUCTION In recent years, fuel consumption has increased significantly due to the growth of the population. A solution to address this problem is the underground storage of natural gas. The first step to reach this goal is to select suitable places for the storage. The storage should be carried out in a way that the excess of natural gas is stored in the underground storage during the hot and low consumption seasons, to use the stored gas during the high consumption periods. In this study, the site selection for the underground natural gas reservoirs has been carried out using multi-criteria decision making in a GIS environment. Zangeneh et al., (2011) selected the optimum sites for underground reservoirs of natural gas using a GIS-based approach. They proposed the suitable sites for underground reservoirs of natural gas using Boolean logic and Index Overlay (IO) methods in a GIS-based framework and showed that IO concludes better results. Anagnostopoulos et al., (2008) surveyed the linguistic multi-criteria decision making using fuzzy set theory, the ideal solution and the anti-ideal solution in the site selection problem. They found the ambiguity of data using the linguistic variables, then involved human decision making by the development of decision-making rules and their modeling of using fuzzy functions. Their proposed method considered the ideal solution and the anti-ideal solution and assessed each alternative regarding distance as well as similarity to the ideal solution and the anti-ideal solution. The distance and similarity measured for fuzzy numbers were used, and the decision rules guided their aggregation to construct decision functions. Further, Ordered weighted Averaging (OWA) operators with maximal entropy were used to aggregate across all criteria and determine the overall score of each alternative, designed a new spatial multi-criteria decision analysis (SMCDA) software tool for selecting suitable sites for Managed Aquifer Recharge (MAR) systems. Their new SMCDA software tool functions based on the combination of existing multi- criteria evaluation methods with modern decision analysis techniques including non-compensatory screening, criteria standardization and weighting where AHP has been combined with WLC and OWA. Eldrandaly & AL-Amari, (2014) presented a novel decision-making framework in which Expert Systems (ES), and GIS–based multi-criteria evaluation techniques (Analytical Network Process (ANP) and fuzzy quantifiers-guided OWA operators (GIS-based ANP-OWA)) were integrated systematically to facilitate the selection of suitable sites for building new tourism facilities. First, ES was used for recommending the proper site selection criteria and their interdependence relationships. Then, the GIS-based ANP- OWA was used to perform the spatial data analysis necessary to generate a wide range of possible candidate sites scenarios taking into accounts both the interdependence relationships between sitting criteria and the level of risk the decision-makers wish to assume in their multi-criteria evaluation. Gorsevski et al., (2012) presented a GIS-based multi-criteria decision analysis approach for evaluating the suitability for landfill site selection in the Polog Region, Macedonia. Their multi-criteria decision framework considered environmental and economic factors which were standardized by fuzzy membership functions and combined with integration of AHP and OWA techniques. The AHP was used for the elicitation of generate a wide range of decision alternatives for addressing uncertainty associated with the interaction between and among multiple criteria. The usefulness of the approach was illustrated The International Archives of the Photogrammetry, Remote Sensing and Spatial Information Sciences, Volume XLII-4/W4, 2017 Tehran's Joint ISPRS Conferences of GI Research, SMPR and EOEC 2017, 7–10 October 2017, Tehran, Iran This contribution has been peer-reviewed. https://doi.org/10.5194/isprs-archives-XLII-4-W4-463-2017 | © Authors 2017. CC BY 4.0 License. 463

Welcome message from author
This document is posted to help you gain knowledge. Please leave a comment to let me know what you think about it! Share it to your friends and learn new things together.
Transcript

GIS-BASED SITE SELECTION FOR UNDERGROUND NATURAL RESOURCES USING
FUZZY AHP-OWA
Sabzevari, A. R.a and M. R. Delavar b
a GIS Dept., School of Surveying and Geospatial Eng., College of Eng., University of Tehran, Tehran, Iran-
[email protected] b Center of Excellence in Geomatics Eng. in Disaster Management, School of Surveying and Geospatial Eng., College of Eng.,
University of Tehran, Tehran, Iran -
commission IV, WG IV/3
KEY WORDS: Site Selection, Natural Resource, Multi-Criteria Decision Making, Ordered Weighted Average, Fuzzy AHP, Fuzzy
AHP-OWA
ABSTRACT:
Fuel consumption has significantly increased due to the growth of the population. A solution to address this problem is the
underground storage of natural gas. The first step to reach this goal is to select suitable places for the storage. In this study, site
selection for the underground natural gas reservoirs has been performed using a multi-criteria decision-making in a GIS
environment. The “Ordered Weighted Average” (OWA) operator is one of the multi-criteria decision-making methods for ranking
the criteria and consideration of uncertainty in the interaction among the criteria. In this paper, Fuzzy AHP_OWA (FAHP_OWA) is
used to determine optimal sites for the underground natural gas reservoirs. Fuzzy AHP_OWA considers the decision maker’s risk
taking and risk aversion during the decision-making process. Gas consumption rate, temperature, distance from main transportation
network, distance from gas production centers, population density and distance from gas distribution networks are the criteria used in
this research. Results show that the northeast and west of Iran and the areas around Tehran (Tehran and Alborz Provinces) have a
higher attraction for constructing a natural gas reservoir. The performance of the used method was also evaluated. This evaluation
was performed using the location of the existing natural gas reservoirs in the country and the site selection maps for each of the
quantifiers. It is verified that the method used in this study is capable of modeling different decision-making strategies used by the
decision maker with about 88 percent of agreement between the modeling and test data.
1. INTRODUCTION
In recent years, fuel consumption has increased significantly
due to the growth of the population. A solution to address this
problem is the underground storage of natural gas. The first step
to reach this goal is to select suitable places for the storage. The
storage should be carried out in a way that the excess of natural
gas is stored in the underground storage during the hot and low
consumption seasons, to use the stored gas during the high
consumption periods. In this study, the site selection for the
underground natural gas reservoirs has been carried out using
multi-criteria decision making in a GIS environment.
Zangeneh et al., (2011) selected the optimum sites for
underground reservoirs of natural gas using a GIS-based
approach. They proposed the suitable sites for underground
reservoirs of natural gas using Boolean logic and Index Overlay
(IO) methods in a GIS-based framework and showed that IO
concludes better results. Anagnostopoulos et al., (2008)
surveyed the linguistic multi-criteria decision making using
fuzzy set theory, the ideal solution and the anti-ideal solution in
the site selection problem. They found the ambiguity of data
using the linguistic variables, then involved human decision
making by the development of decision-making rules and their
modeling of using fuzzy functions. Their proposed method
considered the ideal solution and the anti-ideal solution and
assessed each alternative regarding distance as well as similarity
to the ideal solution and the anti-ideal solution. The distance
and similarity measured for fuzzy numbers were used, and the
decision rules guided their aggregation to construct decision
functions. Further, Ordered weighted Averaging (OWA)
operators with maximal entropy were used to aggregate across
all criteria and determine the overall score of each alternative,
designed a new spatial multi-criteria decision analysis
(SMCDA) software tool for selecting suitable sites for Managed
Aquifer Recharge (MAR) systems. Their new SMCDA software
tool functions based on the combination of existing multi-
criteria evaluation methods with modern decision analysis
techniques including non-compensatory screening, criteria
standardization and weighting where AHP has been combined
with WLC and OWA. Eldrandaly & AL-Amari, (2014)
presented a novel decision-making framework in which Expert
Systems (ES), and GIS–based multi-criteria evaluation
techniques (Analytical Network Process (ANP) and fuzzy
quantifiers-guided OWA operators (GIS-based ANP-OWA))
were integrated systematically to facilitate the selection of
suitable sites for building new tourism facilities. First, ES was
used for recommending the proper site selection criteria and
their interdependence relationships. Then, the GIS-based ANP-
OWA was used to perform the spatial data analysis necessary to
generate a wide range of possible candidate sites scenarios
taking into accounts both the interdependence relationships
between sitting criteria and the level of risk the decision-makers
wish to assume in their multi-criteria evaluation. Gorsevski et
al., (2012) presented a GIS-based multi-criteria decision
analysis approach for evaluating the suitability for landfill site
selection in the Polog Region, Macedonia. Their multi-criteria
decision framework considered environmental and economic
factors which were standardized by fuzzy membership functions
and combined with integration of AHP and OWA techniques.
The AHP was used for the elicitation of generate a wide range
of decision alternatives for addressing
uncertainty associated with the interaction between and among
multiple criteria. The usefulness of the approach was illustrated
The International Archives of the Photogrammetry, Remote Sensing and Spatial Information Sciences, Volume XLII-4/W4, 2017 Tehran's Joint ISPRS Conferences of GI Research, SMPR and EOEC 2017, 7–10 October 2017, Tehran, Iran
This contribution has been peer-reviewed. https://doi.org/10.5194/isprs-archives-XLII-4-W4-463-2017 | © Authors 2017. CC BY 4.0 License. 463

by different OWA scenarios that report landfill suitability on a
scale between 0 and 1. The OWA scenarios were intended to
quantify the level of risk taking (i.e., optimistic, pessimistic, and
neutral) and to facilitate a better understanding of patterns that
emerge from the decision alternatives involved in the decision-
making process. Soltanalizadeh et al., (2014) selected the best
site for a natural cave suitable for petroleum storage using a
combination of Fuzzy AHP and TOPSIS1. Zhou & Wu, (2012)
selected a site for building a new hospital in Haidian District of
Beijing using GIS-based Multi-Criteria Analysis (MCA). Using
AHP and Rank Order Method (ROM) for the weight setting on
factor criteria, necessity tests, and sensitivity tests were applied
to check which criteria are necessary and how the results are
sensitive to their weight change. They concluded that GIS-based
MCA with necessity and sensitivity tests proposes a novel and
useful reference to other site selection decision makers, and also
provides constructive tools for the public administration to set
up efficient databases for decision makers to carry out spatial
analyses. Grataloup et al., (2009) determined the optimum site
for CO2 underground storage in deep saline aquifers in Paris.
They considered two criteria classified into “killer criteria” and
“site-qualification criteria”, whose combinations allowed
identifying potential sites and the most appropriate ones.
Malczewski, (2006) analyzed the land-use suitability using GIS-
based multi-criteria evaluation and used OWA method with
fuzzy quantifiers in his study. He showed that how different
decision-makings (derived from different quantifiers including
“all”, “almost all”, “most”, “half”, “a few”, “at least a few” and
“at least one”) can produce different results and compared the
maps of these results together. Farazmanesh et al., (2010)
located the public parking in Isfahan using GIS, multi-criteria
decision-making, and fuzzy logic. Rajabi et al., (2011)
compared some multi-criteria decision-making methods
including AHP, AHP-OWA and Fuzzy AHP-OWA for
residential complex site selection in Tabriz and concluded that
Fuzzy AHP-OWA is the best method for residential complex
site selection; because it considers risk-taking of decision
makers and uses Fuzzy conceptual quantifiers.
2. FUZZY ANALYTIC HIERARCHY PROCESS (FAHP)
Fuzzy Analytic Hierarchy Process2 embeds the fuzzy theory to
Analytic Hierarchy Process3, which was advanced by Saaty
Saaty, (1980). AHP is a broadly used decision-making method
in numerous multi-criteria decision-making issues. It takes the
pair-wise comparisons of various alternatives with relevant to
different criteria and produces a decision support method for
multicriteria decision issues. In a general AHP model, the goal
is on the first level, the criteria are on the second level and sub-
criteria are on the third level. Finally, the alternatives are on the
fourth level Kilincci & Onal, (2011).
Since basic AHP does not comprise ambiguity for personal
decisions, it has been developed by profiting from the fuzzy
logic approach. In FAHP, the pairwise comparisons of criteria
and the alternatives are carried out through the linguistic
variables, which are described by triangular numbers Kilincci &
Onal, (2011). One of the earliest fuzzy AHP application was
conducted by Van Laarhoven & Pedrycz, (1983). They
represented the triangular membership functions for the
pairwise comparisons. Later, Buckley, (1985) has contributed to
the issue by defining the fuzzy priorities of comparison
1 Technique for Order Preference by Similarity to Ideal Solution
2 FAHP 3 AHP
proportions having triangular membership functions. Chang,
(1996) also presented a new approach associated to the usage
of triangular numbers in pair-wise comparisons. Eventhough,
there are some more techniques embedded in FAHP, within the
scope of this study, Buckley’s methods (Buckley, (1985)) is
applied to define the relative prominence weights for both the
criteria and the alternatives.
3. OREDERED WEIGHTED AVERAGING (OWA)
In all decision making problems several criteria should be
considered Zarghami et al., (2008). The GIS-based multicriteria
evaluation procedures involve a set of spatially defined
alternatives (e.g. parcels of land) and a set of evaluation criteria
represented as map layers Malczewski, (2006).
OWA method is one of the multi-criteria decision making
methods Yager, (1988). Yager (1988) Yager, (1988) introduced
OWA operators. OWA is a method for ordering criteria and
considering uncertainty in the critera interaction Gorsevski et
al., (2012).
Given the input data ( criterion map layers and criterion
weights), the OWA operator is defined as OWA: R R
function. With a set of order weights 1 2, ,..., nw w w w such
that [0,1]jw and
1
1j
j
w
, 1,2,...,j n and also with
having input data 1 2, ,..., nX x x x , OWA operator is defined
as Eq. 1 Yager, (1988):
,j i jjOWA w z (1)
Where 1 2 ...i i inz z z is the descending arranges set of
X Malczewski et al., (2003; Yager, (1988).
4. QUANTIFIER-GUIDED OWA OPERATORS
Quantifier-guided OWA achieved by integrating fuzzy
linguistic quantifiers with OWA operators. Different quantifiers
could be divided into two major groups: (a) absolute quantifiers
for linguistic variables like “about 7” and “almost 4”, and (b)
relative quantifiers like “some” and “half”. In this research, a
class of relative quantifiers, named “Regular Increasing
Monotone (RIM)” is used. For describing this class of
quantifiers, Eq. 2 could be applied (Fullér, (1996)):
( ) ,Q p p 0≤ p ≤1 and α≥0 (2)
By varying α, different decision approaches and their operators
could be obtained. Different decision approaches and their
matching α have been showed in Table 1. Malczewski, (2006):
Table 1. Different decision strategies and their matching .
decision strategy α
at least one 0.0001
few 0.5
half 1
most 2
all 1000
The order weights vector v can be obtained from RIM
quantifiers. Visit Eq.3 Malczewski, (2006):
The International Archives of the Photogrammetry, Remote Sensing and Spatial Information Sciences, Volume XLII-4/W4, 2017 Tehran's Joint ISPRS Conferences of GI Research, SMPR and EOEC 2017, 7–10 October 2017, Tehran, Iran
This contribution has been peer-reviewed. https://doi.org/10.5194/isprs-archives-XLII-4-W4-463-2017 | © Authors 2017. CC BY 4.0 License.
464

1
1 1
1 1
j j
k k
k k
j n n
k k
k k
w w
v
w w
(3)
Where w is the relative criteria weights vector. Since the
relative weights applied in this reaearch is obtained by AHP
weighting approach, w will be a normal vector and as a result
1
1n
k
k
w
. Therefore, Eq. 3 abridged to Eq.4:
1
1 1
( ) ( )j j
j k k
k k
v w w
(4)
5. METHODOLOGY
In this method, the OWA method is used to collect information.
The Q-OWA method (Section 4) is used for computing the
ordered weights. As mentioned in Section 3, the computation of
ordered weight is done using Eq. 4 in which α is the decision
parameter, and by its variation, different decision strategies
could be taken (Table 1).
As mentioned is section 3, the values of the w vector, are the
criterion weights. Consequently, to use the Q-OWA method, the
criterion weights should be present. In this part of the research,
the weight of the criteria has been determined using the Fuzzy
AHP method.
To determine the weight of the criteria according to the Fuzzy
AHP method, the opinions of ten experts in the natural gas
reservoir area were used. A comparison among the criteria was
carried out and according to the fuzzy AHP method, for each
expert, a weight vector was obtained. Next, the final weight
vector was averaged according to the ten expert opinions. This
weight vector was used as the weight vector of the criteria using
the Q-OWA method.
At this stage, using Table 1, various decision strategies can be
considered using different values for α. In this research, five
decision-making strategies (five quantifiers) have been
employed. With each decision-making strategy, an index map is
obtained. In Section 5, the evaluation of this method has been
investigated.
Figure 1 illustrates research methodology.
Figure1- Steps of site selection using Q-OWA Fuzzy AHP
6. IMPLEMENTATION
Various criteria are involved in the process of locating optimum
gas storage locations. Gas consumption rate, temperature,
distance from main transportation network, distance from gas
production centers, population density and distance from gas
distribution networks are the criteria used in this research.
Experts were asked to define the criteria weights. Opinions of
ten experts are combined by the fuzzy analytical hierarchy
process and the weight for each criterion is determined. OWA
method is used to aggregate the weights, and for each expert, a
weighing vector is computed. Table 2 shows the final criteria
weights.
Table 2- Criteria weights computed by Fuzzy-AHP method
Weight Criterion 0.28 Gas consumption 0.23 Population density 0.09 Distance from gas production
centers 0.1 Temperature
0.08 Distance from the main road
network 0.22 Distance from gas pipeline
By computing the weights using Fuzzy-AHP method, the
ordered weights are computed by Q-OWA method. In fact, the
fuzzy-AHP weights are inputs of the Q-OWA. At this stage, a
decision strategy should be adopted.
For the weight vector w and with the decision strategy “Most”
( 2 ), we have:
{0.078 , 0.182 , 0.1 , 0.13 , 0.118 , 0.392}v
The vector v contains the ordered weights. These weights
should be normalized and ordered descendingly. After
normalizing the values of each criterion map cells, the cell
values ranged between zero and one. In the next step, the cost
and benefit criteria should be determined. Gas consumption and
population are profit criteria in this research. Cell values for the
six criteria were ordered by the Eq. 1 as the vector u.
In the final step, the criteria weights were aggregated by OWA
operator. The aggregation process is done by Cartesian product
of ordered criteria values (u vector) and ordered weights (w):
.iOWA v u
Where the OWAi is the final weight of the cell, v is weight
vector constructed from combination of the weights computed
by Fuzzy-AHP and OWA fuzzy conceptual quantifiers. “u” is
the values of the criteria for a cell ordered in a descending
manner.
The decision strategies used in Q-OWA method are shown in
Table 1.
For each decision strategy in Table 2, a map showing the
optimum locations of the natural gas reservoir was produced.
These maps are shown in Figures 2 to 6.
The International Archives of the Photogrammetry, Remote Sensing and Spatial Information Sciences, Volume XLII-4/W4, 2017 Tehran's Joint ISPRS Conferences of GI Research, SMPR and EOEC 2017, 7–10 October 2017, Tehran, Iran
This contribution has been peer-reviewed. https://doi.org/10.5194/isprs-archives-XLII-4-W4-463-2017 | © Authors 2017. CC BY 4.0 License.
465
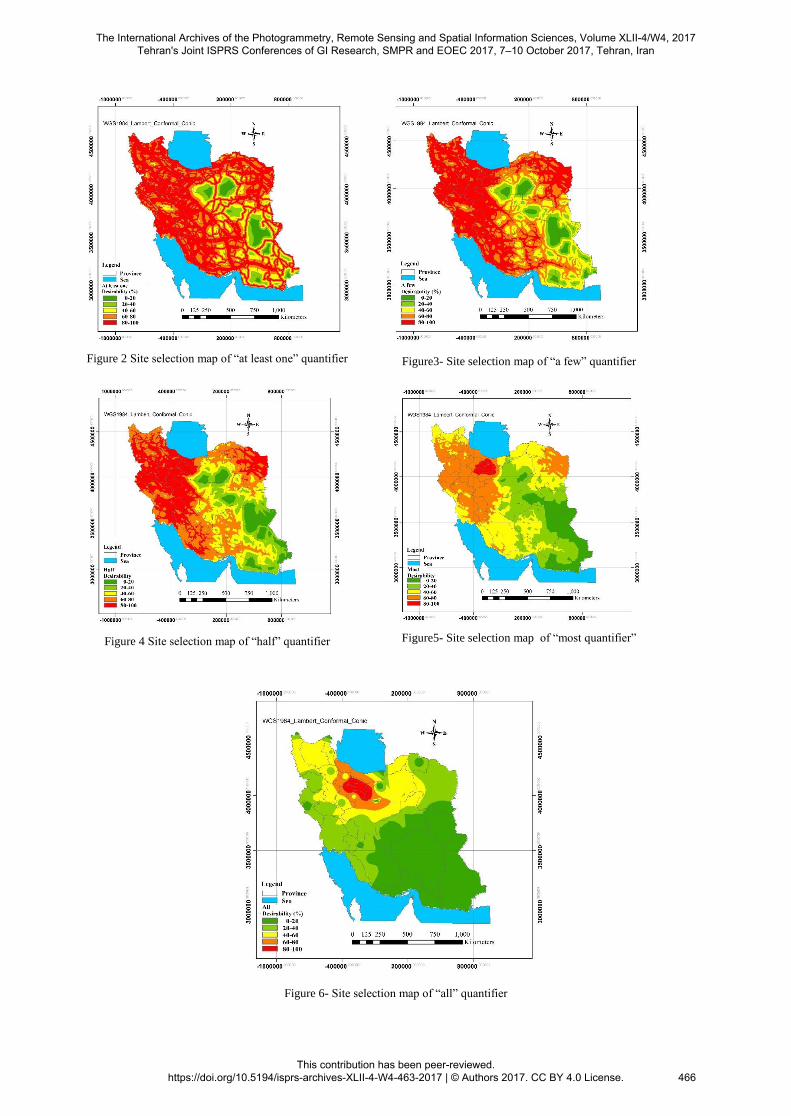
Figure 2 Site selection map of “at least one” quantifier
Figure3- Site selection map of “a few” quantifier
Figure 4 Site selection map of “half” quantifier
Figure5- Site selection map of “most quantifier”
Figure 6- Site selection map of “all” quantifier
The International Archives of the Photogrammetry, Remote Sensing and Spatial Information Sciences, Volume XLII-4/W4, 2017 Tehran's Joint ISPRS Conferences of GI Research, SMPR and EOEC 2017, 7–10 October 2017, Tehran, Iran
This contribution has been peer-reviewed. https://doi.org/10.5194/isprs-archives-XLII-4-W4-463-2017 | © Authors 2017. CC BY 4.0 License.
466
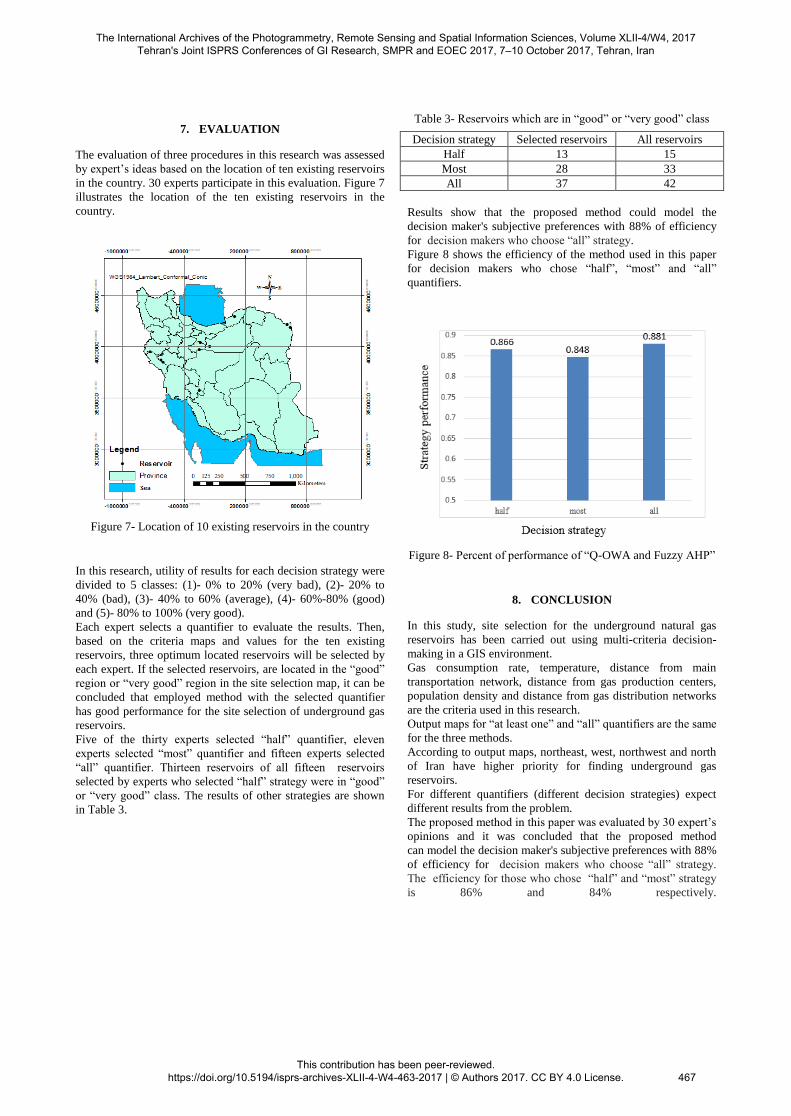
7. EVALUATION
The evaluation of three procedures in this research was assessed
by expert’s ideas based on the location of ten existing reservoirs
in the country. 30 experts participate in this evaluation. Figure 7
illustrates the location of the ten existing reservoirs in the
country.
Figure 7- Location of 10 existing reservoirs in the country
In this research, utility of results for each decision strategy were
divided to 5 classes: (1)- 0% to 20% (very bad), (2)- 20% to
40% (bad), (3)- 40% to 60% (average), (4)- 60%-80% (good)
and (5)- 80% to 100% (very good).
Each expert selects a quantifier to evaluate the results. Then,
based on the criteria maps and values for the ten existing
reservoirs, three optimum located reservoirs will be selected by
each expert. If the selected reservoirs, are located in the “good”
region or “very good” region in the site selection map, it can be
concluded that employed method with the selected quantifier
has good performance for the site selection of underground gas
reservoirs.
Five of the thirty experts selected “half” quantifier, eleven
experts selected “most” quantifier and fifteen experts selected
“all” quantifier. Thirteen reservoirs of all fifteen reservoirs
selected by experts who selected “half” strategy were in “good”
or “very good” class. The results of other strategies are shown
in Table 3.
Table 3- Reservoirs which are in “good” or “very good” class
Decision strategy Selected reservoirs All reservoirs
Half 13 15
Most 28 33
All 37 42
Results show that the proposed method could model the
decision maker's subjective preferences with 88% of efficiency
for decision makers who choose “all” strategy.
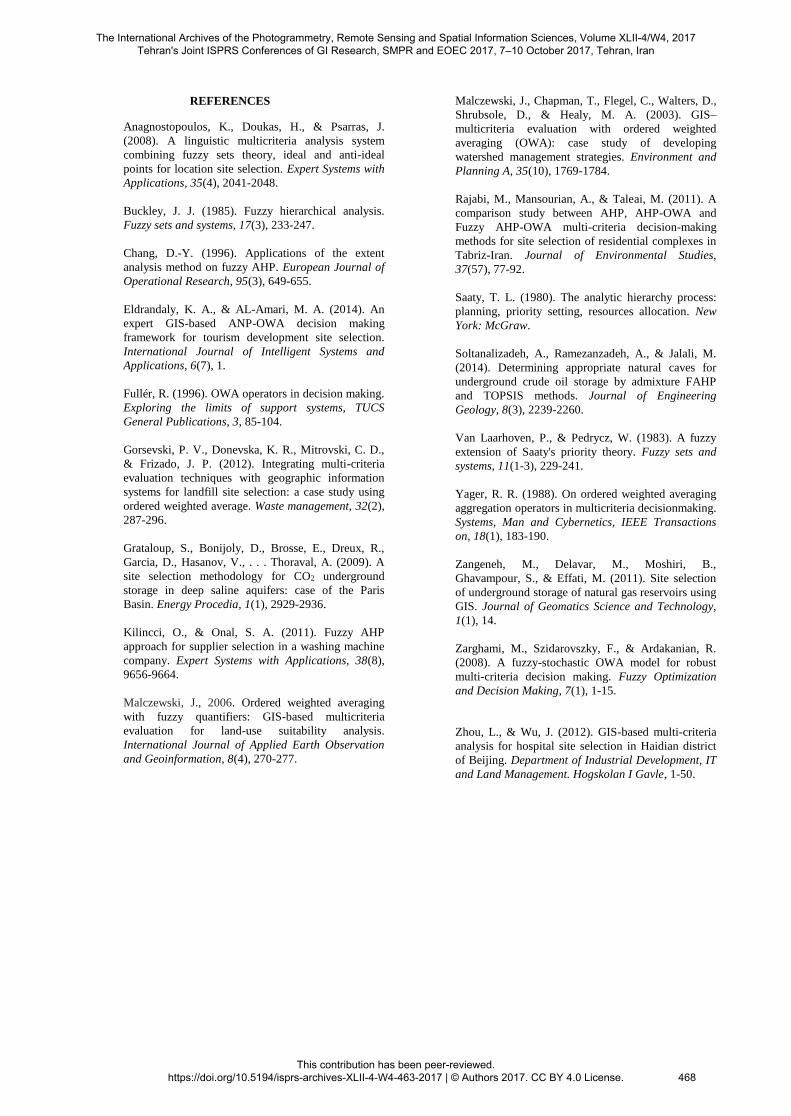
Figure 8 shows the efficiency of the method used in this paper
for decision makers who chose “half”, “most” and “all”
quantifiers.
Figure 8- Percent of performance of “Q-OWA and Fuzzy AHP”
8. CONCLUSION
In this study, site selection for the underground natural gas
reservoirs has been carried out using multi-criteria decision-
making in a GIS environment.
Gas consumption rate, temperature, distance from main
transportation network, distance from gas production centers,
population density and distance from gas distribution networks
are the criteria used in this research.
Output maps for “at least one” and “all” quantifiers are the same
for the three methods.
According to output maps, northeast, west, northwest and north
of Iran have higher priority for finding underground gas
reservoirs.
For different quantifiers (different decision strategies) expect
different results from the problem.
The proposed method in this paper was evaluated by 30 expert’s
opinions and it was concluded that the proposed method
can model the decision maker's subjective preferences with 88%
of efficiency for decision makers who choose “all” strategy.
The efficiency for those who chose “half” and “most” strategy
is 86% and 84% respectively.
The International Archives of the Photogrammetry, Remote Sensing and Spatial Information Sciences, Volume XLII-4/W4, 2017 Tehran's Joint ISPRS Conferences of GI Research, SMPR and EOEC 2017, 7–10 October 2017, Tehran, Iran
This contribution has been peer-reviewed. https://doi.org/10.5194/isprs-archives-XLII-4-W4-463-2017 | © Authors 2017. CC BY 4.0 License.
467
REFERENCES
Anagnostopoulos, K., Doukas, H., & Psarras, J.
(2008). A linguistic multicriteria analysis system
combining fuzzy sets theory, ideal and anti-ideal
points for location site selection. Expert Systems with
Applications, 35(4), 2041-2048.
Buckley, J. J. (1985). Fuzzy hierarchical analysis.
Fuzzy sets and systems, 17(3), 233-247.
Chang, D.-Y. (1996). Applications of the extent
analysis method on fuzzy AHP. European Journal of
Operational Research, 95(3), 649-655.
Eldrandaly, K. A., & AL-Amari, M. A. (2014). An
expert GIS-based ANP-OWA decision making
framework for tourism development site selection.
International Journal of Intelligent Systems and
Applications, 6(7), 1.
Fullér, R. (1996). OWA operators in decision making.
Exploring the limits of support systems, TUCS
General Publications, 3, 85-104.
Gorsevski, P. V., Donevska, K. R., Mitrovski, C. D.,
& Frizado, J. P. (2012). Integrating multi-criteria
evaluation techniques with geographic information
systems for landfill site selection: a case study using
ordered weighted average. Waste management, 32(2),
287-296.
Grataloup, S., Bonijoly, D., Brosse, E., Dreux, R.,
Garcia, D., Hasanov, V., . . . Thoraval, A. (2009). A
site selection methodology for CO2 underground
storage in deep saline aquifers: case of the Paris
Basin. Energy Procedia, 1(1), 2929-2936.
Kilincci, O., & Onal, S. A. (2011). Fuzzy AHP
approach for supplier selection in a washing machine
company. Expert Systems with Applications, 38(8),
9656-9664.
Malczewski, J., 2006. Ordered weighted averaging
with fuzzy quantifiers: GIS-based multicriteria
evaluation for land-use suitability analysis.
International Journal of Applied Earth Observation
and Geoinformation, 8(4), 270-277.
Malczewski, J., Chapman, T., Flegel, C., Walters, D.,
Shrubsole, D., & Healy, M. A. (2003). GIS–
multicriteria evaluation with ordered weighted
averaging (OWA): case study of developing
watershed management strategies. Environment and
Planning A, 35(10), 1769-1784.
Rajabi, M., Mansourian, A., & Taleai, M. (2011). A
comparison study between AHP, AHP-OWA and
Fuzzy AHP-OWA multi-criteria decision-making
methods for site selection of residential complexes in
Tabriz-Iran. Journal of Environmental Studies,
37(57), 77-92.
Saaty, T. L. (1980). The analytic hierarchy process:
planning, priority setting, resources allocation. New
York: McGraw.
Soltanalizadeh, A., Ramezanzadeh, A., & Jalali, M.
(2014). Determining appropriate natural caves for
underground crude oil storage by admixture FAHP
and TOPSIS methods. Journal of Engineering
Geology, 8(3), 2239-2260.
Van Laarhoven, P., & Pedrycz, W. (1983). A fuzzy
extension of Saaty's priority theory. Fuzzy sets and
systems, 11(1-3), 229-241.
Yager, R. R. (1988). On ordered weighted averaging
aggregation operators in multicriteria decisionmaking.
Systems, Man and Cybernetics, IEEE Transactions
on, 18(1), 183-190.
Zangeneh, M., Delavar, M., Moshiri, B.,
Ghavampour, S., & Effati, M. (2011). Site selection
of underground storage of natural gas reservoirs using
GIS. Journal of Geomatics Science and Technology,
1(1), 14.
Zarghami, M., Szidarovszky, F., & Ardakanian, R.
(2008). A fuzzy-stochastic OWA model for robust
multi-criteria decision making. Fuzzy Optimization
and Decision Making, 7(1), 1-15.
Zhou, L., & Wu, J. (2012). GIS-based multi-criteria
analysis for hospital site selection in Haidian district
of Beijing. Department of Industrial Development, IT
and Land Management. Hogskolan I Gavle, 1-50.
The International Archives of the Photogrammetry, Remote Sensing and Spatial Information Sciences, Volume XLII-4/W4, 2017 Tehran's Joint ISPRS Conferences of GI Research, SMPR and EOEC 2017, 7–10 October 2017, Tehran, Iran
This contribution has been peer-reviewed. https://doi.org/10.5194/isprs-archives-XLII-4-W4-463-2017 | © Authors 2017. CC BY 4.0 License. 468
Related Documents