GIS-Based Land Use Simulation for Biomass Energy Production By Olusegun Osifuye

Welcome message from author
This document is posted to help you gain knowledge. Please leave a comment to let me know what you think about it! Share it to your friends and learn new things together.
Transcript

GIS-Based Land Use Simulation for
Biomass Energy Production
By
Olusegun Osifuye

GIS-Based Land Use Simulation for
Biomass Energy Production
By
Olusegun Osifuye
INTRODUCTION OBJECTIVES METHODOLOGY ANALYSES PROJECTIONS
INTRODUCTION
GIS-Based Land Use Simulation for Biomass Energy Production 3
ARABLE LAND
• Alternate sources of energy
• Biomass for Bio-energy
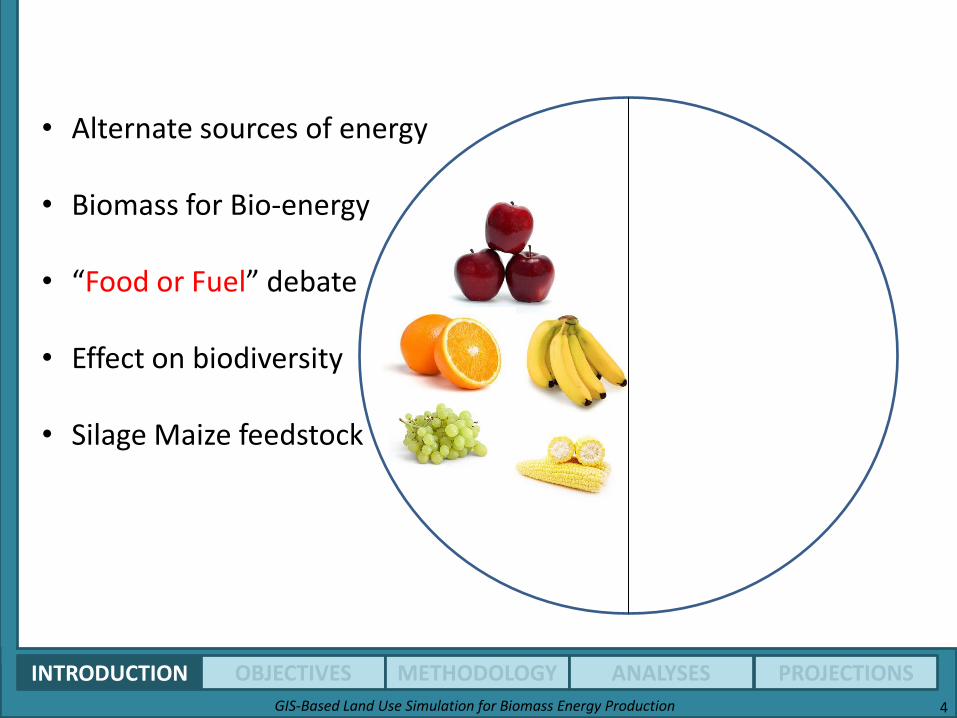
• “Food or Fuel” debate
• Effect on biodiversity
• Silage Maize feedstock
INTRODUCTION
GIS-Based Land Use Simulation for Biomass Energy Production 4
• Alternate sources of energy
• Biomass for Bio-energy
• “Food or Fuel” debate
• Effect on biodiversity
• Silage Maize feedstock
INTRODUCTION
GIS-Based Land Use Simulation for Biomass Energy Production 5
Hochschule für Technik Stuttgart
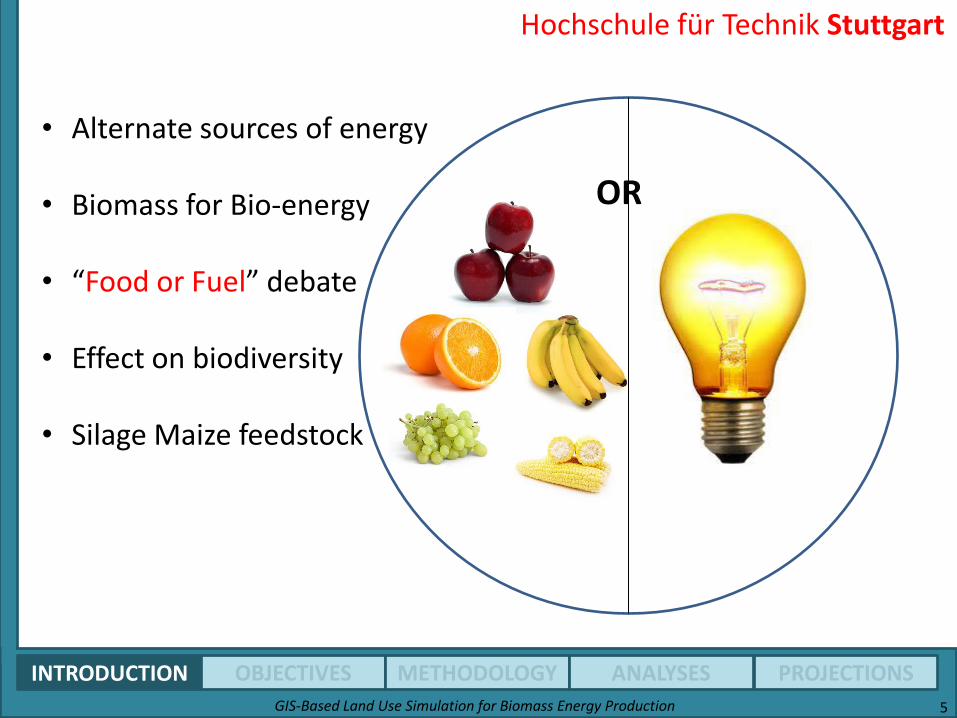
OR
• Alternate sources of energy
• Biomass for Bio-energy
• “Food or Fuel” debate
• Effect on biodiversity
• Silage Maize feedstock
INTRODUCTION
GIS-Based Land Use Simulation for Biomass Energy Production 6
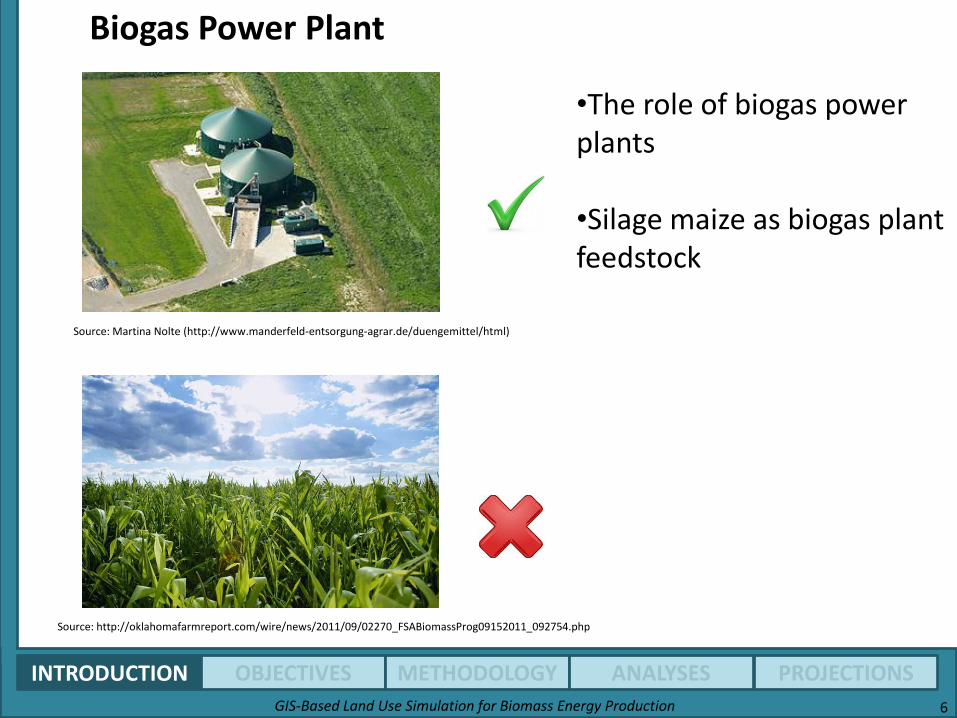
Biogas Power Plant
Source: Martina Nolte (http://www.manderfeld-entsorgung-agrar.de/duengemittel/html)
Source: http://oklahomafarmreport.com/wire/news/2011/09/02270_FSABiomassProg09152011_092754.php
•The role of biogas power plants
•Silage maize as biogas plant feedstock
INTRODUCTION
GIS-Based Land Use Simulation for Biomass Energy Production 7
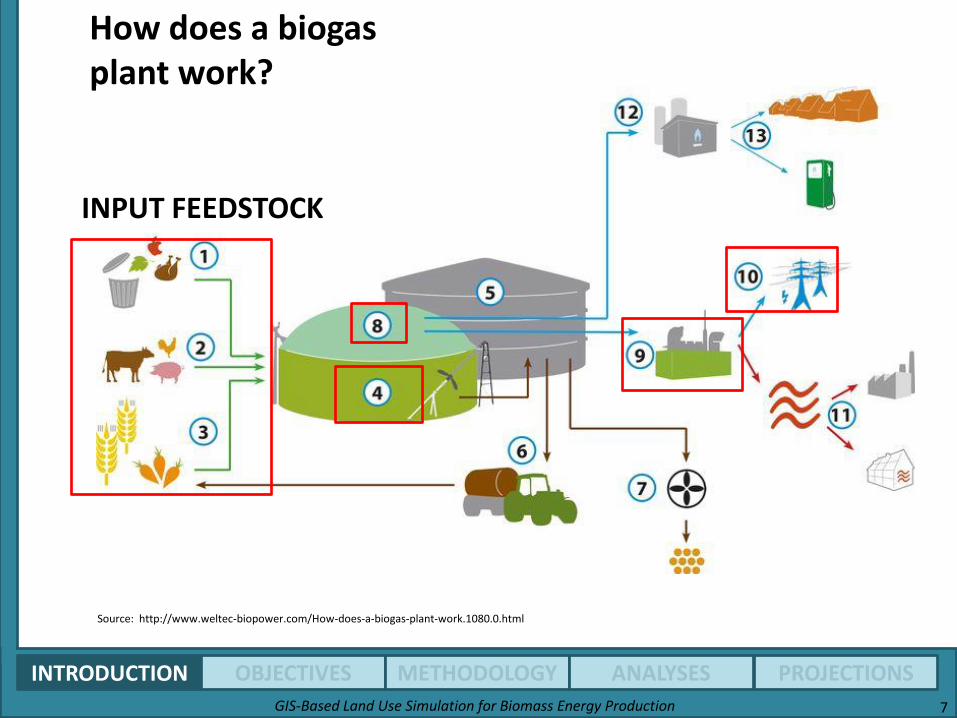
How does a biogas plant work?
Source: http://www.weltec-biopower.com/How-does-a-biogas-plant-work.1080.0.html
INPUT FEEDSTOCK
OBJECTIVES
GIS-Based Land Use Simulation for Biomass Energy Production 8
• To develop a model that calculates the silage maize hectaresin the study area (also applicable to any region) based on a set of assumptions.
• To quantify the effect of silage maize cultivation on bio-energy production for the study area.
• To predict and visualize different land use scenarios based on Several Factors .
METHODOLOGY
GIS-Based Land Use Simulation for Biomass Energy Production 9
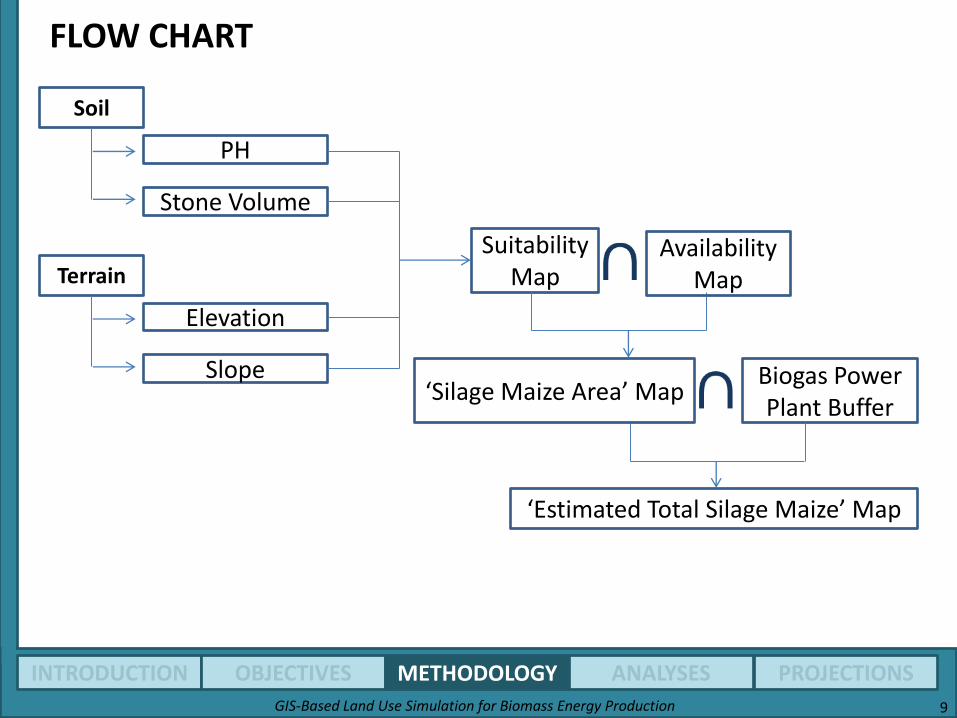
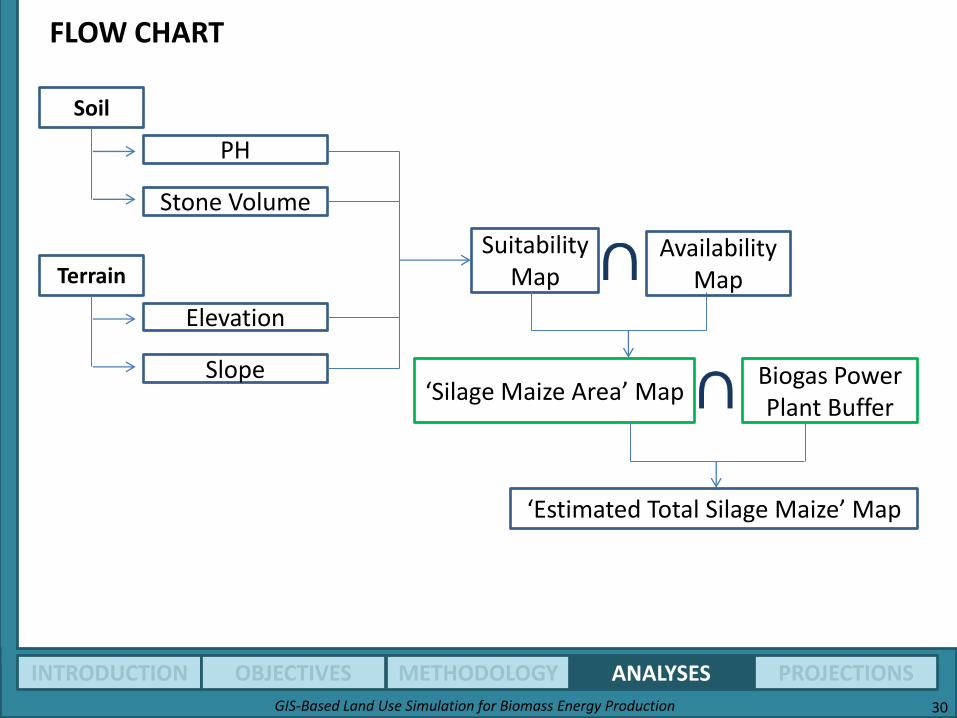
Terrain
Elevation
Slope
Soil
PH
Stone Volume
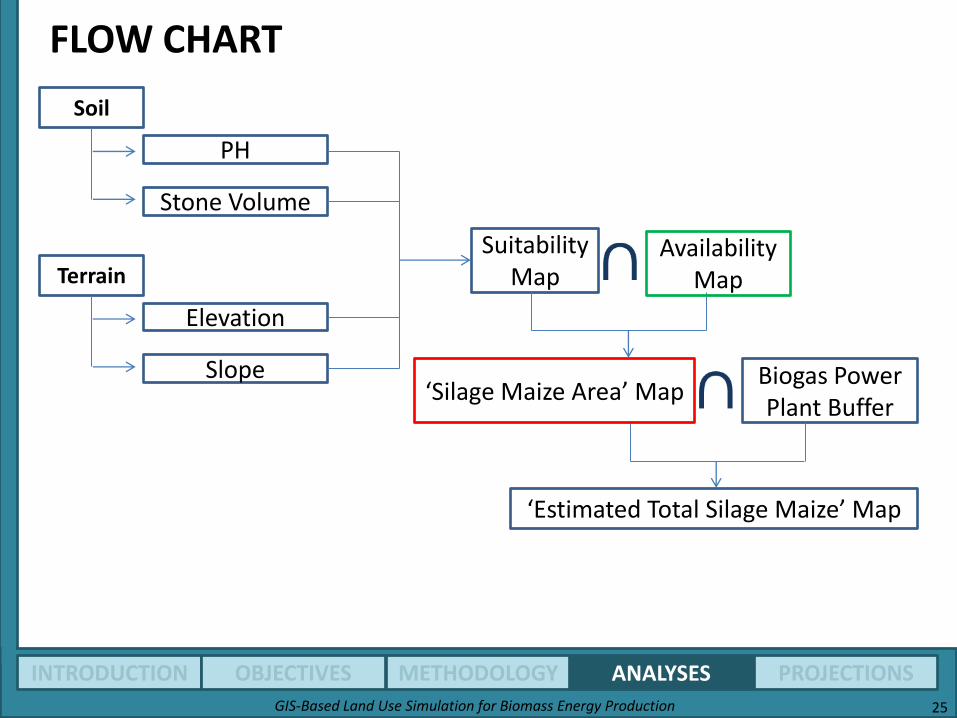
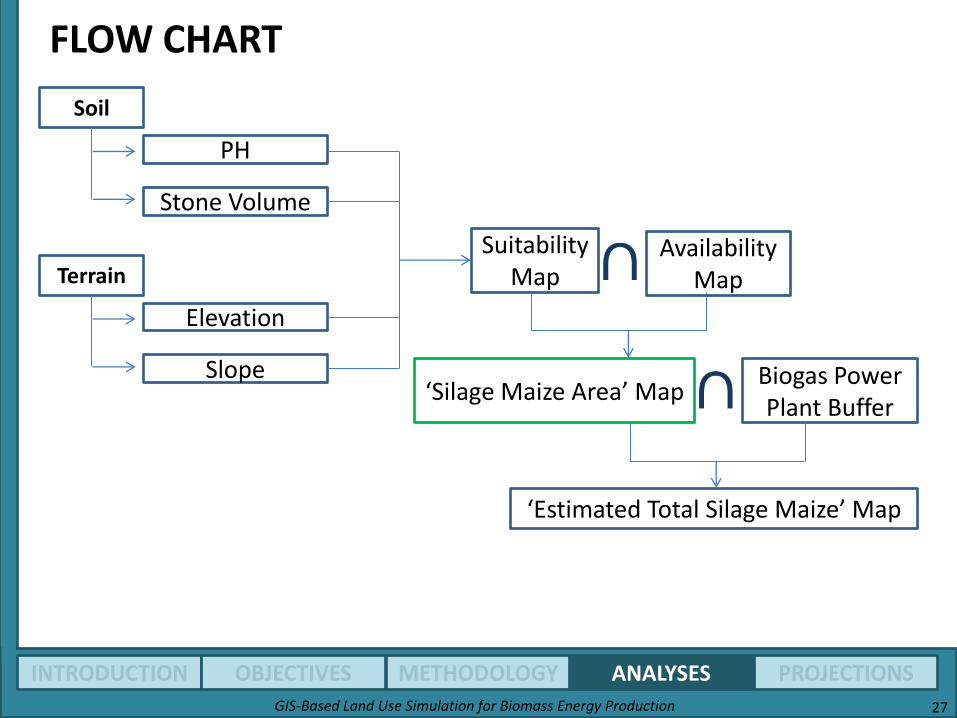
Suitability Map
Biogas Power Plant Buffer
FLOW CHART
‘Estimated Total Silage Maize’ Map
‘Silage Maize Area’ Map
Availability Map

METHODOLOGY
GIS-Based Land Use Simulation for Biomass Energy Production 10
Terrain
Elevation
Slope
Soil
PH
Stone Volume
Suitability Map
Biogas Power Plant Buffer
‘Silage Maize Area’ Map
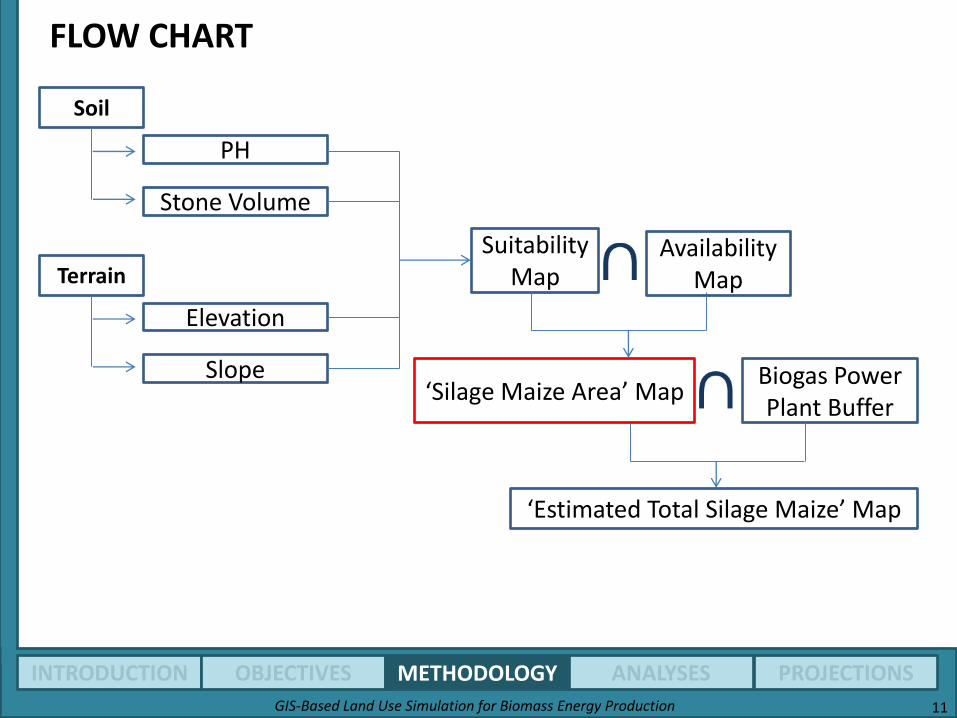
FLOW CHART
‘Estimated Total Silage Maize’ Map
Availability Map
METHODOLOGY
GIS-Based Land Use Simulation for Biomass Energy Production 11
Terrain
Elevation
Slope
Soil
PH
Stone Volume
Suitability Map
Biogas Power Plant Buffer
FLOW CHART
‘Silage Maize Area’ Map
‘Estimated Total Silage Maize’ Map
Availability Map

METHODOLOGY
GIS-Based Land Use Simulation for Biomass Energy Production 12
Model DesignUsing the Model Builder
METHODOLOGY
GIS-Based Land Use Simulation for Biomass Energy Production 13
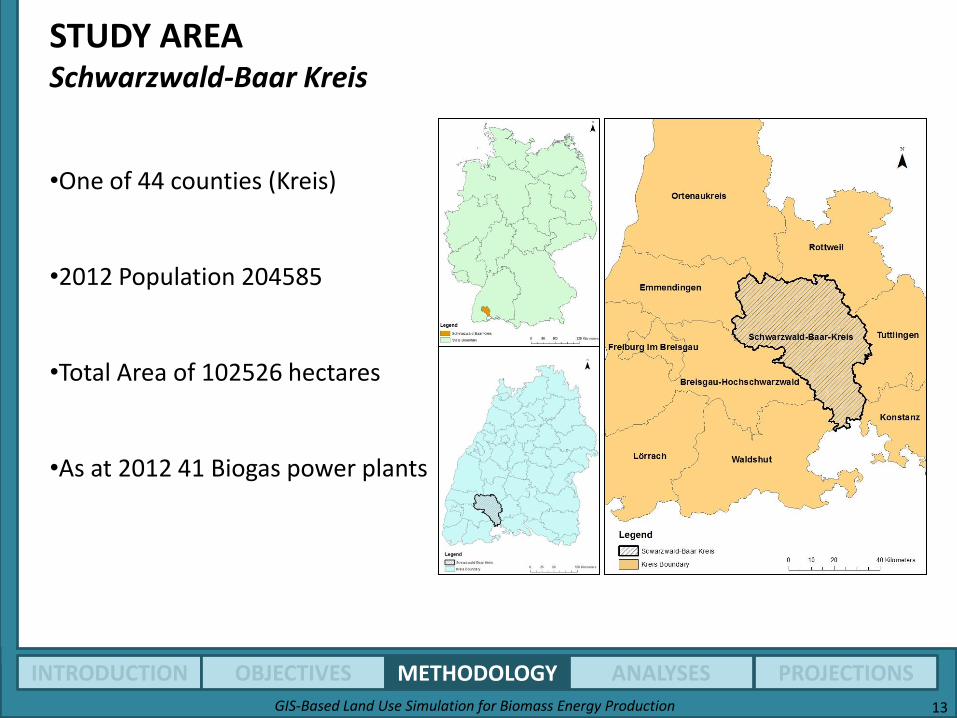
STUDY AREASchwarzwald-Baar Kreis
•One of 44 counties (Kreis)
•2012 Population 204585
•Total Area of 102526 hectares
•As at 2012 41 Biogas power plants
METHODOLOGY
GIS-Based Land Use Simulation for Biomass Energy Production 14
ArcGIS 10.1 Software
Statistical Administrative Data :•Statistical Office of Baden-Württemberg (Statistisches Landesamt Baden-Württemberg)
•State Institute for Development of Agriculture and rural areas [Landesanstalt für Entwicklung der Landwirtschaft und der ländlichen Räume (LEL)]
SOFTWARE / DATA SOURCES
Base Maps •District Office of the Schwarzwald-Baar-Kreis(Landratsamt Schwarzwald-Baar-Kreis).
CORINE Land Use Data from European Environmental Agency
European Soil DatabaseSeveral Datasets from:http://eusoils.jrc.ec.europa.eu/library/data/_Datarequest/ESDB_RasterLibrary.html
25m Raster Digital Elevation Model

ANALYSES
GIS-Based Land Use Simulation for Biomass Energy Production 15
Terrain
Elevation
Slope
Soil
PH
Stone Volume
Suitability Map
Biogas Power Plant Buffer
FLOW CHART
‘Silage Maize Area’ Map
‘Estimated Total Silage Maize’ Map
Availability Map
ANALYSES
GIS-Based Land Use Simulation for Biomass Energy Production 16
Terrain
Elevation
Slope
Soil
PH
Stone Volume
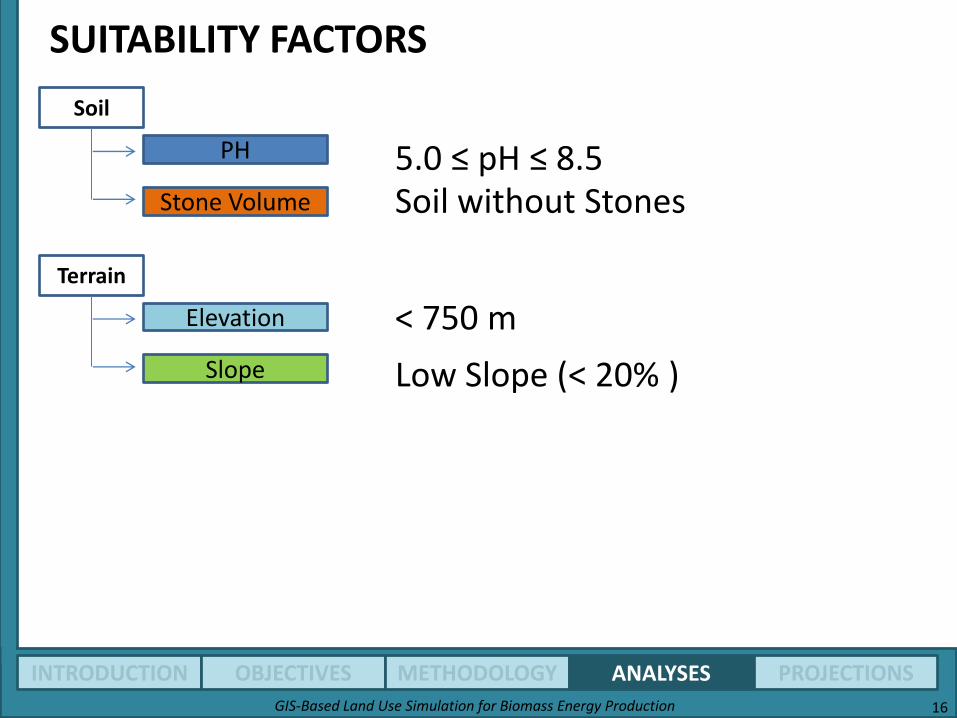
SUITABILITY FACTORS
5.0 ≤ pH ≤ 8.5Soil without Stones
< 750 m
Low Slope (< 20% )
ANALYSES
GIS-Based Land Use Simulation for Biomass Energy Production 17
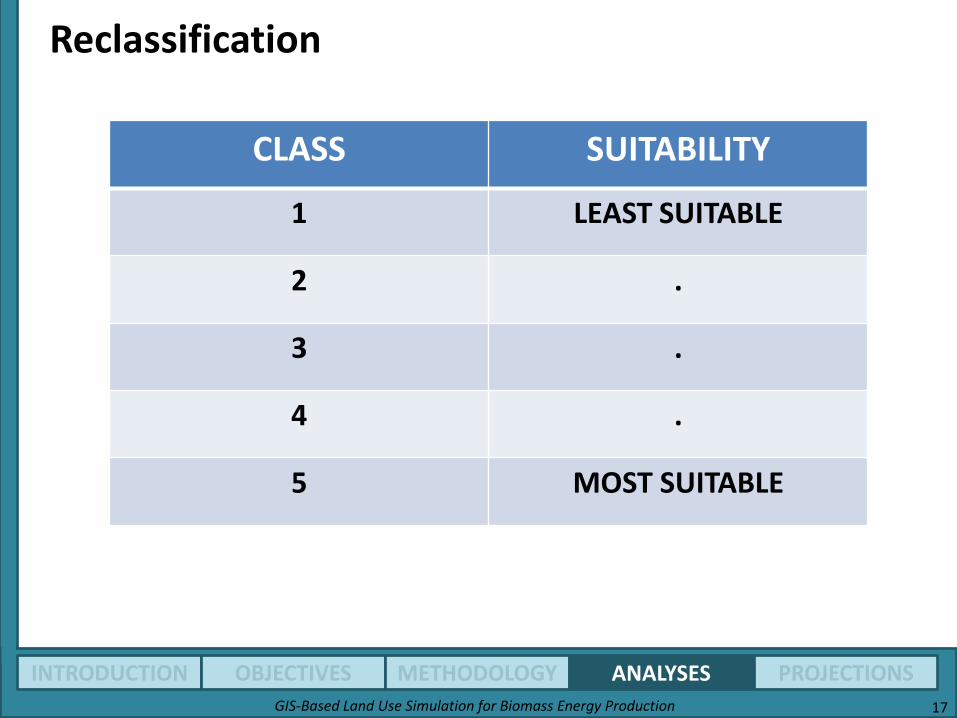
Reclassification
CLASS SUITABILITY
1 LEAST SUITABLE
2 .
3 .
4 .
5 MOST SUITABLE
ANALYSES
GIS-Based Land Use Simulation for Biomass Energy Production 18
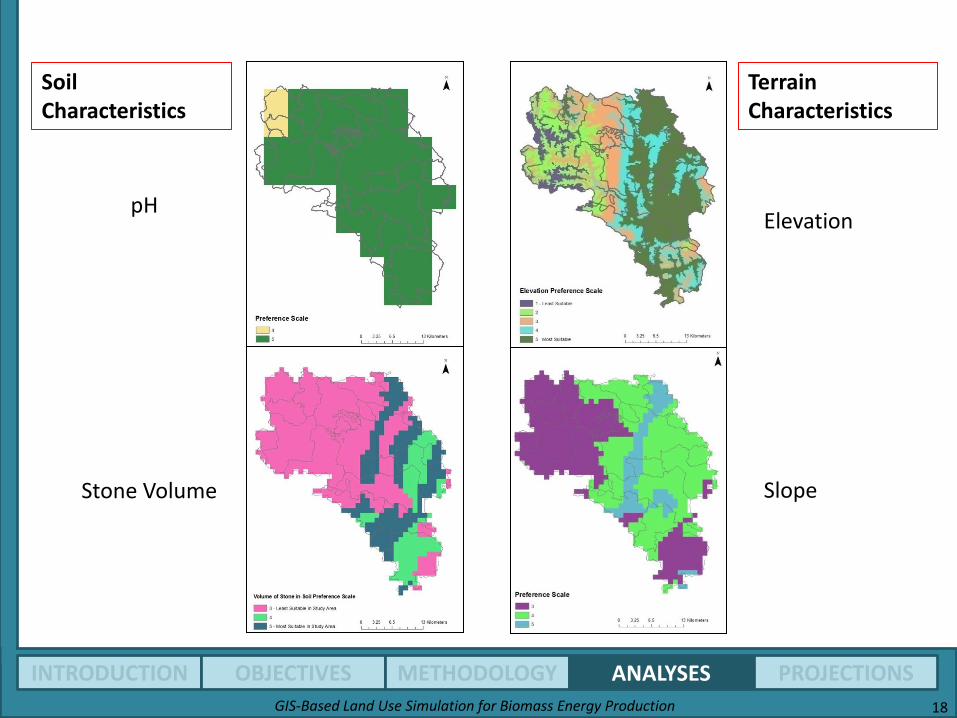
pH
Stone Volume
Elevation
Slope
Soil Characteristics
Terrain Characteristics

ANALYSES
GIS-Based Land Use Simulation for Biomass Energy Production 19
Silage Maize Suitability Map
•Suitability grouped from least suitable to most suitable.
•Identifies area with best suitability based on natural conditions.
ANALYSES
GIS-Based Land Use Simulation for Biomass Energy Production 20
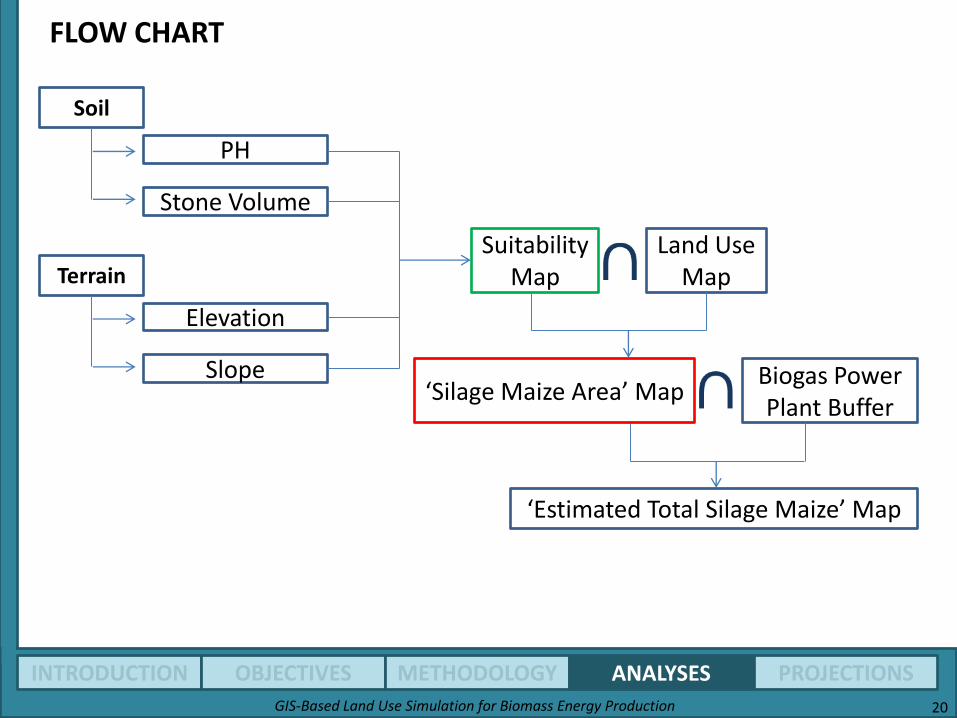
Terrain
Elevation
Slope
Soil
PH
Stone Volume
Suitability Map
Land Use Map
Biogas Power Plant Buffer
FLOW CHART
‘Silage Maize Area’ Map
‘Estimated Total Silage Maize’ Map
ANALYSES
GIS-Based Land Use Simulation for Biomass Energy Production 21
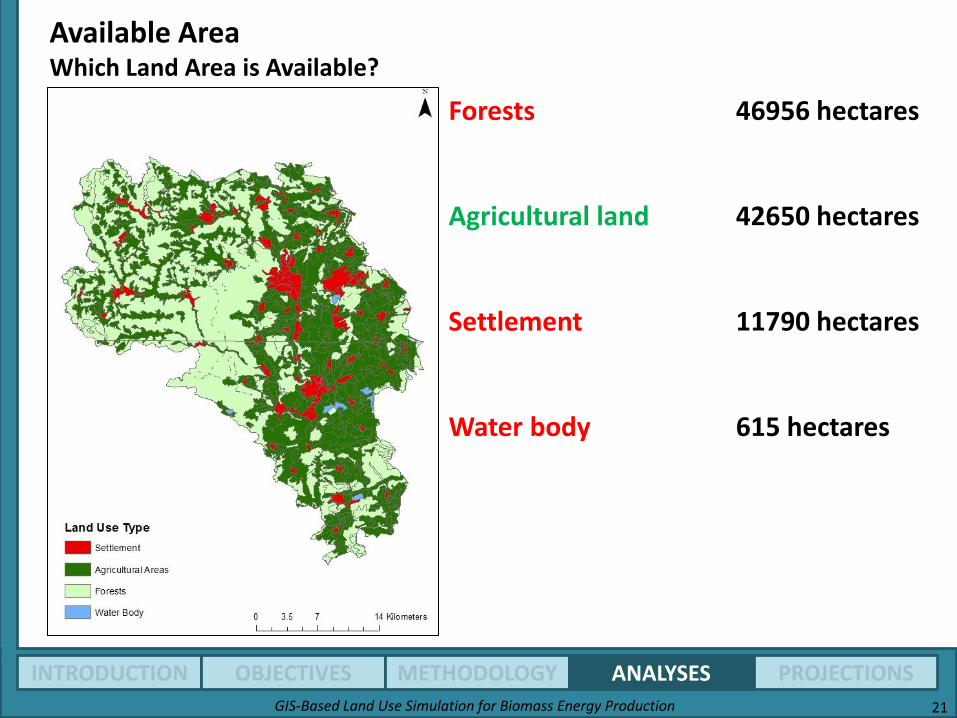
Available AreaWhich Land Area is Available?
Forests 46956 hectares
Agricultural land 42650 hectares
Settlement 11790 hectares
Water body 615 hectares
ANALYSES
GIS-Based Land Use Simulation for Biomass Energy Production 22
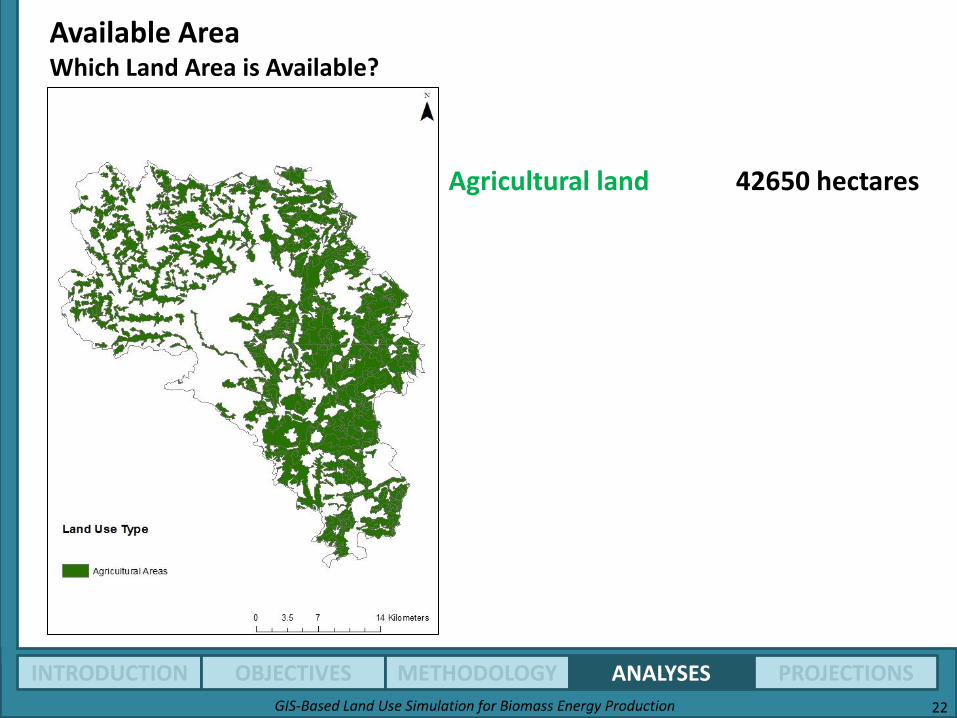
Available AreaWhich Land Area is Available?
Agricultural land 42650 hectares

ANALYSES
GIS-Based Land Use Simulation for Biomass Energy Production 23
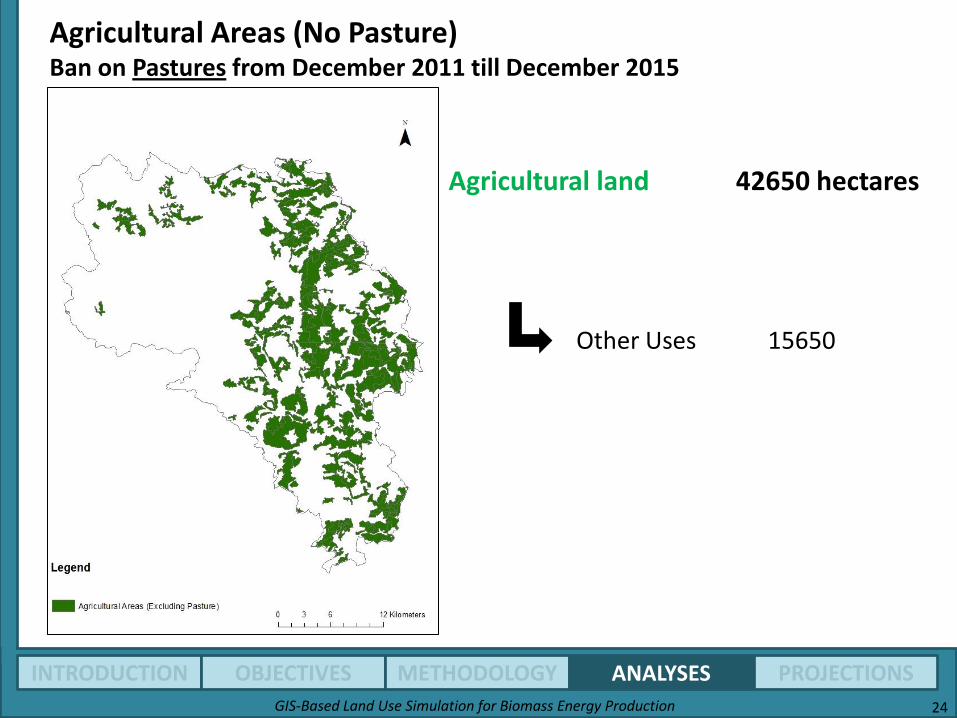
Available AreaBan on Pastures from December 2011 till December 2015
Agricultural land 42650 hectares
Pasture about 27000 ha
Other Uses about 15650 ha
Agricultural land 42650 hectares
ANALYSES
GIS-Based Land Use Simulation for Biomass Energy Production 24
Agricultural Areas (No Pasture)Ban on Pastures from December 2011 till December 2015
Other Uses 15650
GIS-Based Land Use Simulation for Biomass Energy Production 25
Terrain
Elevation
Slope
Soil
PH
Stone Volume
Suitability Map
Biogas Power Plant Buffer
FLOW CHART
ANALYSES
‘Silage Maize Area’ Map
‘Estimated Total Silage Maize’ Map
Availability Map
ANALYSES
GIS-Based Land Use Simulation for Biomass Energy Production 26
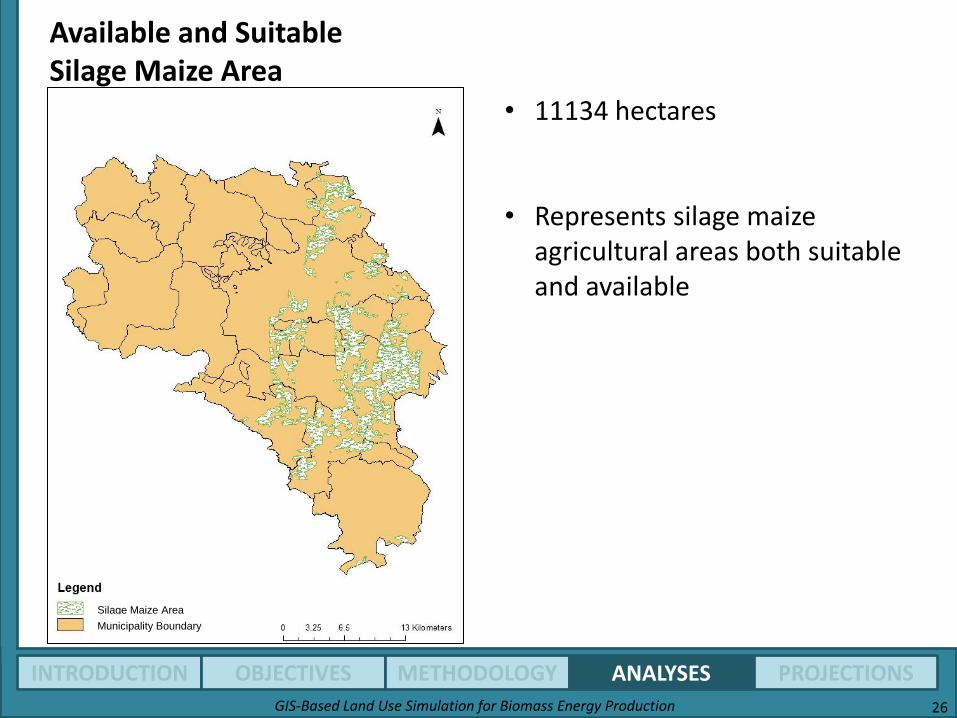
Available and Suitable Silage Maize Area
• 11134 hectares
• Represents silage maize agricultural areas both suitable and available
Silage Maize Area
Municipality Boundary
GIS-Based Land Use Simulation for Biomass Energy Production 27
Terrain
Elevation
Slope
Soil
PH
Stone Volume
Suitability Map
Biogas Power Plant Buffer
FLOW CHART
ANALYSES
‘Silage Maize Area’ Map
‘Estimated Total Silage Maize’ Map
Availability Map
ANALYSES
GIS-Based Land Use Simulation for Biomass Energy Production 28
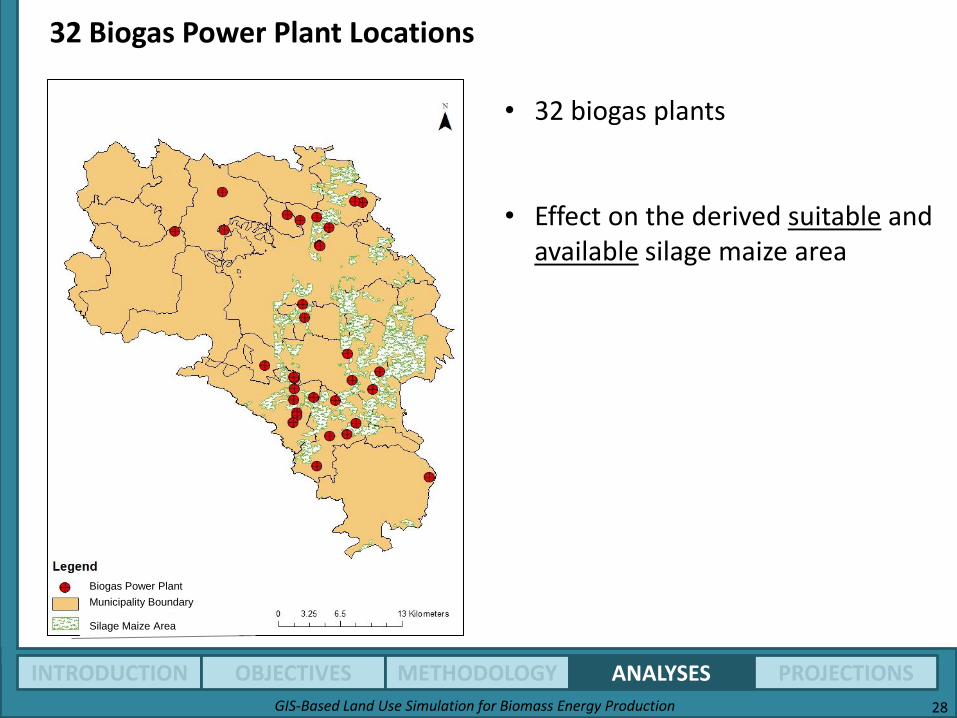
32 Biogas Power Plant Locations
• 32 biogas plants
• Effect on the derived suitable and available silage maize area
Silage Maize Area
Municipality Boundary
Biogas Power Plant
GIS-Based Land Use Simulation for Biomass Energy Production 29
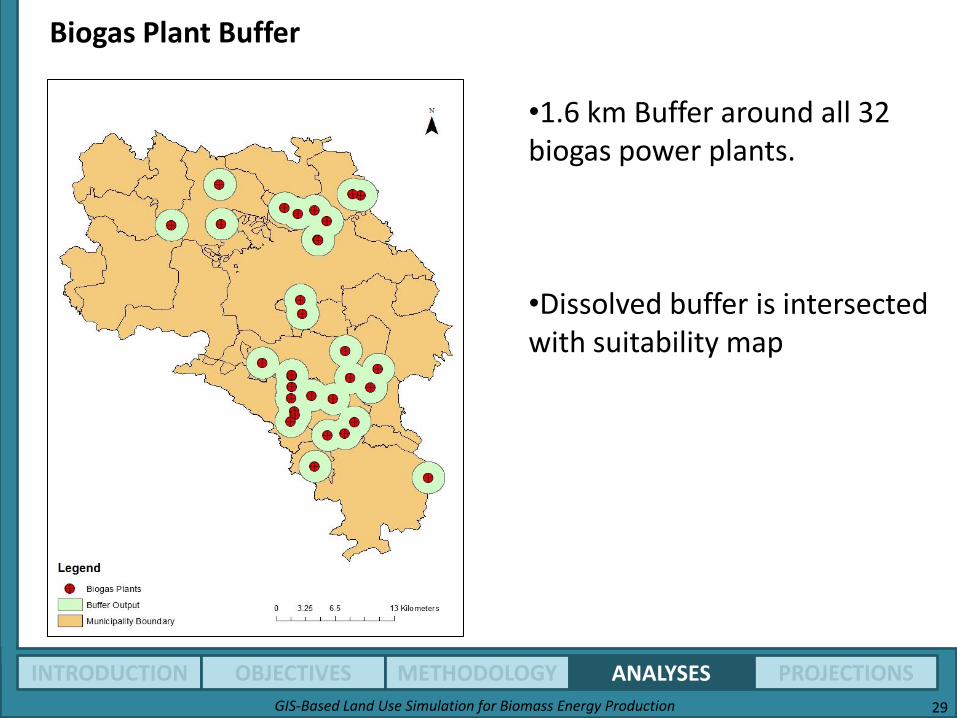
Biogas Plant Buffer
ANALYSES
•1.6 km Buffer around all 32 biogas power plants.
•Dissolved buffer is intersected with suitability map
GIS-Based Land Use Simulation for Biomass Energy Production 30
Terrain
Elevation
Slope
Soil
PH
Stone Volume
Suitability Map
‘Silage Maize Area’ MapBiogas Power Plant Buffer
FLOW CHART
ANALYSES
‘Estimated Total Silage Maize’ Map
Availability Map

GIS-Based Land Use Simulation for Biomass Energy Production 31
Ecological Total Silage Maize
(ETSM)
5524 Hectares
What does this value mean?
ANALYSES
GIS-Based Land Use Simulation for Biomass Energy Production 32
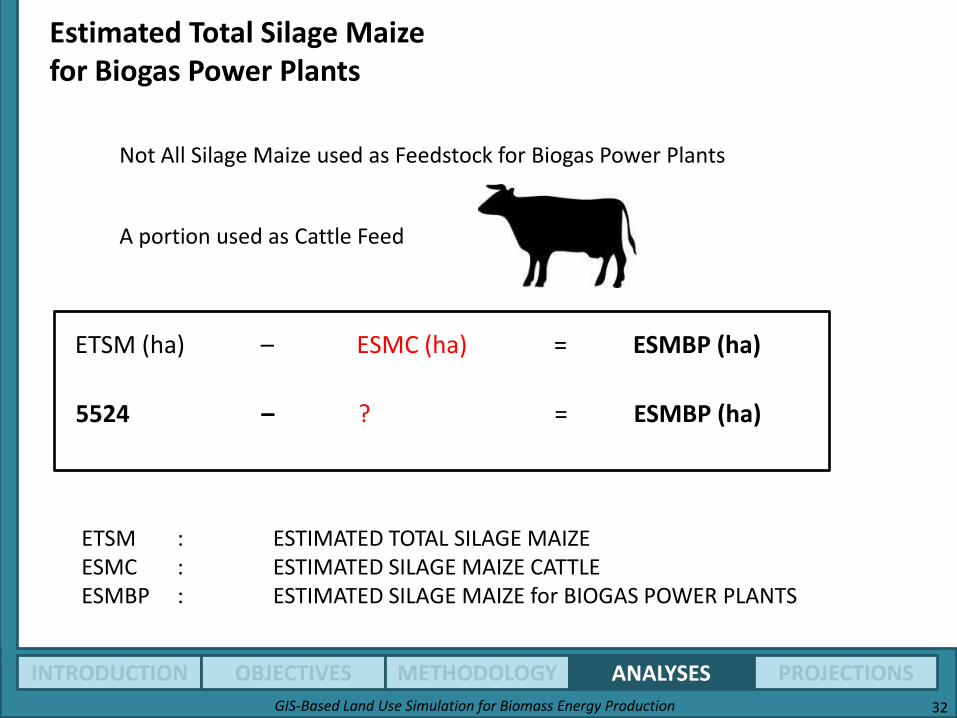
Estimated Total Silage Maize for Biogas Power Plants
Not All Silage Maize used as Feedstock for Biogas Power Plants
A portion used as Cattle Feed
ETSM (ha) – ESMC (ha) = ESMBP (ha)
5524 – ? = ESMBP (ha)
ETSM : ESTIMATED TOTAL SILAGE MAIZEESMC : ESTIMATED SILAGE MAIZE CATTLEESMBP : ESTIMATED SILAGE MAIZE for BIOGAS POWER PLANTS
ANALYSES
GIS-Based Land Use Simulation for Biomass Energy Production 33
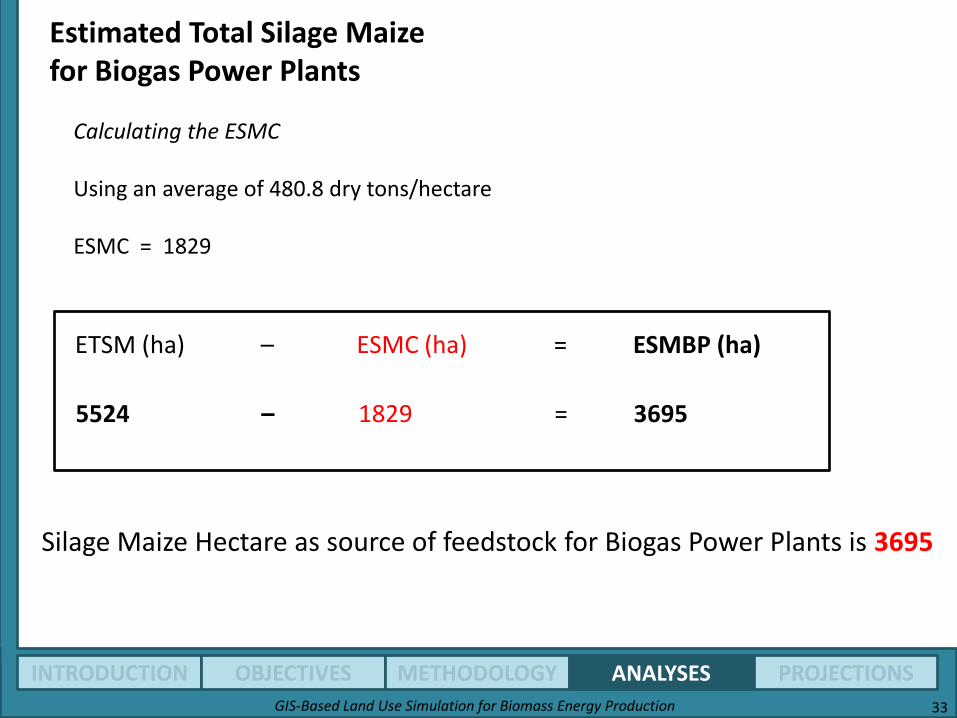
ETSM (ha) – ESMC (ha) = ESMBP (ha)
5524 – 1829 = 3695
Estimated Total Silage Maize for Biogas Power Plants
Calculating the ESMC
Using an average of 480.8 dry tons/hectare
ESMC = 1829
Silage Maize Hectare as source of feedstock for Biogas Power Plants is 3695
ANALYSES
GIS-Based Land Use Simulation for Biomass Energy Production 34
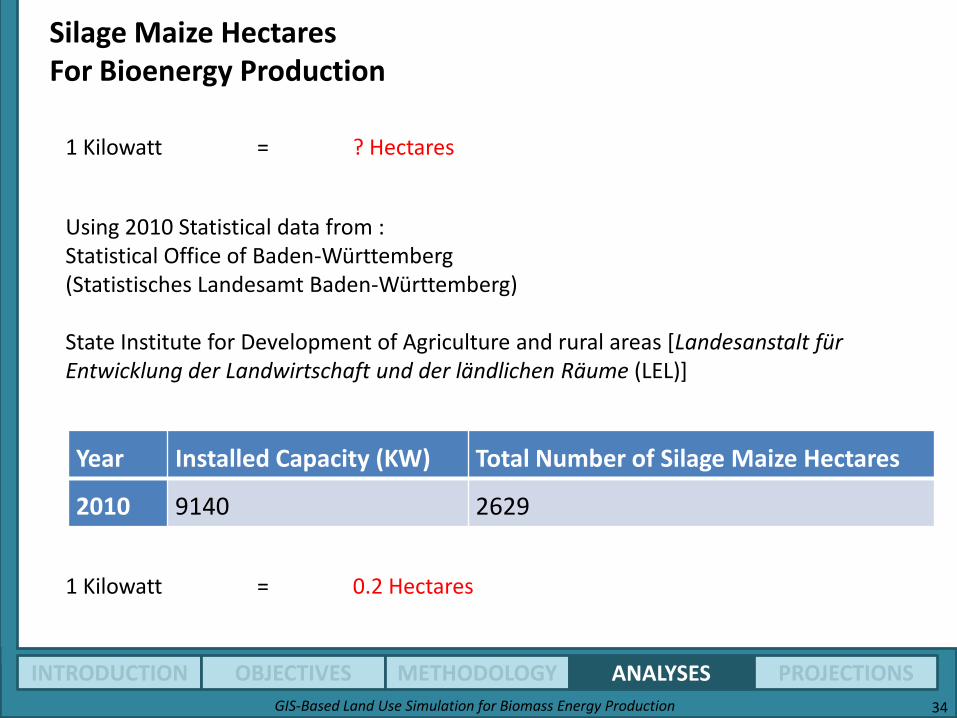
Silage Maize HectaresFor Bioenergy Production
Using 2010 Statistical data from :Statistical Office of Baden-Württemberg(Statistisches Landesamt Baden-Württemberg)
State Institute for Development of Agriculture and rural areas [Landesanstalt für Entwicklung der Landwirtschaft und der ländlichen Räume (LEL)]
1 Kilowatt = ? Hectares
Year Installed Capacity (KW) Total Number of Silage Maize Hectares
2010 9140 2629
1 Kilowatt = 0.2 Hectares
ANALYSES

GIS-Based Land Use Simulation for Biomass Energy Production 35
Silage Maize Land UseSimulationEnergy Demand20000KW
Energy
Output
Demand
(Kilowatt)
Silage Maize
Area
(Hectare)
Silage
Maize %
of TAA
Biogas
Plant
Average
Yield
(Kilowatt)
Required
Biogas
Power
Plants
20000 4000 8.3 200 100
240 83
300 63
PROJECTIONS
GIS-Based Land Use Simulation for Biomass Energy Production 36
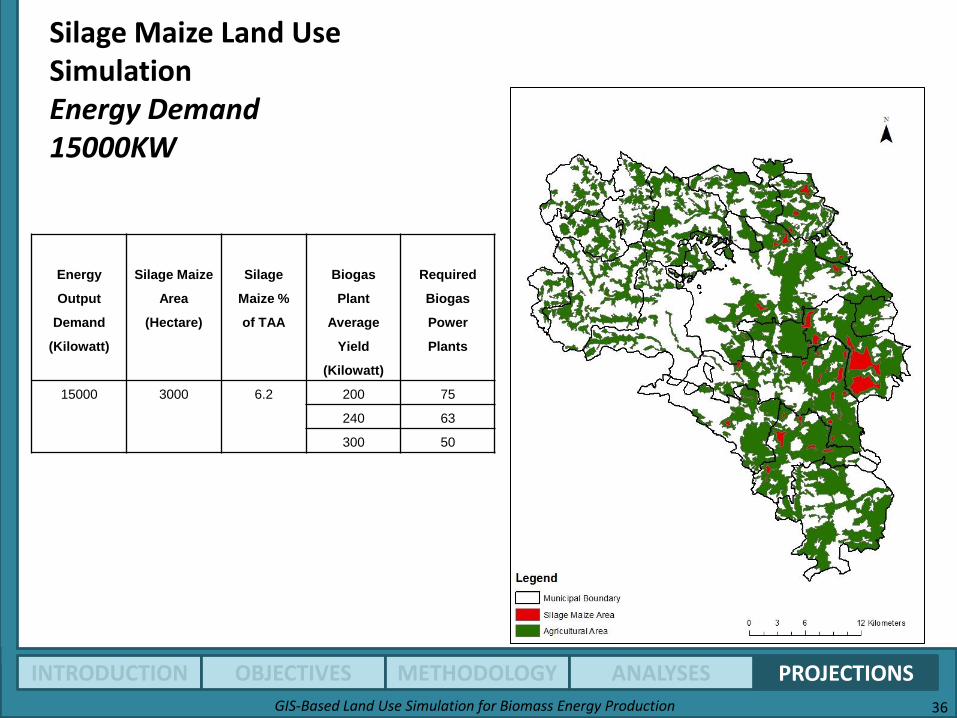
Silage Maize Land UseSimulationEnergy Demand15000KW
Energy
Output
Demand
(Kilowatt)
Silage Maize
Area
(Hectare)
Silage
Maize %
of TAA
Biogas
Plant
Average
Yield
(Kilowatt)
Required
Biogas
Power
Plants
15000 3000 6.2 200 75
240 63
300 50
PROJECTIONS

PROJECTIONS
GIS-Based Land Use Simulation for Biomass Energy Production 37
Silage Maize Land UseSimulationEnergy Demand10000KW
Energy
Output
Demand
(Kilowatt)
Silage Maize
Area
(Hectare)
Silage
Maize %
of TAA
Biogas
Plant
Average
Yield
(Kilowatt)
Required
Biogas
Power
Plants
10000 2000 4.1 200 50
240 41
300 33

GIS-Based Land Use Simulation for Biomass Energy Production 38
Silage Maize Land UseSimulationEnergy Demand2500KW
Energy
Output
Demand
(Kilowatt)
Silage Maize
Area
(Hectare)
Silage
Maize %
of TAA
Biogas
Plant
Average
Yield
(Kilowatt)
Required
Biogas
Power
Plants
2500 500 1 200 12
240 10
300 8
PROJECTIONS
PROJECTIONS
GIS-Based Land Use Simulation for Biomass Energy Production 39
Projections
•Model applicable to any given region
•Useful to stakeholders on both side of “Food or Fuel” debate
•Aid in decision making
LIMITATIONS
•Estimate figures used
•Not all the biogas power plants used in analyses
GIS-Based Land Use Simulation for Biomass Energy Production 40
THANK YOU
Related Documents


