Institutional Equities Company Update Reuters: GILE.NS; Bloomberg: GILL IN Gillette India FY20 performance fully captures lockdown impact; We expect strong growth in FY21 on a low base We pored over Gillette India’s (GILL) annual report for FY20 (June -ending). Below are the key excerpts from the same: FY20 (June-ending) performance: Sales, EBITDA and Adj. PAT declined by 9.8%, 5.8% and 9.0%, respectively. Gross margin was up by 70bps at 56.7%, leading to EBITDA margin expansion of 90bps to 21.4%. Advertising expenses were down 9.4% at ~Rs2bn (-110bps to 10.8% of revenues) and trade incentives were down by 61.1% at Rs230mn. The company declared a total dividend of Rs49 per share for FY20. Industry & demand environment: Pandemic-led lockdown resulted in reduction of shaving frequency among consumers, which significantly affected the company’s sales in April’20 and May’20. With the easing of the lockdown, GILL saw a sharp recovery to the pre-COVID levels since June’20. As of date, production and services are back to pre-COVID levels. In the recent quarter’s results (1QFY21 June-ending), the management mentioned that the strong topline growth of 11.7% YoY was on the back of strong product innovations, trusted portfolio, market recovery and strong execution of brand & retail fundamentals. Despite near term challenges, the company will continue to work towards driving balanced growth on the back of brand fundamentals, strength of the product portfolio and improved execution. Grooming segment (76.4% of revenue): Grooming business declined by 12% in FY20 but its EBIT margin expanded by ~160bps to 20.5%. The company continued to be the market leader in the men’s grooming category and reached its highest ever market share in FY20 in the Blades and Razors category. While there is a visible reduction in shaving frequency, GILL continuous to add new users to the Gillette franchise, which has been driven by product superiority and commercial innovations. During the year, the company launched Gillette SkinGuard (a premium system razor) and Guard Personal Care portfolio (an entry level pre- shave range of products). Gillette Guard, the company’s pioneering entry-level offering, registered its strongest value, volume and share growth, led by strong awareness, activation and go-to-market strategies. Gillette Double Edge blades continued to grow, led by the launch of the new Gillette Winner. Within the female grooming portfolio, Gillette Venus clocked its strongest value, volume and share growth. Oral Care segment (23.6% of revenue): Oral Care business declined by 1.9% with EBIT margin contraction of ~310bps to 10.8%. However, the decline of 1.9% in topline was on a strong base of 16.7% growth in FY19 and was backed by growth across value share, volume share and brand penetration. GILL managed to grow ahead of the category on the back of innovations and a strong go-to-market execution. Innovation within the category included the kid’s entry-tier, sensitive entry-tier, clove portfolio across tiers and rechargeable electric toothbrush for kids featuring Star Wars and Frozen characters. The company continued to leverage its targeted trial programs and deeper distribution plans to enable more consumers to have access to superior brushes. During the year, Oral-B continued its collaboration with dentists to promote oral health awareness via the free dental checkup program. Response to the pandemic & CSR: In response to the pandemic, the group launched P&G Suraksha India to serve communities by partnering with government and relief organizations. It also reinvented its flagship CSR program P&G Shiksha to reach children remotely. Further, GILL launched the Gillette Barber Suraksha Program to enable the barber community restart their business while maintaining high standards of safety, health and hygiene. The company, through its Safalta Apni Mutthi Mein program, continues to groom the youth of the nation on key skills required to increase employability and has reached over 8000+ colleges & universities. Outlook and valuation: With the easing of lockdown, GILL has seen a sharper-than- expected recovery since June’20. Going forward, we expect the company to deliver even higher growth in the rest of FY21 due to a low base, market recovery, service levels already coming back to pre-Covid levels in 1QFY21, product innovations and strong retail execution. The stock currently trades at 57.4x/50.1x/45.1x FY21E/FY22E/FY23E EPS. We retain our Accumulate rating with a target price (TP) of Rs5,895 by assigning a P/E multiple of 50x on September 2022 EPS. ACCUMULATE Sector: FMCG CMP: Rs5,750 Target Price: Rs5,895 Upside: 3% Vishal Punmiya Research Analyst [email protected] +91-22-6273 8064 Videesha Sheth Research Associate [email protected] +91-22-6273 8188 Key Data Current Shares O/S (mn) 32.6 Mkt Cap (Rsbn/US$bn) 187.4/2.5 52 Wk H / L (Rs) 7,054/4,420 Daily Vol. (3M NSE Avg.) 9,631 Price Performance (%) 1 M 6 M 1 Yr Gillette India 9.1 19.0 (16.6) Nifty Index 9.4 44.4 9.6 Source: Bloomberg FY20 Annual Report 24 November 2020

Welcome message from author
This document is posted to help you gain knowledge. Please leave a comment to let me know what you think about it! Share it to your friends and learn new things together.
Transcript
In s t itu tio n a l E q u it ie s
Com
pany
Upd
ate
Reuters: GILE.NS; Bloomberg: GILL IN
Gillette India
FY20 performance fully captures lockdown impact; We expect strong growth in FY21 on a low base We pored over Gillette India’s (GILL) annual report for FY20 (June-ending). Below are the key excerpts from the same:
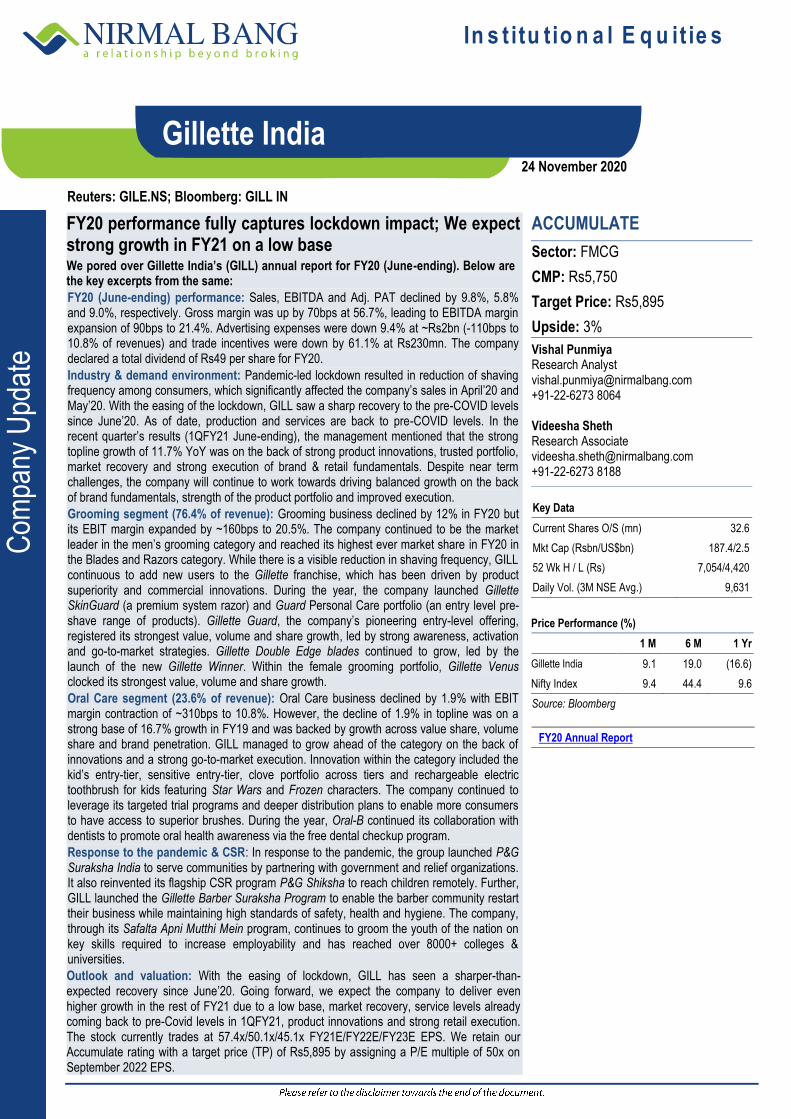
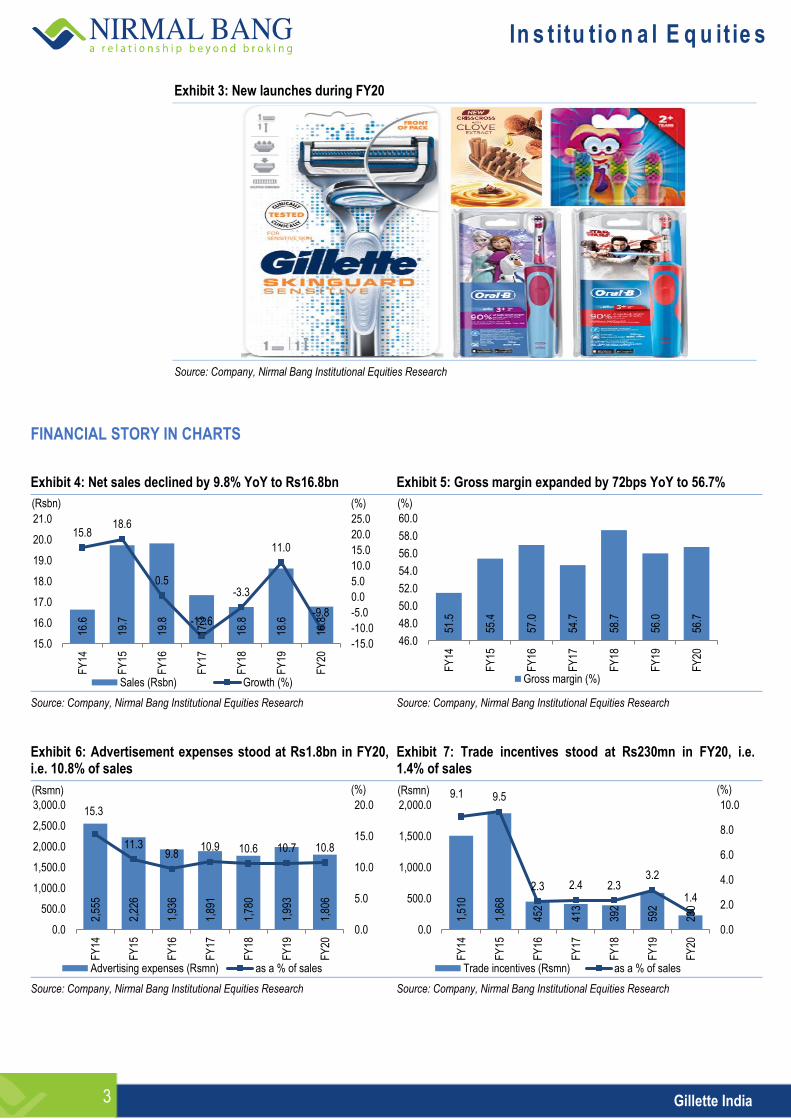
FY20 (June-ending) performance: Sales, EBITDA and Adj. PAT declined by 9.8%, 5.8% and 9.0%, respectively. Gross margin was up by 70bps at 56.7%, leading to EBITDA margin expansion of 90bps to 21.4%. Advertising expenses were down 9.4% at ~Rs2bn (-110bps to 10.8% of revenues) and trade incentives were down by 61.1% at Rs230mn. The company declared a total dividend of Rs49 per share for FY20.
Industry & demand environment: Pandemic-led lockdown resulted in reduction of shaving frequency among consumers, which significantly affected the company’s sales in April’20 and May’20. With the easing of the lockdown, GILL saw a sharp recovery to the pre-COVID levels since June’20. As of date, production and services are back to pre-COVID levels. In the recent quarter’s results (1QFY21 June-ending), the management mentioned that the strong topline growth of 11.7% YoY was on the back of strong product innovations, trusted portfolio, market recovery and strong execution of brand & retail fundamentals. Despite near term challenges, the company will continue to work towards driving balanced growth on the back of brand fundamentals, strength of the product portfolio and improved execution.
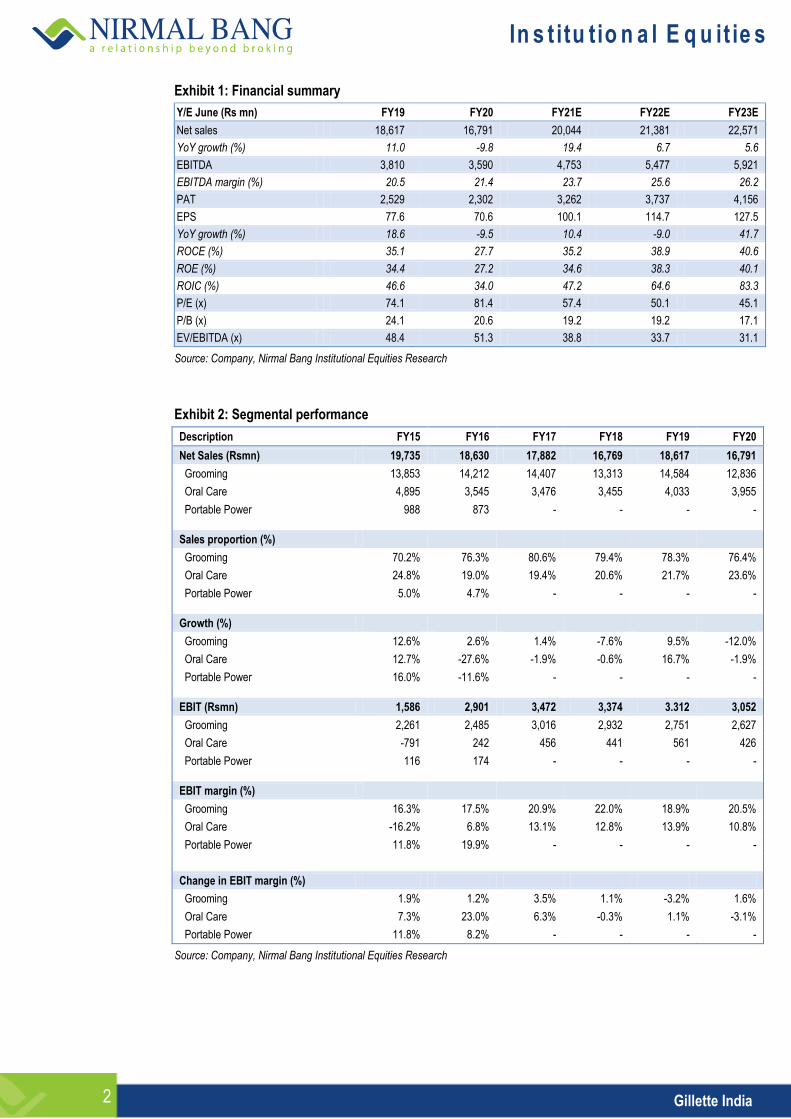
Grooming segment (76.4% of revenue): Grooming business declined by 12% in FY20 but its EBIT margin expanded by ~160bps to 20.5%. The company continued to be the market leader in the men’s grooming category and reached its highest ever market share in FY20 in the Blades and Razors category. While there is a visible reduction in shaving frequency, GILL continuous to add new users to the Gillette franchise, which has been driven by product superiority and commercial innovations. During the year, the company launched Gillette SkinGuard (a premium system razor) and Guard Personal Care portfolio (an entry level pre-shave range of products). Gillette Guard, the company’s pioneering entry-level offering, registered its strongest value, volume and share growth, led by strong awareness, activation and go-to-market strategies. Gillette Double Edge blades continued to grow, led by the launch of the new Gillette Winner. Within the female grooming portfolio, Gillette Venus clocked its strongest value, volume and share growth.
Oral Care segment (23.6% of revenue): Oral Care business declined by 1.9% with EBIT margin contraction of ~310bps to 10.8%. However, the decline of 1.9% in topline was on a strong base of 16.7% growth in FY19 and was backed by growth across value share, volume share and brand penetration. GILL managed to grow ahead of the category on the back of innovations and a strong go-to-market execution. Innovation within the category included the kid’s entry-tier, sensitive entry-tier, clove portfolio across tiers and rechargeable electric toothbrush for kids featuring Star Wars and Frozen characters. The company continued to leverage its targeted trial programs and deeper distribution plans to enable more consumers to have access to superior brushes. During the year, Oral-B continued its collaboration with dentists to promote oral health awareness via the free dental checkup program.
Response to the pandemic & CSR: In response to the pandemic, the group launched P&G Suraksha India to serve communities by partnering with government and relief organizations. It also reinvented its flagship CSR program P&G Shiksha to reach children remotely. Further, GILL launched the Gillette Barber Suraksha Program to enable the barber community restart their business while maintaining high standards of safety, health and hygiene. The company, through its Safalta Apni Mutthi Mein program, continues to groom the youth of the nation on key skills required to increase employability and has reached over 8000+ colleges & universities.
Outlook and valuation: With the easing of lockdown, GILL has seen a sharper-than-expected recovery since June’20. Going forward, we expect the company to deliver even higher growth in the rest of FY21 due to a low base, market recovery, service levels already coming back to pre-Covid levels in 1QFY21, product innovations and strong retail execution. The stock currently trades at 57.4x/50.1x/45.1x FY21E/FY22E/FY23E EPS. We retain our Accumulate rating with a target price (TP) of Rs5,895 by assigning a P/E multiple of 50x on September 2022 EPS.
ACCUMULATE
Sector: FMCG
CMP: Rs5,750
Target Price: Rs5,895
Upside: 3%
Vishal Punmiya Research Analyst [email protected] +91-22-6273 8064 Videesha Sheth Research Associate [email protected] +91-22-6273 8188
Key Data
Current Shares O/S (mn) 32.6
Mkt Cap (Rsbn/US$bn) 187.4/2.5
52 Wk H / L (Rs) 7,054/4,420
Daily Vol. (3M NSE Avg.) 9,631
Price Performance (%)
1 M 6 M 1 Yr
Gillette India 9.1 19.0 (16.6)
Nifty Index 9.4 44.4 9.6
Source: Bloomberg
FY20 Annual Report
24 November 2020
In s t itu tio n a l E q u it ie s
2 Gillette India
Exhibit 1: Financial summary
Y/E June (Rs mn) FY19 FY20 FY21E FY22E FY23E
Net sales 18,617 16,791 20,044 21,381 22,571
YoY growth (%) 11.0 -9.8 19.4 6.7 5.6
EBITDA 3,810 3,590 4,753 5,477 5,921
EBITDA margin (%) 20.5 21.4 23.7 25.6 26.2
PAT 2,529 2,302 3,262 3,737 4,156
EPS 77.6 70.6 100.1 114.7 127.5
YoY growth (%) 18.6 -9.5 10.4 -9.0 41.7
ROCE (%) 35.1 27.7 35.2 38.9 40.6
ROE (%) 34.4 27.2 34.6 38.3 40.1
ROIC (%) 46.6 34.0 47.2 64.6 83.3
P/E (x) 74.1 81.4 57.4 50.1 45.1
P/B (x) 24.1 20.6 19.2 19.2 17.1
EV/EBITDA (x) 48.4 51.3 38.8 33.7 31.1
Source: Company, Nirmal Bang Institutional Equities Research
Exhibit 2: Segmental performance
Description FY15 FY16 FY17 FY18 FY19 FY20
Net Sales (Rsmn) 19,735 18,630 17,882 16,769 18,617 16,791
Grooming 13,853 14,212 14,407 13,313 14,584 12,836
Oral Care 4,895 3,545 3,476 3,455 4,033 3,955
Portable Power 988 873 - - - -
Sales proportion (%)
Grooming 70.2% 76.3% 80.6% 79.4% 78.3% 76.4%
Oral Care 24.8% 19.0% 19.4% 20.6% 21.7% 23.6%
Portable Power 5.0% 4.7% - - - -
Growth (%)
Grooming 12.6% 2.6% 1.4% -7.6% 9.5% -12.0%
Oral Care 12.7% -27.6% -1.9% -0.6% 16.7% -1.9%
Portable Power 16.0% -11.6% - - - -
EBIT (Rsmn) 1,586 2,901 3,472 3,374 3.312 3,052
Grooming 2,261 2,485 3,016 2,932 2,751 2,627
Oral Care -791 242 456 441 561 426
Portable Power 116 174 - - - -
EBIT margin (%)
Grooming 16.3% 17.5% 20.9% 22.0% 18.9% 20.5%
Oral Care -16.2% 6.8% 13.1% 12.8% 13.9% 10.8%
Portable Power 11.8% 19.9% - - - -
Change in EBIT margin (%)
Grooming 1.9% 1.2% 3.5% 1.1% -3.2% 1.6%
Oral Care 7.3% 23.0% 6.3% -0.3% 1.1% -3.1%
Portable Power 11.8% 8.2% - - - -
Source: Company, Nirmal Bang Institutional Equities Research
In s t itu tio n a l E q u it ie s
3 Gillette India
Exhibit 3: New launches during FY20
Source: Company, Nirmal Bang Institutional Equities Research
FINANCIAL STORY IN CHARTS
Exhibit 4: Net sales declined by 9.8% YoY to Rs16.8bn Exhibit 5: Gross margin expanded by 72bps YoY to 56.7%
16.6
19.7
19.8
17.3
16.8
18.6
16.8
15.818.6
0.5
-12.6
-3.3
11.0
-9.8
-15.0
-10.0
-5.0
0.0
5.0
10.0
15.0
20.0
25.0
15.0
16.0
17.0
18.0
19.0
20.0
21.0
FY
14
FY
15
FY
16
FY
17
FY
18
FY
19
FY
20
Sales (Rsbn) Growth (%)
(%)(Rsbn)
51.5
55.4
57.0
54.7
58.7
56.0
56.7
46.0
48.0
50.0
52.0
54.0
56.0
58.0
60.0
FY
14
FY
15
FY
16
FY
17
FY
18
FY
19
FY
20
Gross margin (%)
(%)
Source: Company, Nirmal Bang Institutional Equities Research Source: Company, Nirmal Bang Institutional Equities Research
Exhibit 6: Advertisement expenses stood at Rs1.8bn in FY20, i.e. 10.8% of sales
Exhibit 7: Trade incentives stood at Rs230mn in FY20, i.e. 1.4% of sales
2,55
5
2,22
6
1,93
6
1,89
1
1,78
0
1,99
3
1,80
6
15.3
11.39.8
10.9 10.6 10.7 10.8
0.0
5.0
10.0
15.0
20.0
0.0
500.0
1,000.0
1,500.0
2,000.0
2,500.0
3,000.0
FY
14
FY
15
FY
16
FY
17
FY
18
FY
19
FY
20
Advertising expenses (Rsmn) as a % of sales
(%)(Rsmn)
1,51
0
1,86
8
452
413
392
592
230
9.1 9.5
2.3 2.4 2.33.2
1.4
0.0
2.0
4.0
6.0
8.0
10.0
0.0
500.0
1,000.0
1,500.0
2,000.0
FY
14
FY
15
FY
16
FY
17
FY
18
FY
19
FY
20
Trade incentives (Rsmn) as a % of sales
(%)(Rsmn)
Source: Company, Nirmal Bang Institutional Equities Research Source: Company, Nirmal Bang Institutional Equities Research
In s t itu tio n a l E q u it ie s
4 Gillette India
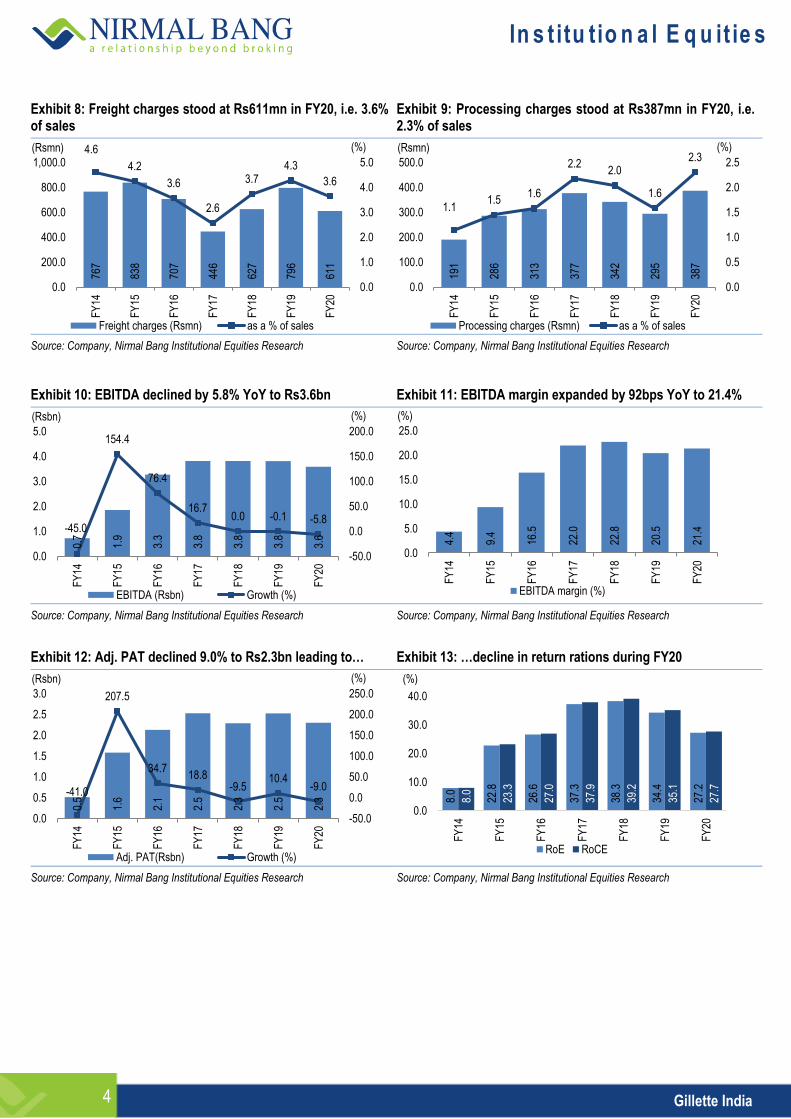
Exhibit 8: Freight charges stood at Rs611mn in FY20, i.e. 3.6% of sales
Exhibit 9: Processing charges stood at Rs387mn in FY20, i.e. 2.3% of sales
767
838
707
446
627
796
611
4.6
4.2
3.6
2.6
3.74.3
3.6
0.0
1.0
2.0
3.0
4.0
5.0
0.0
200.0
400.0
600.0
800.0
1,000.0
FY
14
FY
15
FY
16
FY
17
FY
18
FY
19
FY
20Freight charges (Rsmn) as a % of sales
(%)(Rsmn)
191
286
313
377
342
295
387
1.11.5
1.6
2.22.0
1.6
2.3
0.0
0.5
1.0
1.5
2.0
2.5
0.0
100.0
200.0
300.0
400.0
500.0
FY
14
FY
15
FY
16
FY
17
FY
18
FY
19
FY
20
Processing charges (Rsmn) as a % of sales
(%)(Rsmn)
Source: Company, Nirmal Bang Institutional Equities Research Source: Company, Nirmal Bang Institutional Equities Research
Exhibit 10: EBITDA declined by 5.8% YoY to Rs3.6bn Exhibit 11: EBITDA margin expanded by 92bps YoY to 21.4%
0.7
1.9
3.3
3.8
3.8
3.8
3.6
-45.0
154.4
76.4
16.70.0 -0.1 -5.8
-50.0
0.0
50.0
100.0
150.0
200.0
0.0
1.0
2.0
3.0
4.0
5.0
FY
14
FY
15
FY
16
FY
17
FY
18
FY
19
FY
20
EBITDA (Rsbn) Growth (%)
(%)(Rsbn)
4.4
9.4
16.5
22.0
22.8
20.5
21.4
0.0
5.0
10.0
15.0
20.0
25.0
FY
14
FY
15
FY
16
FY
17
FY
18
FY
19
FY
20
EBITDA margin (%)
(%)
Source: Company, Nirmal Bang Institutional Equities Research Source: Company, Nirmal Bang Institutional Equities Research
Exhibit 12: Adj. PAT declined 9.0% to Rs2.3bn leading to… Exhibit 13: …decline in return rations during FY20
0.5
1.6
2.1
2.5
2.3
2.5
2.3
-41.0
207.5
34.718.8
-9.510.4
-9.0
-50.0
0.0
50.0
100.0
150.0
200.0
250.0
0.0
0.5
1.0
1.5
2.0
2.5
3.0
FY
14
FY
15
FY
16
FY
17
FY
18
FY
19
FY
20
Adj. PAT(Rsbn) Growth (%)
(%)(Rsbn)
8.0
22.8
26.6
37.3
38.3
34.4
27.2
8.0
23.3
27.0
37.9
39.2
35.1
27.7
0.0
10.0
20.0
30.0
40.0
FY
14
FY
15
FY
16
FY
17
FY
18
FY
19
FY
20
RoE RoCE
(%)
Source: Company, Nirmal Bang Institutional Equities Research Source: Company, Nirmal Bang Institutional Equities Research
In s t itu tio n a l E q u it ie s
5 Gillette India
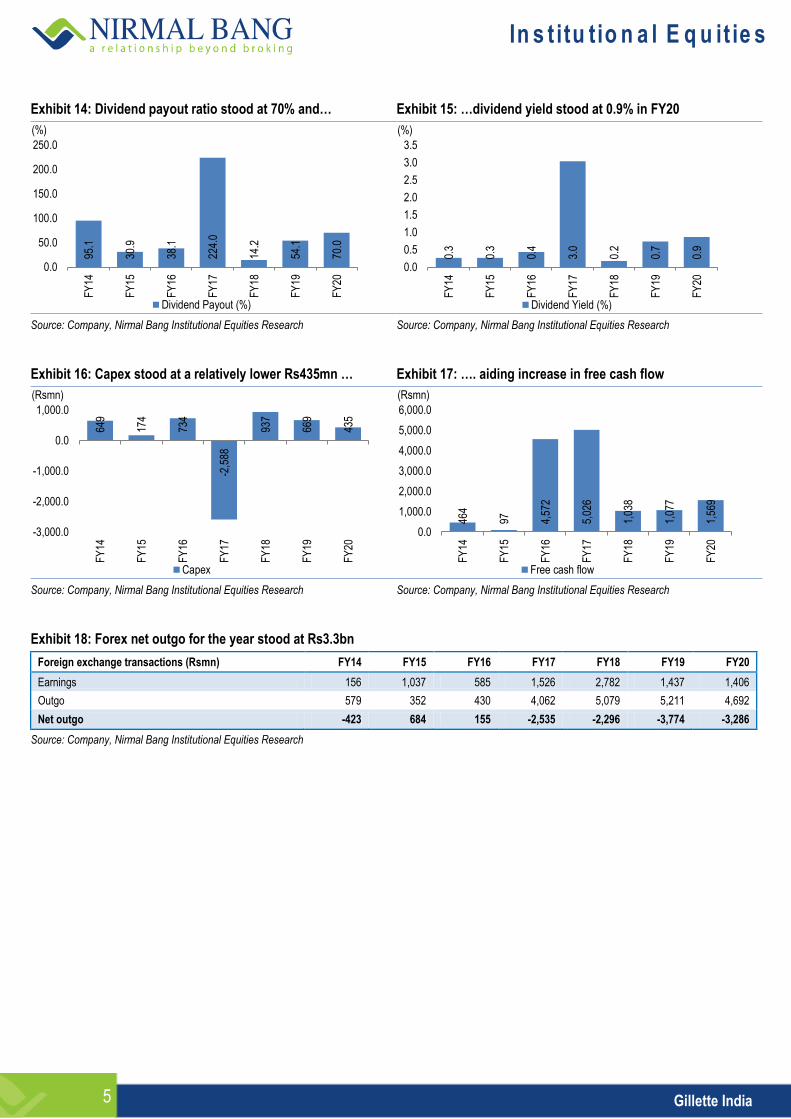
Exhibit 14: Dividend payout ratio stood at 70% and… Exhibit 15: …dividend yield stood at 0.9% in FY20
95.1
30.9
38.1
224.
0
14.2
54.1
70.0
0.0
50.0
100.0
150.0
200.0
250.0
FY
14
FY
15
FY
16
FY
17
FY
18
FY
19
FY
20
Dividend Payout (%)
(%)
0.3
0.3
0.4
3.0
0.2
0.7
0.9
0.0
0.5
1.0
1.5
2.0
2.5
3.0
3.5
FY
14
FY
15
FY
16
FY
17
FY
18
FY
19
FY
20
Dividend Yield (%)
(%)
Source: Company, Nirmal Bang Institutional Equities Research Source: Company, Nirmal Bang Institutional Equities Research
Exhibit 16: Capex stood at a relatively lower Rs435mn … Exhibit 17: …. aiding increase in free cash flow
649
174
734
-2,5
88
937
669
435
-3,000.0
-2,000.0
-1,000.0
0.0
1,000.0
FY
14
FY
15
FY
16
FY
17
FY
18
FY
19
FY
20
Capex
(Rsmn)
464
97 4,57
2
5,02
6
1,03
8
1,07
7
1,56
9
0.0
1,000.0
2,000.0
3,000.0
4,000.0
5,000.0
6,000.0
FY
14
FY
15
FY
16
FY
17
FY
18
FY
19
FY
20
Free cash flow
(Rsmn)
Source: Company, Nirmal Bang Institutional Equities Research Source: Company, Nirmal Bang Institutional Equities Research
Exhibit 18: Forex net outgo for the year stood at Rs3.3bn
Foreign exchange transactions (Rsmn) FY14 FY15 FY16 FY17 FY18 FY19 FY20
Earnings 156 1,037 585 1,526 2,782 1,437 1,406
Outgo 579 352 430 4,062 5,079 5,211 4,692
Net outgo -423 684 155 -2,535 -2,296 -3,774 -3,286
Source: Company, Nirmal Bang Institutional Equities Research
In s t itu tio n a l E q u it ie s
6 Gillette India
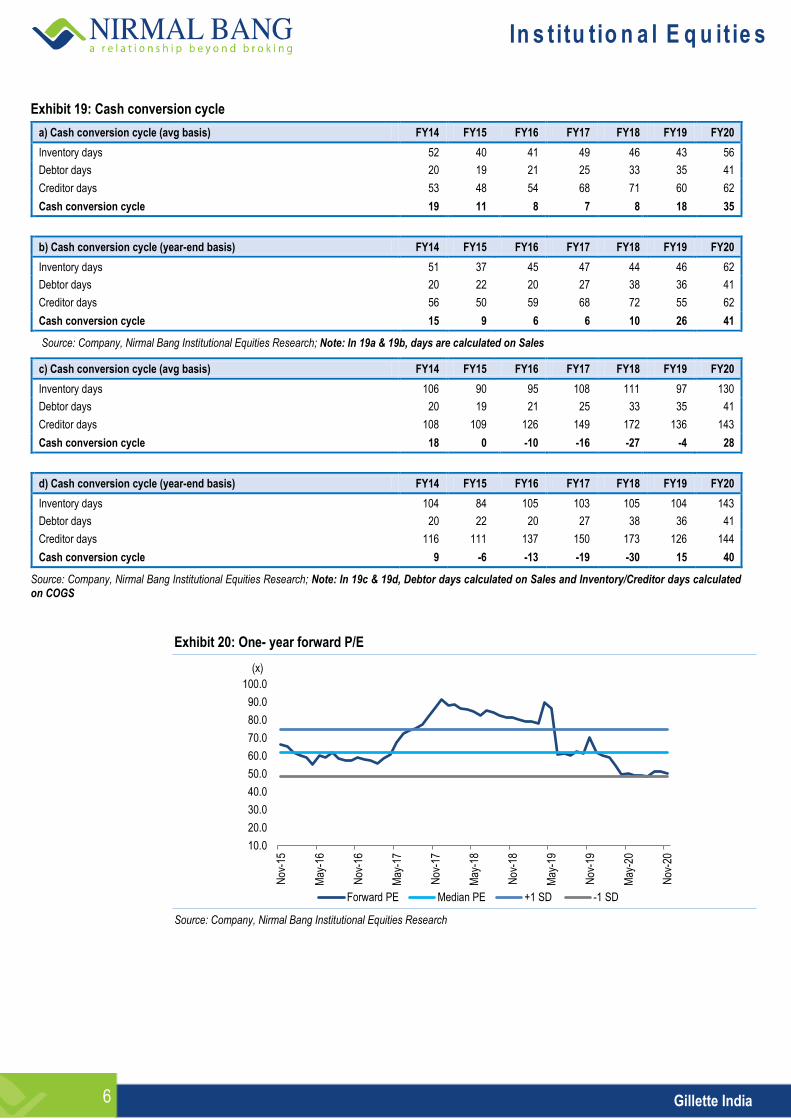
Exhibit 19: Cash conversion cycle
a) Cash conversion cycle (avg basis) FY14 FY15 FY16 FY17 FY18 FY19 FY20
Inventory days 52 40 41 49 46 43 56
Debtor days 20 19 21 25 33 35 41
Creditor days 53 48 54 68 71 60 62
Cash conversion cycle 19 11 8 7 8 18 35
b) Cash conversion cycle (year-end basis) FY14 FY15 FY16 FY17 FY18 FY19 FY20
Inventory days 51 37 45 47 44 46 62
Debtor days 20 22 20 27 38 36 41
Creditor days 56 50 59 68 72 55 62
Cash conversion cycle 15 9 6 6 10 26 41
Source: Company, Nirmal Bang Institutional Equities Research; Note: In 19a & 19b, days are calculated on Sales
c) Cash conversion cycle (avg basis) FY14 FY15 FY16 FY17 FY18 FY19 FY20
Inventory days 106 90 95 108 111 97 130
Debtor days 20 19 21 25 33 35 41
Creditor days 108 109 126 149 172 136 143
Cash conversion cycle 18 0 -10 -16 -27 -4 28
d) Cash conversion cycle (year-end basis) FY14 FY15 FY16 FY17 FY18 FY19 FY20
Inventory days 104 84 105 103 105 104 143
Debtor days 20 22 20 27 38 36 41
Creditor days 116 111 137 150 173 126 144
Cash conversion cycle 9 -6 -13 -19 -30 15 40
Source: Company, Nirmal Bang Institutional Equities Research; Note: In 19c & 19d, Debtor days calculated on Sales and Inventory/Creditor days calculated on COGS
Exhibit 20: One- year forward P/E
10.0
20.0
30.0
40.0
50.0
60.0
70.0
80.0
90.0
100.0
Nov
-15
May
-16
Nov
-16
May
-17
Nov
-17
May
-18
Nov
-18
May
-19
Nov
-19
May
-20
Nov
-20
Forward PE Median PE +1 SD -1 SD
(x)
Source: Company, Nirmal Bang Institutional Equities Research
In s t itu tio n a l E q u it ie s
7 Gillette India
Financials
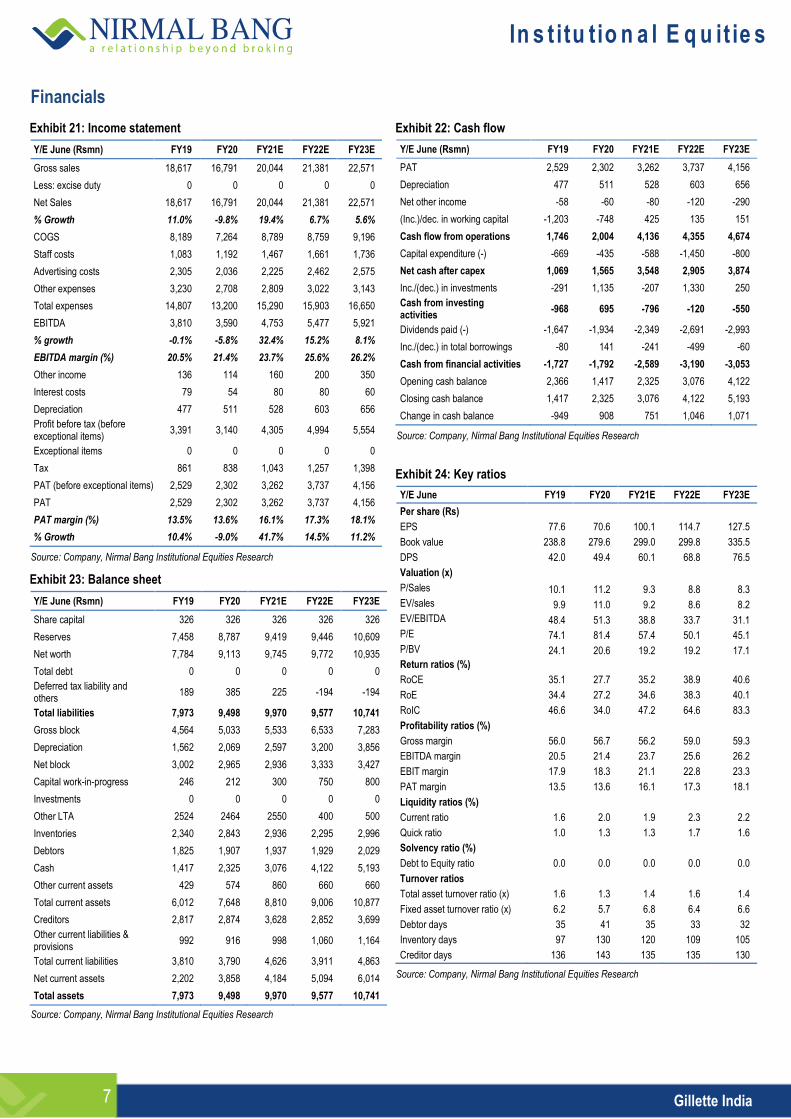
Exhibit 21: Income statement
Y/E June (Rsmn) FY19 FY20 FY21E FY22E FY23E
Gross sales 18,617 16,791 20,044 21,381 22,571
Less: excise duty 0 0 0 0 0
Net Sales 18,617 16,791 20,044 21,381 22,571
% Growth 11.0% -9.8% 19.4% 6.7% 5.6%
COGS 8,189 7,264 8,789 8,759 9,196
Staff costs 1,083 1,192 1,467 1,661 1,736
Advertising costs 2,305 2,036 2,225 2,462 2,575
Other expenses 3,230 2,708 2,809 3,022 3,143
Total expenses 14,807 13,200 15,290 15,903 16,650
EBITDA 3,810 3,590 4,753 5,477 5,921
% growth -0.1% -5.8% 32.4% 15.2% 8.1%
EBITDA margin (%) 20.5% 21.4% 23.7% 25.6% 26.2%
Other income 136 114 160 200 350
Interest costs 79 54 80 80 60
Depreciation 477 511 528 603 656
Profit before tax (before exceptional items)
3,391 3,140 4,305 4,994 5,554
Exceptional items 0 0 0 0 0
Tax 861 838 1,043 1,257 1,398
PAT (before exceptional items) 2,529 2,302 3,262 3,737 4,156
PAT 2,529 2,302 3,262 3,737 4,156
PAT margin (%) 13.5% 13.6% 16.1% 17.3% 18.1%
% Growth 10.4% -9.0% 41.7% 14.5% 11.2%
Source: Company, Nirmal Bang Institutional Equities Research
Exhibit 23: Balance sheet
Y/E June (Rsmn) FY19 FY20 FY21E FY22E FY23E
Share capital 326 326 326 326 326
Reserves 7,458 8,787 9,419 9,446 10,609
Net worth 7,784 9,113 9,745 9,772 10,935
Total debt 0 0 0 0 0
Deferred tax liability and others
189 385 225 -194 -194
Total liabilities 7,973 9,498 9,970 9,577 10,741
Gross block 4,564 5,033 5,533 6,533 7,283
Depreciation 1,562 2,069 2,597 3,200 3,856
Net block 3,002 2,965 2,936 3,333 3,427
Capital work-in-progress 246 212 300 750 800
Investments 0 0 0 0 0
Other LTA 2524 2464 2550 400 500
Inventories 2,340 2,843 2,936 2,295 2,996
Debtors 1,825 1,907 1,937 1,929 2,029
Cash 1,417 2,325 3,076 4,122 5,193
Other current assets 429 574 860 660 660
Total current assets 6,012 7,648 8,810 9,006 10,877
Creditors 2,817 2,874 3,628 2,852 3,699
Other current liabilities & provisions
992 916 998 1,060 1,164
Total current liabilities 3,810 3,790 4,626 3,911 4,863
Net current assets 2,202 3,858 4,184 5,094 6,014
Total assets 7,973 9,498 9,970 9,577 10,741
Source: Company, Nirmal Bang Institutional Equities Research
Exhibit 22: Cash flow
Y/E June (Rsmn) FY19 FY20 FY21E FY22E FY23E
PAT 2,529 2,302 3,262 3,737 4,156
Depreciation 477 511 528 603 656
Net other income -58 -60 -80 -120 -290
(Inc.)/dec. in working capital -1,203 -748 425 135 151
Cash flow from operations 1,746 2,004 4,136 4,355 4,674
Capital expenditure (-) -669 -435 -588 -1,450 -800
Net cash after capex 1,069 1,565 3,548 2,905 3,874
Inc./(dec.) in investments -291 1,135 -207 1,330 250
Cash from investing activities
-968 695 -796 -120 -550
Dividends paid (-) -1,647 -1,934 -2,349 -2,691 -2,993
Inc./(dec.) in total borrowings -80 141 -241 -499 -60
Cash from financial activities -1,727 -1,792 -2,589 -3,190 -3,053
Opening cash balance 2,366 1,417 2,325 3,076 4,122
Closing cash balance 1,417 2,325 3,076 4,122 5,193
Change in cash balance -949 908 751 1,046 1,071
Source: Company, Nirmal Bang Institutional Equities Research
Exhibit 24: Key ratios
Y/E June FY19 FY20 FY21E FY22E FY23E
Per share (Rs)
EPS 77.6 70.6 100.1 114.7 127.5
Book value 238.8 279.6 299.0 299.8 335.5
DPS 42.0 49.4 60.1 68.8 76.5
Valuation (x)
P/Sales 10.1 11.2 9.3 8.8 8.3
EV/sales 9.9 11.0 9.2 8.6 8.2
EV/EBITDA 48.4 51.3 38.8 33.7 31.1
P/E 74.1 81.4 57.4 50.1 45.1
P/BV 24.1 20.6 19.2 19.2 17.1
Return ratios (%)
RoCE 35.1 27.7 35.2 38.9 40.6
RoE 34.4 27.2 34.6 38.3 40.1
RoIC 46.6 34.0 47.2 64.6 83.3
Profitability ratios (%)
Gross margin 56.0 56.7 56.2 59.0 59.3
EBITDA margin 20.5 21.4 23.7 25.6 26.2
EBIT margin 17.9 18.3 21.1 22.8 23.3
PAT margin 13.5 13.6 16.1 17.3 18.1
Liquidity ratios (%)
Current ratio 1.6 2.0 1.9 2.3 2.2
Quick ratio 1.0 1.3 1.3 1.7 1.6
Solvency ratio (%)
Debt to Equity ratio 0.0 0.0 0.0 0.0 0.0
Turnover ratios
Total asset turnover ratio (x) 1.6 1.3 1.4 1.6 1.4
Fixed asset turnover ratio (x) 6.2 5.7 6.8 6.4 6.6
Debtor days 35 41 35 33 32
Inventory days 97 130 120 109 105
Creditor days 136 143 135 135 130
Source: Company, Nirmal Bang Institutional Equities Research
In s t itu tio n a l E q u it ie s
8 Gillette India
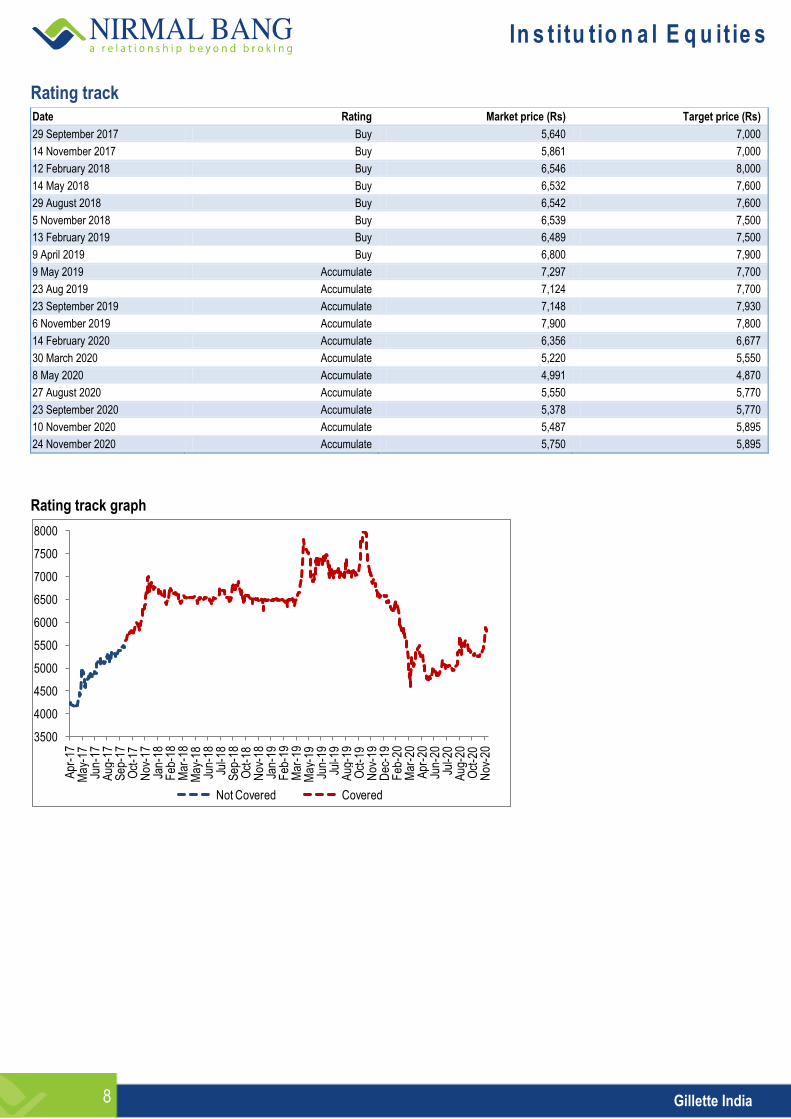
Rating track Date Rating Market price (Rs) Target price (Rs)
29 September 2017 Buy 5,640 7,000
14 November 2017 Buy 5,861 7,000
12 February 2018 Buy 6,546 8,000
14 May 2018 Buy 6,532 7,600
29 August 2018 Buy 6,542 7,600
5 November 2018 Buy 6,539 7,500
13 February 2019 Buy 6,489 7,500
9 April 2019 Buy 6,800 7,900
9 May 2019 Accumulate 7,297 7,700
23 Aug 2019 Accumulate 7,124 7,700
23 September 2019 Accumulate 7,148 7,930
6 November 2019 Accumulate 7,900 7,800
14 February 2020 Accumulate 6,356 6,677
30 March 2020 Accumulate 5,220 5,550
8 May 2020 Accumulate 4,991 4,870
27 August 2020 Accumulate 5,550 5,770
23 September 2020 Accumulate 5,378 5,770
10 November 2020 Accumulate 5,487 5,895
24 November 2020 Accumulate 5,750 5,895
Rating track graph
3500
4000
4500
5000
5500
6000
6500
7000
7500
8000
Apr
-17
May
-17
Jun-
17A
ug-1
7S
ep-1
7O
ct-1
7N
ov-1
7Ja
n-18
Feb
-18
Mar
-18
May
-18
Jun-
18Ju
l-18
Sep
-18
Oct
-18
Nov
-18
Jan-
19F
eb-1
9M
ar-1
9M
ay-1
9Ju
n-19
Jul-1
9A
ug-1
9O
ct-1
9N
ov-1
9D
ec-1
9F
eb-2
0M
ar-2
0A
pr-2
0Ju
n-20
Jul-2
0A
ug-2
0O
ct-2
0N
ov-2
0
Not Covered Covered
In s t itu tio n a l E q u it ie s
9 Gillette India
DISCLOSURES
This Report is published by Nirmal Bang Equities Private Limited (hereinafter referred to as “NBEPL”) for private circulation. NBEPL is a registered Research Analyst under SEBI (Research Analyst) Regulations, 2014 having Registration no. INH000001436. NBEPL is also a registered Stock Broker with National Stock Exchange of India Limited and BSE Limited in cash and derivatives segments. NBEPL has other business divisions with independent research teams separated by Chinese walls, and therefore may, at times, have different or contrary views on stocks and markets. NBEPL or its associates have not been debarred / suspended by SEBI or any other regulatory authority for accessing / dealing in securities Market. NBEPL, its associates or analyst or his relatives do not hold any financial interest in the subject company. NBEPL or its associates or Analyst do not have any conflict or material conflict of interest at the time of publication of the research report with the subject company. NBEPL or its associates or Analyst or his relatives do not hold beneficial ownership of 1% or more in the subject company at the end of the month immediately preceding the date of publication of this research report. NBEPL or its associates / analyst has not received any compensation / managed or co-managed public offering of securities of the company covered by Analyst during the past twelve months. NBEPL or its associates have not received any compensation or other benefits from the company covered by Analyst or third party in connection with the research report. Analyst has not served as an officer, director or employee of Subject Company and NBEPL / analyst has not been engaged in market making activity of the subject company. Analyst Certification: I/We, Mr. Vishal Punmiya, the research analyst and Ms. Videesha Sheth, the research associate, the authors of this report, hereby certify that the views expressed in this research report accurately reflects my personal views about the subject securities, issuers, products, sectors or industries. It is also certified that no part of the compensation of the analyst was, is, or will be directly or indirectly related to the inclusion of specific recommendations or views in this research. The analyst is principally responsible for the preparation of this research report and has taken reasonable care to achieve and maintain independence and objectivity in making any recommendations.
In s t itu tio n a l E q u it ie s
10 Gillette India
Disclaimer
Stock Ratings Absolute Returns
BUY > 15%
ACCUMULATE -5% to15%
SELL < -5%
This report is for the personal information of the authorized recipient and does not construe to be any investment, legal or taxation advice to you. NBEPL is not soliciting any action based upon it. Nothing in this research shall be construed as a solicitation to buy or sell any security or product, or to engage in or refrain from engaging in any such transaction. In preparing this research, we did not take into account the investment objectives, financial situation and particular needs of the reader.
This research has been prepared for the general use of the clients of NBEPL and must not be copied, either i n whole or in part, or distributed or redistributed to any other person in any form. If you are not the intended recipient you must not use or disclose the information in this research in any way. Though disseminated to all the customers simultaneously, not all customers may receive this report at the same time. NBEPL will not treat recipients as customers by virtue of their receiving this report. This report is not directed or intended for distribution to or use by any person or entity resident in a state, country or any jurisdiction, where such distribution, publication, availability or use would be contrary to law, regulation or which would subject NBEPL & its group companies to registration or licensing requirements within such jurisdictions.
The report is based on the information obtained from sources believed to be reliable, but we do not make any representation or warranty that it is accurate, complete or up-to-date and it should not be relied upon as such. We accept no obligation to correct or update the information or opinions in it. NBEPL or any of its affiliates or employees shall not be in any way responsible for any loss or damage that may arise to any person from any inadvertent error in the information contained in this report. NBEPL or any of its affiliates or employees do not provide, at any time, any express or implied warranty of any kind, regarding any matter pertaining to this report, including without limitation the implied warranties of merchantability, fitness for a particular purpose, and non-infringement. The recipients of this report should rely on their own investigations.
This information is subject to change without any prior notice. NBEPL reserves its absolute discretion and right to make or refrain from making modifications and alterations to this statement from time to time. Nevertheless, NBEPL is committed to providing independent and transparent recommendations to its clients, and would be happy to provide information in response to specific client queries.
Before making an investment decision on the basis of this research, the reader needs to consider, with or without the assistance of an adviser, whether the advice is appropriate in light of their particular investment needs, objectives and financial circumstances. There are risks involved in securities trading. The price of securities can and does fluctuate, and an individual security may even become valueless. International investors are reminded of the additional risks inherent in international investments, such as currency fluctuations and international stock market or economic conditions, which may adversely affect the value of the investment. Opinions expressed are subject to change without any notice. Neither the company nor the director or the employees of NBEPL accept any liability whatsoever for any direct, indirect, consequential or other loss arising from any use of this research and/or further communication in relation to this research. Here it may be noted that neither NBEPL, nor its directors, employees, agents or representatives shall be liable for any damages whether direct or indirect, incidental, special or consequential including lost revenue or lost profit that may arise from or in connection with the use of the information contained in this report.
Copyright of this document vests exclusively with NBEPL.
Our reports are also available on our website www.nirmalbang.com
Access all our reports on Bloomberg, Thomson Reuters and Factset.
Team Details:
Name Email Id Direct Line
Rahul Arora CEO [email protected] -
Girish Pai Head of Research [email protected] +91 22 6273 8017 / 18
Dealing
Ravi Jagtiani Dealing Desk [email protected] +91 22 6273 8230, +91 22 6636 8833
Michael Pillai Dealing Desk [email protected] +91 22 6273 8102/8103, +91 22 6636 8830
Nirmal Bang Equities Pvt. Ltd.
Correspondence Address
B-2, 301/302, Marathon Innova,
Nr. Peninsula Corporate Park,
Lower Parel (W), Mumbai-400013.
Board No. : 91 22 6273 8000/1; Fax. : 022 6273 8010
Related Documents