Gibbs Phase Rule P + F = C + 2 P: # of phases F: Degrees of freedom C: # of components Normally, pressure = 1 atm P + F = C + 1 or F = C - P + 1 Apply to eutectic phase diagram 1 phase field: F = 2 – 1 + 1 = 2 Change T and C independently in phase field 2 phase field: F = 2 – 2 + 1 = 1 C depends on T – not independent 3 phase point: F = 2 – 3 +1 = 0 C and T defined only at one point (Eutectic point) (no degrees of freedom)

Welcome message from author
This document is posted to help you gain knowledge. Please leave a comment to let me know what you think about it! Share it to your friends and learn new things together.
Transcript

Gibbs Phase RuleP + F = C + 2
P: # of phasesF: Degrees of freedomC: # of components
Normally, pressure = 1 atm
P + F = C + 1
or
F = C - P + 1Apply to eutectic phase diagram
1 phase field: F = 2 – 1 + 1 = 2 Change T and C independently in phase field
2 phase field: F = 2 – 2 + 1 = 1 C depends on T – not independent
3 phase point: F = 2 – 3 +1 = 0 C and T defined only at one point(Eutectic point) (no degrees of freedom)
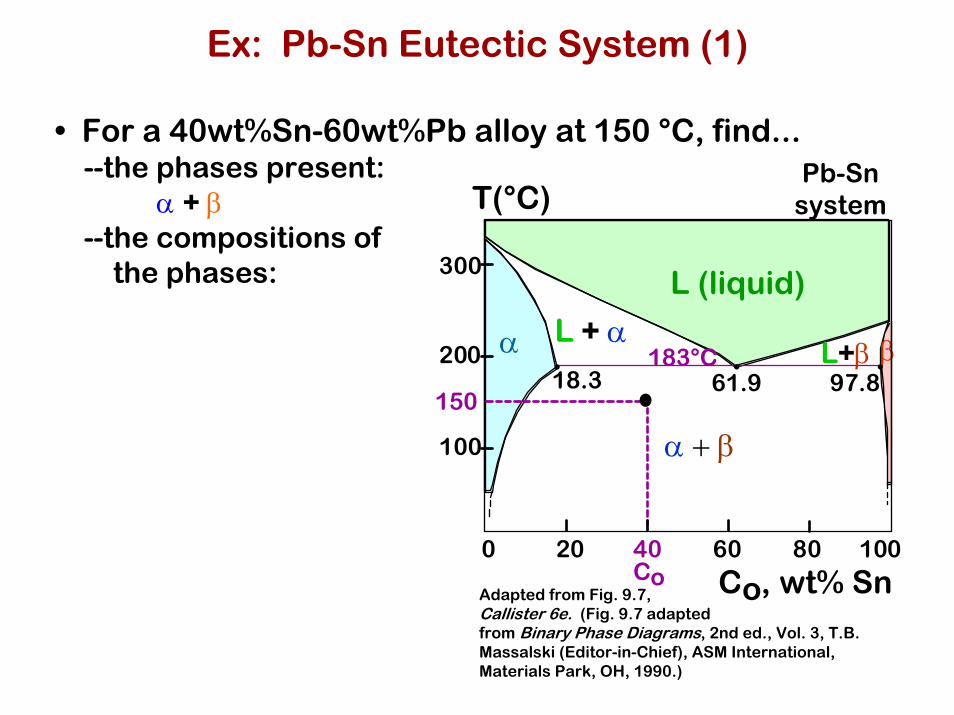
Ex: Pb-Sn Eutectic System (1)
• For a 40wt%Sn-60wt%Pb alloy at 150 °C, find...--the phases present:
α + β--the compositions of
the phases:
Pb-Snsystem
Adapted from Fig. 9.7, Callister 6e. (Fig. 9.7 adaptedfrom Binary Phase Diagrams, 2nd ed., Vol. 3, T.B. Massalski (Editor-in-Chief), ASM International, Materials Park, OH, 1990.)
L + α L+β
α + β
200
T(°C)
18.3
Co, wt% Sn 20 40 60 80 100 0
Co
300
100
β
L (liquid)
α 183°C 61.9 97.8
150
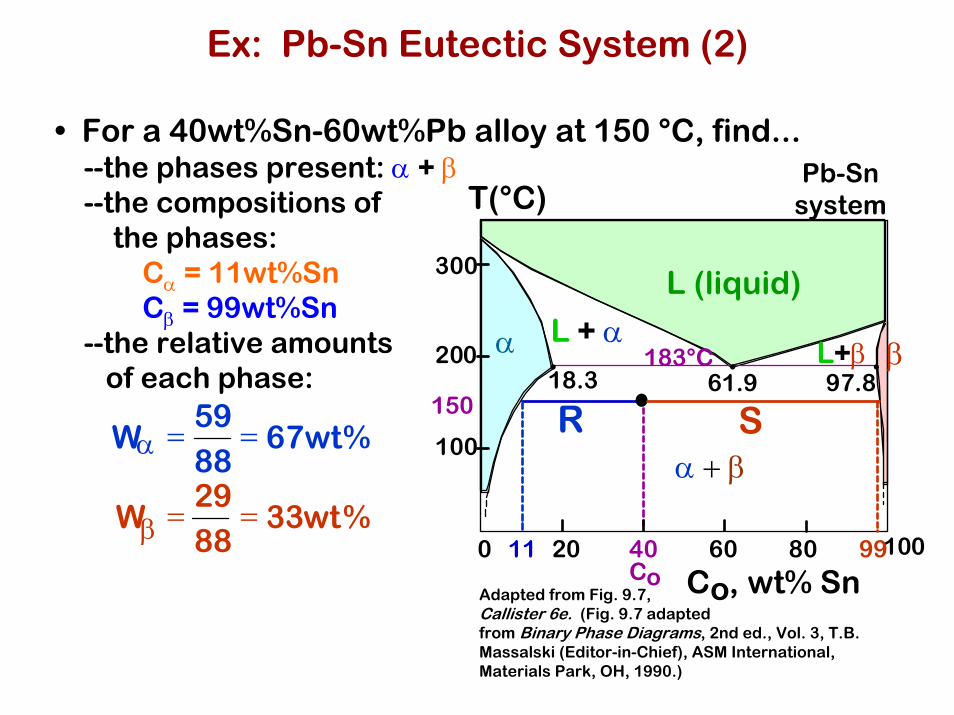
Ex: Pb-Sn Eutectic System (2)
• For a 40wt%Sn-60wt%Pb alloy at 150 °C, find...--the phases present: α + β--the compositions of
the phases:Cα = 11wt%SnCβ = 99wt%Sn
--the relative amountsof each phase:
W α = 59 88
= 67 wt %
W β = 29 88
= 33 wt %
Pb-Snsystem
Adapted from Fig. 9.7, Callister 6e. (Fig. 9.7 adaptedfrom Binary Phase Diagrams, 2nd ed., Vol. 3, T.B. Massalski (Editor-in-Chief), ASM International, Materials Park, OH, 1990.)
L + α L+β
α + β
200
T(°C)
18.3
Co, wt% Sn 20 40 60 80 100 0
Co
300
100
L (liquid)
α 183°C 61.9 97.8
150
11 99
R S
β
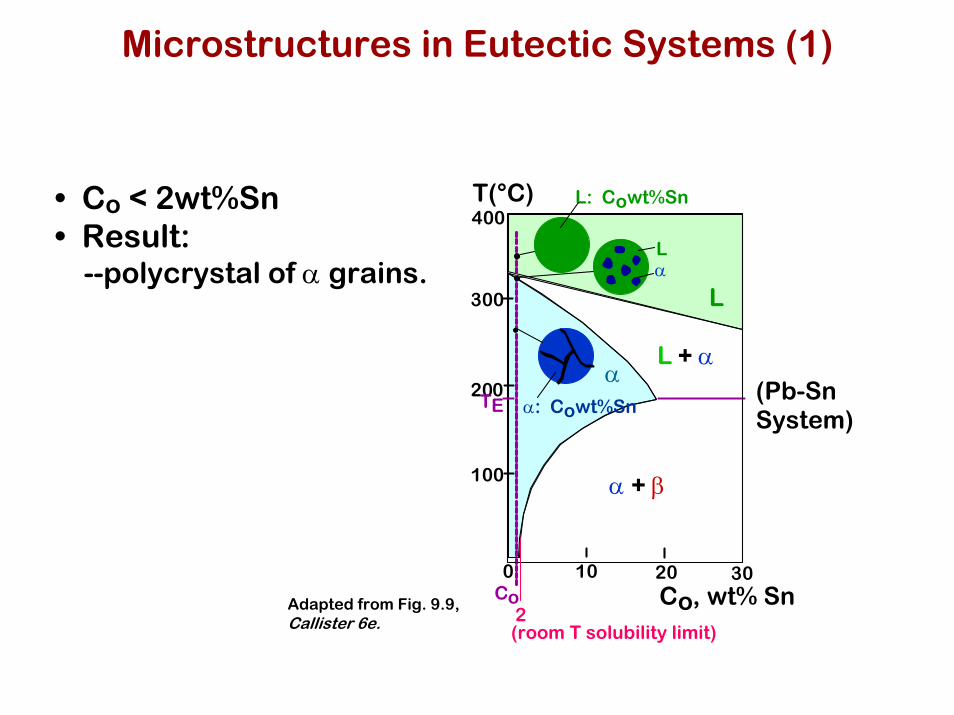
Microstructures in Eutectic Systems (1)
L + α200
T(°C)
Co, wt% Sn10
2
200Co
300
100
L
α
30
L: Cowt%Sn
αL
α: Cowt%Sn
α + β
400
(room T solubility limit)
TE(Pb-Sn System)
• Co < 2wt%Sn• Result:
--polycrystal of α grains.
Adapted from Fig. 9.9, Callister 6e.

Microstructures in Eutectic Systems (2)
• 2wt%Sn < Co < 18.3wt%Sn• Result:
--α polycrystal with fineβ crystals.
α: Cowt%SnL + α
200
T(°C)
Co, wt% Sn10
18.3
200Co
300
100
L
α
30
L: Cowt%Sn
α + β
400
(sol. limit at TE)
TE
2(sol. limit at Troom)
Lα
αβ
Pb-Snsystem
Adapted from Fig. 9.10, Callister 6e.

Microstructures in Eutectic Systems (3)
L + α200
T(°C)
Co, wt% Sn
20 400
300
100
L
α
60
L: Cowt%Sn
α + β
TE
α: 18.3wt%Sn
β
080 100
L + β
CE18.3 97.861.9
183°C
β: 97.8wt%Sn160µm
Micrograph of Pb-Sn eutectic microstructure
• Co = CE• Result: Eutectic microstructure
--alternating layers of α and β crystals.
Pb-Snsystem
Adapted from Fig. 9.11, Callister 6e.
Adapted from Fig. 9.12, Callister 6e.(Fig. 9.12 from Metals Handbook, Vol. 9, 9th ed., Metallography and Microstructures, American Society for Metals, Materials Park, OH, 1985.)

Microstructures in Eutectic Systems (4)
• 18.3wt%Sn < Co < 61.9wt%Sn• Result: α crystals and a eutectic microstructure
L + α200
T(°C)
Co, wt% Sn
20 400
300
100
L
α
60
L: Cowt%Sn
α + β
TEβ
080 100
L + β
Co18.3 61.9
Lα
Lα
primary α
97.8
S
S
RR
eutectic αeutectic β
Pb-Snsystem
• Just above TE:
WL = (1-Wα) =50wt%
Cα = 18.3wt%Sn
CL = 61.9wt%SnS
R + SWα = =50wt%
• Just below TE:Cα = 18.3wt%Sn
Cβ = 97.8wt%SnS
R + SWα = =73wt%
Wβ = 27wt%Adapted from Fig. 9.14, Callister 6e.

Microstructure in Eutectic Systems (4')

Hypoeutectic Microstructure
Microstructure50% Pb – 50% Sn alloyExpain the phases

Hypoeutectic & Hypereutectic
T(°C)
(Pb-Sn System)
L + α200
Co, wt% Sn20 400
300
100
L
α
60
α + β
TE β
080 100
L + β
18.361.9
97.8
Cohypoeutectic
Cohypereutectic
eutectic
hypereutectic: (illustration only)
160µm
eutectic: Co=61.9wt%Sn
175µm
β
ββ
ββ
β
α
α
α
αα
α
hypoeutectic: Co=50wt%Sn
eutectic micro-constituent
Adapted from Fig. 9.7, Callister 6e. (Fig. 9.7 adapted from Binary Phase Diagrams, 2nd ed., Vol. 3, T.B. Massalski (Editor-in-Chief), ASM International, Materials Park, OH, 1990.)
(Figs. 9.12 and 9.15 from Metals Handbook, 9th ed.,Vol. 9, Metallography and Microstructures, American Society for Metals, Materials Park, OH, 1985.)
Adapted from Fig. 9.15, Callister 6e. Adapted from Fig. 9.12,
Callister 6e.
Adapted from Fig. 9.15, Callister 6e. (Illustration only)
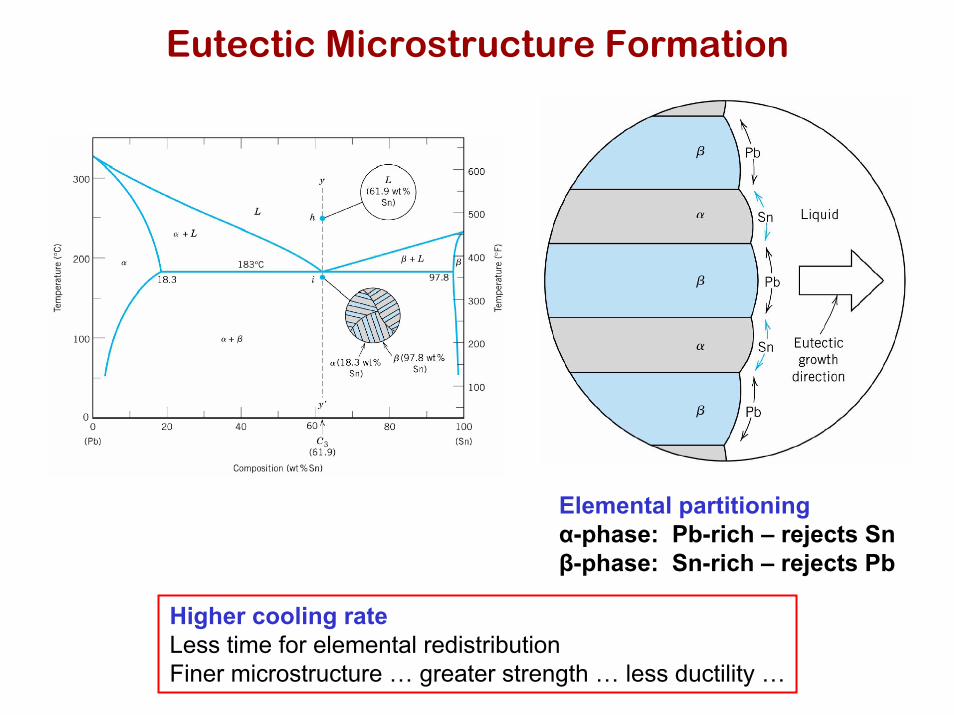
Eutectic Microstructure Formation
Elemental partitioningα-phase: Pb-rich – rejects Snβ-phase: Sn-rich – rejects Pb
Higher cooling rateLess time for elemental redistributionFiner microstructure … greater strength … less ductility …
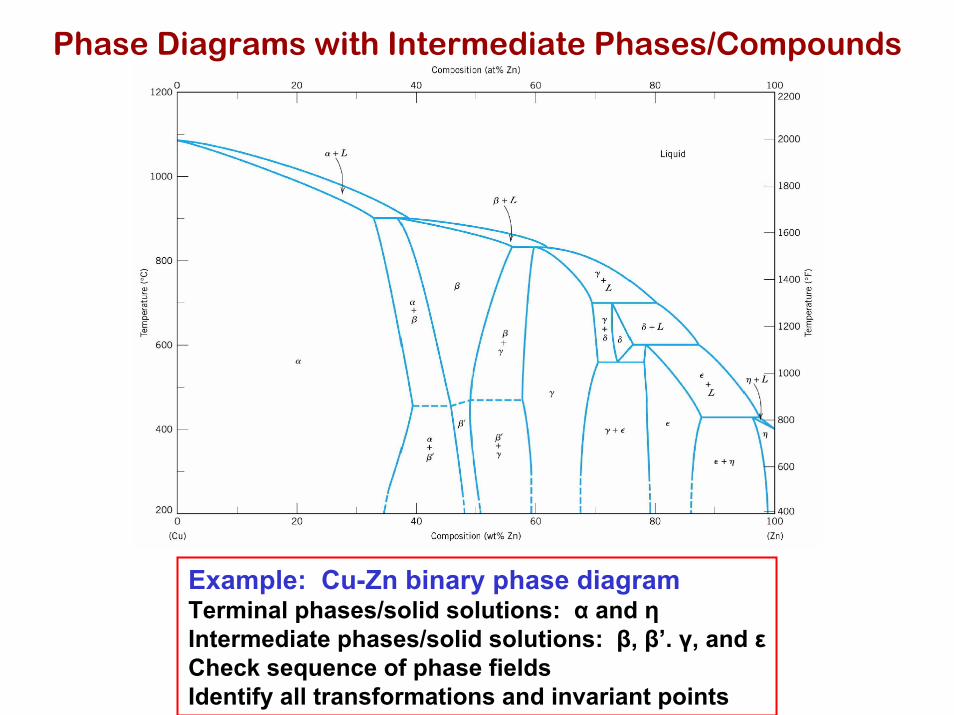
Phase Diagrams with Intermediate Phases/Compounds
Example: Cu-Zn binary phase diagramTerminal phases/solid solutions: α and ηIntermediate phases/solid solutions: β, β’. γ, and εCheck sequence of phase fieldsIdentify all transformations and invariant points
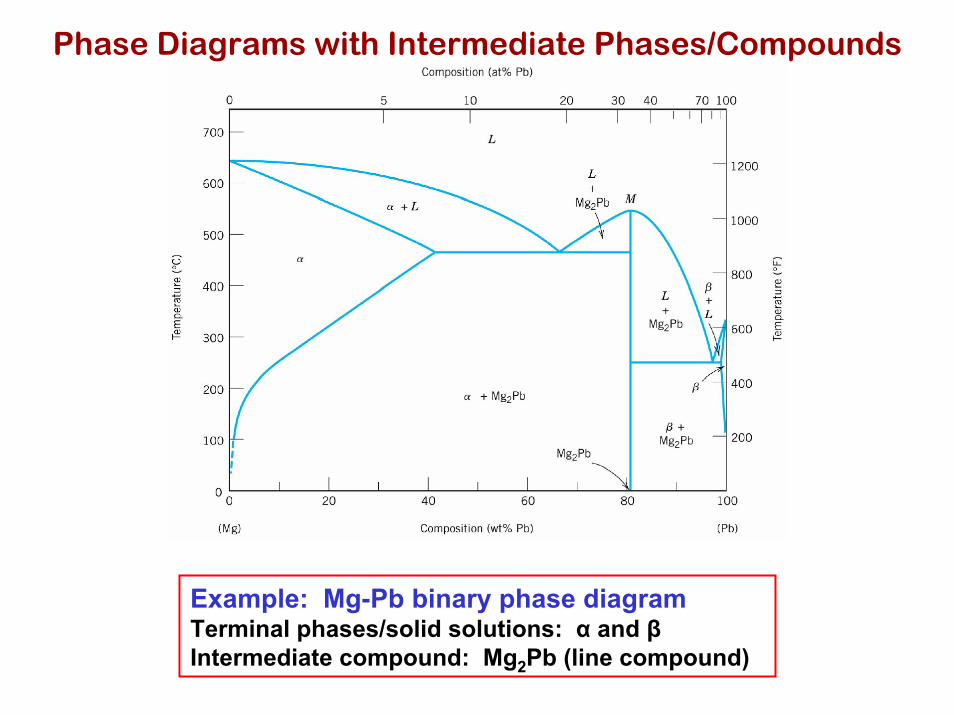
Phase Diagrams with Intermediate Phases/Compounds
Example: Mg-Pb binary phase diagramTerminal phases/solid solutions: α and βIntermediate compound: Mg2Pb (line compound)

Phase Diagrams with Intermediate Phases/Compounds
Example: Sn-Au binary phase diagramTerminal phases/solid solutions: α and ηIntermediate compounds: β, γ, δ, ζ

Eutectoid and Peritectic Reactions
Eutectoid
δ ↔ γ + ε
Pertectic
δ + L ↔ ε
Section of Cu-Zn Phase Diagram
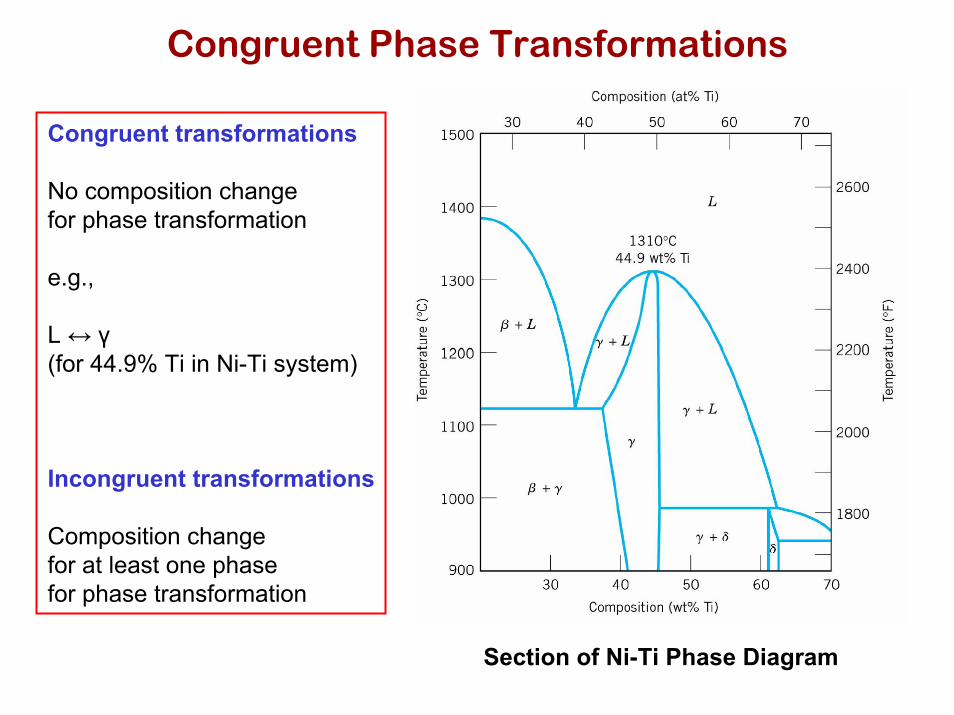
Congruent Phase Transformations
Congruent transformations
No composition changefor phase transformation
e.g.,
L ↔ γ(for 44.9% Ti in Ni-Ti system)
Incongruent transformations
Composition changefor at least one phasefor phase transformation
Section of Ni-Ti Phase Diagram

Fe-C Phase Diagram (Steel!)

Iron-Carbon (Fe-C) Phase Diagram
Adapted from Fig. 9.21,Callister 6e. (Fig. 9.21 adapted from Binary Alloy Phase Diagrams, 2nd ed.,Vol. 1, T.B. Massalski (Ed.-in-Chief), ASM International, Materials Park, OH, 1990.)
(Adapted from Fig. 9.24, Callister 6e. (Fig. 9.24 from Metals Handbook, 9th ed., Vol. 9, Metallography and Microstructures, American Society for Metals, Materials Park, OH, 1985.)
Result: Pearlite = alternating layers of α and Fe3C phases.
120µm
• 2 important points
-Eutectic (A):
-Eutectoid (B): L ⇒ γ + Fe3C
γ ⇒ α +Fe3C
Fe
3C
(c
em
en
tite
)
1600
1400
1200
1000
800
600
4000 1 2 3 4 5 6 6.7
L
γ (austenite)
γ+L
γ+Fe3C
α+Fe3C
α+γ
L+Fe3C
δ
(Fe) Co, wt% C0.77 4.30
727°C = Teutectoid
1148°C
T(°C)
A
B
SR
R S
γ γγγ
Fe3C (cementite-hard)α (ferrite-soft)
αC
eu
tec
toid

Hypoeutectoid Steel
Adapted from Figs. 9.21 and 9.26,Callister 6e. (Fig. 9.21 adapted from Binary Alloy Phase Diagrams, 2nd ed., Vol. 1, T.B. Massalski (Ed.-in-Chief), ASM International, Materials Park, OH, 1990.)
Adapted fromFig. 9.27,Callister6e. (Fig. 9.27 courtesy Republic Steel Corporation.)
(Fe-C System)
Co
Fe
3C
(c
em
en
tite
)
1600
1400
1200
1000
800
600
4000 1 2 3 4 5 6 6.7
L
γ (austenite)
γ+L
γ+Fe3C
α+Fe3C
L+Fe3C
δ
Co, wt% C0.7
7
727°C
1148°C
T(°C)
R S
γ γγγ
α
γγγ γ
γγ γ
γ r s
wα =s/(r+s)wγ =(1-wα)
wα =S/(R+S)wFe3C =(1-wα)
wpearlite = wγ
α
αα
αα
α pearlite
100µm Hypoeutectoid steel

Hypoeutectoic Steel
MicrostructureFe-0.38% C Steel

Hypereutectoid Steel
(Fe-C System)
Co
Fe
3C
(c
em
en
tite
)
1600
1400
1200
1000
800
600
4000 1 2 3 4 5 6 6.7
L
γ (austenite)
γ+L
γ+Fe3C
α+Fe3C
L+Fe3C
δ
Co, wt% C0.7
71148°C
T(°C)
R S
γ γγγ
αs
wFe3C =r/(r+s)wγ =(1-wFe3C)
wα =S/(R+S)wFe3C =(1-wα)
wpearlite = wγpearlite
60µm Hypereutectoid steel
rγγ
γ γ
γγγ γ
Fe3C
Adapted from Figs. 9.21 and 9.29,Callister 6e. (Fig. 9.21 adapted from Binary Alloy Phase Diagrams, 2nd ed., Vol. 1, T.B. Massalski (Ed.-in-Chief), ASM International, Materials Park, OH, 1990.)
Adapted fromFig. 9.30,Callister6e. (Fig. 9.30copyright 1971 by United States Steel Corporation.)

Pearlite Microstructure
Partitioning of carbon (to Fe3C)

Alloying Steel With More ElementsT
Eu
tec
toid
(°C
)
wt. % of alloying elements
Ti
Ni600
800
1000
1200
0 4 8 12
Mo SiW
Cr
Mn
wt. % of alloying elements
Ce
ute
cto
id (
wt%
C)
Ni
Ti
0 4 8 120
0.2
0.4
0.6
0.8
Cr
SiMnW
Mo
• Teutectoid changes: • Ceutectoid changes:
Adapted from Fig. 9.31,Callister 6e. (Fig. 9.31 from Edgar C. Bain, Functions of the Alloying Elements in Steel, American Society for Metals, 1939, p. 127.)
Adapted from Fig. 9.32,Callister 6e. (Fig. 9.32 from Edgar C. Bain, Functions of the Alloying Elements in Steel, American Society for Metals, 1939, p. 127.)
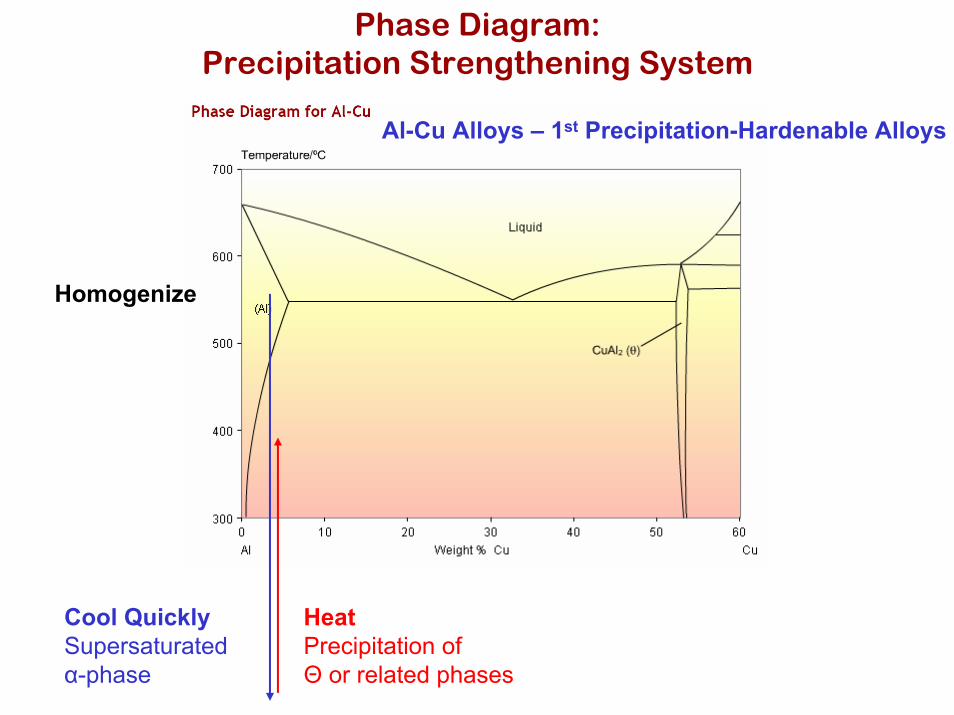
Phase Diagram:Precipitation Strengthening System
Al-Cu Alloys – 1st Precipitation-Hardenable Alloys
Homogenize
HeatPrecipitation of Θ or related phases
Cool QuicklySupersaturatedα-phase

Precipitation Strengthening In Al-Cu
Precipitation in Al-4%Cu(aged at 180 °C, 6 h)GP-Zones
Precipitation in Al-4%Cu(aged at 200 °C, 2 h)θ’ Phase
Precipitation in Al-4%Cu(aged at 450 °C, 45 min.)θ Phase
Related Documents