GHz Measurements of anomalous dust emission Richard Davis, Clive Dickinson, Rod Davies, Anthony Banday Paris

GHz Measurements of anomalous dust emission Richard Davis, Clive Dickinson, Rod Davies, Anthony Banday Paris.
Dec 17, 2015
Welcome message from author
This document is posted to help you gain knowledge. Please leave a comment to let me know what you think about it! Share it to your friends and learn new things together.
Transcript

GHz Measurements of anomalous dust emission
Richard Davis, Clive Dickinson, Rod Davies, Anthony Banday
Paris
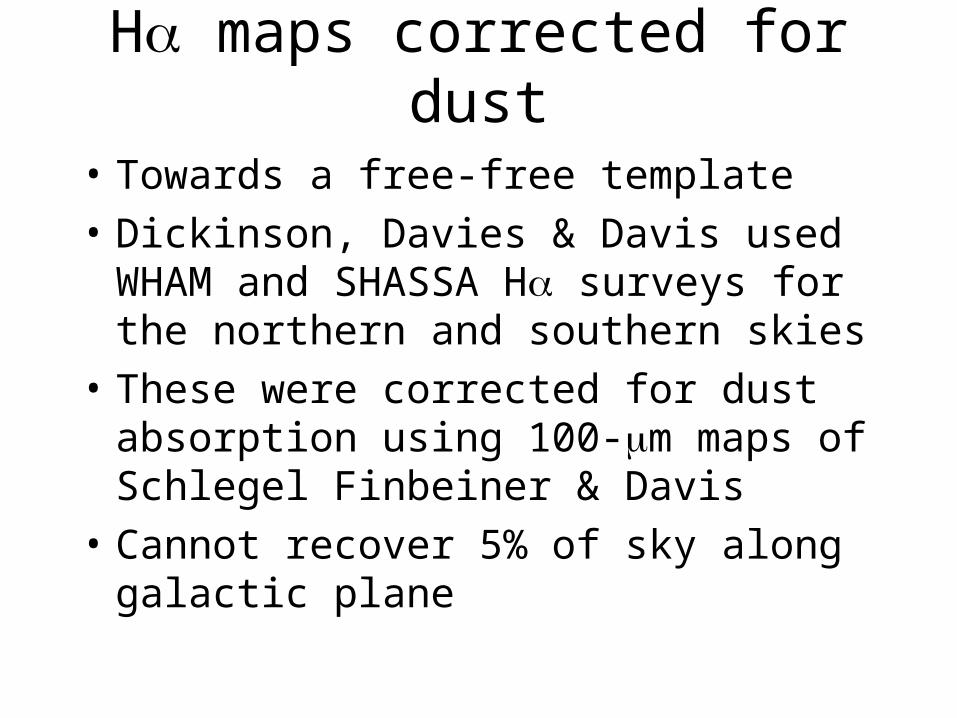
H maps corrected for dust
• Towards a free-free template
• Dickinson, Davies & Davis used WHAM and SHASSA H surveys for the northern and southern skies
• These were corrected for dust absorption using 100-m maps of Schlegel Finbeiner & Davis
• Cannot recover 5% of sky along galactic plane
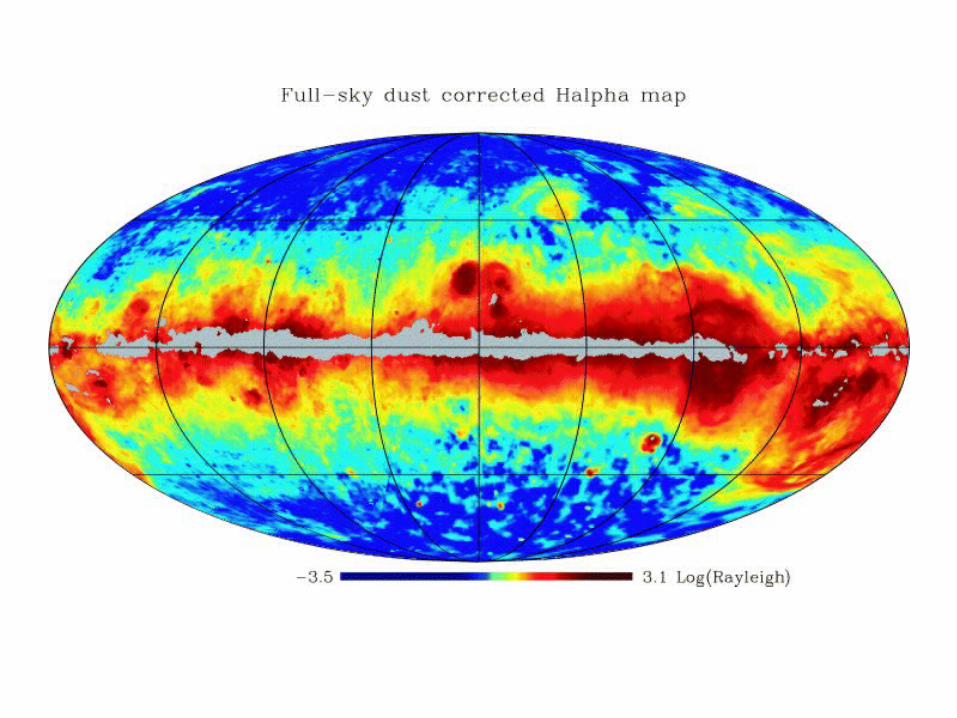
Dust corrected H alpha
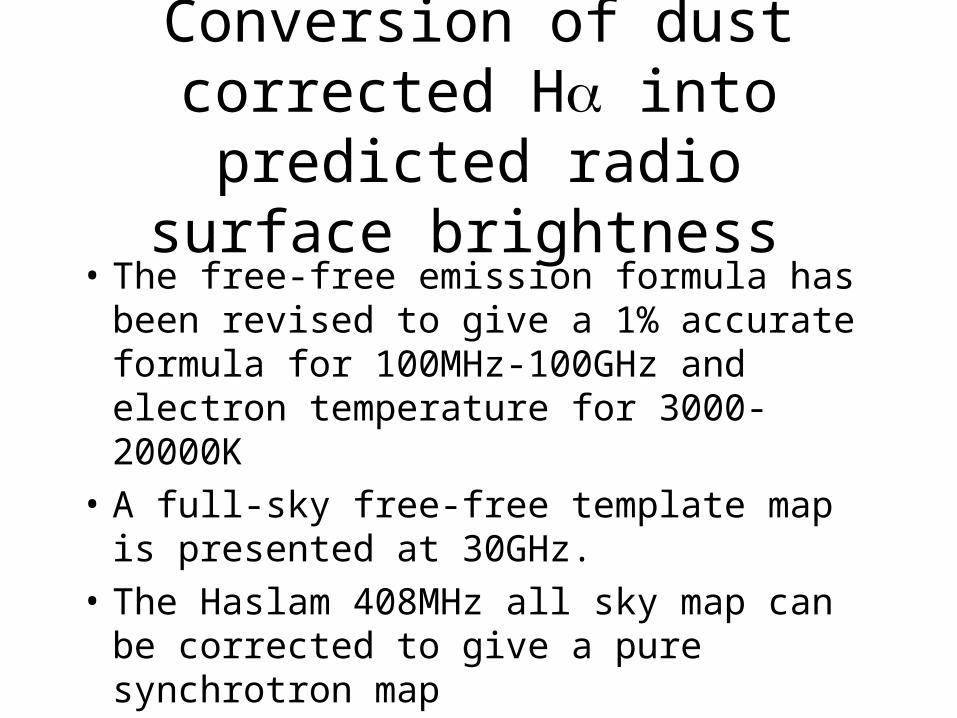
Conversion of dust corrected H into predicted radio surface
brightness• The free-free emission formula has been
revised to give a 1% accurate formula for 100MHz-100GHz and electron temperature for 3000-20000K
• A full-sky free-free template map is presented at 30GHz.
• The Haslam 408MHz all sky map can be corrected to give a pure synchrotron map

Free-free brightness temperature 5K –1mK in powers of 2 at 30 GHz

Dust map shows regions where absorption is too high
Quest for foreground X
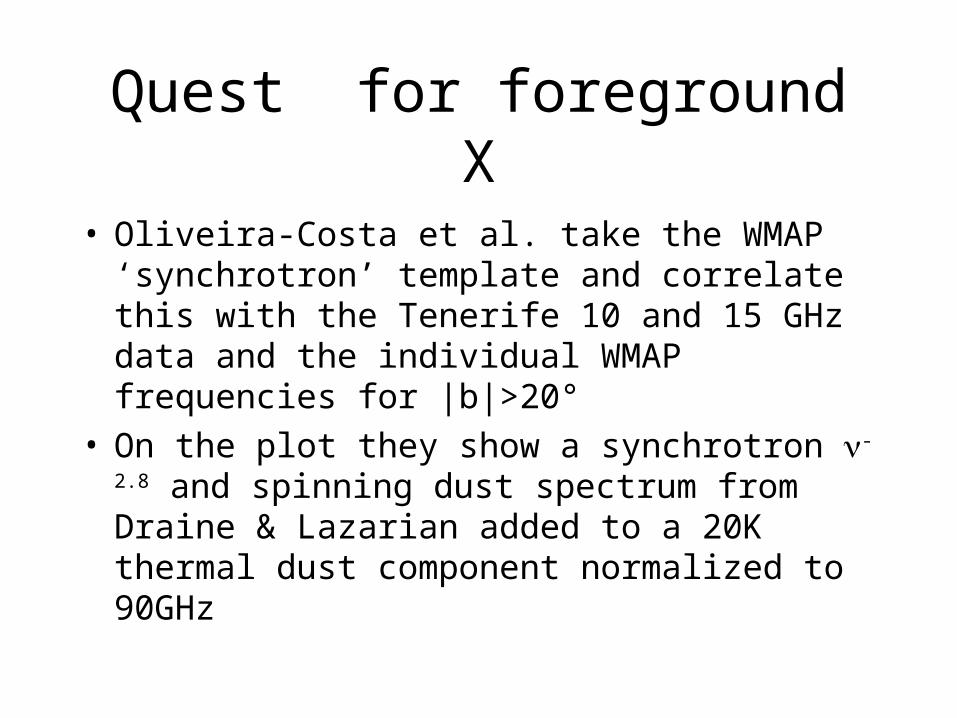
• Oliveira-Costa et al. take the WMAP ‘synchrotron’ template and correlate this with the Tenerife 10 and 15 GHz data and the individual WMAP frequencies for |b|>20°
• On the plot they show a synchrotron -2.8 and spinning dust spectrum from Draine & Lazarian added to a 20K thermal dust component normalized to 90GHz

Foreground contribution
Microwave emission in Green Bank Galactic Plane Survey
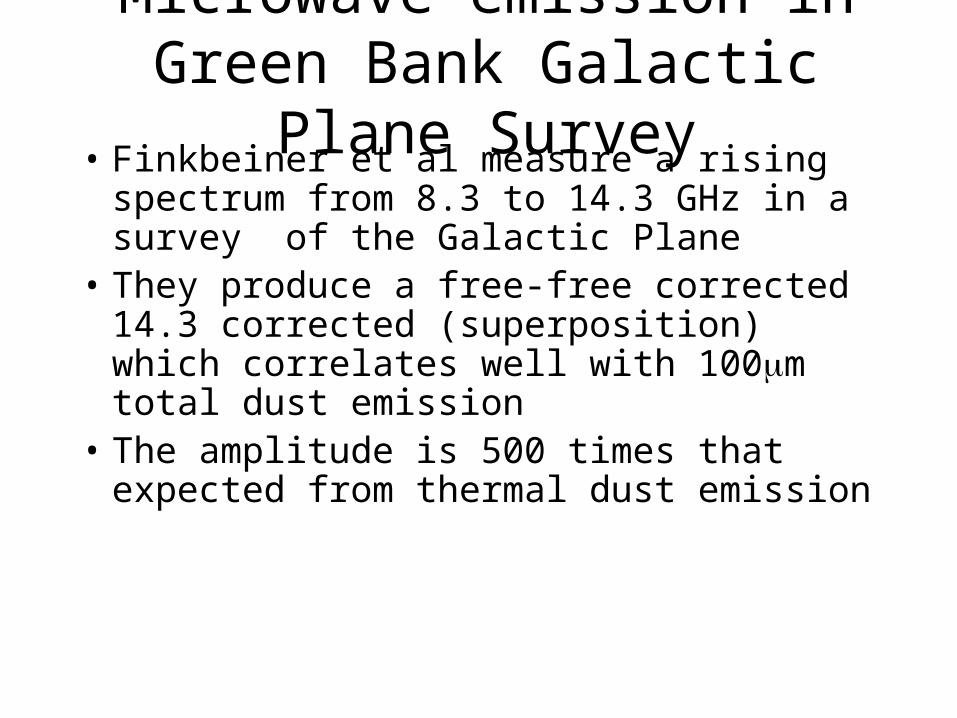
• Finkbeiner et al measure a rising spectrum from 8.3 to 14.3 GHz in a survey of the Galactic Plane
• They produce a free-free corrected 14.3 corrected (superposition) which correlates well with 100m total dust emission
• The amplitude is 500 times that expected from thermal dust emission

Combination of Rhodes 2.3GHz, Green Bank 8.3 and 14 .3 GHz and WMAP Galactic Plane data
• Each frequency channel antenna temperature is plotted against the WMAP 94GHz channel with the CMB removed and good correlations are found
• These eight frequency channels correlation slopes are then plotted against frequency
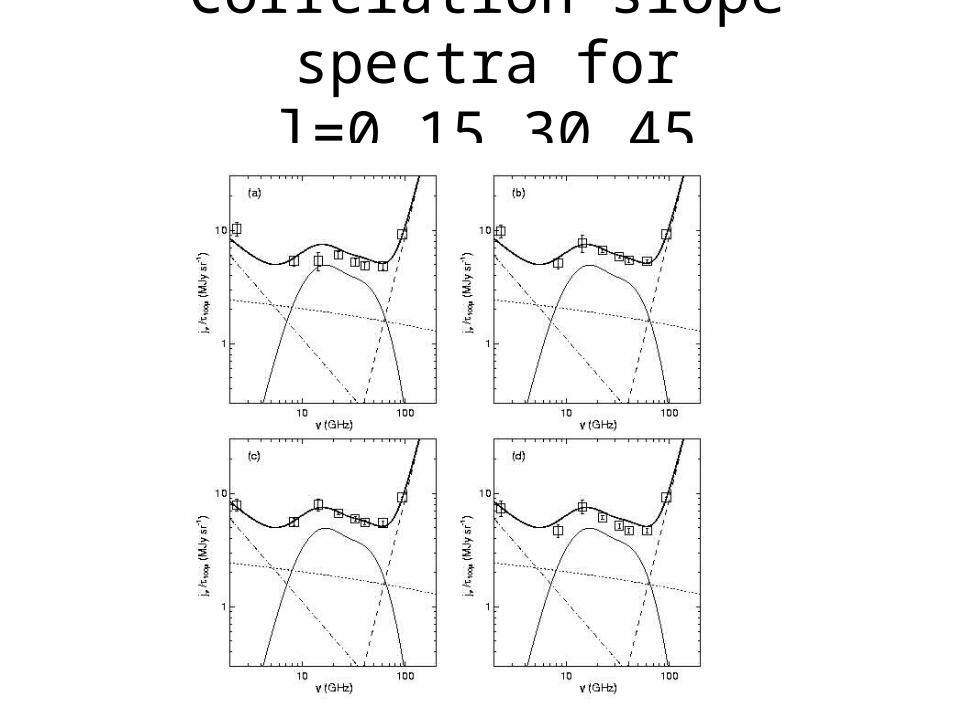
Correlation slope spectra for l=0,15,30,45

Model emissivity

Large-scale anomalous microwave from WMAP
G.Lagache
• Residual emission is found from WMAP over free-free and synchrotron with a constant spectrum from 3.2 to 9.1mm and decreases in amplitude when NHI increases
• They propose that the excess is associated with small transiently heated dust particles.
Detection of anomalous microwave emission in the Perseus Moleular cloud
• Cosmosomas finds direct evidence for anomalous microwave emission with a rising spectrum from 11 to 17 GHz
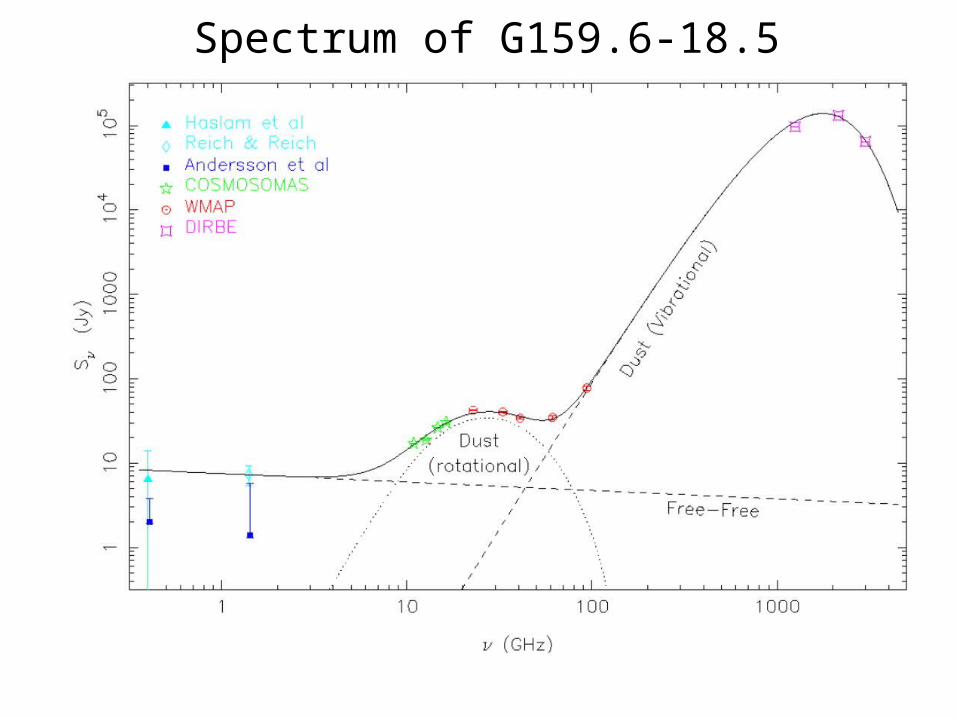
Spectrum of G159.6-18.5
Reappraising foreground contamination in COBE-DMR
• Banday et al 03 take the best foregrounds we have and correlate with DMR
• They find a strong anomalous dust component peaking ~20 GHz
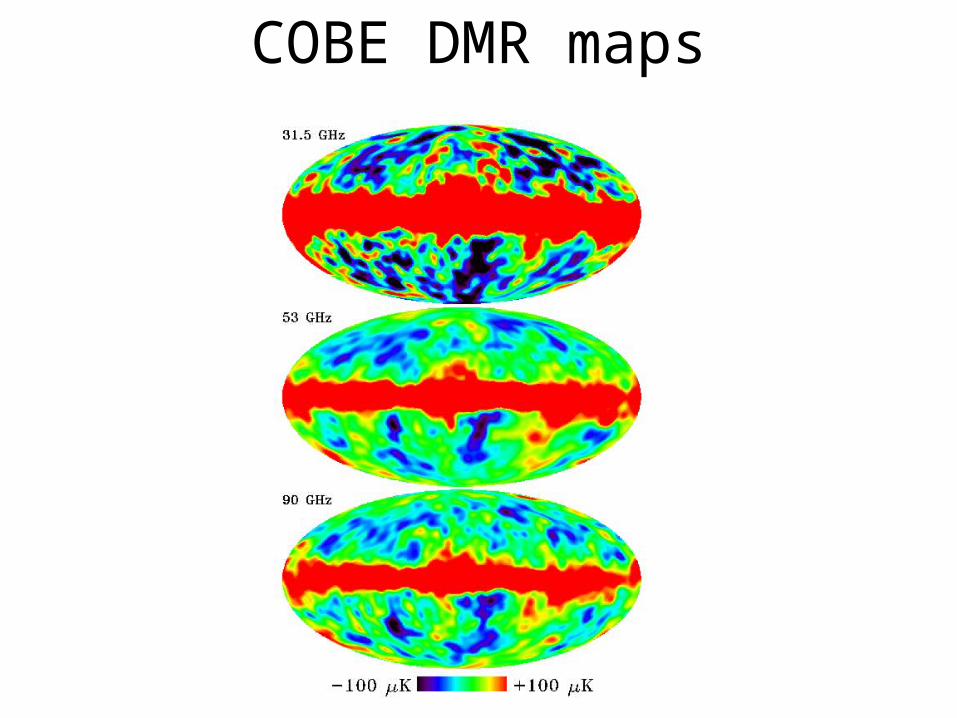
COBE DMR maps
Templates for COBE data• Dust is traced by the140-m DIRBE sky
map,all templates are convolved to 7°
resolution
• The free-free template is traced by the H map from Dickinson, Davies & Davis as described above
• The Synchrotron template is based on the Haslam 408 MHz

Derivation of coupling coefficients of foregrounds with COBE DMR
• In this analysis we treat multiple foreground templates and all three DMR channels simultaneously. This forces the CMB distribution to be invariant between the three frequencies.
• Correlation of each foreground with each COBE frequency gives the coupling coefficients
• Thermal dust has been removed from the DMR data by using the template from Finkbeiner, Davis & Schlegel
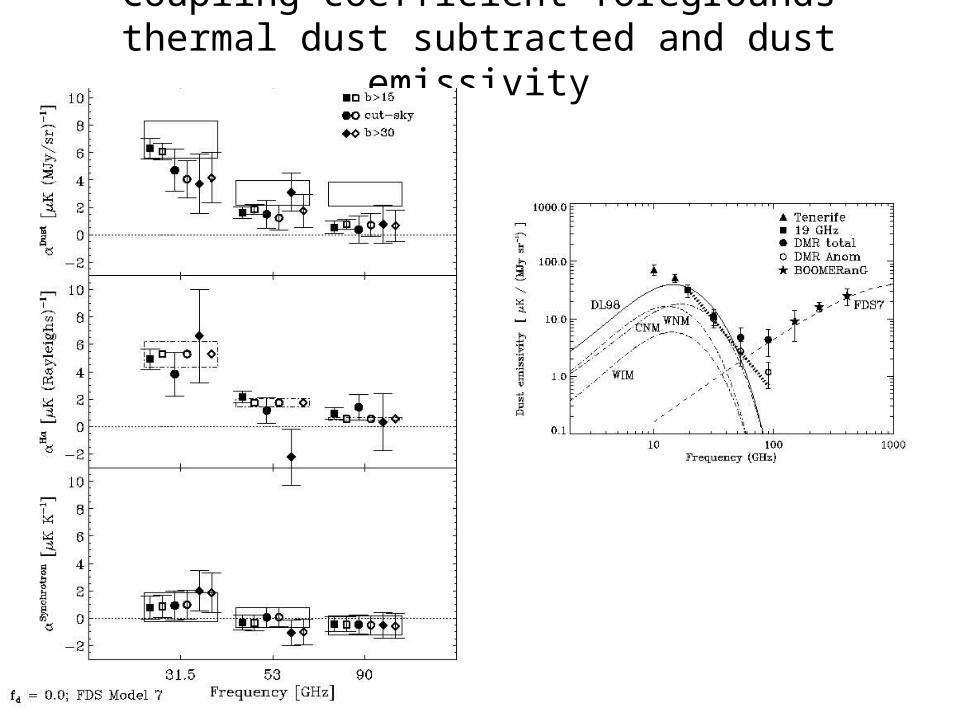
Coupling coefficient foregrounds thermal dust subtracted and dust emissivity
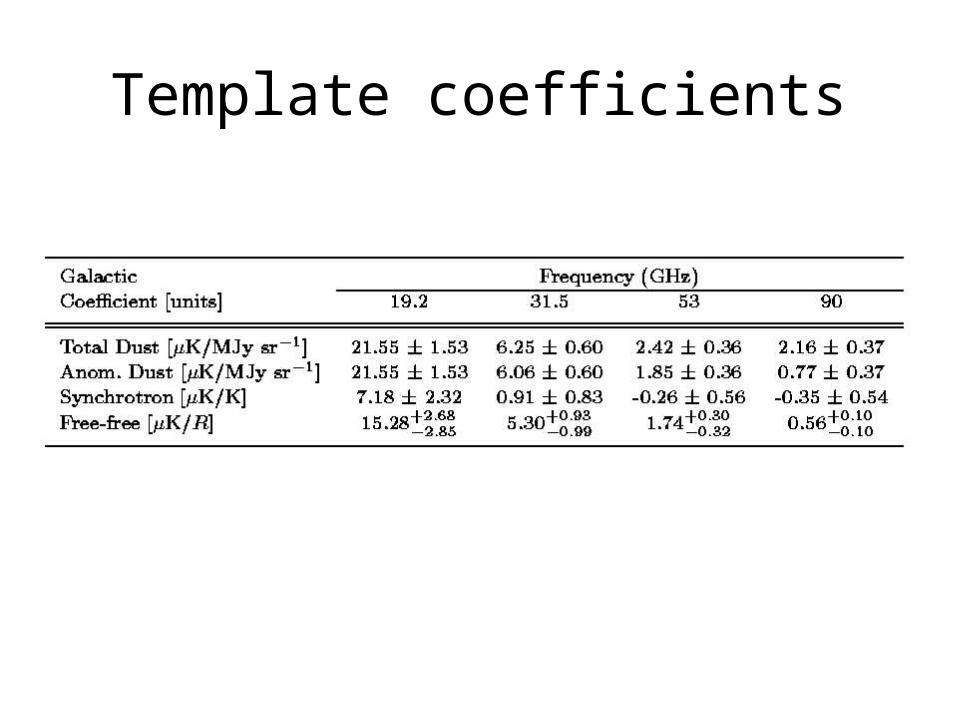
Template coefficients

Foreground contamination in K• The coupling coefficients are multiplied by
the foregrounds to obtain the contamination of the CMB
• This is for b>|20°|
• Synchrotron is dotted line
• Free-free is dot-dashed line
• Thermal dust is dashed line
• Anomalous dust is heavy dashed line

Anomalous Dust
Quantitative comparison of anomalous dust
• A careful of the calibration of work on anomalous dust
• Getting the numbers all into microK/megaJy/sr
• Finkbeiner on plane• Watson Cosmosomas on G159.6-18.5 in
Perseus Molecular cloud• Banday diffuse off the plane

microK/Mega Jy/sr
1
10
100
1000
1 10 100GHz
microK/Mjy/sr Finkbeiner et al 2004
Cosmosomas
Banday et al 2004
Finkbeiner W40
• The same calibration was done on W40 which shows a similar spectrum
• The lowest frequency was assumed to be mostly free-free and a -0.13 index was subtracted to get the true anomalous emission , if the above assumption is true
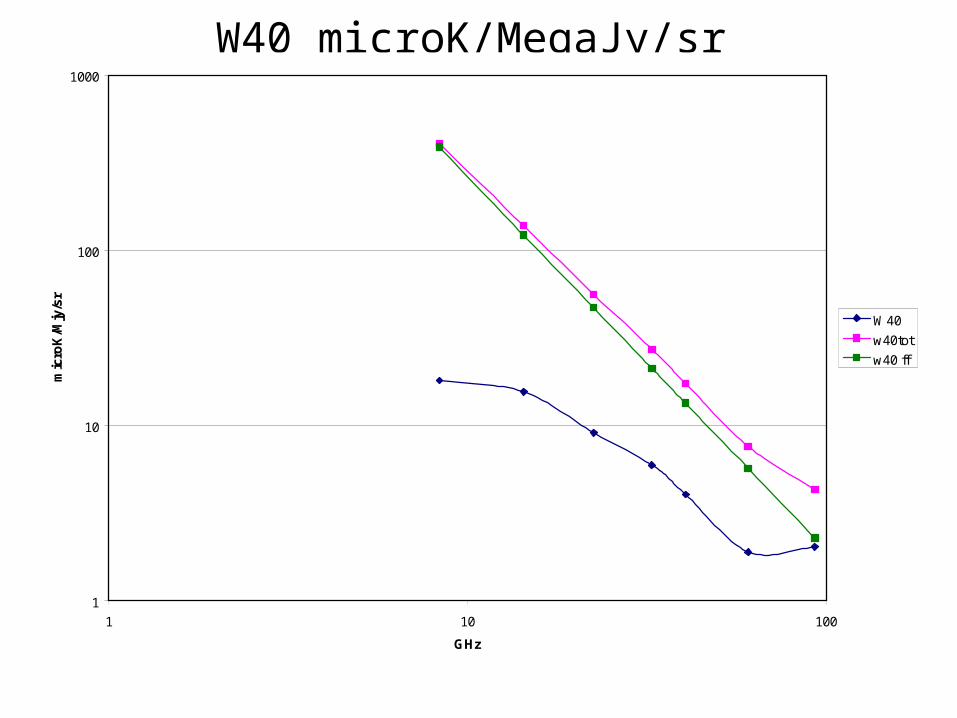
W40 microK/MegaJy/sr
1
10
100
1000
1 10 100
GHz
microK/Mjy/sr
W40
w40tot
w40 ff
Related Documents