Getting Beneath the Veil of Effective Schools: Evidence from New York City * Will Dobbie Harvard University and EdLabs Roland G. Fryer, Jr. Harvard University, EdLabs, and NBER December 2012 Abstract Charter schools were developed, in part, to serve as an R&D engine for traditional public schools, resulting in a wide variety of school strategies and outcomes. In this paper, we collect data on the inner-workings of 39 charter schools and correlate these data with credible estimates of each school’s effectiveness. We find that traditionally collected input measures – class size, per pupil expenditure, the fraction of teachers with no certification, and the fraction of teach- ers with an advanced degree – are not correlated with school effectiveness. In stark contrast, we show that an index of five policies suggested by over forty years of qualitative research – frequent teacher feedback, the use of data to guide instruction, high-dosage tutoring, increased instructional time, and high expectations – explains approximately 45 percent of the variation in school effectiveness. We conclude by showing that our index provides similar results in a separate sample of charter schools. * We give special thanks to Seth Andrews and William Packer of Democracy Prep Charter School, Michael Gold- stein of the MATCH charter school, and James Merriman and Myrah Murrell from the New York City Charter School Center for invaluable assistance in collecting the data necessary for this project. We are grateful to our colleagues Michael Greenstone, Larry Katz, and Steven Levitt for helpful comments and suggestions. Sara D’Alessandro, Ab- hirup Das, Ryan Fagan, Blake Heller, Daniel Lee, Sue Lin, George Marshall, Sameer Sampat, and Allison Sikora provided exceptional project management and research assistance. Financial support was provided by the John and Laura Arnold Foundation, the Broad Foundation, and the Fisher Foundation. Correspondence can be addressed to the authors by e-mail: [email protected] [Dobbie] or [email protected] [Fryer]. The usual caveat applies.

Welcome message from author
This document is posted to help you gain knowledge. Please leave a comment to let me know what you think about it! Share it to your friends and learn new things together.
Transcript

Getting Beneath the Veil of Effective Schools:Evidence from New York City∗
Will DobbieHarvard University and EdLabs
Roland G. Fryer, Jr.Harvard University, EdLabs, and NBER
December 2012
Abstract
Charter schools were developed, in part, to serve as an R&D engine for traditional publicschools, resulting in a wide variety of school strategies and outcomes. In this paper, we collectdata on the inner-workings of 39 charter schools and correlate these data with credible estimatesof each school’s effectiveness. We find that traditionally collected input measures – class size,per pupil expenditure, the fraction of teachers with no certification, and the fraction of teach-ers with an advanced degree – are not correlated with school effectiveness. In stark contrast,we show that an index of five policies suggested by over forty years of qualitative research –frequent teacher feedback, the use of data to guide instruction, high-dosage tutoring, increasedinstructional time, and high expectations – explains approximately 45 percent of the variationin school effectiveness. We conclude by showing that our index provides similar results in aseparate sample of charter schools.
∗We give special thanks to Seth Andrews and William Packer of Democracy Prep Charter School, Michael Gold-stein of the MATCH charter school, and James Merriman and Myrah Murrell from the New York City Charter SchoolCenter for invaluable assistance in collecting the data necessary for this project. We are grateful to our colleaguesMichael Greenstone, Larry Katz, and Steven Levitt for helpful comments and suggestions. Sara D’Alessandro, Ab-hirup Das, Ryan Fagan, Blake Heller, Daniel Lee, Sue Lin, George Marshall, Sameer Sampat, and Allison Sikoraprovided exceptional project management and research assistance. Financial support was provided by the John andLaura Arnold Foundation, the Broad Foundation, and the Fisher Foundation. Correspondence can be addressed tothe authors by e-mail: [email protected] [Dobbie] or [email protected] [Fryer]. The usual caveat applies.

1 Introduction
Improving the efficiency of public education in America is of great importance. The United States
spends $10,768 per pupil on primary and secondary education, ranking it fourth among OECD
countries (Aud et al. 2011). Yet, among these same countries, American fifteen year-olds rank
twenty-fifth in math achievement, seventeenth in science, and fourteenth in reading (Fleischman
2010). Traditionally, there have been two approaches to increasing educational efficiency: (1) expand
the scope of available educational options in the hope that the market will drive out ineffective
schools, or (2) directly manipulate inputs to the educational production function.1
Evidence on the efficacy of both approaches is mixed. Market-based reforms such as school
choice or school vouchers have, at best, a modest impact on student achievement (Hoxby 1994,
Rouse 1998, Hoxby 2000, 2003, Krueger and Zhu 2004, Carnoy et al. 2007, Chakrabarti 2008, Wolf
et al. 2010, Card, Dooley, and Payne 2010, Winters forthcoming). This suggests that competition
alone is unlikely to significantly increase the efficiency of the public school system.
Similarly, efforts to manipulate key educational inputs have been hampered by an inability to
identify school inputs that predict student achievement (Hanushek 1997).2 This is due, at least in
part, to a paucity of detailed data on the strategies and operations of schools, little variability in
potentially important inputs (e.g. instructional time), and the use of non-causal estimates of school
effectiveness. For instance, the vast majority of quantitative analyses only account for inputs such
as class size, per pupil expenditure, or the fraction of teachers with an advanced degree. Measures of
teacher development, data driven instruction, school culture, and student expectations have never
been collected systematically, despite decades of qualitative research suggesting their importance
(see reviews in Edmonds 1979, 1982).
In this paper, we provide new evidence on the determinants of school effectiveness by collecting
data on the inner-workings of 39 charter schools in New York City and correlating these data with
credible estimates of each school’s effectiveness. We collected information on school practices from a
variety of sources. A principal interview asked about teacher development, instructional time, data
driven instruction, parent outreach, and school culture. Teacher interviews asked about professional
1Increasing standards and accountability reflect a third approach to education reform. There is evidence thatincreased accountability via the No Child Left Behind Act had a positive impact on math test scores, but not readingtest scores (Dee and Jacob 2011).
2Krueger (2003) argues that resources are systematically related to student achievement when the studies inHanushek (1997) are given equal weight. It is only when each estimate is counted separately, as in Hanushek (1997),that the relationship between resources and achievement is not significant. There is some evidence that instructionaltime is associated with increased test scores (Pischke 2007).
1

development, school policies, school culture, and student assessment. Student interviews asked
about school environment, school disciplinary policy, and future aspirations. Lesson plans were
used to measure curricular rigor. Videotaped classroom observations were used to calculate the
fraction of students on task throughout the school day.
School effectiveness is estimated using two empirical models. The first exploits the fact that
oversubscribed charter schools in New York City are required to admit students via random lottery.
In this scenario, the treatment group is composed of students who are lottery winners and the control
group consists of students who are lottery losers. An important caveat to our lottery analysis is
that oversubscribed lottery admissions records are only available for 29 of our 39 schools. To get an
estimate of school effectiveness for schools in our sample that do not have valid lottery data or are
not oversubscribed, our second empirical strategy uses a combination of matching and regression
estimators to control for observed differences between students attending different types of schools.
The observational estimates compare demographically similar students zoned to the same school
and in the same age cohort, who nevertheless spend different amounts of time in charter schools.
Schools in our sample employ a wide variety of educational strategies and philosophies, providing
dramatic variability in school inputs. For instance, the Bronx Charter School for the Arts believes
that participation in the arts is a catalyst for academic and social success. The school integrates
art into almost every aspect of the classroom, prompting students to use art as a language to
express their thoughts and ideas. At the other end of the spectrum are a number of so-called “No
Excuses” schools, such as KIPP Infinity, the HCZ Promise Academies, and the Democracy Prep
Charter School. These “No Excuses” schools emphasize frequent testing, dramatically increased
instructional time, parental pledges of involvement, aggressive human capital strategies, a “broken
windows” theory of discipline, and a relentless focus on math and reading achievement (Carter 2000,
Thernstrom and Thernstrom 2004, Whitman 2008). This variability, combined with rich measures
of school inputs and credible estimates of each school’s impact on student achievement, provides an
ideal opportunity to understand which inputs best explain school effectiveness.
In our empirical analysis, we find that input measures associated with a traditional resource-
based model of education – class size, per pupil expenditure, the fraction of teachers with no teaching
certification, and the fraction of teachers with an advanced degree – are not correlated with school
effectiveness in our sample. Indeed, our data suggest that increasing resource-based inputs may
actually lower school effectiveness. Using observational estimates of school effectiveness, we find
that schools with more certified teachers have annual math gains that are 0.041 (0.023) standard
2

deviations lower than other schools. Schools with more teachers with a masters degree have annual
ELA gains that are 0.032 (0.020) standard deviations lower. An index of class size, per pupil
expenditure, the fraction of teachers with no teaching certification, and the fraction of teachers
with an advanced degree, explains about 15 percent of the variance in charter school effectiveness,
but in the unexpected direction.
In stark contrast, an index of five policies suggested by forty years of qualitative case-studies
– frequent teacher feedback, data driven instruction, high-dosage tutoring, increased instructional
time, and a relentless focus on academic achievement – explains roughly half of the variation in school
effectiveness. Using observational estimates of school effectiveness, we find that a one standard
deviation (σ) increase in the index is associated with a 0.053σ (0.010) increase in annual math
gains and a 0.039σ (0.008) increase in annual ELA gains. Moreover, four out of the five school
policies in our index make a statistically significant contribution controlling for an index of the
other four, suggesting that each policy conveys some relevant information. Controlling for the other
four inputs, schools that give formal or informal feedback ten or more times per semester have
annual math gains that are 0.048σ (0.023) higher and annual ELA gains that are 0.044σ (0.014)
higher than other schools. Schools that tutor students at least four days a week in groups of six or
less have annual ELA gains that are 0.040σ (0.020) higher. Schools that add 25 percent or more
instructional time have annual gains that are 0.050σ (0.013) higher in math. Schools that have high
academic and behavioral expectations have annual math gains that are 0.044σ (0.023) higher and
ELA gains that are 0.030σ (0.015) higher.
We conclude our analysis by exploring the robustness of our results across two dimensions.
First, we show that our main results are qualitatively similar in a larger sample of charter schools
in NYC, using less detailed administrative data from site visits, state accountability reports, and
school websites. Second, we show that the results are unaffected if we control for an index of 37
other control variables collected for the purposes of this research.
Our analysis has two important caveats. First, our estimates of the relationship between school
inputs and school effectiveness are unlikely to be causal given the lack of experimental variation
in school inputs. Unobserved factors such as principal skill, student selection into lotteries, or
the endogeneity of school inputs could drive the correlations reported in the paper. Second, our
estimates come from a subset of charter schools in New York City. Although participating schools
are similar to other urban charter schools, they could differ in important ways that limit our ability
to generalize our results. Moreover, there may be inputs common to almost all of the schools in
3

our sample (e.g. a non-unionized staff) that have important interactions with other inputs. An
important next step is to inject the strategies identified here into a set of traditional public schools.
Fryer (2011) reports results from an on-going experiment implementing similar practices in nine
low-performing traditional public schools in Houston. The intervention appears to have led to
substantial test score gains, suggesting that these strategies may be effective beyond the charter
context.
The results reported in this paper contribute to a growing body of evidence using admissions
lottery records to document the effectiveness of certain charter schools. Students attending an over-
subscribed Boston-area charter school score approximately 0.4σ higher per year in math and 0.2σ
higher per year in reading (Abdulkadiroglu et al. 2011), with similar gains reported for students
attending the Promise Academy charter school in the Harlem Children’s Zone (Dobbie and Fryer
2011), the Knowledge is Power Program (KIPP) schools (Angrist et al. 2010, Tuttle et al. 2010),
and the SEED urban boarding school in Washington D.C. (Curto and Fryer forthcoming). Dobbie
and Fryer (2012) find that students attending the Promise Academy charter school also do better
on a variety of medium-term outcomes such as college enrollment and risky behaviors. The paper
most closely related to ours is Angrist, Pathak, and Walters (2011), who argue that Massachusetts
charters that adhere to a “No Excuses” model, defined as selective teacher hiring, extensive teacher
feedback, increased instructional time, and a focus on discipline, are more effective at increasing
test scores than other charter schools. These “No Excuses” practices are highly correlated with the
effective practices identified in our analysis.
The paper is structured as follows. Section 2 provides a brief overview of the literature examining
effective schools. Section 3 describes the data collected for our analysis. Section 4 details our
empirical strategy to estimate a school’s effectiveness and reports treatment effects for our sample
of charter schools. Section 5 provides a series of partial correlations of school inputs and school
effectiveness. Section 6 concludes. There are three online appendices. Online Appendix A describes
our sample and variable construction. Online Appendix B outlines our data collection process.
Online Appendix C provides information on the lottery data from each charter school.
2 A Brief Review of the Literature
Qualitative researchers have amassed a large literature exploring the attributes of effective schools.
In 1974, New York’s Office of Education Performance Review analyzed two NYC public schools
4

serving disadvantaged students, one highly effective, one not. The study concluded that differences
in academic achievement were driven by differences in principal skill, expectations for students,
and classroom instruction. Madden, Lawson, and Sweet (1976) examined 21 pairs of California
elementary schools matched on pupil characteristics, but differing in student achievement. The
more effective schools were more likely to provide teacher feedback, tutor their students, monitor
student performance, and have classroom cultures more conducive to learning. Brookover and
Lezotte (1977) found similar results for a set of schools in Michigan.
Summarizing the literature, Edmonds (1979) argued that effective schools tend to have a strong
administrative leadership, high expectations for all children regardless of background, an atmo-
sphere conducive to learning, a focus on academic achievement, and frequent monitoring of student
progress. Purkey and Smith (1983) and Sammons, Hillman, and Mortimore (1995) argue this lit-
erature suggests that effective schools have organizational structures that empower school leaders,
develop human capital, reach out to parents, create a positive school culture, and maximize learning
time. Stedman (1985) argues that, in addition to the practices suggested by Edmonds (1979) and
others, effective schools also focus on students’ racial and ethnic background while not being overly
regimented and fixated on testing.
A more recent branch of this literature focuses on the characteristics of so-called “No Excuses”
schools, loosely defined as schools that emphasize strict discipline, extended time in school, and
an intensive focus on building basic reading and math skills. Using observations from 21 high-
poverty high-performing schools, Carter (2000) argues that “No Excuses” schools succeed due to
empowered principals, the use of interim assessments to measure student progress, frequent and
effective professional development, aggressive parent outreach, and a relentless focus on achievement
for all students regardless of background. Thernstrom and Thernstrom (2004) similarly argue that
“No Excuses” schools are more effective due to more instructional time, a zero tolerance disciplinary
code, high academic expectations for all students, and an emphasis on teaching basic math and
reading skills (see Whitman 2008 for similar arguments).
3 Constructing a Database on the Inner-Workings of Schools
The main data for this paper are gathered from two sources: (1) school specific data collected from
principal, teacher, and student surveys, lesson plans, and videotaped observations of classroom
lessons, and (2) administrative data on student demographics and outcomes from the New York
5

City Department of Education (NYCDOE). Below, we describe each data source.
3.1 School Characteristics Data
In the spring of 2010, we attempted to collect survey, lottery, and video data for all charter schools in
New York City with students in grades three to eight. Eligible schools were invited to participate via
email and phone. We also hosted an informational event at the New York Charter Center to explain
the project to interested schools. Schools were offered a $5000 stipend to be received conditional
on providing all of the appropriate materials. Of the 62 eligible charter elementary schools (entry
grades of PK to fourth) and 37 eligible charter middle schools (entry grades of fifth to eighth),
26 elementary schools and 13 middle schools chose to participate in the study. Within the set of
participating schools, 19 elementary schools and ten middle schools also provided admissions lottery
data. The other ten schools were either under-subscribed or did not keep usable lottery records.
Table 1 summarizes the selection process. Appendix Table 1 lists each participating school, along
with the data that are available for each school.
A wide variety of information was collected from participating schools. A principal interview
asked about teacher and staff development, instructional time, data driven instruction, parent out-
reach, and school culture. An hour-long follow up phone interview with each school leader provided
additional details on each domain. Information on curricular rigor was coded from lesson plans
collected for each testable grade level in both math and ELA. Finally, information on school culture
and practices was gathered during full day visits to each school. These visits included videotaped
classroom observations of at least one math and reading class and interviews with four randomly
chosen teachers and four randomly chosen students.
Below we describe the variables we code from this data, with an eye towards measuring the five
inputs suggested most often by case studies of successful schools: effective human capital policies,
the use of data in instructional practice, high-dosage tutoring, increased instructional time, and
high expectations. We also code measures of parent engagement and the rigor of lesson plans to
test alternative models of schooling. Within each domain, we code an indicator variable equal to
one if a school has an above median level of that input, selecting the variable or combination of
variables that best captures the variation described by the qualitative literature. Additional details
on the data are available in Online Appendix A. Full survey and interview scripts are available in
Online Appendix B.
6

A. Human Capital
A school’s human capital policies are captured through the number of times a teacher receives
formal or informal feedback from classroom visits, how many hours teachers spend on instructional
and non-instructional activities during a normal week, the highest teacher salary at the school, the
fraction of teachers who leave involuntarily each year, and the number of non-negotiables a school
has when hiring a new teacher.
Our primary measure of a school’s human capital policies is whether the school gives an above
median amount of formal or informal feedback each semester. This measure is meant to capture
the quality of a school’s teacher development efforts, as emphasized by Madden, Lawson and Sweet
(1976), Lezotte (1977), Carter (2000), among many others. Using all of the human capital data
we collected, we also analyzed the first principal component for the entire domain. Our teacher
feedback measure has the largest loadings (element of the associated eigenvector) of any of nine
human capital variables considered. This is consistent with the frequent teacher feedback variable
containing most of the variance in human capital policies more generally.
Summary statistics for our human capital data are displayed in Table 2. We split our sample
into more and less effective schools based on estimates described in Section 4. Specifically, we
separate the sample at the median using the average of each school’s estimated impact on math and
ELA scores. Consistent with Edmonds (1979, 1982), high achieving schools have more intensive
human capital policies than other schools. The typical teacher at a high achieving elementary
school receives feedback 15.89 times per semester, compared to 10.23 times at other charter schools.
The typical teacher at a high achieving middle school receives feedback 16.50 times per semester,
over twice as much as teachers at other charter schools. Teachers at high achieving schools also
work longer hours than teachers at other charter schools, an additional 2.77 hours per week at the
elementary level and 4.12 hours per week at the middle school level. Despite this higher workload,
the maximum salary of teachers at high achieving schools is the same or somewhat lower than other
charter schools.
B. The Use of Data in Instructional Practice
We attempt to understand how schools use data through the frequency of interim assessments,
whether teachers meet with a school leader to discuss student data, how often teachers receive
reports on student results, and how often data from interim assessments are used to adjust tutoring
groups, assign remediation, modify instruction, or create individualized student goals.
7

Our primary measure of data use is an indicator for a school having an above median number
of interim assessments and an above median number of differentiation strategies. This interacted
measure is meant to indicate when schools both collect and use data to inform instruction in the way
suggested by Madden, Lawson and Sweet (1976), Lezotte (1977), Carter (2000), among many others.
Using all of the information on data we collected, we also analyzed the first principal component
for the domain. A number of other variables have virtually identical loadings, including whether a
school has an above median number of differentiation strategies and whether a school has a data
plan in place. Results are similar using these alternative measures of data driven instruction.
Summary statistics for our data driven instruction variables are displayed in Table 2. High
achieving schools use data more intensely than other charter schools in our sample. High achieving
elementary schools test students 3.50 times per semester, compared to 2.69 times at other charter
schools. Higher achieving middle schools test students 4.25 times, compared to 2.16 times at other
charter middle schools in our sample. Higher achieving schools are also somewhat more likely to
track students using data and utilize more differentiation strategies compared to low achieving
schools.
C. Parental Engagement
Parent outreach variables capture how often schools communicate with parents regarding aca-
demic performance, regarding behavioral issues, or to simply provide feedback.
Summary statistics in Table 2 suggest that high achieving elementary and middle schools pro-
vide more feedback of all types to parents. Higher achieving elementary schools provide academic
feedback 1.36 more times per semester than other schools, behavioral feedback 9.09 more times
per semester, and general feedback to parents 0.53 more times per semester. Higher achieving
middle schools provide academic feedback 5.22 more times per semester than other schools, behav-
ioral feedback 8.80 more times per semester, and general feedback to parents 11.08 more times per
semester.
D. High-Dosage Tutoring
Tutoring variables measure how often students are tutored and how large the groups are. We
code a school as offering small group tutoring if the typical group is six or fewer students. Schools
are coded as offering frequent tutoring if groups typically meet four or more times per week. Schools
are coded as having high-dosage tutoring if the typical group is six or fewer students (the below
8
median number) and those groups meet four or more times per week (the above median number).
This high-dosage variable corresponds closely to the tutoring described by Madden, Lawson, and
Sweet (1976). The high-dosage variable also has the largest loadings in the first principal component
compared to our other tutoring variables.
While almost all charter schools in our sample offer some sort of tutoring, high achieving charter
schools in our sample are far more likely to offer high-dosage tutoring. Twenty-seven percent of high
achieving elementary schools offer high-dosage tutoring compared to 18 percent of low achieving
schools. Twenty percent of high achieving middle schools offer high-dosage tutoring, while none of
the low achieving schools do.
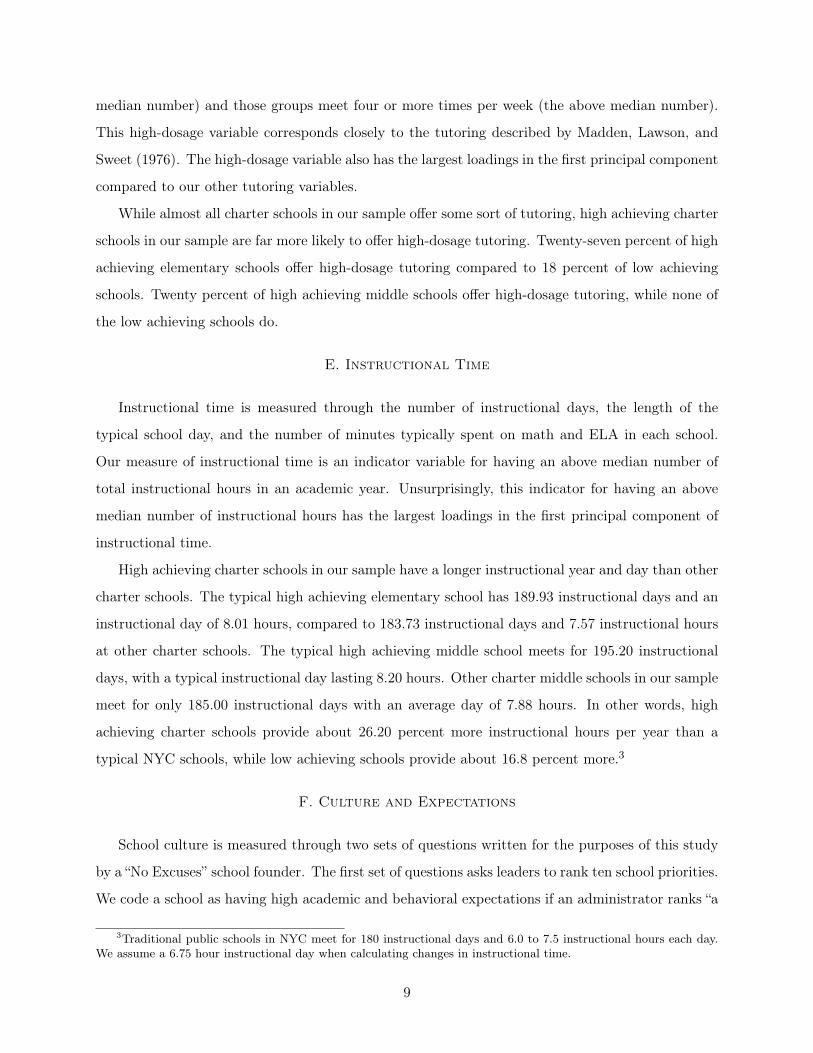
E. Instructional Time
Instructional time is measured through the number of instructional days, the length of the
typical school day, and the number of minutes typically spent on math and ELA in each school.
Our measure of instructional time is an indicator variable for having an above median number of
total instructional hours in an academic year. Unsurprisingly, this indicator for having an above
median number of instructional hours has the largest loadings in the first principal component of
instructional time.
High achieving charter schools in our sample have a longer instructional year and day than other
charter schools. The typical high achieving elementary school has 189.93 instructional days and an
instructional day of 8.01 hours, compared to 183.73 instructional days and 7.57 instructional hours
at other charter schools. The typical high achieving middle school meets for 195.20 instructional
days, with a typical instructional day lasting 8.20 hours. Other charter middle schools in our sample
meet for only 185.00 instructional days with an average day of 7.88 hours. In other words, high
achieving charter schools provide about 26.20 percent more instructional hours per year than a
typical NYC schools, while low achieving schools provide about 16.8 percent more.3
F. Culture and Expectations
School culture is measured through two sets of questions written for the purposes of this study
by a “No Excuses” school founder. The first set of questions asks leaders to rank ten school priorities.
We code a school as having high academic and behavioral expectations if an administrator ranks “a
3Traditional public schools in NYC meet for 180 instructional days and 6.0 to 7.5 instructional hours each day.We assume a 6.75 hour instructional day when calculating changes in instructional time.
9

relentless focus on academic goals and having students meet them” and “very high expectations for
student behavior and discipline” as her top two priorities (in either order). Other potential priorities
include “a comprehensive approach to the social and emotional needs of the whole child,” “building
a student’s self-esteem through positive reinforcement,” and “prioritizing each child’s interests and
passions in designing a project-based unit.”
The second set of culture questions consists of ten multiple-choice questions. The questions ask
about whether rules are school-wide or classroom specific, how students learn school culture, whether
students wait for the teacher to dismiss the class, desk and backpack rules, hallway order, classroom
activities, and whether students track teachers with their eyes. We create a dichotomous variable
for each question equal to one if a school leader indicates a more strict disciplinary policy. Our
measure of a school’s disciplinary policy is the standardized sum of the ten dichotomous variables.
Analysis of the first principal component shows that both culture measures have identical load-
ings, and results are robust to using either measure. We choose the “high expectations” variable as
our primary measure in order to best capture the high academic expectations discussed in effective
schools by the qualitative literature (e.g. Edmonds 1979, 1982).
Consistent with past research (e.g. Edmonds 1979, 1982, Carter 2000, Thernstrom and Th-
ernstrom 2004), Table 2 shows that high achieving charter schools are more likely to have higher
academic and behavioral expectations compared to other charter schools and are more likely to have
school-wide disciplinary policies.
G. Lesson Plans
The rigor of a school’s curriculum is coded from lesson plans collected from each testable grade
level and subject area in a school. We code whether the most advanced objective for each lesson
is at or above grade level using New York State standards for the associated subject and grade.
Lesson plan complexity is coded using the cognitive domain of Bloom’s taxonomy which indicates
the level of higher-order thinking required to complete the objective. In the case where a lesson
has more than one objective, the most complex objective is chosen. We also code the number of
differentiation strategies present in each lesson plan and the number of checks for understanding.
Finally, we create an aggregate thoroughness measure that captures whether a lesson plan includes
an objective, an essential question, a do-now, key words section, materials section, introduction
section, main learning activity, a check for understanding, an assessment, a closing activity, time
needed for each section, homework section, teacher reflection section, and if the lesson plan follows
10

a standardized format. The inclusion of each element increases the thoroughness measure by one,
which is then standardized to have a mean of zero and a standard deviation of one.
Surprisingly, lesson plans at high achieving charter schools are not more likely to be at or above
grade level and do not have higher Bloom’s Taxonomy scores. Higher achieving charter schools also
appear no more likely to have more differentiated lesson plans and appear to have less thorough
lesson plans than lower achieving charter schools. Above median elementary schools have an average
of 4.73 items on our lesson plan thoroughness measure, while lower achieving schools have 5.25.
The gap between above and below median middle schools is even larger, with above median schools
having 5.00 items and below median schools averaging 6.86 items.
3.2 Administrative Data
Our second data source consists of administrative data on student demographics and outcomes from
the New York City Department of Education (NYCDOE). The data include information on student
race, gender, free and reduced-price lunch eligibility, behavior, attendance, and state math and ELA
test scores for students in grades three to eight. The NYCDOE data span the 2003 - 2004 to 2010
- 2011 school years.
The state math and ELA tests, developed by McGraw-Hill, are high-stakes exams conducted
in the spring semester of third through eighth grade. The math test includes questions on number
sense and operations, algebra, geometry, measurement, and statistics. Tests in the earlier grades
emphasize more basic content such as number sense and operations, while later tests focus on
advanced topics such as algebra and geometry. The ELA test is designed to assess students on
their literary response and expression, information and understanding, and critical analysis and
evaluation. The ELA test includes multiple-choice and short-response sections based on a reading
and listening section, as well as a brief editing task.
All public-school students, including those attending charters, are required to take the math and
ELA tests unless they are medically excused or have a severe disability. Students with moderate
disabilities or who are English Language Learners must take both tests, but may be granted special
accommodations (additional time, translation services, and so on) at the discretion of school or
state administrators. In our analysis the test scores are normalized to have a mean of zero and a
standard deviation of one for each grade and year across the entire New York City sample.
Student level summary statistics for the variables that we use in our core specifications are
displayed in Table 3. Charter students are more likely to be black and less likely to be English
11

language learners or participate in special education compared to the typical NYC student. Charter
students receive free or reduced price lunch at similar rates as other NYC students. Charter middle
school students score 0.08σ lower in fifth grade math and 0.08σ lower in fifth grade ELA compared
to the typical NYC student.
Students in our sample of charter schools are approximately as likely to be black, Hispanic,
eligible for free or reduced prince lunch, English language learners, or to participate in special
education as students in a typical NYC charter or traditional pubic school. Students in our sample
of charter middle schools score 0.10σ lower in math and 0.08σ lower in ELA in fifth grade compared
to the typical charter student in NYC, suggesting that schools in our sample are negatively selected
on test scores relative to other charter schools. Students in our lottery sample score an additional
0.12σ lower in math and 0.08σ lower in ELA in fifth grade compared to our survey sample.4
4 The Impact of Attending a NYC Charter School
To estimate the causal impact of each school in our sample, we use two empirical models. The
first exploits the fact that oversubscribed charter schools in NYC are required to admit students
via random lottery. The second statistical model uses a combination of matching and regression
analysis to partially control for selection into charter schools.
Following Hoxby and Muraka (2009), Abdulkadiroglu et al. (2011), and Dobbie and Fryer (2011),
we model the effect of a charter school on student achievement as a linear function of the number
of years spent at the school:
achievementigt = αt + λg + βXigt + ρCharterigt + εigt (1)
where αt and λg are year and grade of test effects respectively, Xigt is a vector of demographic
controls including gender, race, free lunch status, and baseline test scores. εigt is an error term that
captures random variation in test scores.
The causal effect of attending a charter school is ρ. If the number of years a student spends at a
charter was randomly assigned, ordinary least squares (OLS) estimates of equation (1) would cap-
ture the average causal effect of years spent at the school. Because students and parents selectively
4Appendix Table 2 presents summary statistics separately for above and below median schools as defined in Table2. In our survey sample, elementary students in above median schools are 9 percentage points more likely to be blackthan students in below median schools. Middle school students in above median schools are 43 percentage pointsmore likely to be black, but have comparable test scores as students in below median schools.
12

choose whether to enroll at a charter school, however, OLS estimates are likely to be biased by cor-
relation between school choice and unobserved characteristics related to student ability, motivation,
or background.
To identify ρ we use an instrumental variables (IV) strategy that exploits the fact that New York
law dictates that over-subscribed charter schools allocate enrollment offers via a random lottery.
The first stage equations for IV estimation take the form:
Charterigt = µt + κg + γXigt + πZi +∑j
νjLotteryij + ηigt (2)
where π captures the effect of the lottery offer Zi on the number of years a student spends at a
charter school. The lottery indicators Lotteryij are lottery fixed effects for each of the school’s j
lotteries. We also control for whether the student had a sibling in a lottery that year to account
for the different odds of admissions among sibling pairs. We estimate the impact of each school
separately within the pool of lottery applicants. We stack test scores and cluster standard errors at
the student level.
Our lottery sample is drawn from each lottery that took place between 2003 and 2009 at our
sample schools. We make three sample restrictions. First, applicants with a sibling already at a
school are excluded, as they are automatically admitted. Second, we drop applicants who either
had no chance of winning the lottery or were automatically granted admission due to within-district
preference introduced in 2008. Finally, we include only the first application of students who apply
to a school more than once. These restrictions leave us with a sample of 16,179 lottery students in
lotteries at 29 schools. Appendix C describes the lottery data from each school in more detail.
Columns 5 and 6 of Table 3 present summary statistics for lottery applicants in our lottery
sample. As a measure of lottery quality, Table 3 also tests for balance on baseline characteristics.
Specifically, we regress an indicator for winning the lottery on pretreatment characteristics and
lottery fixed effects. Elementary lottery winners are 0.02 percentage points less likely to be eligible
for free and reduced price lunch compared to elementary lottery losers. Middle school lottery winners
are 0.01 percentage points less likely to be English language learners. There are no other significant
differences between lottery winners and lottery losers. This suggests that the lottery is balanced
and that selection bias should not unduly affect our lottery estimates.
An important caveat to our lottery analysis is that lottery admissions records are only available
for 29 of our 39 schools. Moreover, four schools in our lottery sample have very few lottery losers,
13

with another four having admissions records for only one cohort with valid test scores. As a result,
our lottery estimates for these schools are relatively imprecise.
To get an estimate of school effectiveness for schools in our sample that do not have valid lottery
data or are not oversubscribed, and more precise estimates for schools in our sample with limited
lottery records, our second empirical strategy computes observational estimates. Following Angrist
et. al (2011), we use a combination of matching and regression estimators to control for observed
differences between students attending different types of schools. First, we match students attending
sample charters to a control sample of traditional public school students using the school a student is
originally zoned to, cohort, sex, race, limited English proficiency status, and free and reduced-price
lunch eligibility. Charter students are included in the observational estimates if they are matched
to at least one regular public school student. Traditional school students are included if they are
matched to at least one charter student. This procedure yields matches for 94.3 percent of students
in charter schools in our sample.
Within the group of matched charter and traditional public school students, we estimate equation
(1) controlling for baseline test scores and fixed effects for the cells constructed in the matching
procedure. Specifically, the observational estimates were constructed by fitting:
achievementigtc = σt + τg + ιc + ϕXigt + θsCharterigts + ζigts (3)
where σt and τg are year and grade of test effects respectively, Xigt is a vector of demographic
controls including baseline test scores, ιc are match cell fixed effects, and Charterigts is a vector
of the number of years spent in each charter in our sample. We also control for the number
of years enrolled in charters not in our sample. The observational estimates therefore compare
demographically similar students zoned to the same school and in the same age cohort, who spend
different amounts of time in charter schools. We stack student observations for all schools in our
sample, and cluster standard errors at the student level.
Table 4 reports a series of results on the impact of attending charter schools on student achieve-
ment in our sample. We report reduced-form (column 1), first stage (column 2), and instrumental
variable estimates from our lottery sample (column 3), a non-experimental estimate of our lottery
sample (column 4), and a non-experimental estimate that includes schools without oversubscribed
lotteries (column 5). We estimate effects for elementary and middle schools separately. All regres-
sions control for grade and year effects, gender, race, free lunch status, lottery cohort, and previous
14

test scores in the same subject.
Elementary school lottery winners outscore lottery losers by 0.108σ (0.024) in math and 0.056σ
(0.022) in ELA. Middle school lottery winners outscore lottery losers by 0.055σ (0.014) in math and
0.021σ (0.014) in ELA. The lottery first stage coefficient is 0.957 (0.052) for elementary school, and
0.435 (0.023) for middle school. In other words, by the time they were tested, elementary school
lottery winners had spent an average of 0.966 more years at a charter school than lottery losers,
and middle school lottery winners had spent 0.452 more years at a charter school. This first stage is
similar to lottery winners at other urban charter schools (Abdulkadiroglu et al. 2011, Angrist et al.
2010). The two-stage least squares (2SLS) estimate, which captures the causal effect of attending
a charter school for one year, is 0.113σ (0.024) in math and 0.058σ (0.023) in ELA for elementary
schools, and 0.126σ (0.032) in math and 0.048σ (0.032) in ELA for middle schools. The magnitude
of these results is similar, if slightly larger than the average charter in New York (Hoxby and Muraka
2009). The larger estimates could be due to an increase in school effectiveness since the Hoxby and
Muraka study, or schools with higher effectiveness selecting into our sample.
Column 4 of Table 4 presents observational results for our lottery charter schools. Our obser-
vational estimates imply that elementary charter students score 0.064σ (0.003) higher in math for
each year they attend a charter school, and 0.048σ (0.003) in ELA. Middle school charter students
gain 0.051σ (0.004) in math and 0.009σ (0.003) in ELA for each year they attend a charter. The
observational are qualitatively similar to the lottery estimates, though smaller in magnitude. This
suggests that while matching and regression control for some of the selection into charter schools,
observational estimates are still downwards biased relative to the true impact of charter schools.
Observational estimates for the full sample of charters are somewhat lower compared to the lottery
sample.
Figure 1 plots lottery and observational estimates for the 29 schools in our lottery sample. Re-
gressing each school’s lottery estimate on that school’s observational estimate results in a coefficient
of 0.946 (0.325) for math and 0.842 (0.373) for ELA, suggesting that our observational estimates at
least partially control for selection bias. With that said, Figure 1 also suggests that our observational
estimates are somewhat biased downwards and have less variance than the corresponding lottery
estimates. For instance, the school level lottery estimates for math have a standard deviation of
0.308, while the observational school level estimates have a standard deviation of 0.099. Estimates
for ELA reveal a similar pattern.
15
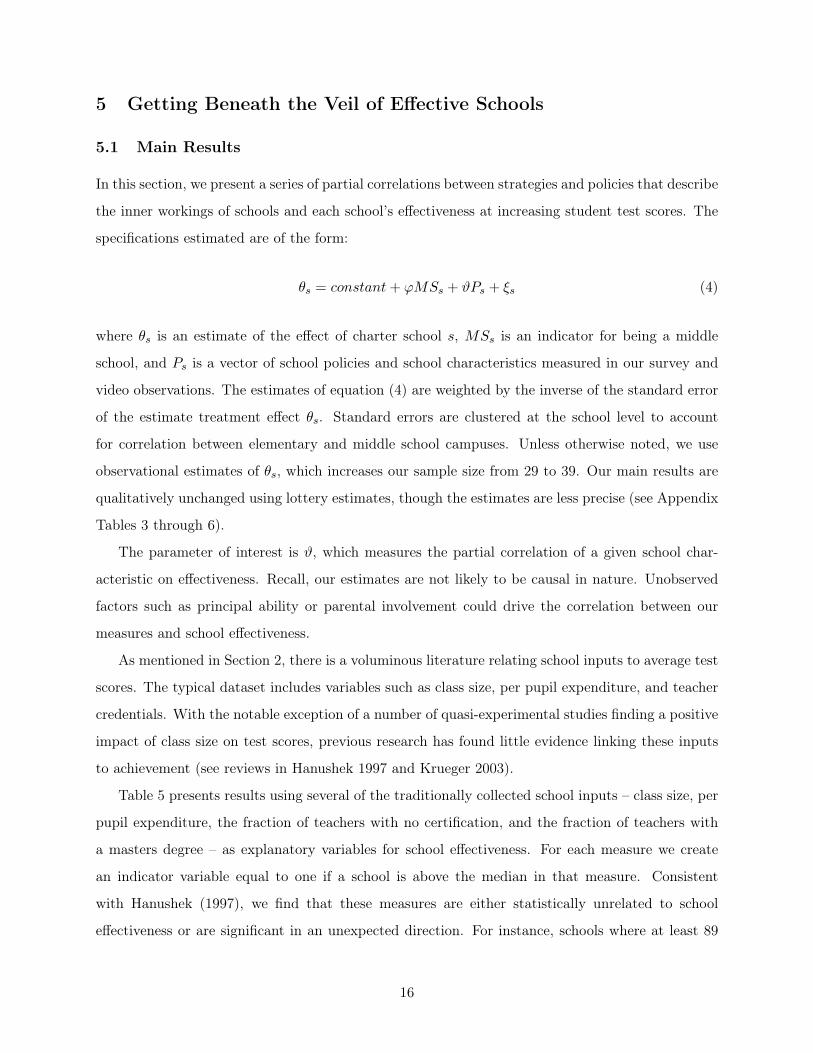
5 Getting Beneath the Veil of Effective Schools
5.1 Main Results
In this section, we present a series of partial correlations between strategies and policies that describe
the inner workings of schools and each school’s effectiveness at increasing student test scores. The
specifications estimated are of the form:
θs = constant+ ϕMSs + ϑPs + ξs (4)
where θs is an estimate of the effect of charter school s, MSs is an indicator for being a middle
school, and Ps is a vector of school policies and school characteristics measured in our survey and
video observations. The estimates of equation (4) are weighted by the inverse of the standard error
of the estimate treatment effect θs. Standard errors are clustered at the school level to account
for correlation between elementary and middle school campuses. Unless otherwise noted, we use
observational estimates of θs, which increases our sample size from 29 to 39. Our main results are
qualitatively unchanged using lottery estimates, though the estimates are less precise (see Appendix
Tables 3 through 6).
The parameter of interest is ϑ, which measures the partial correlation of a given school char-
acteristic on effectiveness. Recall, our estimates are not likely to be causal in nature. Unobserved
factors such as principal ability or parental involvement could drive the correlation between our
measures and school effectiveness.
As mentioned in Section 2, there is a voluminous literature relating school inputs to average test
scores. The typical dataset includes variables such as class size, per pupil expenditure, and teacher
credentials. With the notable exception of a number of quasi-experimental studies finding a positive
impact of class size on test scores, previous research has found little evidence linking these inputs
to achievement (see reviews in Hanushek 1997 and Krueger 2003).
Table 5 presents results using several of the traditionally collected school inputs – class size, per
pupil expenditure, the fraction of teachers with no certification, and the fraction of teachers with
a masters degree – as explanatory variables for school effectiveness. For each measure we create
an indicator variable equal to one if a school is above the median in that measure. Consistent
with Hanushek (1997), we find that these measures are either statistically unrelated to school
effectiveness or are significant in an unexpected direction. For instance, schools where at least 89
16

percent of teachers are certified have annual math gains that are 0.041σ (0.023) lower and ELA
gains that are 0.029σ (0.017) lower. An index of the four dichotomous measures explains 14.0 to
22.8 percent of the variance in charter school effectiveness but in the unexpected direction.5
In stark contrast, Table 6 demonstrates that the five policies suggested most often by the qual-
itative literature on successful schools (Edmonds 1979, 1982) – teacher feedback, the use of data to
guide instruction, tutoring, instructional time, and a culture of high expectations – explain around
45 percent of the variance in charter school outcomes. Schools that give formal or informal feedback
ten or more times per semester have annual math gains that are 0.080σ (0.021) higher and annual
ELA gains that are 0.066σ (0.015) higher than other schools. Schools that give five or more interim
assessments during the school year and that have four or more differentiation strategies have annual
math and ELA gains that are 0.050σ (0.039) and 0.034σ (0.029) higher, respectively. Schools that
tutor students at least four days a week in groups of six or fewer have 0.051σ (0.033) higher math
scores and 0.054σ (0.028) higher ELA scores. Schools that add 25 percent or more instructional time
compared to traditional public schools have annual gains that are 0.080σ (0.022) higher in math
and 0.048σ (0.022) higher in ELA. Whether or not a school prioritizes high academic and behavioral
expectations for all students is associated with math gains that are 0.081σ (0.030) higher than other
schools and ELA gains that are 0.059σ (0.020) higher per year. The last column of Table 6 reports
results for an index of all five variables. We construct the index variable (and all other index vari-
ables in this paper) by taking the sum of each dichotomous variable, then standardizing that sum
to have a mean of zero and standard deviation of one. A one standard deviation increase in this
index of all five school practice inputs is associated with a 0.053σ (0.010) increase in annual math
gains and a 0.039σ (0.008) increase in annual ELA gains.6 These data are consistent with Angrist,
Pathak, and Walters (2011), who argue that Massachusetts charters that adhere to a “No Excuses”
model, defined as selective teacher hiring, extensive teacher feedback, increased instructional time,
5One concern is that charter schools do not use resource-based inputs at the same rate as traditional publicschools. This does not appear to be the case, though its possible. According to the NYCDOE, for example, charterelementary schools have class sizes that range from 18 to 26 students per class and charter middle schools have classsizes ranging from 22 to 29 students. In 2010 - 2011, the average class size in a traditional elementary school in NYCwas 23.7 students and the average class size in a traditional middle school was 26.6 to 27.1 students, depending onthe subject.
6While the index variable is associated with large and statistically significant gains in the lottery sample, themeasure only explains 6.9 percent of the variance in math effectiveness and 6.0 percent of the variation in ELAeffectiveness in the lottery sample. The relatively low R2 is most likely due to the imprecision of the lottery estimatesof school effectiveness; only 7 of the 29 schools have statistically significant results in either subject when using ourlottery estimation strategy. The reduction in sample size from 39 to 29 schools itself does not appear important,however. The index measure explains over 45 percent of the variation in both math and ELA effectiveness amongthe 29 lottery schools when using observational measures of effectiveness.
17

and a focus on discipline, are more effective at increasing test scores than other charter schools.
Table 7 estimates the partial correlation of each of the five policies on school effectiveness,
controlling for the other four. Each regression includes all schools in our survey sample, even if they
did not provide information on a particular school practice. Surprisingly, four out of the five policy
measures used in our index continue to be statistically significant in at least one subject, suggesting
that each policy conveys some relevant information. Controlling for other school policies, schools
that give formal or informal feedback ten or more times per semester have annual math gains that
are 0.048σ (0.023) higher and annual ELA gains that are 0.044σ (0.014) higher than other schools.
Schools that add 25 percent or more instructional time compared to traditional public schools have
annual gains that are 0.050σ (0.013) higher in math, though not in ELA. Controlling for other
policies, schools that prioritize high-dosage tutoring have annual ELA gains that are 0.040σ (0.022)
higher. Schools that have high academic and behavioral expectations have annual math gains that
are 0.044σ (0.023) higher and annual ELA gains that are 0.030σ (0.015) higher than other schools.
5.2 Robustness Checks
In this subsection, we explore the robustness of our results by performing an out of sample test of
our main index and accounting for a more diverse set of controls.
A. An Out of Sample Test
Our first robustness check explores the association between the school inputs in our main index
and school effectiveness in a set of schools that did not participate in our survey. To do this,
we collected similar (though less detailed) publicly available data on human capital, data driven
instruction, instructional time, and culture for every possible charter school in New York City.
Despite an exhaustive search, we could not find any publicly available data on whether or how these
schools tutored students. Thus, our index for this out of sample test will contain four out of the
five variables.
Our data is drawn primarily from annual site visit reports provided by each school’s chartering
organization. New York City charter schools are either authorized by the New York City Depart-
ment of Education (NYCDOE), the State University of New York (SUNY), or the New York State
Department of Education (NYSDOE). The site visits are meant to “describe what the reviewers saw
at the school - what life is like there” (NYCDOE 2011). The publicly available report identifies some
18

of the strengths in a school, as well as areas where improvement is needed.7 Thirty-one NYCDOE
and 25 SUNY schools have both site visit reports and students in grades three to eight. For this
set of schools, we complement the site visit data with publicly available data from New York State
Accountability and Overview Reports, the Charter School Center, and each school’s website. More
information on each data source and how we construct our variables to most closely match the
variables collected in our survey is available in Online Appendix A.8
Table 8 presents results using all eligible charter schools chartered with site visit data. The
results of our out of sample test are similar to, though less precise than, the survey results. A one
standard deviation increase in the case-study index is associated with a 0.027σ (0.009) increase in
math scores and a 0.013σ (0.006) increase in ELA scores. However, the index explains less than ten
percent of the variation in math and ELA, likely reflecting measurement error in the data. Teacher
feedback, instructional time, and high academic and behavioral expectations are significantly related
to math achievement. High expectations are significantly related to ELA achievement, with the
point estimates on teacher feedback and instructional time positive but not statistically significant.
B. Accounting for More Controls
Our second robustness check simply accounts for every other measure of school inputs collected
during the study that does not enter the main index. This control index is created by standardizing
the sum of six indexes – human capital policies, data policies, parent engagement strategies, in-
structional time differences, culture and expectations, and curricular rigor – to have a mean of zero
and a standard deviation of one. In total, the index captures variation in 37 measures, virtually all
of the data we collected in the principal survey.
Table 9 presents results controlling for the aggregate index of 37 variables. A one standard
deviation increase in this aggregate index is associated with a statistically insignificant 0.023σ
(0.014) increase in annual math gains, and a statistically insignificant 0.010σ (0.008) increase in
annual ELA gains. However, the control index is statistically indistinguishable from zero after7Site visit reports chartered by the NYCDOE include quantitative rankings, from which we draw our measures.
SUNY site visit reports are qualitative in nature. In the latter case, we code each variable directly from the text ofthe site visit report.
8Appendix Table 7 presents summary statistics for schools that are in both the survey and out-of-sample regres-sions, and schools that are only in the out-of-sample group. Schools that did not take part in our survey but havepublicly available data have math test score gains that are 0.039σ higher than schools in our survey sample, and ELAscores that are 0.026σ higher, although neither difference is statistically significant. Schools that did not take part inour survey but have publicly available data also are 48.5 percentage points more likely to give teacher feedback, 6.7percentage points more likely to have a longer school year and day, and 46.2 percentage points more likely to havehigh expectations. These results suggest that our survey schools are somewhat negatively selected compared to othercharter schools.
19

controlling our main index. The coefficient on the main index is statistically indistinguishable from
the specification with no controls from Table 6, suggesting that the other variables collected do not
convey any more statistically relevant information in explaining charter school success.
6 Conclusion
Charter schools were created to (1) serve as an escape hatch for students in failing schools and (2)
use their relative freedom to incubate best practices to be infused into traditional public schools.
Consistent with the second mission, charter schools employ a wide variety of educational strategies
and operations, providing dramatic variability in school inputs. Taking advantage of this fact, we
collect data on the inner-workings of 39 charter schools in New York City to understand what inputs
are most correlated with school effectiveness. Our data include a wealth of information collected
from each school through principal, teacher, and student surveys, sample teacher evaluation forms,
lesson plans, homework, and video observations.
We show that input measures associated with a traditional resource-based model of education
– class size, per pupil expenditure, the fraction of teachers with no teaching certification, and the
fraction of teachers with an advanced degree – are not positively correlated with school effective-
ness. In stark contrast, an index of five policies suggested by forty years of qualitative research
– frequent teacher feedback, data driven instruction, high-dosage tutoring, increased instructional
time, and a relentless focus on academic achievement – explains almost half of the variation in school
effectiveness. Moreover, we show that these variables remain statistically important after account-
ing for a host of other explanatory variables, and are predictive in a different sample of schools.
These results align closely with those reported in Angrist, Pathak, and Walters (2011), who show
that charter schools that employ a “No Excuses” model, defined as more selective teacher hiring,
extensive teacher feedback, increased instructional time, and a focus on discipline and academic
achievement, are more effective at increasing test scores. There is remarkable similarity between
our findings and those reported in Angrist, Pathak, and Walters (2011) given two entirely different
samples and ways of collecting data.
While there are important caveats to the conclusion that these five policies can explain significant
variation in school effectiveness, our results suggest a model of schooling that may have general
application. The key next step is to inject these strategies into traditional public schools and assess
whether they have a causal effect on student achievement. Fryer (2011) reports on an on-going
20

experiment implementing similar practices in low-performing traditional public schools in Houston.
This intervention appears to have led to substantial achievement gains, suggesting that these five
strategies may be effective more generally.
21

References
[1] Abdulkadiroglu, Atila, Joshua Angrist, Susan Dynarski, Thomas Kane, and Parag Pathak.
2011. “Accountability and Flexibility in Public Schools: Evidence from Boston’s Charters
and Pilots.” Quarterly Journal of Economics, 126(2): 699-748.
[2] Angrist, Joshua, Susan Dynarski, Thomas Kane, Parag Pathak, and Christopher Walters. 2010.
“Who Benefits from KIPP?” NBER Working Paper No. 15740.
[3] Angrist, Joshua, Parag Pathak, and Christopher Walters. 2011. “Explaining Charter School
Effectiveness.” NBER Working Paper No. 17332.
[4] Arum, Richard. 1996. “Do Private Schools Forces Public Schools to Compete?” American
Sociological Review, 61(1): 29-46.
[5] Aud, S., Hussar, W., Kena, G., Bianco, K., Frohlich, L., Kemp, J., Tahan, K. 2011. The
Condition of Education 2011 (NCES 2011-033). U.S. Department of Education, National
Center for Education Statistics. Washington, DC: U.S. Government Printing Office.
[6] Borland, Melvin V., and Roy M. Howsen. 1992. “Student Academic Achievement and the Degree
of Market Concentration in Education.” Economics of Education Review, 11(1): 31-39.
[7] Budde, Ray. 1988. “Education by Charter: Restructuring School Districts. Key to Long-Term
Continuing Improvement in American Education,” Regional Laboratory for Educational
Improvement of the Northeast & Islands.
[8] Card, David, Martin D. Dooley, and A. Abigail Payne. 2010. “School Competition and Efficiency
with Publicly Funded Catholic Schools.” American Economic Journal: Applied Economics,
2(4): 150-76.
[9] Carnoy Martin, Frank Adamson, Amita Chudgar, Thomas F. Luschei, and John F. Witte. 2007.
Vouchers and Public School Performance. Washington, DC: Economic Policy Institute.
[10] Carter, Samuel C. 2000. “No Excuses: Lessons from 21 High-Performing, High-Poverty Schools.”
Heritage Foundation.
[11] Chakrabarti, Rajashri. 2008. “Can Increasing Private School Participation and Monetary Loss
in a Voucher Program Affect Public School Performance? Evidence from Milwaukee.” Jour-
nal of Public Economics, 92(5-6):1371-1393.
[12] Curto, Vilsa, and Roland G. Fryer. 2011. “Estimating the Returns to Urban Boarding Schools:
22

Evidence from SEED.” NBER Working Paper No. 16746.
[13] Dee, Thomas S., and Brian A. Jacob. 2011. “The Impact of No Child Left Behind on Student
Achievement.” Journal of Policy Analysis and Management, 30(3): 418-446.
[14] Dobbie, Will, and Roland G. Fryer. 2011. “Are High-Quality Schools Enough to Increase
Achievement among the Poor? Evidence from the Harlem Children’s Zone.” American
Economic Journal: Applied Economics, 3(3): 158-187.
[15] Dobbie, Will, and Roland G. Fryer. 2012. “Are High Quality Schools Enough to Reduce Social
Disparities? Evidence from the Harlem Children’s Zone.” NBER Working Paper.
[16] Edmonds, Ronald. 1979. “Effective Schools for the Urban Poor.” Educational Leadership, 37(1):
15-24.
[17] Edmonds, Ronald. 1982. “Programs of School Improvement: An Overview.” Educational Lead-
ership, 40(3): 4-11.
[18] Fleischman, H.L., Hopstock, P.J., Pelczar, M.P., and Shelley, B.E. 2010. “Highlights From
PISA 2009: Performance of U.S. 15-Year-Old Students in Reading, Mathematics, and Sci-
ence Literacy in an International Context (NCES 2011-004).” U.S. Department of Educa-
tion, National Center for Education Statistics. Washington, DC: U.S. Government Printing
Office.
[19] Fryer, Roland. 2011. “Creating “No Excuses” (Traditional) Public Schools: Preliminary Evi-
dence from an Experiment in Houston.” NBER Working Paper No. 17494.
[20] Gleason, Philip, Melissa Clark, Christina Clark Tuttle, Emily Dwoyer, and Marsha Silver-
berg. 2010. “The Evaluation of Charter School Impacts.” National Center for Education
Evaluation and Regional Assistance, Institute of Education Sciences, U.S. Department of
Education.
[21] Hanushek, Eric. 1997. “Assessing the Effects of School Resources on Student Performance: An
Update.” Educational Evaluation and Policy Analysis, 19(2): 141-164.
[22] Hoxby, Caroline M. and Sonali Murarka. 2009. “Charter Schools in New York City: Who Enrolls
and How They Affect Their Students’ Achievement,” NBER Working Paper No. 14852.
[23] Hoxby, Caroline M. 1994. “Do Private Schools Provide Competition for Public Schools?” NBER
Working Paper No. 4978.
23
[24] Hoxby, Caroline M. 2000. “Does Competition Among Public Schools Benefit Students and
Taxpayers?” American Economic Review, 90(5): 1209-1238.
[25] Hoxby, Caroline M. 2003. “School Choice and School Productivity: Could School Choice be
a Tide that Lifts All Boats?” In The Economics of School Choice, ed. Caroline M Hoxby,
287-341. Chicago: The University of Chicago Press.
[26] Krueger Alan B. 2003. “Economic Considerations and Class Size.” Economic Journal, 113(485):
34-63.
[27] Krueger Alan B., and Pei Zhu. 2004. “Another Look at the New York City School Voucher
Experiment.” American Behavioral Scientist, 47(5): 658-698.
[28] Madden, J. V, D. Lawson, and D. Sweet. 1976. “School Effectiveness Study.” Sacramento, CA:
State of California Department of Education.
[29] Pischke, Jorg-Steffen, 2007. “The Impact of Length of the School Year on Student Performance
and Earnings: Evidence from the German Short School Years." Economic Journal, 117:
1216-1242.
[30] Purkey, Stewart C., and Marshall S. Smith. 1983. “Effective Schools: A Review.” The Elemen-
tary School Journal, 83(4): 426-452.
[31] Rouse Cecilia E. 1998. “Private School Vouchers and Student Achievement: An Evaluation of
the Milwaukee Parental Choice Program.” Quarterly Journal of Economics, 113(2): 553-
602.
[32] Sammons, Pam, Josh Hillman, and Peter Mortimore. 1995. “Key Characteristics of Effective
Schools: A Review of School Effectiveness Research.” Office for Standards in Education.
[33] Sander, William. 1999. “Private Schools and Public School Achievement.” Journal of Human
Resources, 34(4): 697-709.
[34] State of New York, Office of Education Performance Review. 1974. “School Factors and Influ-
encing Reading Achievement: A Case Study of Two Inner City Schools.”
[35] Stedman, Lawrence C. 1985. “A New Look at the Effective Schools Literature.” Urban Educa-
tion, 20(3): 295-326.
[36] Thernstrom, Abigail, and Stephan Thernstrom. 2004. “No Excuses: Closing the Racial Gap in
Learning.” Simon & Schuster.
24

[37] Tuttle, Christina Clark, Bing-ru Teh, Ira Nichols-Barrer, Brian P. Gill, and Philip Gleason.
2010. “Student Characteristics and Achievement in 22 KIPP Middle Schools: Final Report.”
Mathematica Policy Research.
[38] Whitman, David. 2008. “Sweating the Small Stuff: Inner-City Schools and the New Paternal-
ism.” Thomas B. Fordham Institute.
[39] Winters, Marcus. Forthcoming. “Measuring the Effect of Charter Schools on Public School
Student Achievement in an Urban Environment: Evidence from New York City.” Economics
of Education Review.
[40] Wolf, Patrick, Babette Gutmann, Michael Puma, Brian Kisida, Lou Rizzo, Nada Eissa,
Matthew Carr,Marsha Silverberg. 2010. “Evaluation of the DC Opportunity Scholarship
Program.” NCEE 2010-4018. U.S. Department of Education.
25

Table 1School ParticipationAll Eligible Survey Lottery
Charters Sample Sample Sample(1) (2) (3) (4)
Elementary 68 62 26 19Middle 38 37 13 10
Notes: This table reports the number of elementary and middle charter schools in New York City and their participa-tion in the observational and lottery studies. Elementary schools include all schools that have their main admissionslottery in grades PK - 4. Middle schools include all schools that have their main admissions lottery in grades 5 - 8.Eligible charters are defined as schools that serve a general student population with at least one tested grade in 2010- 2011.
26

Table 2Characteristics of Charter Schools
Elementary Schools Middle SchoolsAbove Below Above BelowMedian Median p-value Median Median p-value
Human Capital (1) (2) (3) (4) (5) (6)Frequent Teacher Feedback 0.87 0.45 0.024 1.00 0.12 0.000Teacher Formal Feedback 3.12 2.73 0.664 3.20 1.81 0.227Teacher Informal Feedback 12.75 7.50 0.034 13.30 4.12 0.001Non-Negotiables When Hiring 1.46 1.45 0.989 1.00 1.29 0.572Teacher Tenure 3.29 3.77 0.470 4.12 3.81 0.818Teachers Leaving Involuntarily 0.09 0.07 0.346 0.06 0.12 0.488Total Teacher Hours 57.77 55.00 0.513 57.00 52.88 0.513Teacher Non-Instructional Hours 1.83 1.95 0.867 3.60 3.94 0.850Teacher Responsibilities 2.13 2.55 0.519 2.60 2.62 0.982Max Teacher Pay (in $10k) 7.80 7.94 0.786 9.16 8.16 0.331
Data Driven InstructionData Driven Instruction 0.70 0.43 0.292 1.00 0.50 0.495Uses Interim Assessments 1.00 0.90 0.245 0.80 1.00 0.220Number of Interim Assessments 3.50 2.69 0.340 4.25 2.16 0.094Number of Differentiation Strategies 4.36 3.12 0.234 5.00 4.00 0.704Number of Teacher Reports 4.14 4.27 0.901 2.60 3.12 0.603Data Plan in Place 0.45 0.25 0.390 0.50 0.25 0.633Tracking Using Data 0.36 0.20 0.426 0.40 0.75 0.241
Parent EngagementAcademic Feedback 6.61 5.25 0.590 13.40 8.18 0.305Behavior Feedback 19.69 10.60 0.335 24.30 15.50 0.463Regular Feedback 7.75 7.22 0.919 15.12 4.04 0.293
TutoringHigh Quality Tutoring 0.27 0.18 0.912 0.20 0.00 0.220Any Tutoring 0.92 0.82 0.461 0.80 0.75 0.851Small Group Tutoring 0.50 0.56 0.813 0.25 0.17 0.779Frequent Tutoring 0.42 0.20 0.300 0.75 0.33 0.242
Instructional Time+25% Increase in Time 0.57 0.09 0.012 0.80 0.50 0.319Instructional Hours 8.01 7.57 0.089 8.20 7.88 0.395Instructional Days 189.93 183.73 0.079 195.20 185.00 0.040Daily Time on Math 76.92 69.00 0.369 81.20 80.23 0.947Daily Time on ELA 136.88 124.38 0.568 131.00 92.68 0.266
CultureHigh Expectations Priority Rank 0.60 0.10 0.011 0.80 0.25 0.059School-wide Discipline 10-item Measure 0.33 0.09 0.159 0.40 0.38 0.935
Schools 15 11 5 8
27

Characteristics of Charter Schools ContinuedElementary Schools Middle Schools
Above Below Above BelowMedian Median p-value Median Median p-value
Lesson Plans (1) (2) (3) (4) (5) (6)Blooms Taxonomy Score 0.09 0.25 0.376 0.00 0.14 0.545Objective Standard 0.73 0.88 0.464 0.67 1.00 0.133Number of Differentiation Strategies 0.64 0.75 0.623 0.67 0.57 0.807Thoroughness Index 4.73 5.25 0.687 5.00 6.86 0.308
Frequently Measured InputsSmall Classes 0.20 0.45 0.178 0.50 0.83 0.312High Expenditures 0.50 0.33 0.531 0.67 0.60 0.875High Teachers with MA 0.33 0.45 0.549 0.50 0.83 0.312Low Teachers without Certification 0.53 0.64 0.616 0.00 0.67 0.035
Other ControlsPart of CMO 0.60 0.18 0.034 0.60 0.38 0.471
Schools 15 11 5 8
Notes: This table reports results from a survey of New York City charter schools with entry in elementary school(PK - 4th) or middle school (5th - 8th) grades. The survey sample excludes schools without a tested grade in 2010- 2011. The sample includes schools both with and without lottery admissions data. The sample is split based onthe impact of attending the school on math and ELA test scores. Each impact is estimated controlling for matchcell, race, sex, free lunch eligibility, grade, and year. Middle school specifications also include baseline test scores.Data-driven instruction, number of differentiation strategies, and data plan in place are from the principal interview.Lesson plan variables are from school lesson plans. Small classes, high expenditures, teachers with MA, and teacherswith certification are from publicly available administrative data. All other variables are from the written principalsurvey. See the Data Appendix for additional details.
28

Table 3Student Summary Statistics
Eligible Survey Lottery Lottery ApplicantsNYC Charters Charters Charters Winners Losers Difference(1) (2) (3) (4) (5) (6) (7)
Panel A. Elementary Schools (3rd - 5th Grades)Male 0.51 0.49 0.49 0.51 0.51 0.53 −0.00White 0.14 0.03 0.02 0.01 0.01 0.02 −0.00Black 0.32 0.66 0.62 0.70 0.69 0.62 0.02Hispanic 0.39 0.29 0.34 0.29 0.28 0.34 −0.02Asian 0.14 0.02 0.02 0.01 0.01 0.01 0.00Free Lunch 0.85 0.83 0.86 0.84 0.87 0.89 −0.02∗∗
Special Education 0.11 0.06 0.08 0.08 0.10 0.12 −0.00Limited English Proficiency 0.12 0.05 0.05 0.04 0.05 0.08 −0.01Years in Charter 0.08 2.31 1.92 2.77 2.10 1.06 0.77∗∗∗
School Free Lunch 0.85 0.85 0.87 0.85 0.87 0.89 −0.03∗∗∗
Joint F-test [0.19]
Observations 706663 23986 11091 3067 2534 5346
Panel B. Middle Schools (5th - 8th Grades)Male 0.51 0.50 0.49 0.50 0.49 0.51 −0.01White 0.14 0.03 0.03 0.01 0.03 0.02 −0.00Black 0.33 0.64 0.59 0.68 0.62 0.62 0.03∗
Hispanic 0.39 0.30 0.35 0.29 0.31 0.32 −0.02Asian 0.14 0.02 0.02 0.01 0.03 0.03 −0.01Free Lunch 0.85 0.84 0.86 0.86 0.88 0.87 0.01Special Education 0.11 0.09 0.10 0.12 0.12 0.13 0.00Limited English Proficiency 0.10 0.05 0.05 0.05 0.05 0.06 −0.01∗∗
Baseline Math 0.02 -0.06 -0.16 -0.29 -0.25 -0.21 −0.05∗
Baseline ELA 0.01 -0.07 -0.12 -0.22 -0.16 -0.15 −0.01Years in Charter 0.07 2.58 2.19 2.04 1.37 0.73 0.34∗∗∗
School Free Lunch 0.84 0.84 0.87 0.88 0.88 0.88 −0.00School Baseline Math 0.01 -0.04 -0.14 -0.25 -0.20 -0.20 −0.01School Baseline ELA -0.01 -0.06 -0.12 -0.23 -0.19 -0.19 −0.01Joint F-test [0.13]
Observations 773620 22147 9237 2152 1955 3760
Notes: This table reports descriptive statistics for the sample of public school students, the sample of students in eligiblecharter schools, the sample of students in charter schools in the survey study, and the sample of students in the lottery study.The sample is restricted to students in grades 3 - 8 between 2003 - 2004 and 2010 - 2011 with at least one follow up testscore. For the lottery applicants columns, a single student may be counted multiple times as the level of observation is thestudent-application level. The final column reports coefficients from regressions of an indicator variable equal to one if thestudent won an admissions lottery on the variable indicated in each row and lottery risk sets. *** = significant at 1 percentlevel, ** = significant at 5 percent level, * = significant at 10 percent level.
29

Table 4Effect of Attending a Charter School on Test Scores
Lottery SurveyReduced First Sample SampleForm Stage TSLS OLS OLS
Level Subject (1) (2) (3) (4) (5)Elementary Math 0.108∗∗∗ 0.957∗∗∗ 0.113∗∗∗ 0.064∗∗∗ 0.052∗∗∗
(0.024) (0.052) (0.024) (0.003) (0.003)15439 15439 15439 454563 770109
Elementary ELA 0.056∗∗∗ 0.957∗∗∗ 0.058∗∗∗ 0.048∗∗∗ 0.037∗∗∗
(0.022) (0.052) (0.023) (0.003) (0.003)15439 15439 15439 454563 770109
Middle Math 0.055∗∗∗ 0.435∗∗∗ 0.126∗∗∗ 0.051∗∗∗ 0.028∗∗∗
(0.014) (0.023) (0.032) (0.004) (0.002)16340 16340 16340 669360 1171465
Middle ELA 0.021 0.436∗∗∗ 0.048 0.009∗∗∗ 0.015∗∗∗
(0.014) (0.023) (0.032) (0.003) (0.002)16340 16340 16340 669360 1171465
Notes: This table reports reduced form, first stage, and two-stage least squares results for the lottery sample(Columns 1 - 3), observational estimates for the lottery sample (Column 4), and observational estimatesfor the survey sample (column 5). The lottery sample is restricted to students in an elementary or middleschool charter school lottery, excluding students with sibling preference. The survey sample is restricted tostudents in a charter elementary or middle school that participated in our surveys. A single student may becounted multiple times as the level of observation is the student-year level. All lottery specifications controlfor lottery risk set, race, sex, free lunch eligibility, grade, and year. All observational specifications includematch cell, race, sex, free lunch eligibility, grade, and year. Middle school specifications also include baselinetest scores. All specifications cluster standard errors at the student level. *** = significant at 1 percentlevel, ** = significant at 5 percent level, * = significant at 10 percent level.
30

Table 5The Correlation Between Resource Inputs
and School EffectivenessPanel A: Math Results
(1) (2) (3) (4) (5)Class Size −0.041
(0.028)Per Pupil Expenditures 0.004
(0.027)Teachers with No Certification −0.041∗
(0.023)Teachers with MA −0.043
(0.027)Index −0.030∗∗∗
(0.011)
R2 0.064 0.006 0.073 0.074 0.140Observations 39 39 39 39 39
Panel B: ELA Results(6) (7) (8) (9) (10)
Class Size −0.034(0.021)
Per Pupil Expenditures −0.005(0.020)
Teachers with No Certification −0.029∗
(0.017)Teachers with MA −0.032
(0.020)Index −0.025∗∗
(0.010)
R2 0.133 0.069 0.126 0.132 0.228Observations 39 39 39 39 39
Notes: This table reports regressions of school-specific treatment effects on school characteristics. The sample includesall schools with at least one tested grade that completed the charter survey. Each independent variable is an indicatorfor being above the median in that domain. Class size equals one if a school’s pupil - teacher ratio is less than 13.Per pupil expenditure is equal to one if expenditures are greater than $15,000. Teachers with no certification is equalto one if more than 89 percent of teachers are uncertified. Teachers with MA is equal to one if more than 11 percentof teachers have an advanced degree. The index is a sum of the dichotomous measures standardized to have a meanof zero and standard deviation of one. The dependent variable is the school-specific impact estimated using OLS andcontrolling for match cells, race, sex, free lunch eligibility, grade, and year. Middle school specifications also includebaseline test scores. Regressions weight by the inverse of the standard error of the estimated school impact. Standarderrors are clustered at the school level. *** = significant at 1 percent level, ** = significant at 5 percent level, * =significant at 10 percent level.
31

Table 6The Correlation Between School Practice
Inputs and School EffectivenessPanel A: Math Results
(1) (2) (3) (4) (5) (6)Teacher Feedback 0.080∗∗∗
(0.021)Data Driven Instruction 0.050
(0.039)High Quality Tutoring 0.051
(0.033)Instructional Time 0.080∗∗∗
(0.022)High Expectations 0.081∗∗∗
(0.030)Index 0.053∗∗∗
(0.010)
R2 0.227 0.082 0.057 0.250 0.257 0.444Observations 39 22 39 38 38 39
Panel B: ELA Results(7) (8) (9) (10) (11) (12)
Teacher Feedback 0.066∗∗∗
(0.015)Data Driven Instruction 0.034
(0.029)High Quality Tutoring 0.054∗
(0.028)Instructional Time 0.048∗∗
(0.022)High Expectations 0.059∗∗∗
(0.020)Index 0.039∗∗∗
(0.008)
R2 0.318 0.171 0.166 0.210 0.295 0.475Observations 39 22 39 38 38 39
Notes: This table reports regressions of school-specific treatment effects on school characteristics. The sample includesall schools with at least one tested grade that completed the relevant part of the charter survey for that domain.Each independent variable is an indicator variable. Teacher feedback equals one if a school gives formal or informalfeedback ten or more times per semester. Data driven instruction equals one if a school gives five or more interimassessments during the school year and has four or more differentiation strategies. Tutoring equals one if a schooltutors students at least four days a week in groups of six or fewer. Instructional time equals one if a school adds25 percent or more instructional time compared to a traditional public school. High expectations equals one if aschool says that it prioritizes high academic and behavioral expectations for all students. The index is a sum of thedichotomous measures standardized to have a mean of zero and standard deviation of one. The dependent variableis the school-specific impact estimated using OLS and controlling for match cells, race, sex, free lunch eligibility,grade, and year. Middle school specifications also include baseline test scores. Regressions weight by the inverse ofthe standard error of the estimated school impact. *** = significant at 1 percent level, ** = significant at 5 percentlevel, * = significant at 10 percent level.
32

Table 7The Partial Correlation of Each School Practice Input
Panel A: Math Results(1) (2) (3) (4) (5)
Teacher Feedback 0.048∗∗
(0.023)Data Driven Instruction 0.020
(0.024)High Quality Tutoring 0.029
(0.020)Instructional Time 0.050∗∗∗
(0.013)High Expectations 0.044∗
(0.023)Index 0.040∗∗∗ 0.055∗∗∗ 0.052∗∗∗ 0.038∗∗∗ 0.041∗∗∗
(0.010) (0.011) (0.011) (0.009) (0.012)
R2 0.446 0.476 0.446 0.524 0.448Observations 39 39 39 39 39
Panel B: ELA Results(6) (7) (8) (9) (10)
Teacher Feedback 0.044∗∗∗
(0.014)Data Driven Instruction 0.013
(0.019)High Quality Tutoring 0.040∗
(0.022)Instructional Time 0.020
(0.017)High Expectations 0.030∗
(0.015)Index 0.027∗∗∗ 0.039∗∗∗ 0.036∗∗∗ 0.033∗∗∗ 0.031∗∗∗
(0.008) (0.008) (0.008) (0.009) (0.010)
R2 0.486 0.489 0.478 0.535 0.479Observations 39 39 39 39 39
Notes: This table reports regressions of school-specific treatment effects on school characteristics. The sample includesall schools with at least one tested grade that completed any part of the charter survey. Each independent variableis an indicator variable. Teacher feedback equals one if a school gives formal or informal feedback ten or more timesper semester. Data driven instruction equals one if a school gives five or more interim assessments during the schoolyear and has four or more differentiation strategies. Tutoring equals one if a school tutors students at least four daysa week in groups of six or fewer. Instructional time equals one if a school adds 25 percent or more instructionaltime compared to a traditional public school. High expectations equals one if a school says that it prioritizes highacademic and behavioral expectations for all students. The index is a sum of the remaining dichotomous measuresstandardized to have a mean of zero and standard deviation of one. The dependent variable is the school-specificimpact estimated using OLS and controlling for match cells, race, sex, free lunch eligibility, grade, and year. Middleschool specifications also include baseline test scores. Regressions weight by the inverse of the standard error of theestimated school impact. *** = significant at 1 percent level, ** = significant at 5 percent level, * = significant at10 percent level.
33

Table 8Out of Sample Test of School Practice Inputs
Panel A: Math Results(1) (2) (3) (4) (5)
Teacher Feedback 0.039∗
(0.020)Differentiated Instruction 0.004
(0.024)Instructional Time 0.062∗∗∗
(0.020)High Expectations 0.063∗∗∗
(0.022)Index 0.027∗∗∗
(0.009)
R2 0.040 0.000 0.139 0.114 0.102Observations 59 59 51 55 59
Panel B: ELA Results(6) (7) (8) (9) (10)
Teacher Feedback 0.016(0.013)
Differentiated Instruction −0.001(0.014)
Instructional Time 0.023(0.014)
High Expectations 0.043∗∗∗
(0.015)Index 0.013∗∗
(0.006)
R2 0.018 0.000 0.049 0.129 0.061Observations 59 59 51 55 59
Notes: This table reports regressions of school-specific treatment effects on school characteristics. The sample includesall schools with at least one tested grade with available site visit data. Each independent variable is an indicatorvariable. Teacher feedback equals one if a school gives formal or informal feedback ten or more times per semester.Data driven instruction equals one if a school gives five or more interim assessments during the school year and has fouror more differentiation strategies. Tutoring equals one if a school tutors students at least four days a week in groupsof six or fewer. Instructional time equals one if a school adds 25 percent or more instructional time compared to atraditional public school. High expectations equals one if a school says that it prioritizes high academic and behavioralexpectations for all students. The index is a sum of the remaining dichotomous measures standardized to have amean of zero and standard deviation of one. The dependent variable is the school-specific impact estimated usingOLS and controlling for match cells, race, sex, free lunch eligibility, grade, and year. Middle school specifications alsoinclude baseline test scores. Regressions weight by the inverse of the standard error of the estimated school impact.*** = significant at 1 percent level, ** = significant at 5 percent level, * = significant at 10 percent level.
34

Table 9Robustness to Additional Controls
Math Results ELA Results(1) (2) (3) (4)
School Practice Index 0.056∗∗∗ 0.046∗∗∗
(0.013) (0.010)Control Index 0.023 −0.005 0.010 −0.013
(0.014) (0.014) (0.008) (0.007)
R2 0.077 0.446 0.094 0.509Observations 39 39 39 39
Notes: This table reports regressions of school-specific treatment effects on school characteristics. The sampleincludes all schools with at least one tested grade that took the survey. The school practice index is a sumof the dichotomous measures from Table 6 standardized to have a mean of zero and standard deviationof one. The control index is the standardized sum of six indexes - human capital policies, data policies,parent engagement strategies, instructional time differences, culture and expectations, and curricular rigor -to have a mean of zero and a standard deviation of one. The dependent variable is the school-specific impactestimated using OLS and controlling for match cells, race, sex, free lunch eligibility, grade, and year. Middleschool specifications also include baseline test scores. Regressions weight by the inverse of the standard errorof the estimated school impact. *** = significant at 1 percent level, ** = significant at 5 percent level, * =significant at 10 percent level.
35

Figure 1Lottery and Observational Estimates
! = 0.946 (0.325)
-.50
.51
1.5
Lotte
ry E
stim
ate
-.2 0 .2 .4Observational Estimate
Math
! = 0.842 (0.373)
-.50
.51
Lotte
ry E
stim
ate
-.2 0 .2 .4 .6Observational Estimate
ELA
Notes: This figure reports school-specific treatment estimates using the lottery and observational designs. The lotterysample is restricted to students in an elementary or middle school charter school lottery, excluding students withsibling preference. All lottery specifications control for lottery risk set, race, sex, free lunch eligibility, grade, andyear. All observational specifications include match cell, race, sex, free lunch eligibility, grade, and year. Middleschool specifications also include baseline test scores.
36

Appendix Table 1Charter Schools in Survey Sample
2010 - 2011 Year Years inGrades Opened lottery study Survey Video
Panel A: Elementary Schools (3rd - 5th Grades)Amber Charter School K - 5 2000 2005 - 2006 Yes YesBronx Academy of Promise K - 4 2008 Yes NoBronx Charter School for Children K - 5 2004 2006-2010 Yes YesBronx Charter School for the Arts K - 6 2003 2007-2010 Yes YesBrooklyn Ascend Charter School K - 4 2008 2008 Yes YesExcellence Boys Charter School K - 8 2004 2003 - 2007 Yes YesExplore Charter School K - 8 2000 2005 - 2007 Yes YesFamily Life Academy Charter School K - 8 2001 Yes NoFuture Leaders Institute Charter School K - 8 2005 2007-2009 No YesGirls Preparatory Charter School K - 7 2005 2007-2009 Yes YesGrand Concourse Academy Charter School K - 5 2004 2006-2009 Yes YesHarbor Science and Arts Charter School K - 8 2002 2007 Yes YesHarlem Children’s Zone Promise Academy K - 5 2004 2004 - 2006 Yes YesHarlem Children’s Zone Promise Academy II K - 6 2005 2005 - 2006 Yes YesHarlem Link Charter School K - 5 2005 2005 - 2009 Yes YesHarlem Success Academy Charter School K - 5 2006 2006 - 2008 Yes YesHyde Leadership Charter School Bronx K - 5 2009 2006-2007 Yes YesLa Cima K - 3 2008 2009 - 2010 Yes YesManhattan Charter School K - 5 2005 2008 Yes NoMott Haven Academy K - 3 2008 Yes NoPeninsula Preparatory Academy K - 5 2004 2009 Yes YesRenaissance Charter School K - 5 2000 Yes YesSisulu-Walker Charter School of Harlem K - 5 1999 2007 Yes YesSouth Bronx Classical Charter School K - 5 2006 2007 Yes YesSouth Bronx Int. Cultures and the Arts K - 5 2005 Yes NoVOICE K - 3 2008 2009-2010 Yes Yes
Panel B: Middle Schools (5th - 8th Grades)Bronx Preparatory Charter School 5 - 12 2000 2008 - 2009 Yes YesConey Island Preparatory Charter School 5 - 6 2009 2009 - 2010 Yes YesDemocracy Preparatory Charter School 6 - 10 2006 2006 - 2009 Yes YesEquality Charter School 6 - 8 2009 2009-2010 Yes YesExplore Charter School 6 - 8 2000 Yes YesHarbor Science and Arts Charter School K - 8 2002 2007 Yes YesHarlem Children’s Zone Promise Academy 6 - 11 2004 2005 - 2008 Yes YesHyde Leadership Charter School Bronx 6 - 10 2009 2006 - 2009 Yes YesKIPP Infinity 5 - 8 2005 Yes NoOpportunity Charter School 6 - 12 2004 2008 - 2009 Yes YesRenaissance Charter School 6 - 8 2000 Yes YesSt. HOPE Leadership Academy 5 - 8 2008 Yes YesSummit Academy Charter School 6 - 7 2009 2009 Yes Yes
Notes: This table lists all New York City charter schools participating in the survey study. Elementary schoolsinclude all schools that have their main admissions lottery in grades PK - 4. Middle schools include all schools thathave their main admissions lottery in grades 5 - 8. Eligible charters serve a general student population with at leastone tested grade in 2010 - 2011.
37

Appendix Table 2Student Summary Statistics
Above Below Above BelowEligible Median Median Median Median
NYC Charters Survey Survey Difference Lottery Lottery Difference(1) (2) (3) (4) (5) (6) (7) (8)
Panel A. Elementary Schools (3rd - 5th Grades)Male 0.51 0.49 0.48 0.47 0.01 0.53 0.49 0.05∗∗
White 0.14 0.03 0.01 0.01 −0.00 0.00 0.02 −0.01∗∗∗
Black 0.32 0.66 0.74 0.65 0.09∗∗∗ 0.77 0.55 0.22∗∗∗
Hispanic 0.39 0.29 0.24 0.33 −0.08∗∗∗ 0.22 0.43 −0.21∗∗∗
Asian 0.14 0.02 0.00 0.01 −0.00∗ 0.00 0.01 −0.00Free Lunch 0.85 0.83 0.85 0.85 −0.00 0.82 0.85 −0.03∗
Special Education 0.11 0.06 0.06 0.06 0.00 0.06 0.08 −0.02∗∗
LEP 0.12 0.05 0.04 0.04 0.00 0.04 0.06 −0.02∗∗
School Free Lunch 0.85 0.85 0.85 0.85 0.00 0.83 0.85 −0.02∗∗∗
Observations 706663 23986 3344 2076 1472 674
Panel B. Middle Schools (5th - 8th Grades)Male 0.51 0.50 0.50 0.49 0.01 0.48 0.47 0.01White 0.14 0.03 0.00 0.00 0.00 0.00 0.00 0.00Black 0.33 0.64 0.84 0.41 0.43∗∗∗ 0.89 0.42 0.47∗∗∗
Hispanic 0.39 0.30 0.15 0.58 −0.43∗∗∗ 0.11 0.57 −0.46∗∗∗
Asian 0.14 0.02 0.00 0.00 −0.00 0.00 0.01 −0.01∗
Free Lunch 0.85 0.84 0.88 0.94 −0.06∗∗∗ 0.90 0.94 −0.04∗
Special Education 0.11 0.09 0.06 0.04 0.02∗ 0.05 0.03 0.02LEP 0.10 0.05 0.02 0.08 −0.06∗∗∗ 0.02 0.06 −0.04∗∗
Baseline Math 0.02 -0.06 -0.17 -0.11 −0.06 -0.33 -0.17 −0.16∗∗
Baseline ELA 0.01 -0.07 -0.18 -0.15 −0.02 -0.26 -0.18 −0.08School Free Lunch 0.84 0.84 0.89 0.95 −0.05∗∗∗ 0.90 0.94 −0.04∗∗∗
School Baseline Math 0.01 -0.04 -0.22 -0.18 −0.04∗∗∗ -0.32 -0.17 −0.15∗∗∗
School Baseline ELA -0.01 -0.06 -0.20 -0.23 0.03∗∗∗ -0.30 -0.22 −0.08∗∗∗
Observations 773620 22147 900 455 382 270
Notes: This table reports descriptive statistics for the sample of public school students, the sample of students ineligible charter schools, the sample of students in charter schools in the observational study, and the sample of studentsin the lottery study. The sample is restricted to students in grades 3 - 8 between 2003 - 2004 and 2010 - 2011 withat least one follow up test score. The final column reports coefficients from regressions of an indicator variable equalto one if the student won an admissions lottery on the variable indicated in each row and lottery risk sets. *** =significant at 1 percent level, ** = significant at 5 percent level, * = significant at 10 percent level.
38
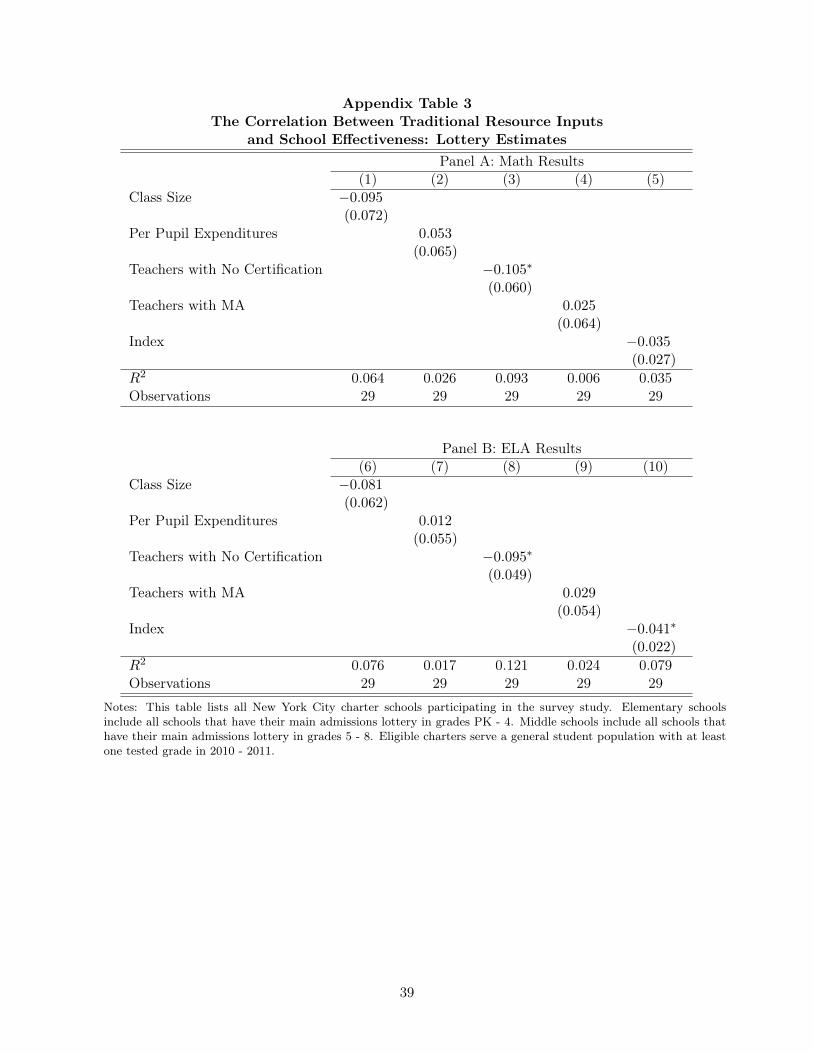
Appendix Table 3The Correlation Between Traditional Resource Inputs
and School Effectiveness: Lottery EstimatesPanel A: Math Results
(1) (2) (3) (4) (5)Class Size −0.095
(0.072)Per Pupil Expenditures 0.053
(0.065)Teachers with No Certification −0.105∗
(0.060)Teachers with MA 0.025
(0.064)Index −0.035
(0.027)
R2 0.064 0.026 0.093 0.006 0.035Observations 29 29 29 29 29
Panel B: ELA Results(6) (7) (8) (9) (10)
Class Size −0.081(0.062)
Per Pupil Expenditures 0.012(0.055)
Teachers with No Certification −0.095∗
(0.049)Teachers with MA 0.029
(0.054)Index −0.041∗
(0.022)
R2 0.076 0.017 0.121 0.024 0.079Observations 29 29 29 29 29
Notes: This table lists all New York City charter schools participating in the survey study. Elementary schoolsinclude all schools that have their main admissions lottery in grades PK - 4. Middle schools include all schools thathave their main admissions lottery in grades 5 - 8. Eligible charters serve a general student population with at leastone tested grade in 2010 - 2011.
39

Appendix Table 4The Correlation Between School Practices
Inputs and School Effectiveness: Lottery EstimatesPanel A: Math Results
(1) (2) (3) (4) (5) (6)Teacher Feedback 0.141∗∗
(0.057)Data Driven Instruction 0.060
(0.089)High Quality Tutoring 0.062
(0.063)Instructional Time 0.039
(0.042)High Expectations 0.075
(0.060)Index 0.045∗∗
(0.020)
R2 0.131 0.054 0.012 0.016 0.054 0.069Observations 29 18 29 29 28 29
Panel B: ELA Results(7) (8) (9) (10) (11) (12)
Teacher Feedback 0.115∗∗
(0.055)Data Driven Instruction 0.127
(0.088)High Quality Tutoring 0.051
(0.042)Instructional Time 0.024
(0.039)High Expectations 0.015
(0.049)Index 0.031
(0.021)
R2 0.137 0.108 0.025 0.023 0.019 0.060Observations 29 18 29 29 28 29
Notes: This table reports regressions of school-specific treatment effects on school characteristics. The sample includesall schools with at least one tested grade that completed the charter survey. Each independent variable is an indicatorvariable. Teacher feedback equals one if a school gives formal or informal feedback ten or more times per semester.Data driven instruction equals one if a school gives five or more interim assessments during the school year and hasfour or more differentiation strategies. Tutoring equals one if a school tutors students at least four days a week ingroups of six or fewer. Instructional time equals one if a school adds 25 percent or more instructional time comparedto a traditional public school. High expectations equals one if a school says that it prioritizes high academic andbehavioral expectations for all students. The index is a sum of the dichotomous measures standardized to have amean of zero and standard deviation of one. The dependent variable is the school-specific impact estimated usinglottery offer as an instrument of years of attendance at a school, controlling for lottery risk set, race, sex, free luncheligibility, grade, and year. Middle school specifications also include baseline test scores. Regressions weight by theinverse of the standard error of the estimated school impact. *** = significant at 1 percent level, ** = significant at5 percent level, * = significant at 10 percent level.
40

Appendix Table 5The Partial Correlation of Each School Practices Input:
Lottery EstimatesPanel A: Math Results
(1) (2) (3) (4) (5)Teacher Feedback 0.134∗
(0.067)Data Driven Instruction 0.043
(0.096)High Quality Tutoring 0.081∗
(0.043)Instructional Time −0.040
(0.059)High Expectations 0.052
(0.080)Index 0.008 0.036 0.052∗∗∗ 0.073∗∗ 0.028
(0.026) (0.022) (0.020) (0.036) (0.037)
R2 0.133 0.077 0.107 0.103 0.073Observations 29 29 29 29 29
Panel B: ELA Results(6) (7) (8) (9) (10)
Teacher Feedback 0.116∗
(0.062)Data Driven Instruction 0.104
(0.092)High Quality Tutoring 0.062∗
(0.032)Instructional Time −0.034
(0.060)High Expectations −0.023
(0.052)Index −0.002 0.015 0.036∗ 0.054 0.044∗
(0.027) (0.021) (0.020) (0.034) (0.023)
R2 0.137 0.092 0.088 0.088 0.085Observations 29 29 29 29 29
Notes: This table reports regressions of school-specific treatment effects on school characteristics. The sample includesall schools with at least one tested grade that completed the charter survey. Each independent variable is an indicatorvariable. Teacher feedback equals one if a school gives formal or informal feedback ten or more times per semester.Data driven instruction equals one if a school gives five or more interim assessments during the school year and hasfour or more differentiation strategies. Tutoring equals one if a school tutors students at least four days a week ingroups of six or fewer. Instructional time equals one if a school adds 25 percent or more instructional time comparedto a traditional public school. High expectations equals one if a school says that it prioritizes high academic andbehavioral expectations for all students. The index is a sum of the remaining dichotomous measures standardized tohave a mean of zero and standard deviation of one. The dependent variable is the school-specific impact estimatedusing lottery offer as an instrument of years of attendance at a school, controlling for lottery risk set, race, sex, freelunch eligibility, grade, and year. Middle school specifications also include baseline test scores. Regressions weight bythe inverse of the standard error of the estimated school impact. *** = significant at 1 percent level, ** = significantat 5 percent level, * = significant at 10 percent level.
41

Appendix Table 6Robustness to Additional Controls: Lottery Estimates
Math Results ELA Results(1) (2) (3) (4)
School Practices Index 0.055∗ 0.033(0.030) (0.027)
Control Index 0.014 −0.016 0.014 −0.002(0.022) (0.031) (0.014) (0.018)
R2 0.009 0.076 0.032 0.060Observations 29 29 29 29
Notes: This table reports regressions of school-specific treatment effects on school characteristics. The sample includesall schools with at least one tested grade that took the survey. The school practices index is a sum of the dichotomousmeasures from Table 6 standardized to have a mean of zero and standard deviation of one. The control index is thestandardized sum of six indexes - human capital policies, data policies, parent engagement strategies, instructionaltime differences, culture and expectations, and curricular rigor - to have a mean of zero and a standard deviationof one. The dependent variable is the school-specific impact estimated using lottery offer as an instrument of yearsof attendance at a school, controlling for lottery risk set, race, sex, free lunch eligibility, grade, and year. Middleschool specifications also include baseline test scores. Regressions weight by the inverse of the standard error of theestimated school impact. *** = significant at 1 percent level, ** = significant at 5 percent level, * = significant at10 percent level.
42

Appendix Table 7Characteristics of Survey Schools
and Schools with Publicly Available DataSurvey & PublicPublic Only Difference(1) (2) (3)
Math Test Score Gains 0.075 0.117 0.039ELA Test Score Gains 0.044 0.067 0.026Teacher Feedback 0.448 0.933 0.485∗∗∗
Differentiated Instruction 0.276 0.467 0.191Instructional Time 0.213 0.291 0.067∗
High Expectations 0.074 0.536 0.462∗∗∗
Observations 29 30
Notes: This table reports summary statistics for schools that are in both the survey and public sample andthe sample of schools that only have publicly available data on school inputs. The survey & public sampleexcludes schools without a tested grade in 2010 - 2011 and schools without publicly available data on inputs.The survey & public sample does include schools with and without lottery data. The publicly availablesample includes all schools with publicly available data from a chartering organization. All variables areschool level measures are taken from the administrative data. The difference between samples is reported inthe last column. The number of observations in each sample is reported at the bottom of the table. *** =significant at 1 percent level, ** = significant at 5 percent level, * = significant at 10 percent level.
43
Related Documents