getting to grips with the cost index Issue II - May 1998 Flight Operations Support & Line Assistance

Welcome message from author
This document is posted to help you gain knowledge. Please leave a comment to let me know what you think about it! Share it to your friends and learn new things together.
Transcript
AIRBUS S.A.S.31707 BLAGNAC CEDEX - FRANCE
CONCEPT DESIGN SCM12REFERENCE SCM-A297
AUGUST 2002PRINTED IN FRANCE© AIRBUS S.A.S. 2002
ALL RIGHTS RESERVED
AN EADS JOINT COMPANY WITH BAE SYSTEMS
AIRBUS
The statements made herein do not constitute anoffer. They are based on the assumptions shownand are expressed in good faith. Where thesupporting grounds for these statements are notshown, the Company will be pleased to explainthe basis thereof. This document is the propertyof Airbus and is supplied on the expresscondition that it is to be treated as confidential.No use of reproduction may be made thereofother than that expressely authorised.
getting to grips with the
cost indexIssue II - May 1998
Flight Operations Support & Line Assistance
Flig
ht O
pera
tions
Sup
port
& L
ine
Ass
ista
nce
g
ettin
g to
grip
s w
ith th
e co
st in
dex
Issu
e II
- M
ay 1
998

getting to grips with
cost index
Issue II - May 1998
Flight Operations Support & Line AssistanceCustomer Services
1, rond-point Maurice Bellonte, BP 3331707 BLAGNAC Cedex FRANCE
Telephone (+33) 5 61 93 33 33 Telefax (+33) 5 61 93 29 68
Telex AIRBU 530526FSITA TLSBI7X
STL 945.2369/98 May 1998 – Issue 2
Flight Operations Support & Line Assistance

1
TABLE OF CONTENTS
1. PREAMBLE................................................................................... 3
2. INTRODUCTION :COST INDEX DEFINITION AND DETERMINATION .................... 52.1 Trip cost2.2 Time-related costs2.3 Cost index calculation2.4 Variation of airline practices
3. COST INDEX TABLES.................................................................. 93.1 A300/A310 Family3.2 A320 Family3.3 A330/A340 Family
(a) Cost index brackets(b) A340 specific range versus Mach(c) Recalibrating the cost index(d) Transforming cost index brackets
3.4 Basic options with the cost index concept
4. TRIP COST PENALTY AS A COST INDEX FUNCTION ............ 154.1 Trip cost variations at fixed fuel cost4.2 Trip cost variations at fixed time-cost
5. CLIMB PERFORMANCE VERSUS COST INDEX ...................... 205.1 Cost index - climb profile relationships5.2 Variation of climb parameters with the cost index5.3 A340 practical case
6. OPTIMUM ALTITUDE FOLLOW-UP........................................... 276.1 Trade-off between manoeuvrability and economy6.2 Cross-over altitude versus optimum altitude6.3 Best cost strategy : A340 application
(a) Climb capability(b) Cost factor in the choice of optimum altitude
2
7. COST INDEX AND CRUISE MANAGEMENT............................. 387.1 Cost index - cruise speed relationship
(a) At a given gross weight(b) At a given flight level
7.2 Cost Index - fuel consumption relationship7.3 Cruise "managed" versus cruise "selected"7.4 Airbus family Long-Range Cruise (LRC) cost indices7.5 Wind effect on ECON speeds7.6 Summary
8. DESCENT PERFORMANCE VERSUS COST INDEX ................ 518.1 Cost index - descent profile relationships8.2 Variation of descent parameters with the cost index
9. PRACTICAL USE OF THE CI - OPERATIONALRECOMMENDATIONS ............................................................... 579.1 Cost index revisions9.2 Changing the cost index at departure / on ground9.3 Changing the cost index in flight
10. CONCLUSION............................................................................. 60APPENDIX 1 - Changing the cost index at departure/on ground 61APPENDIX 2 - A300-600/A310 Default cost index option 88APPENDIX 3 - A340-200 AND -300 Cost index conversion 90APPENDIX 4 - A340-200 AND -300 Climb IAS preselection
procedure for Load 6 pending Load 7 release 95APPENDIX 5 - A320 / A330 / A340 Families –
Optimum Mach Number 99APPENDIX 6 - A319 / A320 / A321
Cost Index for LRC 103
3
1. PREAMBLE
Today's tough competitive environment forces airlines to consider operational costs inevery facet of their business. All ways and means to achieve this goal have to berationally envisaged, safety being of course the prime factor in any airline operation. Awide spectrum of considerations intervene in this process stemming from airlineeconomics, marketing management, crew scheduling, flight operations, engineeringand maintenance management, technical condition of aircraft.
The idea behind this document is to revisit the cost index concept with a view towardsbalancing both fuel- and time-related costs.
With the surge of fuel prices in the early 1970s both airlines and aircraft manufacturersstarted concentrating on systems for reducing fuel consumption. In some airlines, fuelcost at one point represented no less than 45%, but gradually decreased to a mere20% effectively emphasizing the other aspects of the cost equation. The widespreaduse of flight management systems since the early 1980s enabled airlines to take intoaccount the other cost- and time-related aspects as well.
In addition to navigation functions, the Flight Management Computer (FMC) carries outreal-time performance optimization aimed at providing best economics, not necessarilyin terms of fuel consumption, but rather in terms of direct operating costs :- climb, cruise and descent speed as a function of selectable constraints (altitude,
arrival time, ...)- minimum fuel, time or cost.
The purpose of this brochure is to clarify the cost index as a tool aimed at achieving thisflexibility with regard to Airbus aircraft performance.
Moreover, some misconceptions need to be cleared up with regard to its utilization andmore in-house analysis is required for its determination, always bearing in mind that theprimary and essential goal of the cost index is trip cost or mission optimization andnot speed control.
The following engineers and managers from Airbus made an important contribution toreviewing and editing this brochure : Michel TREMAUD, Laval CHAN, Guy Di SANTO,Christian MONTEIL, Monique FUERI, Philippe BURCIER (STL dept.), Robert LIGNÉE,Jacques ROSAY (EVT dept), Frank REPP (SE-MX), Jean-Pierre DEMORTIER(BTE/EG/PERF).
Many thanks also to Mr Laurent SYLVESTRE and Mr Frederic DUPOUY who broughtthis brochure to fruition through numerous calculation saga's whilst being on standbywaiting for pilot recruitment by the airlines.
4
Would you please send your comments and remarks to the following contact point atAirbus. The topic of the cost index has been the subject of so much correspondence /communication, agreement / disagreement, action / inaction in recent years that wevalue your contributions very much. These will be taken into account in the followingissues to be edited.
Flight Operations Support & Line Assistance (STL)Customer Services Directorate1, Rond Point Maurice Bellonte, BP 3331707 BLAGNAC Cedex - FRANCETELEX AIRBU 530526ESITA TLSB17XTELEFAX 33/(0)5 61 93 29 68 or 33/(0)5 61 93 44 65
5
2. INTRODUCTION : COST INDEX DEFINITION AND DETERMINATION
The fundamental rationale of the cost index concept is to achieve minimum trip cost bymeans of a trade-off between operating costs per hour and incremental fuel burn. Inessence, the cost index is used to take into account the relationship between fuel-andtime-related costs. As a matter of fact, this underlying idea had already been introducedwith the Performance Data Computer (PDC), the predecessor of the FlightManagement System (FMS).
2.1 Trip cost
Without having to resort to complicated mathematics we can readily appreciate that thetotal cost of a specific trip is the sum of fixed and variable costs :
C = CF x ∆∆∆∆F + CT x ∆∆∆∆T + Cc
with CF = cost of fuel per kgCT = time-related cost per minute of flightCc = fixed costs independent of time∆F = trip fuel∆T = trip time
In order to minimize C or the total trip cost we therefore need to minimize the variablecost :
CF x ∆F + CT x ∆T
For a given sector and period, the fuel price may be assumed to be a fixed value.
Let us consider a cost function ττττ = C/CF = ∆F + CT/CF x ∆T with CT/CF = CI (defined as the cost index)
Over a certain stage length ∆S this means :ττττ (1 nautical mile) = 1/SR + CI x 1/V
with SR being the specific range at weight, altitude and other conditionsSR = ∆S/∆F (nautical miles per kg)
with V being the ground speed to cover ∆S stage nautical miles including windsV = aM + Vc (Vc as the average head or tail wind component)
For a given sector, minimum trip cost is therefore achieved by adopting an operationalspeed that properly proportions both fuel- and time-related costs.
For a given cost index Mach Number (MN) variations will actually compensate forfluctuations in wind (see 7.5).
6
2.2 Time-related costs
Time-related costs contain the sum of several components :
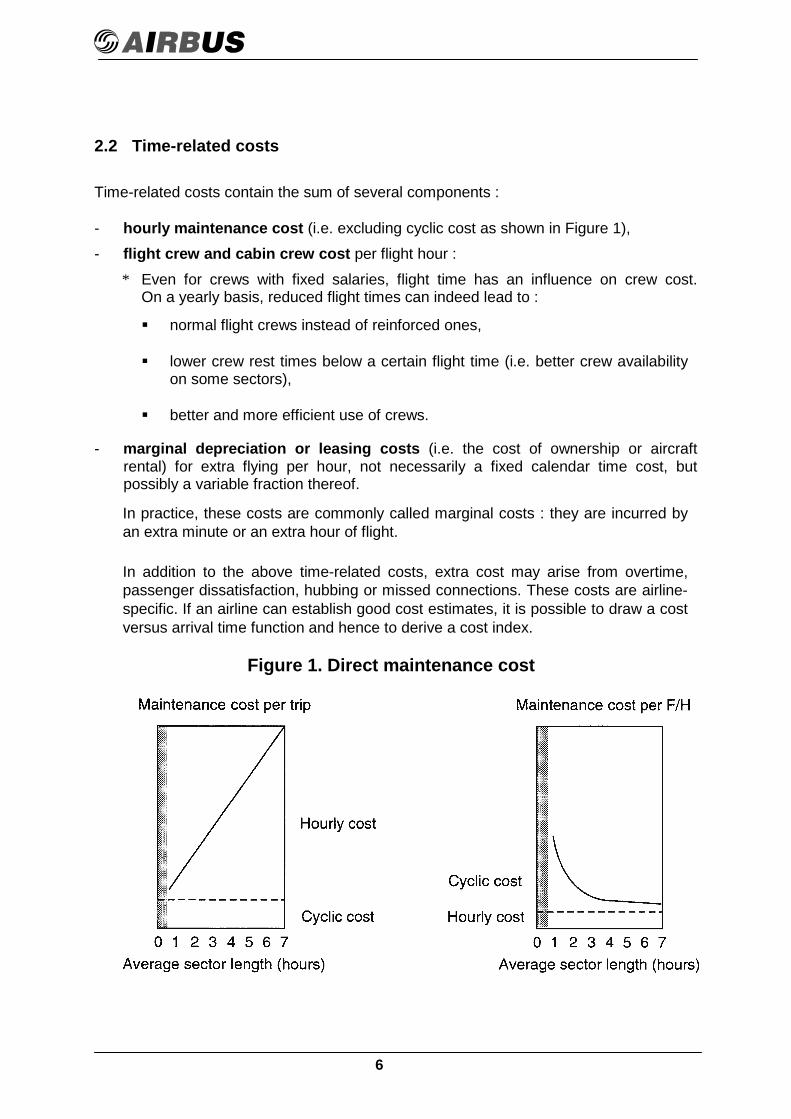
- hourly maintenance cost (i.e. excluding cyclic cost as shown in Figure 1),- flight crew and cabin crew cost per flight hour :
* Even for crews with fixed salaries, flight time has an influence on crew cost.On a yearly basis, reduced flight times can indeed lead to :
! normal flight crews instead of reinforced ones,
! lower crew rest times below a certain flight time (i.e. better crew availabilityon some sectors),
! better and more efficient use of crews.
- marginal depreciation or leasing costs (i.e. the cost of ownership or aircraftrental) for extra flying per hour, not necessarily a fixed calendar time cost, butpossibly a variable fraction thereof.
In practice, these costs are commonly called marginal costs : they are incurred byan extra minute or an extra hour of flight.
In addition to the above time-related costs, extra cost may arise from overtime,passenger dissatisfaction, hubbing or missed connections. These costs are airline-specific. If an airline can establish good cost estimates, it is possible to draw a costversus arrival time function and hence to derive a cost index.
Figure 1. Direct maintenance cost
7
With time-related costs, the faster the aircraft is flown, the more money is saved. This isbecause the faster the aircraft is flown, the more miles time-related components can beused and the more miles can be flown and produced between inspections when justconsidering maintenance cost. However, if the aircraft is flown faster to reducetimerelated costs, fuel burn increases and money will be lost in turn.
On the other hand, to avoid over-consumption of fuel, the aircraft should be flown moreslowly. To solve this dilemma, the FMS uses both ingredients, and is therefore able tocounterbalance these cost factors and to help select the best speed to fly, thereforecalled ECON (i.e. minimum cost) speed.
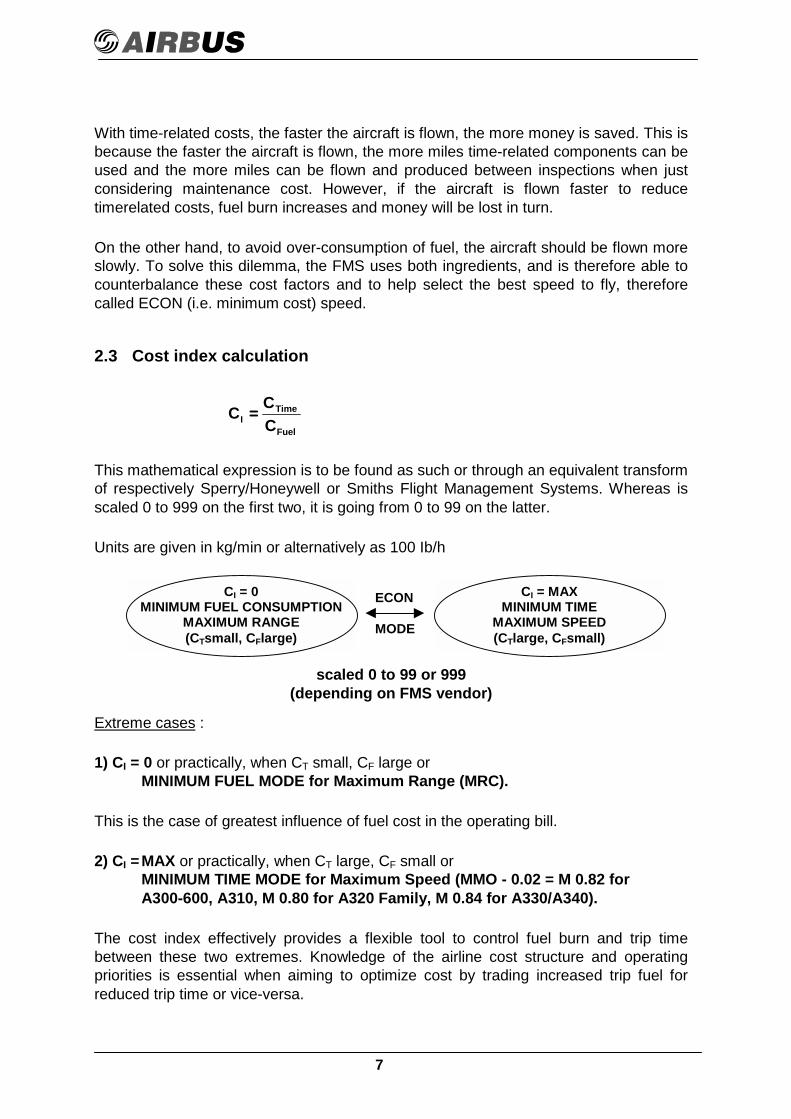
2.3 Cost index calculation
Fuel
TimeI C
CC ====
This mathematical expression is to be found as such or through an equivalent transformof respectively Sperry/Honeywell or Smiths Flight Management Systems. Whereas isscaled 0 to 999 on the first two, it is going from 0 to 99 on the latter.
Units are given in kg/min or alternatively as 100 Ib/h
scaled 0 to 99 or 999(depending on FMS vendor)
Extreme cases :
1) CI = 0 or practically, when CT small, CF large orMINIMUM FUEL MODE for Maximum Range (MRC).
This is the case of greatest influence of fuel cost in the operating bill.
2) CI =MAX or practically, when CT large, CF small orMINIMUM TIME MODE for Maximum Speed (MMO - 0.02 = M 0.82 forA300-600, A310, M 0.80 for A320 Family, M 0.84 for A330/A340).
The cost index effectively provides a flexible tool to control fuel burn and trip timebetween these two extremes. Knowledge of the airline cost structure and operatingpriorities is essential when aiming to optimize cost by trading increased trip fuel forreduced trip time or vice-versa.
CI = 0MINIMUM FUEL CONSUMPTION
MAXIMUM RANGE(CTsmall, CFlarge)
CI = MAXMINIMUM TIME
MAXIMUM SPEED(CTlarge, CFsmall)
ECON
MODE
8
The mere fact that fuel costs can significantly vary from one sector to another andthroughout the year should prompt airlines to consider adopting different cost indicesfor their various routes, seasonally readjusted to account for recurring fluctuations.
At Airbus, the Customer Services Directorate runs a department specialized inevaluating and modelling direct maintenance costs. Much progress could be obtainedby having airline accountants look into the other time-related costs also. In practice,however, it has been hard for flight operations departments to persuade their airlinefinancial analysts into assessing marginal operating costs.
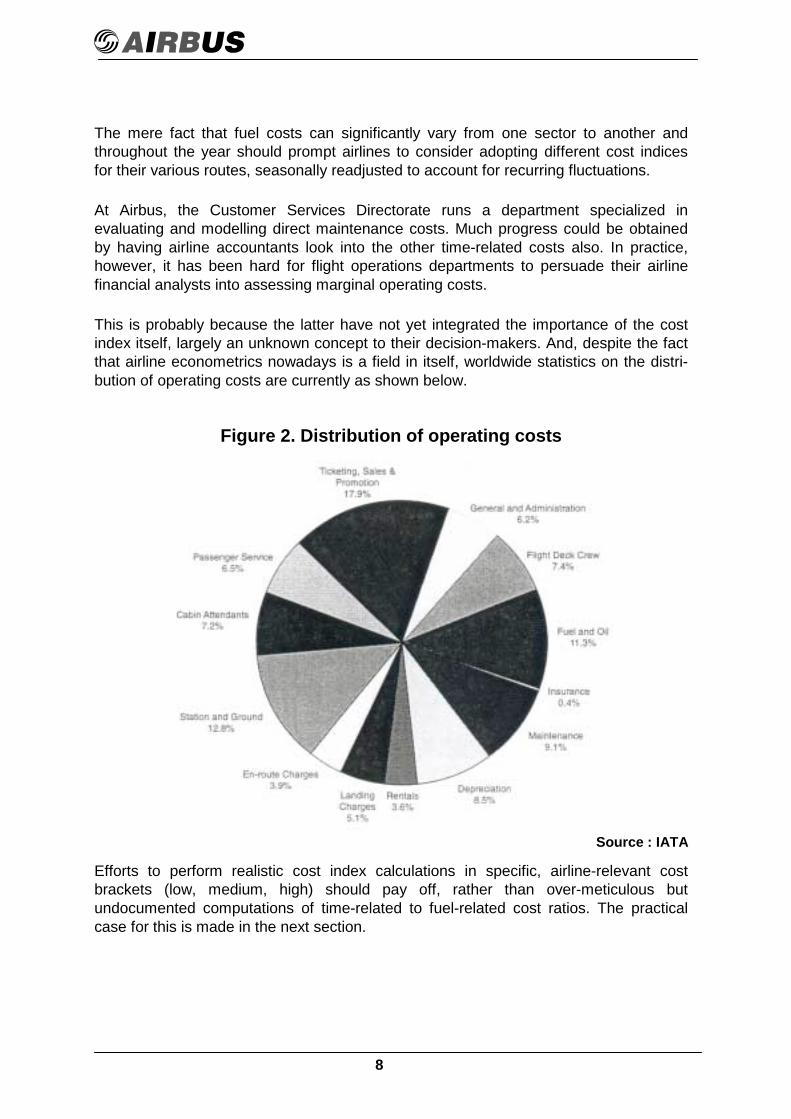
This is probably because the latter have not yet integrated the importance of the costindex itself, largely an unknown concept to their decision-makers. And, despite the factthat airline econometrics nowadays is a field in itself, worldwide statistics on the distri-bution of operating costs are currently as shown below.
Figure 2. Distribution of operating costs
Source : IATA
Efforts to perform realistic cost index calculations in specific, airline-relevant costbrackets (low, medium, high) should pay off, rather than over-meticulous butundocumented computations of time-related to fuel-related cost ratios. The practicalcase for this is made in the next section.

9
2.4 Variation of airline practices
A large variation exists in how airlines actually use the cost index : some of thisvariation is related to specific operator requirements, some of it may reflect difficultieswith the concept that may lead to inappropriate application. Some cases are cited here :
Airline A : use of the cost index to approximate Long Range Cruise (LRC)
Airline B : use of the cost index between LRC and Maximum Range Cruise (MRC)
Airline C : higher cost index if necessary for scheduling irrespective of fuelconsumption issues
Airline D : Cost index variation according to fuel prices irrespective of timeconsiderations (transparent / not considered)
Airline E : use of the cost index to approximate LRC, except cost index = 0 for fuelcritical routes
Airline F : cost index calculation resulting in cruise speed between MRC and LRC
Airline G : cost index calculation resulting in cruise speed slightly below LRC
Airline H : use of the cost index to meet schedule requirements route by route
Airline I : use of the cost index route by route differentiating by fuel price only
Airline J : adoption of cost index values by adapting from other aircraft models/manufacturers
Airline K : adoption of cost index values by a adapting for speed requirements only
Airline L : cost index adaptation according to sector fuel price variations after aninitial rigorous fuel and time calculation.
3. COST INDEX TABLES
Although we recommend treating each airline route individually, cost brackets rangingfrom low to medium to high fuel and time-related costs led us to consider the followingcost index tables.
10
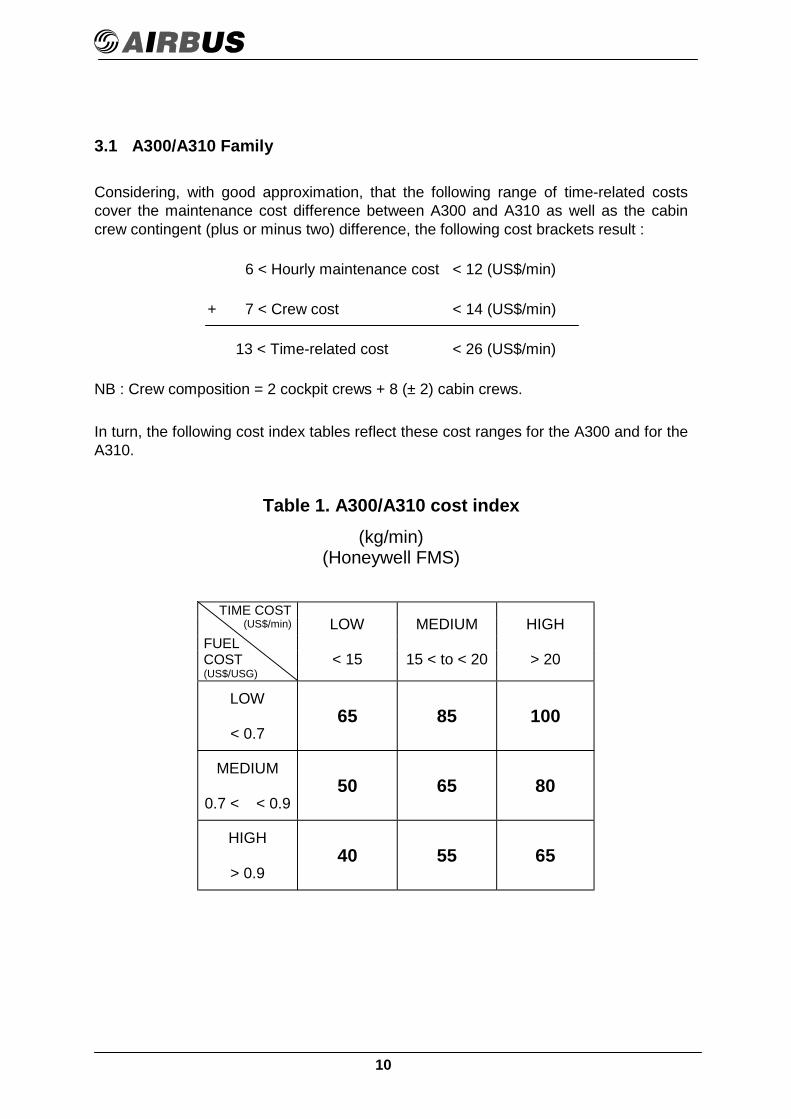
3.1 A300/A310 Family
Considering, with good approximation, that the following range of time-related costscover the maintenance cost difference between A300 and A310 as well as the cabincrew contingent (plus or minus two) difference, the following cost brackets result :
6 < Hourly maintenance cost < 12 (US$/min)
+ 7 < Crew cost < 14 (US$/min)
13 < Time-related cost < 26 (US$/min)
NB : Crew composition = 2 cockpit crews + 8 (± 2) cabin crews.
In turn, the following cost index tables reflect these cost ranges for the A300 and for theA310.
Table 1. A300/A310 cost index(kg/min)
(Honeywell FMS)
TIME COST(US$/min)
FUELCOST(US$/USG)
LOW
< 15
MEDIUM
15 < to < 20
HIGH
> 20
LOW
< 0.765 85 100
MEDIUM
0.7 < < 0.950 65 80
HIGH
> 0.940 55 65
11
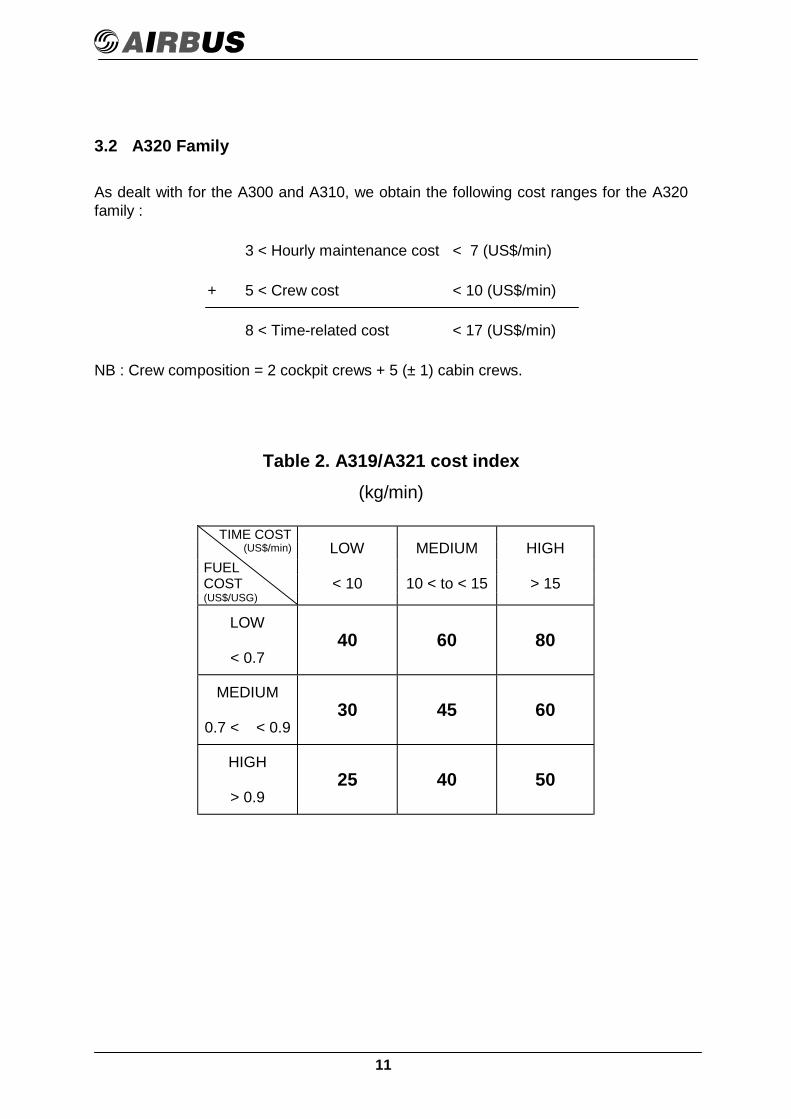
3.2 A320 Family
As dealt with for the A300 and A310, we obtain the following cost ranges for the A320family :
3 < Hourly maintenance cost < 7 (US$/min)
+ 5 < Crew cost < 10 (US$/min)
8 < Time-related cost < 17 (US$/min)
NB : Crew composition = 2 cockpit crews + 5 (± 1) cabin crews.
Table 2. A319/A321 cost index(kg/min)
TIME COST(US$/min)
FUELCOST(US$/USG)
LOW
< 10
MEDIUM
10 < to < 15
HIGH
> 15
LOW
< 0.740 60 80
MEDIUM
0.7 < < 0.930 45 60
HIGH
> 0.925 40 50
12
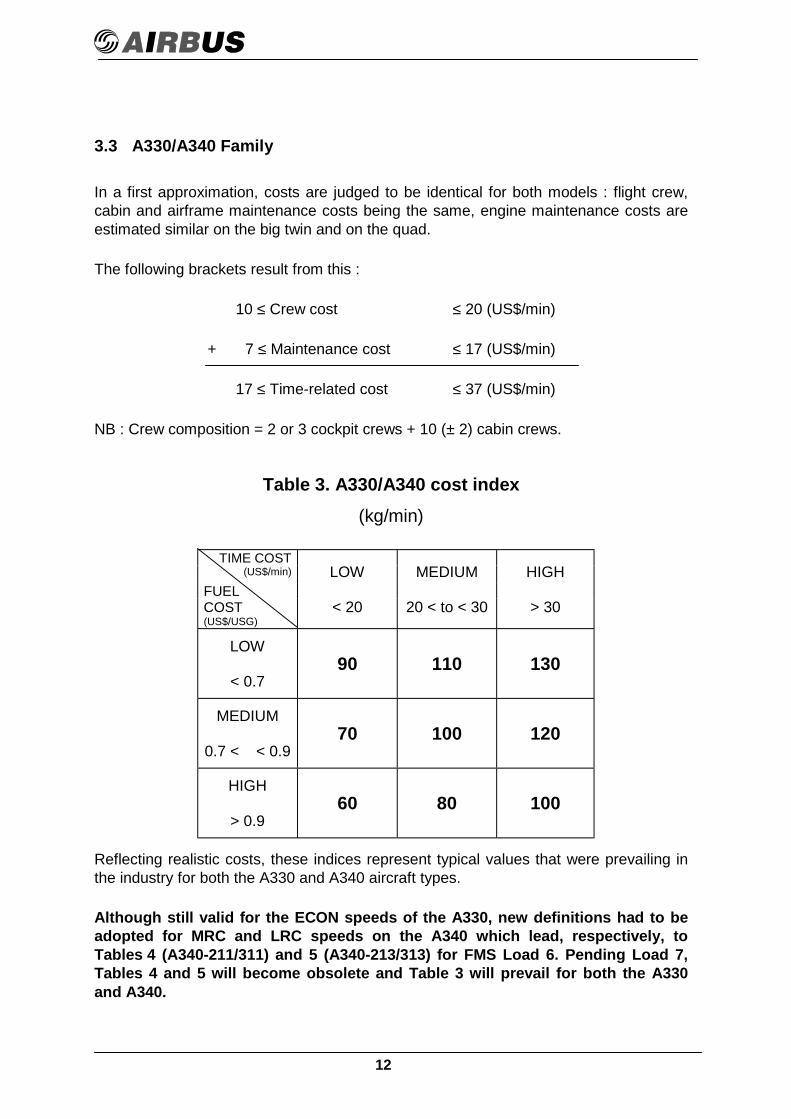
3.3 A330/A340 Family
In a first approximation, costs are judged to be identical for both models : flight crew,cabin and airframe maintenance costs being the same, engine maintenance costs areestimated similar on the big twin and on the quad.
The following brackets result from this :
10 ≤ Crew cost ≤ 20 (US$/min)
+ 7 ≤ Maintenance cost ≤ 17 (US$/min)
17 ≤ Time-related cost ≤ 37 (US$/min)
NB : Crew composition = 2 or 3 cockpit crews + 10 (± 2) cabin crews.
Table 3. A330/A340 cost index(kg/min)
TIME COST(US$/min)
FUELCOST(US$/USG)
LOW
< 20
MEDIUM
20 < to < 30
HIGH
> 30
LOW
< 0.790 110 130
MEDIUM
0.7 < < 0.970 100 120
HIGH
> 0.960 80 100
Reflecting realistic costs, these indices represent typical values that were prevailing inthe industry for both the A330 and A340 aircraft types.
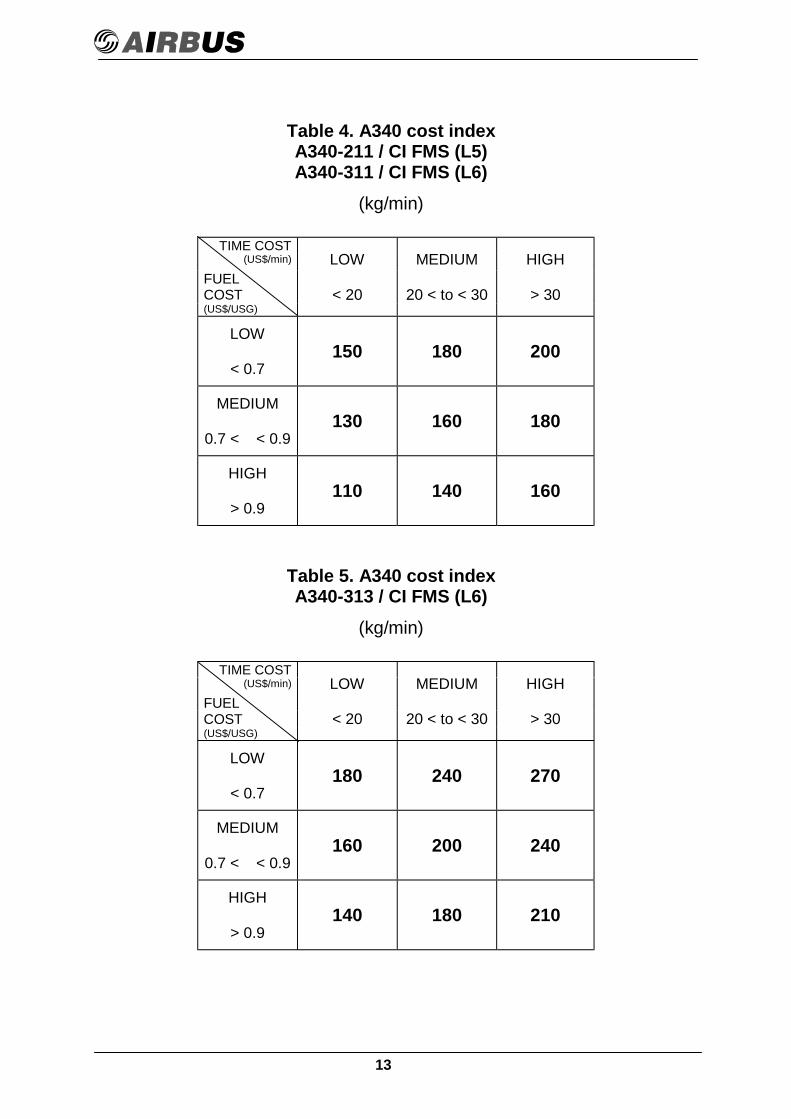
Although still valid for the ECON speeds of the A330, new definitions had to beadopted for MRC and LRC speeds on the A340 which lead, respectively, toTables 4 (A340-211/311) and 5 (A340-213/313) for FMS Load 6. Pending Load 7,Tables 4 and 5 will become obsolete and Table 3 will prevail for both the A330and A340.
13
Table 4. A340 cost indexA340-211 / CI FMS (L5)A340-311 / CI FMS (L6)
(kg/min)
TIME COST(US$/min)
FUELCOST(US$/USG)
LOW
< 20
MEDIUM
20 < to < 30
HIGH
> 30
LOW
< 0.7150 180 200
MEDIUM
0.7 < < 0.9130 160 180
HIGH
> 0.9110 140 160
Table 5. A340 cost indexA340-313 / CI FMS (L6)
(kg/min)
TIME COST(US$/min)
FUELCOST(US$/USG)
LOW
< 20
MEDIUM
20 < to < 30
HIGH
> 30
LOW
< 0.7180 240 270
MEDIUM
0.7 < < 0.9160 200 240
HIGH
> 0.9140 180 210
14
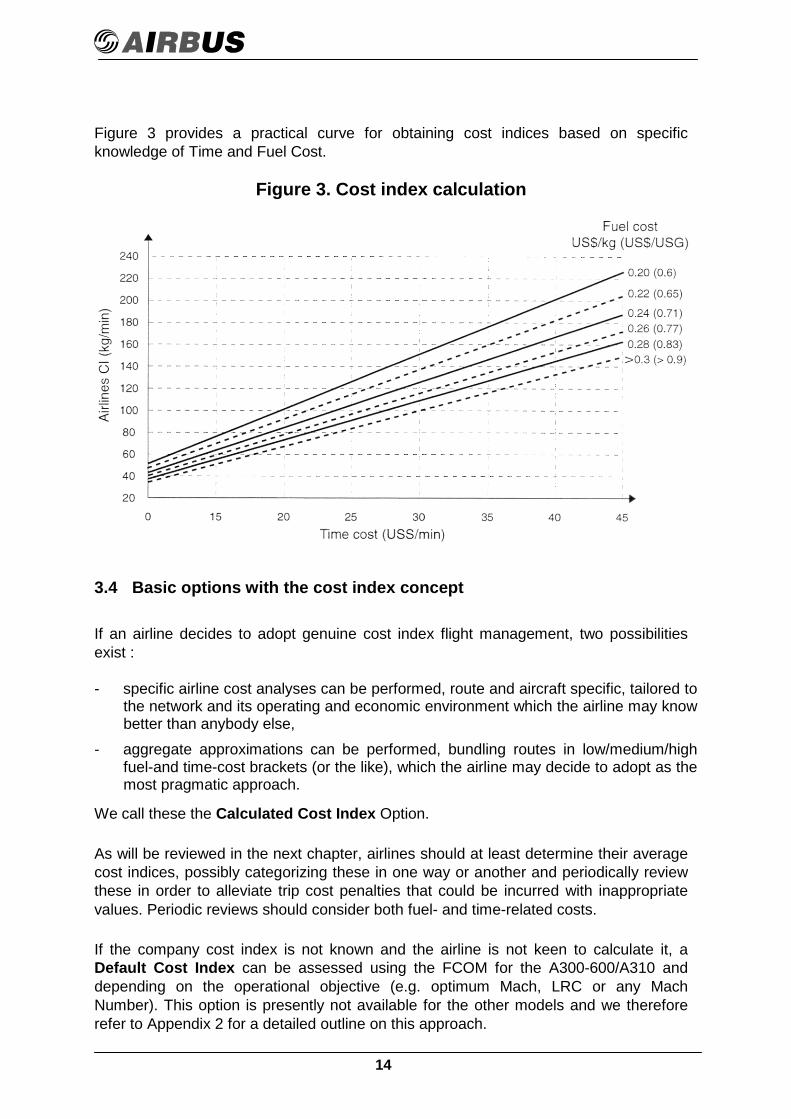
Figure 3 provides a practical curve for obtaining cost indices based on specificknowledge of Time and Fuel Cost.
Figure 3. Cost index calculation
3.4 Basic options with the cost index concept
If an airline decides to adopt genuine cost index flight management, two possibilitiesexist :
- specific airline cost analyses can be performed, route and aircraft specific, tailored tothe network and its operating and economic environment which the airline may knowbetter than anybody else,
- aggregate approximations can be performed, bundling routes in low/medium/highfuel-and time-cost brackets (or the like), which the airline may decide to adopt as themost pragmatic approach.
We call these the Calculated Cost Index Option.
As will be reviewed in the next chapter, airlines should at least determine their averagecost indices, possibly categorizing these in one way or another and periodically reviewthese in order to alleviate trip cost penalties that could be incurred with inappropriatevalues. Periodic reviews should consider both fuel- and time-related costs.
If the company cost index is not known and the airline is not keen to calculate it, aDefault Cost Index can be assessed using the FCOM for the A300-600/A310 anddepending on the operational objective (e.g. optimum Mach, LRC or any MachNumber). This option is presently not available for the other models and we thereforerefer to Appendix 2 for a detailed outline on this approach.
15
4. TRIP COST PENALTY AS A FUNCTION OF THE COST INDEX
As shown in 2.1, trip cost varies according to fuel-related costs on the one hand, and totime-related costs on the other.
The purpose of this section is to explain the sensitivity of the actual trip cost, firstly toerrors in cost index which result from uncertainty as to the correct value of time-relatedcosts, and secondly due to unaccounted fuel price fluctuations.
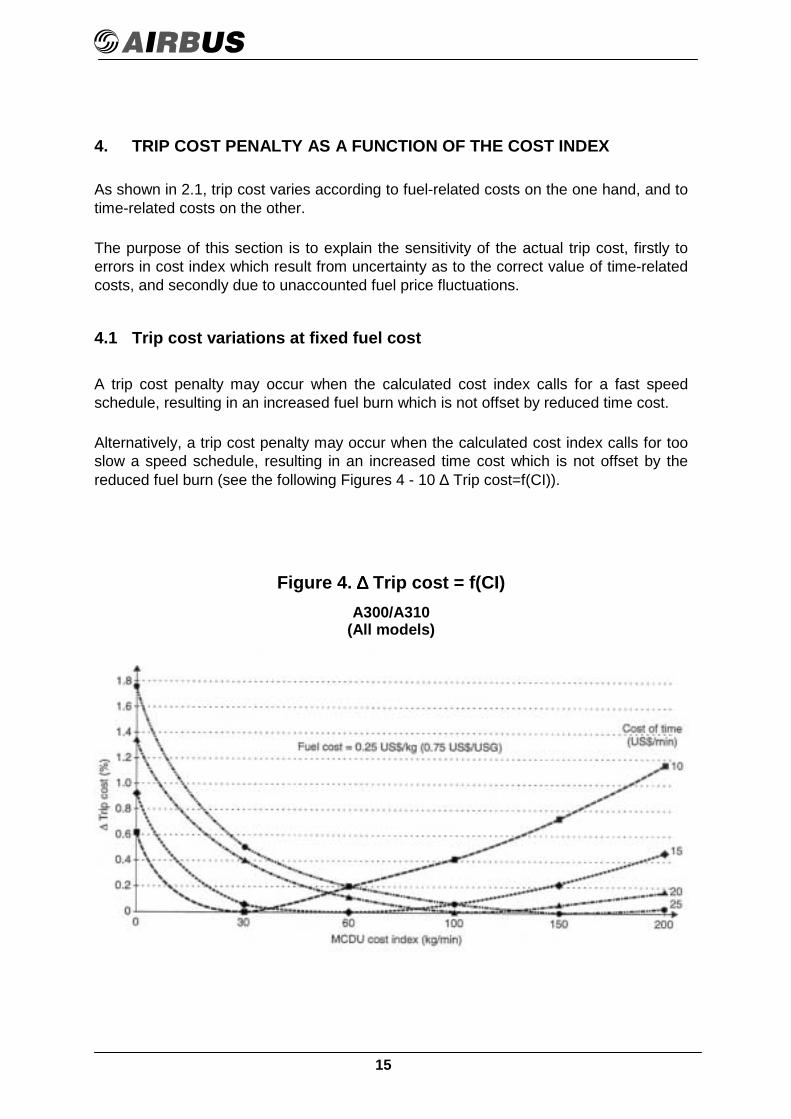
4.1 Trip cost variations at fixed fuel cost
A trip cost penalty may occur when the calculated cost index calls for a fast speedschedule, resulting in an increased fuel burn which is not offset by reduced time cost.
Alternatively, a trip cost penalty may occur when the calculated cost index calls for tooslow a speed schedule, resulting in an increased time cost which is not offset by thereduced fuel burn (see the following Figures 4 - 10 ∆ Trip cost=f(CI)).
Figure 4. ∆∆∆∆ Trip cost = f(CI)A300/A310
(All models)

16
Figure 5. ∆∆∆∆ Trip cost = f(CI)A319/A320/A321
(All models)
Figure 6. ∆∆∆∆ Trip cost = f(CI)A340
(All models)
Obviously, we can see that the higher the time-related cost, the higher the cost indexcorresponding to the minimum trip cost (different minima for each time cost value).
For the flat areas of these preceding curves, trip cost penalties are negligible when costof time errors are made. We call these the "least risk areas". As depicted, trip costpenalties are marginal when the utilized cost index values are close to the theoreticallycorrect ones. Elsewhere, trip cost penalties are rather sensitive.

17
An error of 5 US$/min in the time cost computation which leads to a cost index error of20 (fuel price = 0.25 US$/kg) can increase the trip cost from 0.2 up to almost 2%(especially for the A320) depending on the cost index range and the aircraft model.
Although possibly negligible on a single flight, this becomes rather meaningful on ayearly basis when applied to a whole fleet.
4.2 Trip cost variations at fixed time-cost
This section shows the importance of adapting the cost index to each airline routesector, that is to say to each fuel price sector.
The following graphs illustrate trip cost variations according to different fuel prices andfor each Airbus model, depicting similar curves to those in 4.1 above.
Figure 7. ∆∆∆∆ Trip cost = f(CI)A300/A310
(All models)

18
Figure 8. ∆∆∆∆ Trip cost = f(CI)A319/A320/A321
(All models)
Figure 9. ∆∆∆∆ Trip cost = f(CI)A330
(All models)

19
Figure 10. ∆∆∆∆ Trip cost = f(CI)A340
(All models)
In a similar manner, we notice that the lower the fuel price, the higher the cost indexcorresponding to the minimum trip cost (different minima for each fuel price value).
Moreover, we also appreciate that a fuel price variation of 0.25 U$/USG may lead to atrip cost increase of up to 1% if not properly taken into account.
To sum up, and considering average time-related cost for each aircraft type, we cansay that fuel prices are indeed rather influential in cost index determination especiallywhen their value exceeds 1 US$/USG (see preceding graphs).

20
5. CLIMB PERFORMANCE VERSUS COST INDEX
5.1 Cost index - climb profile relationships
Let us consider the influence of the cost index on the climb profiles shown in thefollowing graph. We can readily appreciate how the FMS computes the Top of Climb(TOC) as a function of the cost index.
Figure 11. Climb profiles
Fuel and Time to "Distance" (e.g. 150 or 200nm) is also a good indicator
We notice that the higher the cost index :
- the shallower the climb path (the higher the speed),- the longer the climb distance,- the farther the Top of Climb (TOC),
In order to be more accurate, we have to review the cost index influence on climb foreach aircraft type, and this is done in the following two sections.
5.2 Variation of climb parameters with the cost index
The following Table 6 shows the different relevant accurate climb parameters (time,speed, fuel, distance...) computed by in-flight performance software (not FMScomputation) for the A300, A310, A320, A330 and A340. The A340 case is consideredmore particularly in the next section because its climb CAS is not a cost index function.
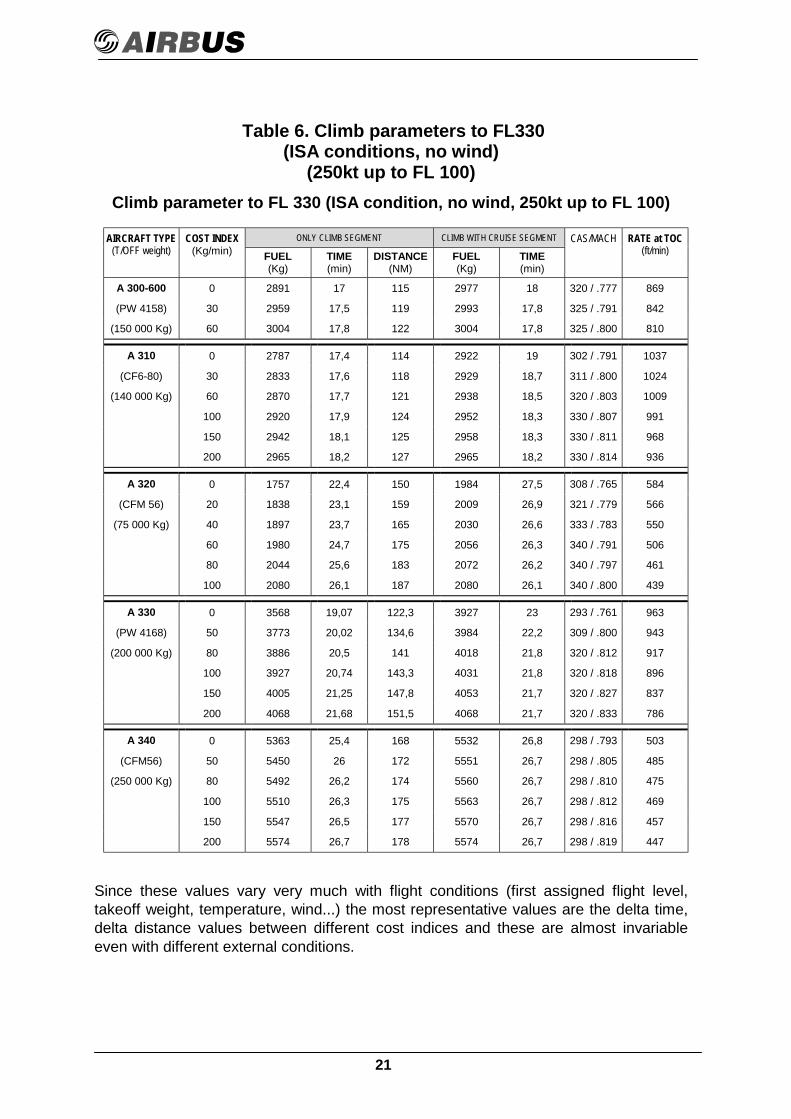
21
Table 6. Climb parameters to FL330(ISA conditions, no wind)
(250kt up to FL 100)Climb parameter to FL 330 (ISA condition, no wind, 250kt up to FL 100)
ONLY CLIMB SEGMENT CLIMB WITH CRUISE SEGMENTAIRCRAFT TYPE(T/OFF weight)
COST INDEX(Kg/min) FUEL
(Kg)TIME(min)
DISTANCE(NM)
FUEL(Kg)
TIME(min)
CAS/MACH RATE at TOC(ft/min)
A 300-600 0 2891 17 115 2977 18 320 / .777 869
(PW 4158) 30 2959 17,5 119 2993 17,8 325 / .791 842
(150 000 Kg) 60 3004 17,8 122 3004 17,8 325 / .800 810
A 310 0 2787 17,4 114 2922 19 302 / .791 1037
(CF6-80) 30 2833 17,6 118 2929 18,7 311 / .800 1024
(140 000 Kg) 60 2870 17,7 121 2938 18,5 320 / .803 1009
100 2920 17,9 124 2952 18,3 330 / .807 991
150 2942 18,1 125 2958 18,3 330 / .811 968
200 2965 18,2 127 2965 18,2 330 / .814 936
A 320 0 1757 22,4 150 1984 27,5 308 / .765 584
(CFM 56) 20 1838 23,1 159 2009 26,9 321 / .779 566
(75 000 Kg) 40 1897 23,7 165 2030 26,6 333 / .783 550
60 1980 24,7 175 2056 26,3 340 / .791 506
80 2044 25,6 183 2072 26,2 340 / .797 461
100 2080 26,1 187 2080 26,1 340 / .800 439
A 330 0 3568 19,07 122,3 3927 23 293 / .761 963
(PW 4168) 50 3773 20,02 134,6 3984 22,2 309 / .800 943
(200 000 Kg) 80 3886 20,5 141 4018 21,8 320 / .812 917
100 3927 20,74 143,3 4031 21,8 320 / .818 896
150 4005 21,25 147,8 4053 21,7 320 / .827 837
200 4068 21,68 151,5 4068 21,7 320 / .833 786
A 340 0 5363 25,4 168 5532 26,8 298 / .793 503
(CFM56) 50 5450 26 172 5551 26,7 298 / .805 485
(250 000 Kg) 80 5492 26,2 174 5560 26,7 298 / .810 475
100 5510 26,3 175 5563 26,7 298 / .812 469
150 5547 26,5 177 5570 26,7 298 / .816 457
200 5574 26,7 178 5574 26,7 298 / .819 447
Since these values vary very much with flight conditions (first assigned flight level,takeoff weight, temperature, wind...) the most representative values are the delta time,delta distance values between different cost indices and these are almost invariableeven with different external conditions.

22
Figure 12. Climb parameter to the same point in cruise(FL 330, ISA conditions, no wind, 250kt up to FL 100)

23

24
First of all, we note that time to climb is only slightly affected by the cost index (lessthan 1 minute) for the A300 and A310 (whatever the engine) between low and high costindices.
This time difference is higher, however, for the A330 and especially for the A320 (up to3 minutes) since both the range of climb CAS and climb Mach are rather larger forthese two aircraft.
However, to have a representative comparison of these different climb strategies, wehave to include the short cruise segments between the "low cost index TOC" and the"high cost index TOC" (see climb profile graph).
The following Table 7 provides parameters and differences in terms of time and fuel atthe same geographical point (corresponding to the furthest TOC) thereby summarizingthe array of possible climb laws between CI=0 and high cost indices.
Table 7. Climb to FL 330
Time (min) / Fuel (kg)at farther TOC
Difference betweenlow and high cost index
Cl = 0 High cost index Time gain Fuel increment
A300-600 18.0 2977 17.8 3004 10 s 30 kgA310 19.0 2922 18.2 2965 50 s 40 kgA320 27.5 1984 26.1 2080 1 min 30 s 100 kgA330 23.0 3927 21.7 4068 1 min 20 s 140 kgA340 26.8 5532 26.7 5574 10 s 40 kg
As a general conclusion, we can say that climbing at low cost index is only worthwhile iftime to climb is really essential (FL competition, ATC requirement...) since thedifference in terms of costs between low and high cost index climbs is very small.
25
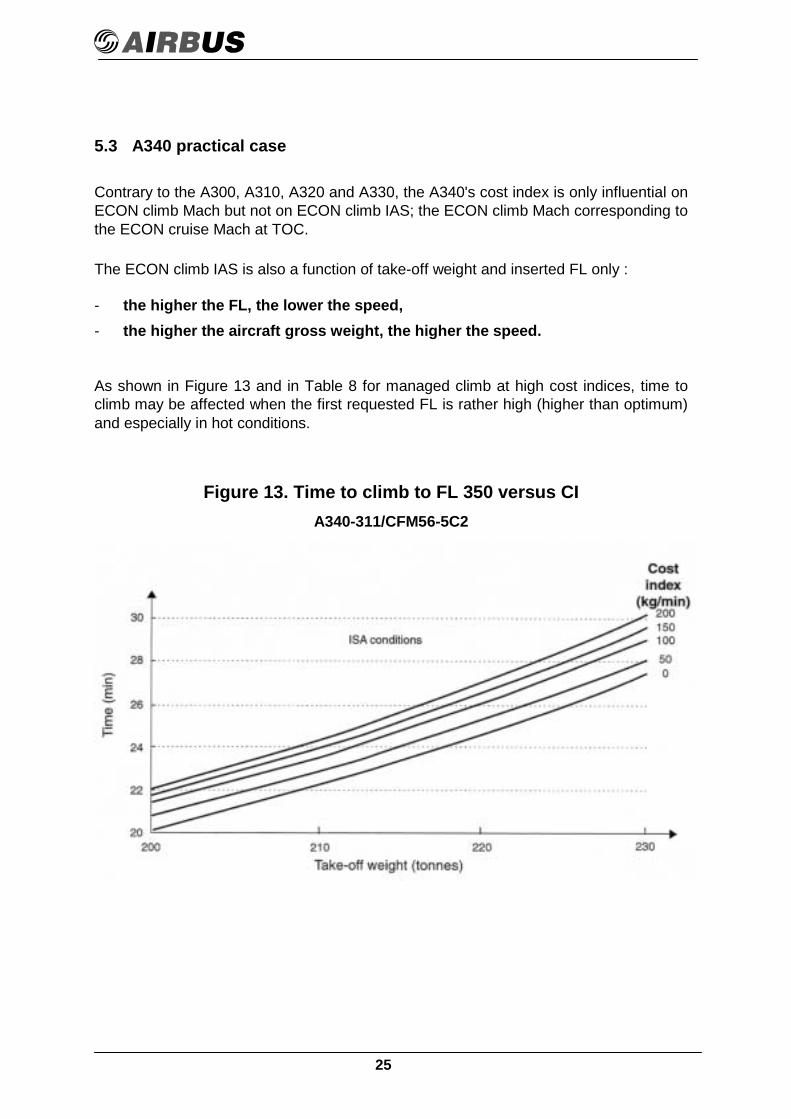
5.3 A340 practical case
Contrary to the A300, A310, A320 and A330, the A340's cost index is only influential onECON climb Mach but not on ECON climb IAS; the ECON climb Mach corresponding tothe ECON cruise Mach at TOC.
The ECON climb IAS is also a function of take-off weight and inserted FL only :
- the higher the FL, the lower the speed,- the higher the aircraft gross weight, the higher the speed.
As shown in Figure 13 and in Table 8 for managed climb at high cost indices, time toclimb may be affected when the first requested FL is rather high (higher than optimum)and especially in hot conditions.
Figure 13. Time to climb to FL 350 versus CIA340-311/CFM56-5C2

26
Table 8. Climb to FL 350 according to CI (Load 6)A340-311 /CFM56-5C2
TOW : 230 tonnesISA conditions
COSTINDEX
(kg/min)
TIME(min)
DISTANCE(nm)
FINALMACH(MN)
FUEL(kg)
FINALRATE at
TOC(ft/min)
0 27.4 181 0.783 5200 470
50 28 187 0.800 5300 460
80 28.6 192 0.808 5400 440
100 29 195 0.812 5450 430
150 29.5 200 0.818 5530 400
200 30 205 0.823 5620 360
- In order to be as close as possible to the minimum time to climb withoutcompromising distance to climb, nor reaching too low a Mach Number, IAS/MACHCLIMB schedules, corresponding to the best rate of climb, were defined asshown in the tables of Appendix 4.
The three tables shown in Appendix 4 for respectively the A340-311, -312, -211,and -212, for the A340-313 and A340-313E, indicate the preselected climb IAS tobe entered and the resulting Climb MACH, corresponding to the FMS outputdisplayed in small font on MCDU PERF CLIMB page.
- The preselected climb speed mode allows the introduction of a IAS only, the climbMach then being computed against this IAS. With these tables it is therefore possibleto choose the preselected IAS and ECON CLIMB MACH before these are to be partof FMGEC Load 7 when available later in 1997.
- The Tables of Appendix 4 are limited by the Max Altitude in ISA conditions.However, the speeds provided are available for any temperature. In ISA deviationconditions, Cruise Altitude has to be limited by the FMGS predicted Max Altitude.
- In order to perform strict minimum distance to climb, green dot should beselected or an altitude constraint should be inserted on a waypoint in the FMS.
27
6. OPTIMUM ALTITUDE FOLLOW-UP
6.1 Trade-off between manoeuvrability and economy
In general, numerous parameters such as weather conditions or ATC requirementscould influence any decision made by the crew, with regard to three fundamentalpriorities :
- manoeuvrability- comfort- money saving economy
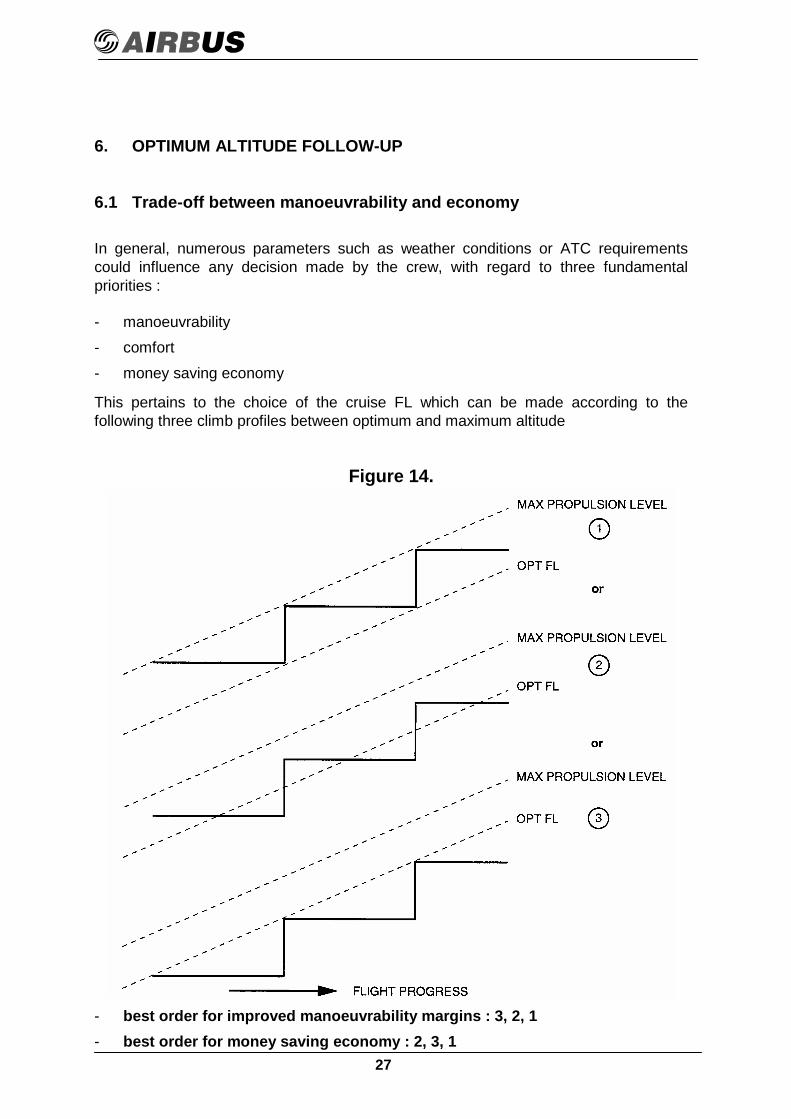
This pertains to the choice of the cruise FL which can be made according to thefollowing three climb profiles between optimum and maximum altitude
Figure 14.
- best order for improved manoeuvrability margins : 3, 2, 1- best order for money saving economy : 2, 3, 1
28
Contrary to some opinions, solution " is neither worthwhile for comfort nor foreconomy. Other considerations could lead to a higher FL being chosen formeteorological or operational reasons but, in any case, flying above optimum altitudecommands particular attention.
On all Airbus FMS-equipped aircraft, OPT FL (taking into consideration aircraft grossweight, cost index (i.e speed), wind...) and MAX FL are displayed in the MCDUprogress page. The recommended MAX FL in the FMGC ensures a 0.3 g buffet margin,a minimum rate of climb of 300 ft/min at MAX CLIMB thrust as well as level flight atMAX CRZ thrust. The 1.3 g maximum altitude is always above maximum propulsionaltitude.
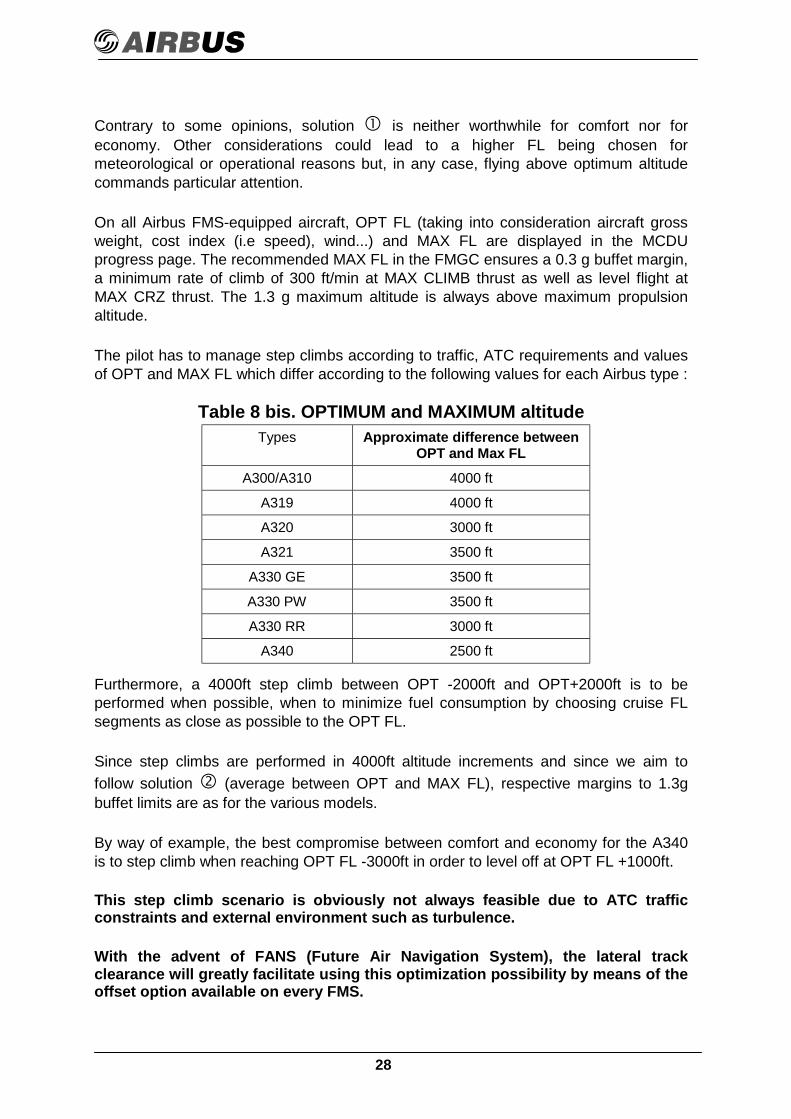
The pilot has to manage step climbs according to traffic, ATC requirements and valuesof OPT and MAX FL which differ according to the following values for each Airbus type :
Table 8 bis. OPTIMUM and MAXIMUM altitudeTypes Approximate difference between
OPT and Max FLA300/A310 4000 ft
A319 4000 ft
A320 3000 ft
A321 3500 ft
A330 GE 3500 ft
A330 PW 3500 ft
A330 RR 3000 ft
A340 2500 ft
Furthermore, a 4000ft step climb between OPT -2000ft and OPT+2000ft is to beperformed when possible, when to minimize fuel consumption by choosing cruise FLsegments as close as possible to the OPT FL.
Since step climbs are performed in 4000ft altitude increments and since we aim tofollow solution # (average between OPT and MAX FL), respective margins to 1.3gbuffet limits are as for the various models.
By way of example, the best compromise between comfort and economy for the A340is to step climb when reaching OPT FL -3000ft in order to level off at OPT FL +1000ft.
This step climb scenario is obviously not always feasible due to ATC trafficconstraints and external environment such as turbulence.
With the advent of FANS (Future Air Navigation System), the lateral trackclearance will greatly facilitate using this optimization possibility by means of theoffset option available on every FMS.
29
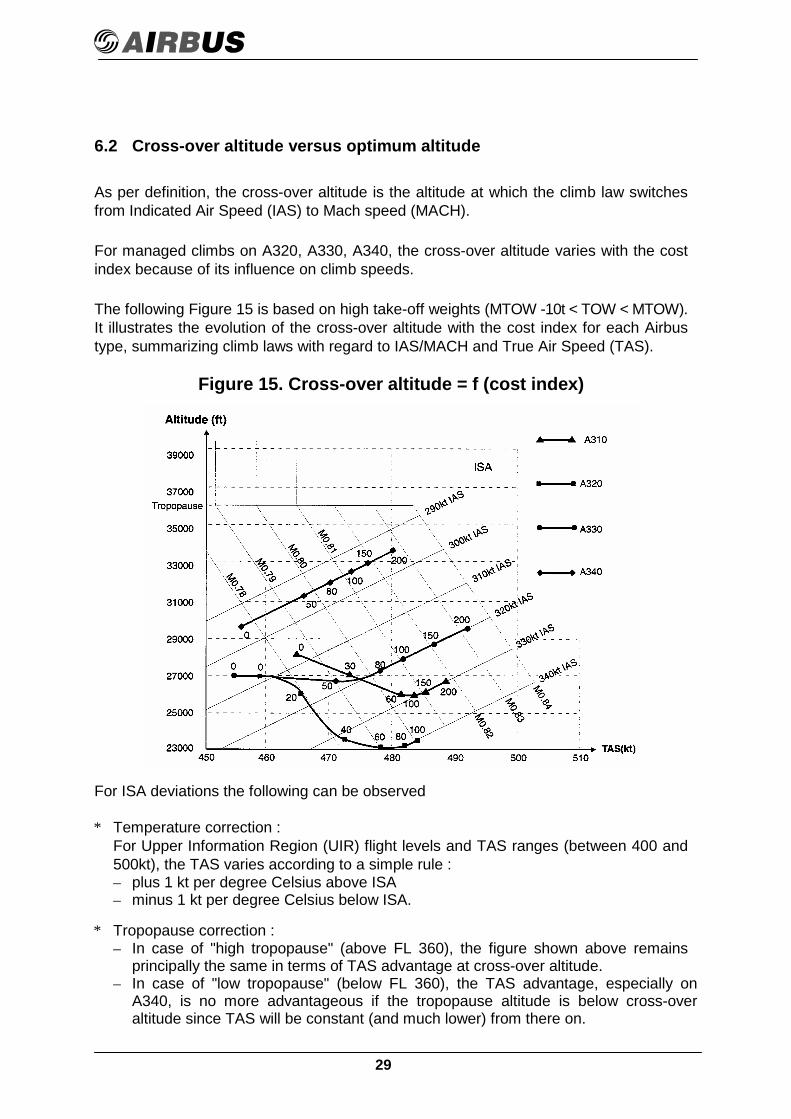
6.2 Cross-over altitude versus optimum altitude
As per definition, the cross-over altitude is the altitude at which the climb law switchesfrom Indicated Air Speed (IAS) to Mach speed (MACH).
For managed climbs on A320, A330, A340, the cross-over altitude varies with the costindex because of its influence on climb speeds.
The following Figure 15 is based on high take-off weights (MTOW -10t < TOW < MTOW).It illustrates the evolution of the cross-over altitude with the cost index for each Airbustype, summarizing climb laws with regard to IAS/MACH and True Air Speed (TAS).
Figure 15. Cross-over altitude = f (cost index)
For ISA deviations the following can be observed
* Temperature correction :For Upper Information Region (UIR) flight levels and TAS ranges (between 400 and500kt), the TAS varies according to a simple rule :– plus 1 kt per degree Celsius above ISA– minus 1 kt per degree Celsius below ISA.
* Tropopause correction :– In case of "high tropopause" (above FL 360), the figure shown above remains
principally the same in terms of TAS advantage at cross-over altitude.– In case of "low tropopause" (below FL 360), the TAS advantage, especially on
A340, is no more advantageous if the tropopause altitude is below cross-overaltitude since TAS will be constant (and much lower) from there on.
30
As per definition the Optimum Mach Number is a MN which remains greater than MRCand lower than LRC over the entire range of a typical cruise operation in terms of grossweight and altitude. The Optimum FL, for this Optimum MN, is the flight level whichprovides the greatest specific range (nm/kg) at a given gross weight. The Optimum FLincreases with decreasing gross weight, as illustrated in the FCOM.
By design choice, and contrary to the rest of the Airbus fleet, the cost index has noinfluence on the climb IAS for the A340.
We also notice that, at cross-over altitudes, all aircraft demonstrate the best TAS sincethereafter TAS decreases (up to the tropopause and is constant from there on) andsince climb speed then becomes ECON MACH.
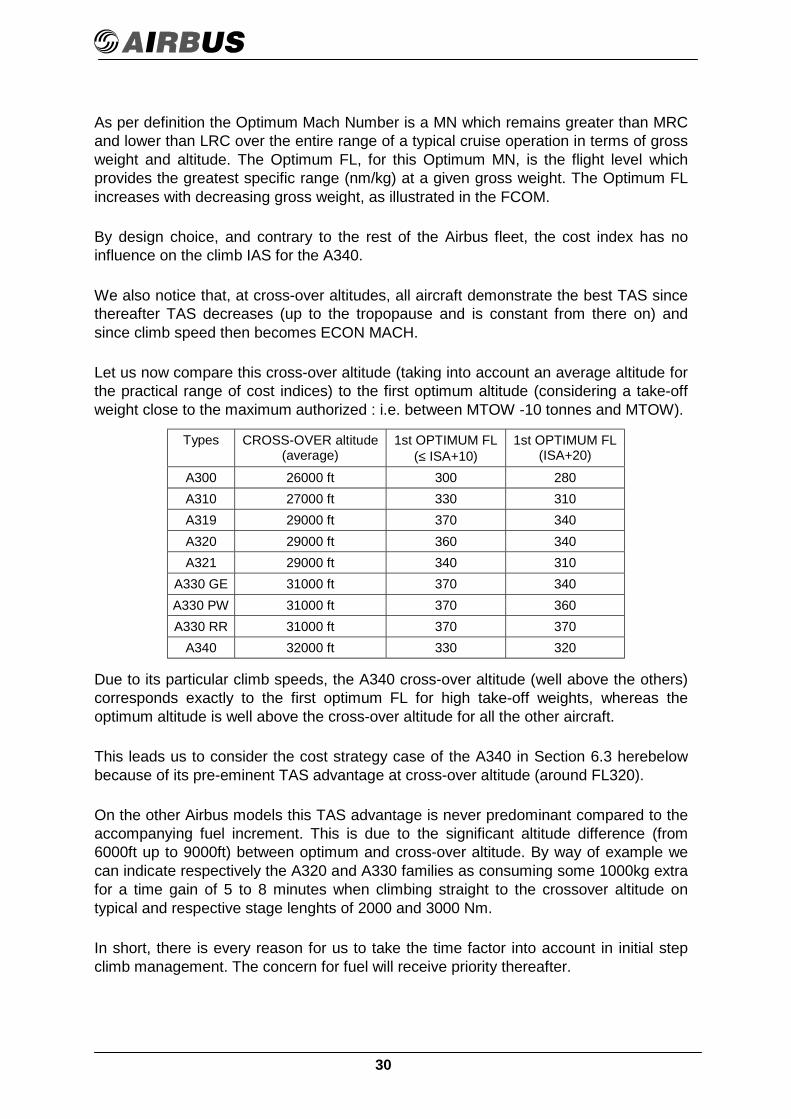
Let us now compare this cross-over altitude (taking into account an average altitude forthe practical range of cost indices) to the first optimum altitude (considering a take-offweight close to the maximum authorized : i.e. between MTOW -10 tonnes and MTOW).
Types CROSS-OVER altitude(average)
1st OPTIMUM FL(≤ ISA+10)
1st OPTIMUM FL(ISA+20)
A300 26000 ft 300 280A310 27000 ft 330 310A319 29000 ft 370 340A320 29000 ft 360 340A321 29000 ft 340 310
A330 GE 31000 ft 370 340A330 PW 31000 ft 370 360A330 RR 31000 ft 370 370
A340 32000 ft 330 320
Due to its particular climb speeds, the A340 cross-over altitude (well above the others)corresponds exactly to the first optimum FL for high take-off weights, whereas theoptimum altitude is well above the cross-over altitude for all the other aircraft.
This leads us to consider the cost strategy case of the A340 in Section 6.3 herebelowbecause of its pre-eminent TAS advantage at cross-over altitude (around FL320).
On the other Airbus models this TAS advantage is never predominant compared to theaccompanying fuel increment. This is due to the significant altitude difference (from6000ft up to 9000ft) between optimum and cross-over altitude. By way of example wecan indicate respectively the A320 and A330 families as consuming some 1000kg extrafor a time gain of 5 to 8 minutes when climbing straight to the crossover altitude ontypical and respective stage lenghts of 2000 and 3000 Nm.
In short, there is every reason for us to take the time factor into account in initial stepclimb management. The concern for fuel will receive priority thereafter.
31
To summarize this we can say that :
- On models other than the A340, the OPT altitude being higher than the cross-overaltitude, the emphasis must immediately be placed on fuel economy (i.e, followingscenario # from the outset even for the very first cruise flight level).
- On the A340 models the OPT altitude being the same as the cross-over altitude, theemphasis should rather be placed on time economy as no real advantage can begained from fuel economy until further into the flight.
6.3 Best cost strategy : A340 application
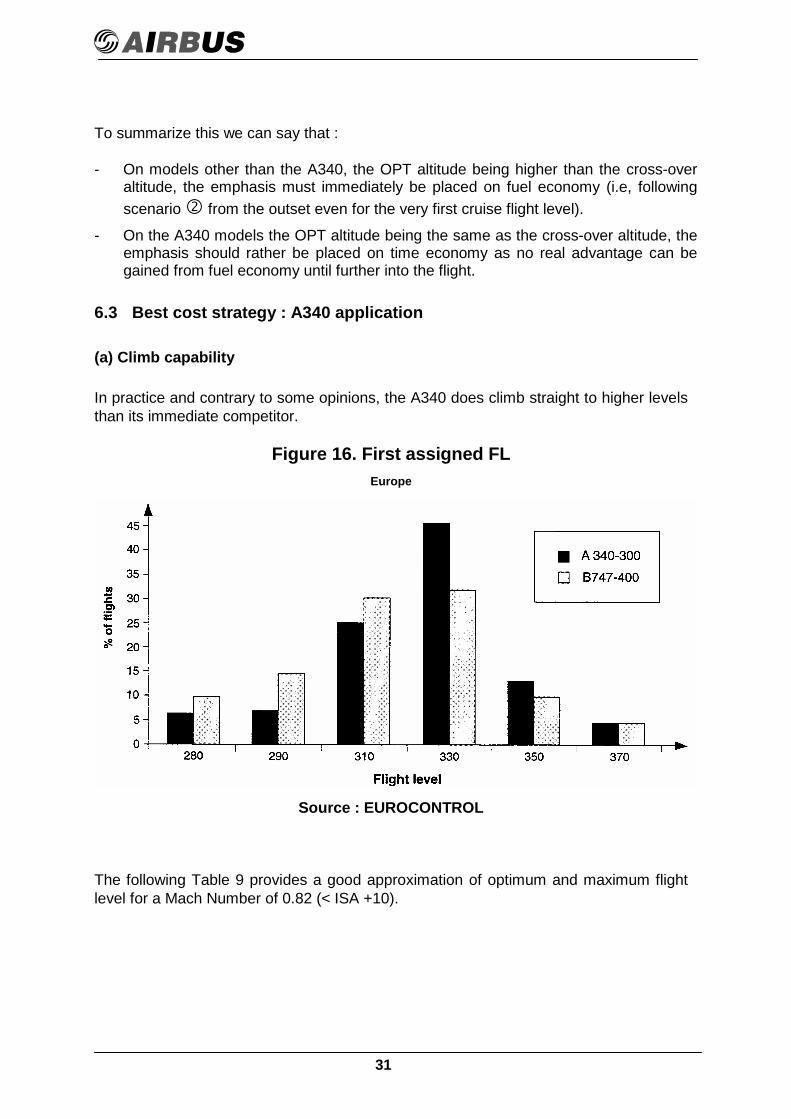
(a) Climb capability
In practice and contrary to some opinions, the A340 does climb straight to higher levelsthan its immediate competitor.
Figure 16. First assigned FLEurope
Source : EUROCONTROL
The following Table 9 provides a good approximation of optimum and maximum flightlevel for a Mach Number of 0.82 (< ISA +10).
32
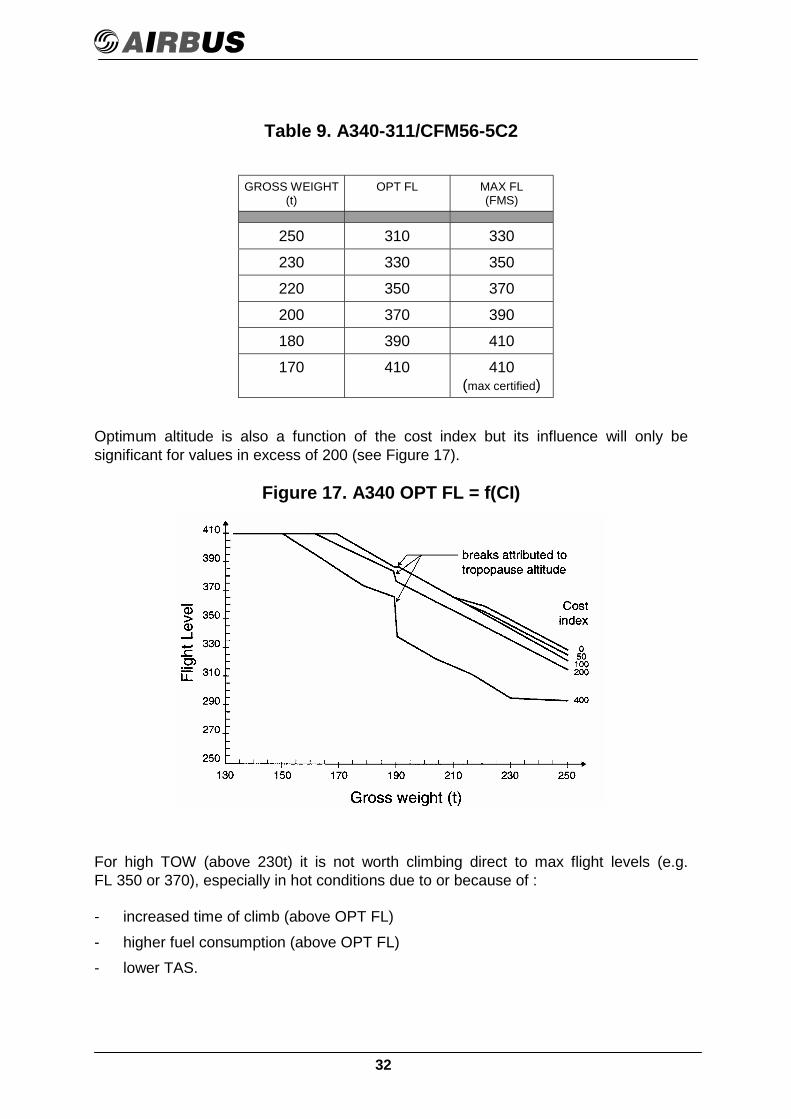
Table 9. A340-311/CFM56-5C2
GROSS WEIGHT(t)
OPT FL MAX FL(FMS)
250 310 330
230 330 350
220 350 370
200 370 390
180 390 410
170 410 410(max certified)
Optimum altitude is also a function of the cost index but its influence will only besignificant for values in excess of 200 (see Figure 17).
Figure 17. A340 OPT FL = f(CI)
For high TOW (above 230t) it is not worth climbing direct to max flight levels (e.g.FL 350 or 370), especially in hot conditions due to or because of :
- increased time of climb (above OPT FL)- higher fuel consumption (above OPT FL)- lower TAS.
33
If we consider still air or constant wind conditions, whatever the level, fuel consumptionincreases approximately as shown in Table 10.
Table 10. A340-311/CFM56-5C2
FLIGHT LEVEL FUEL INCREMENT
OPT + 2000ft + 1.5 %
OPT FL -
OPT - 2000ft + 1.5 %
OPT - 4000ft + 3 %
(b) Cost factor in the choice of optimum altitude
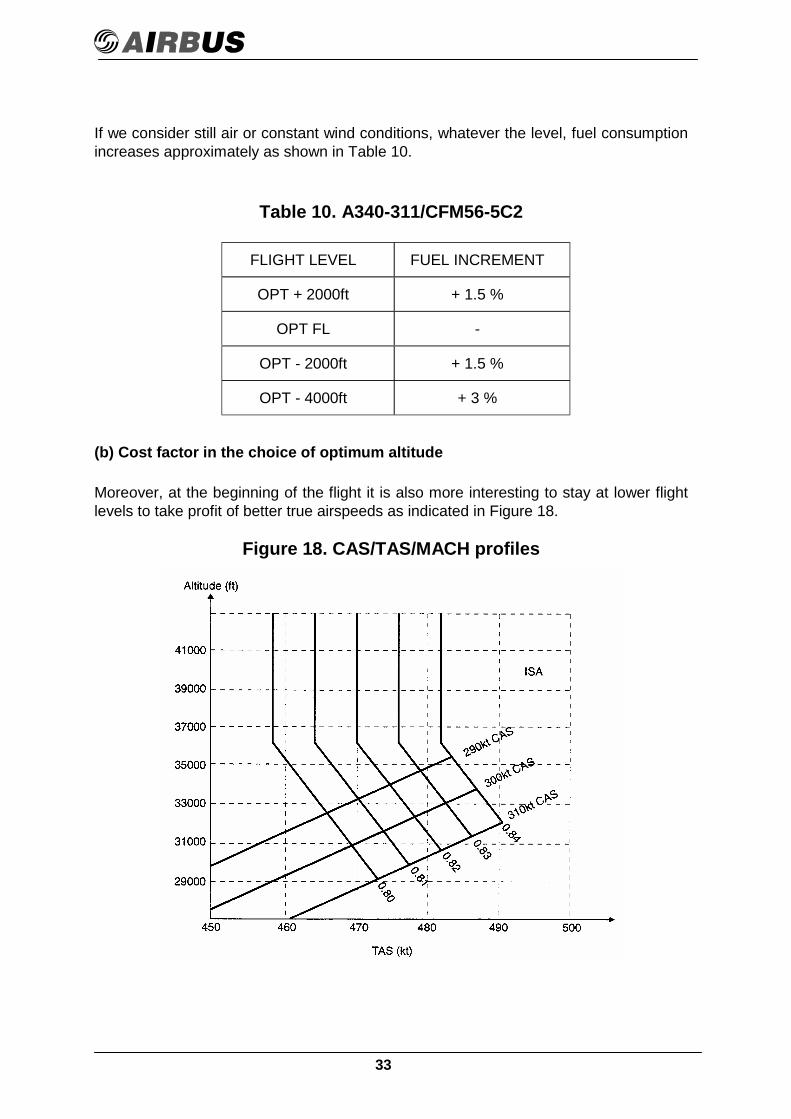
Moreover, at the beginning of the flight it is also more interesting to stay at lower flightlevels to take profit of better true airspeeds as indicated in Figure 18.
Figure 18. CAS/TAS/MACH profiles
34
This can amount to some 10 to 15kt (or approximately 2 minutes per hour) dependingon Climb Mach Number and Climb CAS. This assumes that there is no FL competitionor no subsequent risk of being restricted to the first assigned flight level.
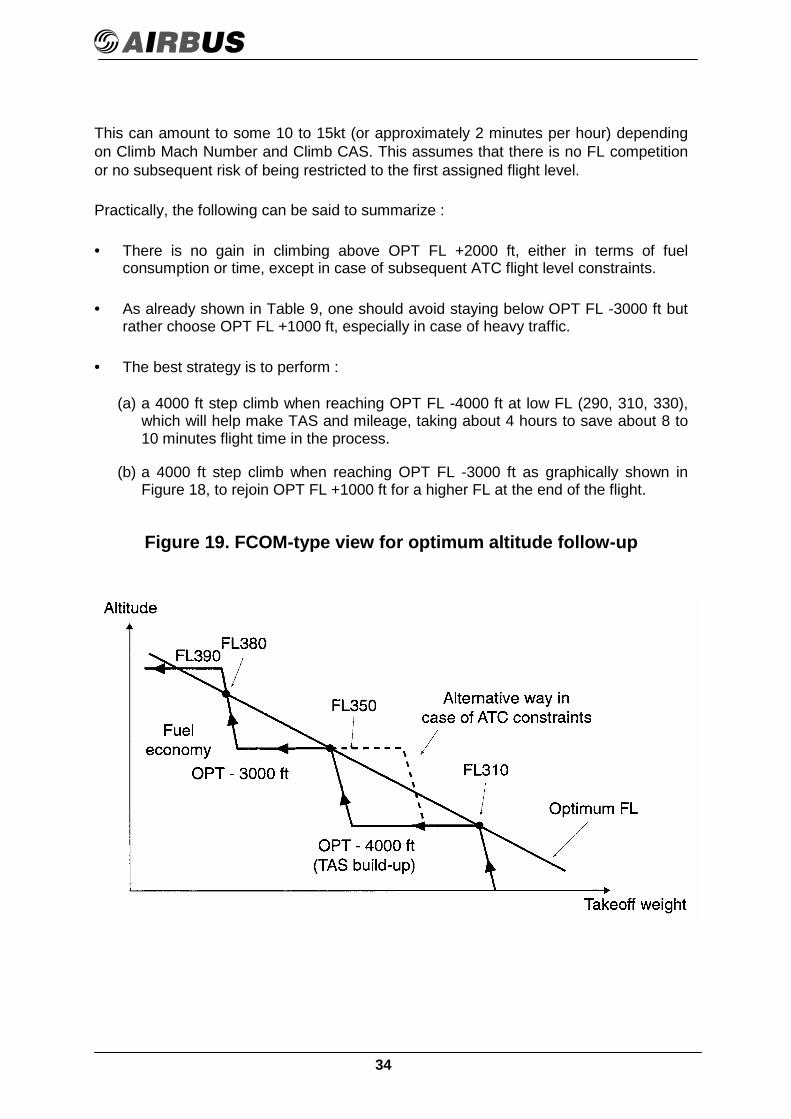
Practically, the following can be said to summarize :
• There is no gain in climbing above OPT FL +2000 ft, either in terms of fuelconsumption or time, except in case of subsequent ATC flight level constraints.
• As already shown in Table 9, one should avoid staying below OPT FL -3000 ft butrather choose OPT FL +1000 ft, especially in case of heavy traffic.
• The best strategy is to perform :
(a) a 4000 ft step climb when reaching OPT FL -4000 ft at low FL (290, 310, 330),which will help make TAS and mileage, taking about 4 hours to save about 8 to10 minutes flight time in the process.
(b) a 4000 ft step climb when reaching OPT FL -3000 ft as graphically shown inFigure 18, to rejoin OPT FL +1000 ft for a higher FL at the end of the flight.
Figure 19. FCOM-type view for optimum altitude follow-up

35
To give a practical example of the impact of step climbing, we compare below the twoflight profiles depicted in Figure 20 with time/fuel calculations shown in Tables 11and 12.
Figure 20. Comparison of flight profiles
Table 11. Close to optimal FL profile
TOW(t)
Timeat FL 310
Time gainat FL 310
(min)
Fuel incrementat FL 310
(kg)
230 1 h 30 - 4 + 300240 2 h 45 - 7 + 500250 4 h 00 - 10 + 700

36
Table 12. Maximum FL profile
TOW(t)
Timeat FL 310
Time gainat FL 310
(min)
Fuel incrementat FL 310
(kg)
230 3 h 00 - 6 + 800240 5 h 30 - 11 + 1400250 8 h 00 - 18 + 2000
• Saving 7 minutes but spending 500kg to stay 2 h 45 at FL 310 after taking off at240t results in :
– saving 7 x 20 $/min (average CT) = 140$
– spending 500kg x 0.24$/kg (average CF) = 120$
$ a benefit in time and money, however small.
• Saving 11 minutes but spending 1400kg to stay 5 h 30 at FL 310 after taking off at240t results in :
– saving 11 x 20$/min = 220$
– spending 1400kg x 0.24$/kg = 336$
$ a cost.

37
To sum up, spending too much time below optimum altitude results in a fuel used/timesaved ratio not profitable in terms of costs, but spending the right time (see Table 11)below optimum altitude results in a fuel used/time saved ratio profitable in terms of bothtime and costs.
If applied for "raw operational judgement" the cost index can be instrumental infacilitating cost-beneficial fuel-time evaluations. This should come as no surprise for aconcept that balances time and fuel-related costs.
• Returning to the above example for cases below 230t (240t for models fitted withCFM56-5C4 engine) there is, however, no gain in staying at lower flight levels(FL 310 or 330) because time savings are not worthwhile compared to the fuelincrement.
The best strategy is therefore to climb initially to FL 350 or FL 370 (whether it is awestbound or eastbound flight) to avoid congested flight levels (FL 310 andespecially FL 330 when referring to paragraph 6.3.a and figure 16).
38
7. COST INDEX AND CRUISE MANAGEMENT
The FMS manages cruise speed according to the aircraft gross weight, flight level, windand of course the cost index. In this chapter we will review the influence of these fourparameters on the ECON speed including differences between "selected" and"managed" cruise mode with a view towards adapting the flight towards externalconditions.
7.1 Cost index - cruise speed relationship
In general, we can say that, at a given cost index :
- the higher the flight level, the higher the ECON Mach,- the higher the aircraft gross weight, the higher the ECON Mach.
The following graphs (ECON Mach=f(CI)) as adapted to each Airbus model willillustrate this point best.
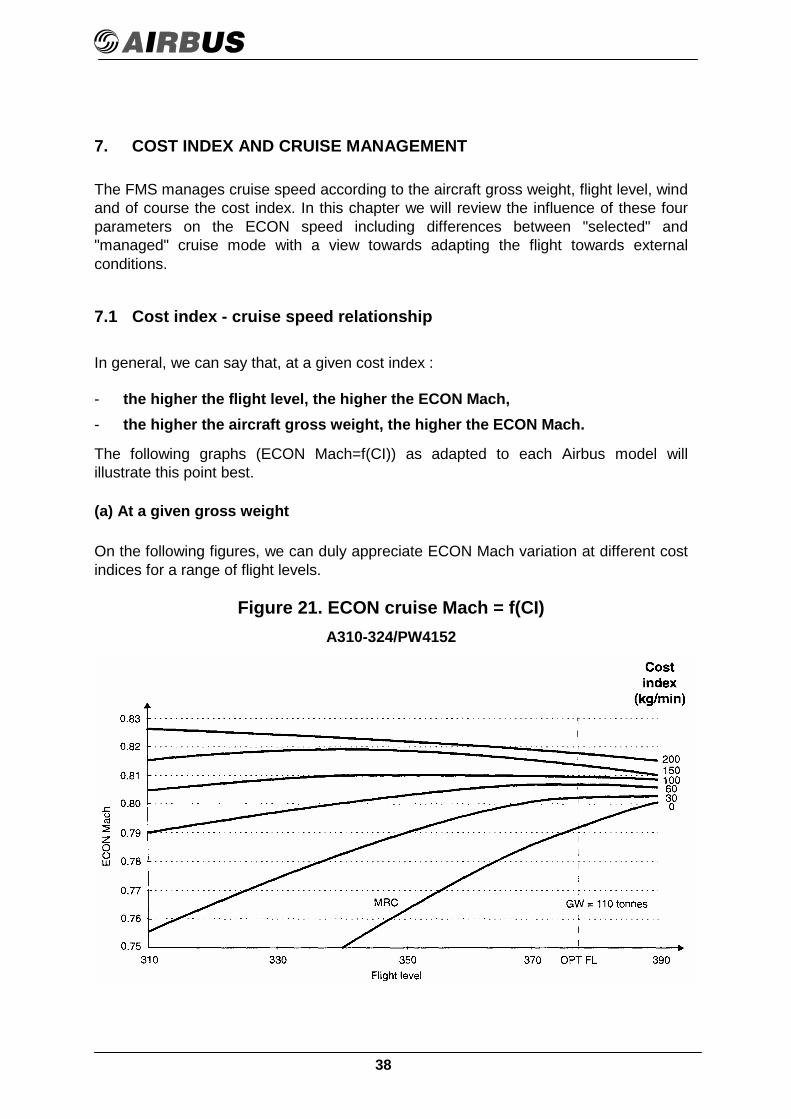
(a) At a given gross weight
On the following figures, we can duly appreciate ECON Mach variation at different costindices for a range of flight levels.
Figure 21. ECON cruise Mach = f(CI)A310-324/PW4152

39
Figure 22. ECON cruise Mach = f(CI)A320/V2500
Figure 23. ECON cruise Mach = f(CI)A330-322/PW4158
40
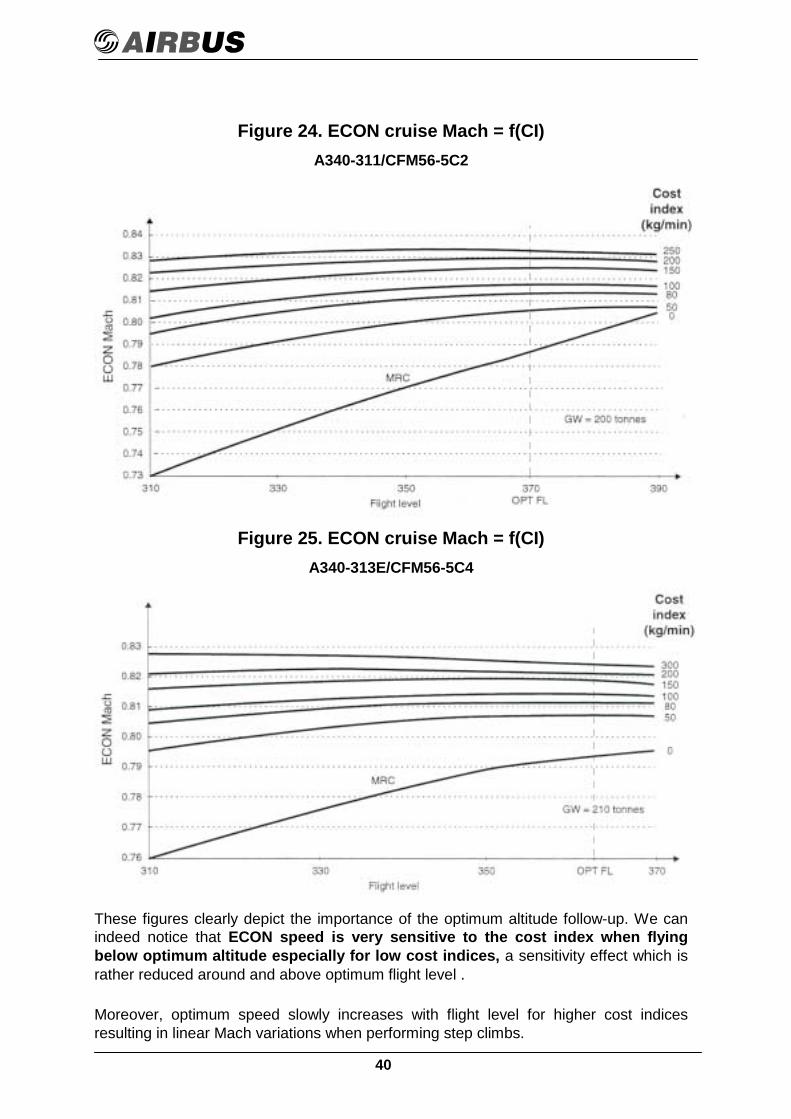
Figure 24. ECON cruise Mach = f(CI)A340-311/CFM56-5C2
Figure 25. ECON cruise Mach = f(CI)A340-313E/CFM56-5C4
These figures clearly depict the importance of the optimum altitude follow-up. We canindeed notice that ECON speed is very sensitive to the cost index when flyingbelow optimum altitude especially for low cost indices, a sensitivity effect which israther reduced around and above optimum flight level .
Moreover, optimum speed slowly increases with flight level for higher cost indicesresulting in linear Mach variations when performing step climbs.
41
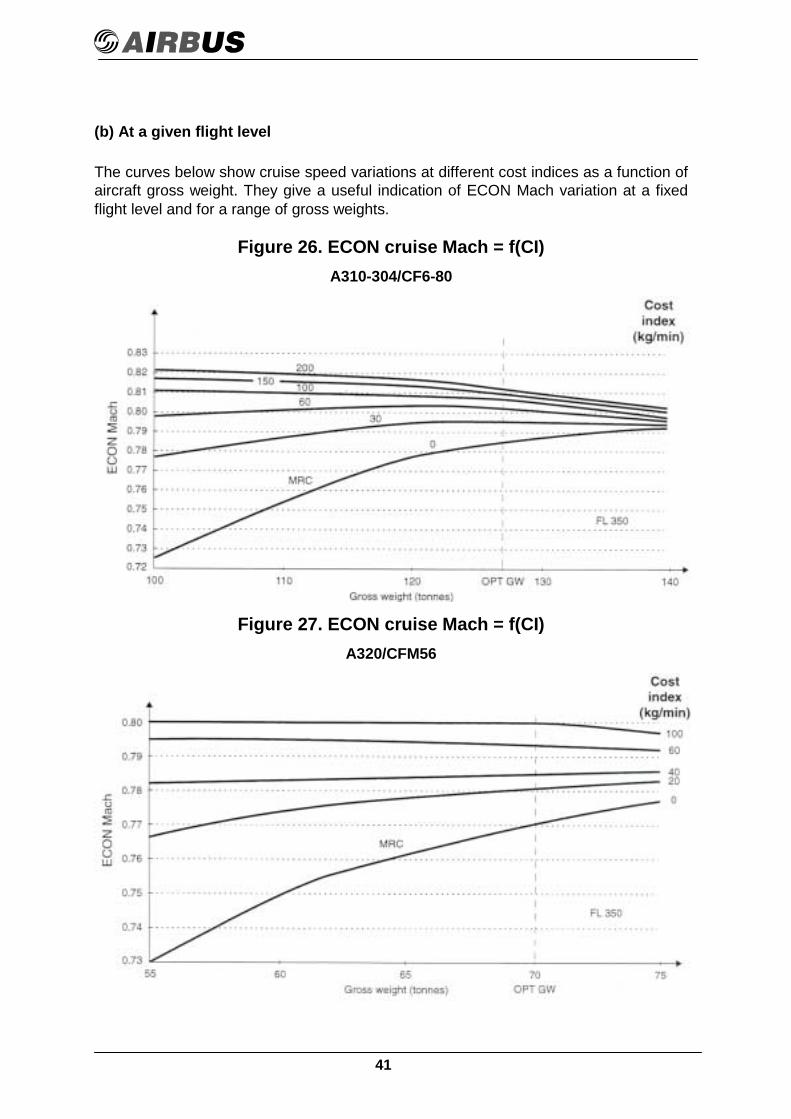
(b) At a given flight level
The curves below show cruise speed variations at different cost indices as a function ofaircraft gross weight. They give a useful indication of ECON Mach variation at a fixedflight level and for a range of gross weights.
Figure 26. ECON cruise Mach = f(CI)A310-304/CF6-80
Figure 27. ECON cruise Mach = f(CI)A320/CFM56
42
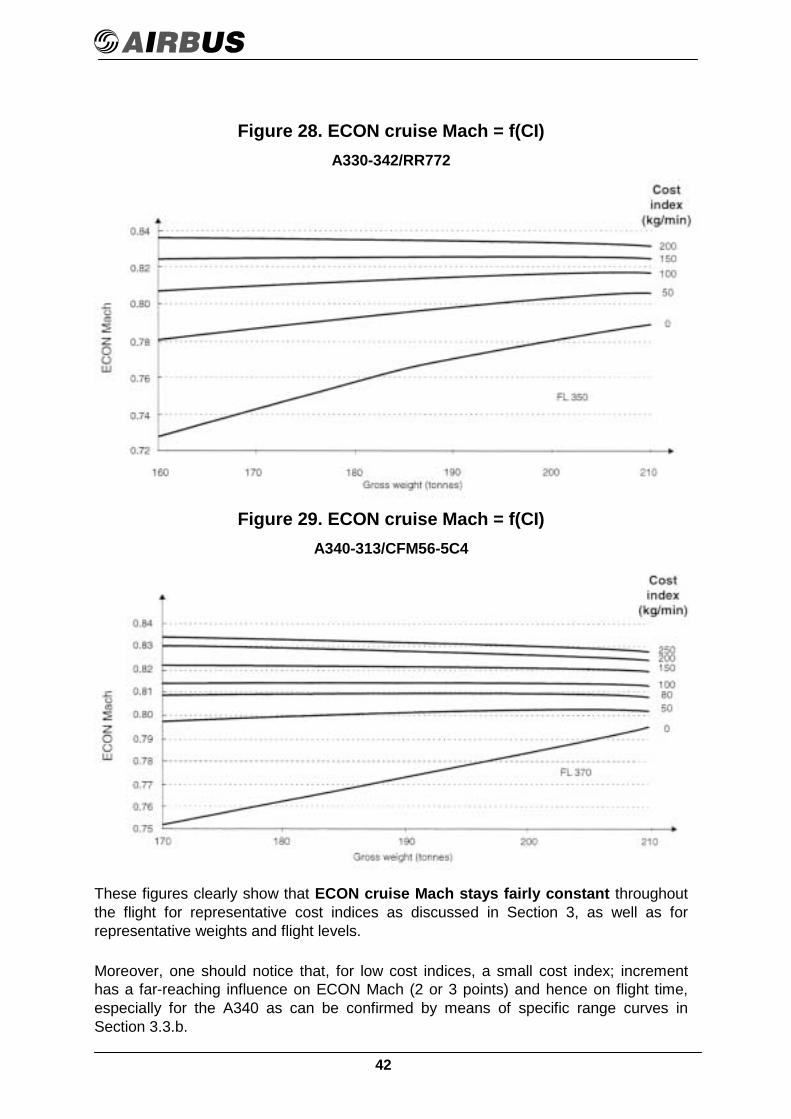
Figure 28. ECON cruise Mach = f(CI)A330-342/RR772
Figure 29. ECON cruise Mach = f(CI)A340-313/CFM56-5C4
These figures clearly show that ECON cruise Mach stays fairly constant throughoutthe flight for representative cost indices as discussed in Section 3, as well as forrepresentative weights and flight levels.
Moreover, one should notice that, for low cost indices, a small cost index; incrementhas a far-reaching influence on ECON Mach (2 or 3 points) and hence on flight time,especially for the A340 as can be confirmed by means of specific range curves inSection 3.3.b.

43
7.2 Cost Index - fuel consumption relationship
The following figure illustrates the block fuel increment for a range of practical costindex values for each Airbus model. Increment levels are approximate and it isconsidered that engine type has no influence on the ∆ trip fuel.
Figure 30. ∆∆∆∆ Trip fuel = f(CI) compared to CI = 0
To summarize, we can say that there is no advantage whatsoever gained by flying atlow cost indices (i.e below LRC cost indices) since fuel gains are not at all meaningfulwhen traded far time, especially for the A340.
This finding will be more precisely highlighted in section 10.2.b with ∆ time/∆ fuel tablesfacilitating trade-off appreciations.
7.3 Cruise "managed" versus cruise "selected"
(a) Flying at a given cost index rather than at a given Mach Number provides theadded advantage of always benefiting from the optimum Mach Number as afunction of aircraft gross weight, flight level and head/tailwind component.
44
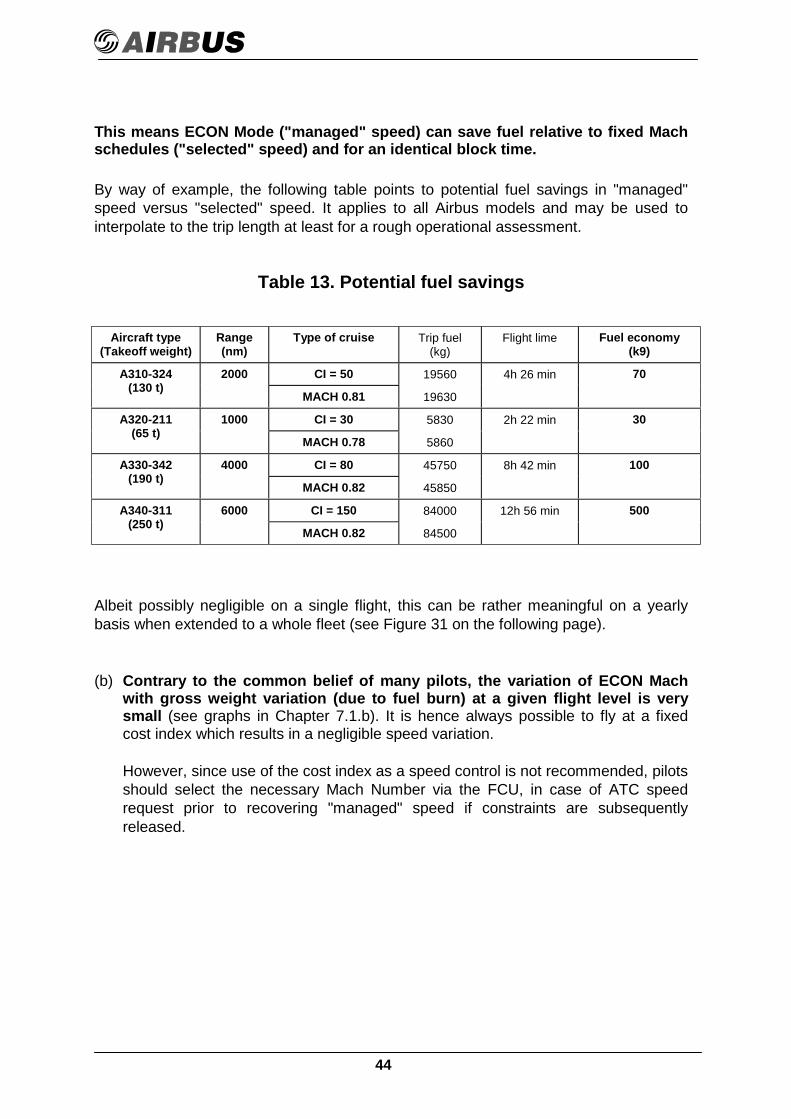
This means ECON Mode ("managed" speed) can save fuel relative to fixed Machschedules ("selected" speed) and for an identical block time.
By way of example, the following table points to potential fuel savings in "managed"speed versus "selected" speed. It applies to all Airbus models and may be used tointerpolate to the trip length at least for a rough operational assessment.
Table 13. Potential fuel savings
Aircraft type(Takeoff weight)
Range(nm)
Type of cruise Trip fuel(kg)
Flight lime Fuel economy(k9)
2000 CI = 50 19560 4h 26 min 70A310-324(130 t)
MACH 0.81 19630
1000 CI = 30 5830 2h 22 min 30A320-211(65 t)
MACH 0.78 5860
4000 CI = 80 45750 8h 42 min 100A330-342(190 t)
MACH 0.82 45850
6000 CI = 150 84000 12h 56 min 500A340-311(250 t)
MACH 0.82 84500
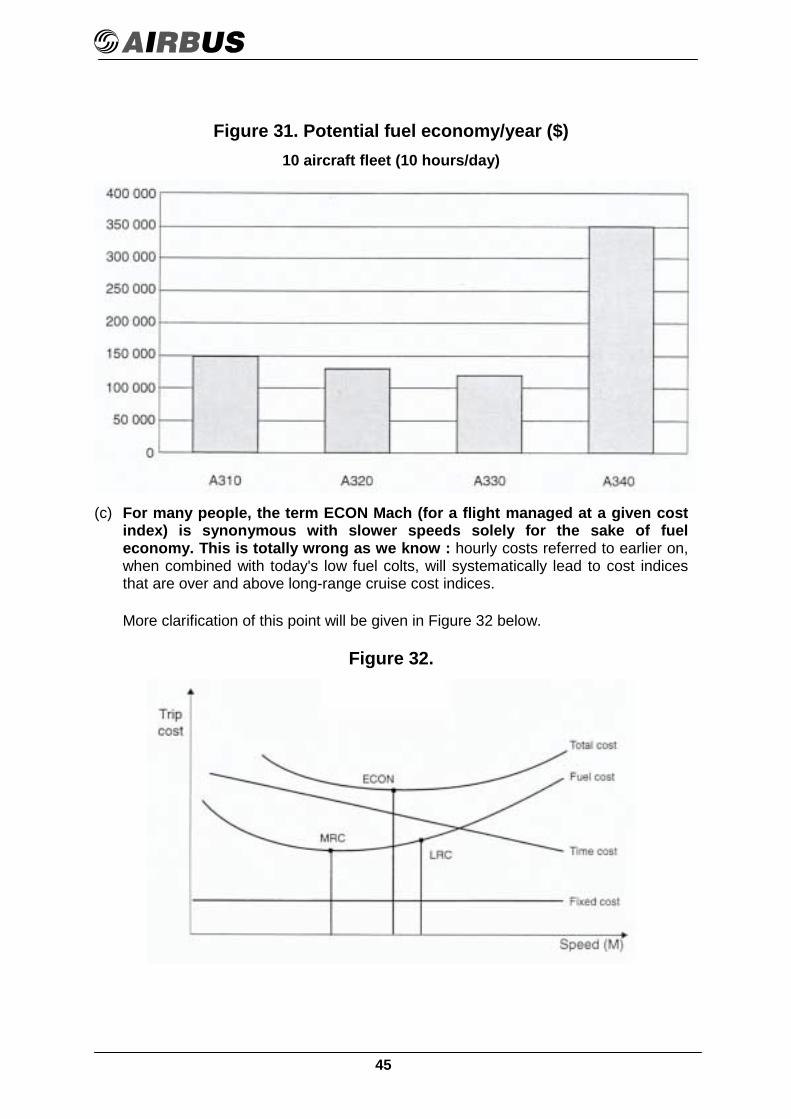
Albeit possibly negligible on a single flight, this can be rather meaningful on a yearlybasis when extended to a whole fleet (see Figure 31 on the following page).
(b) Contrary to the common belief of many pilots, the variation of ECON Machwith gross weight variation (due to fuel burn) at a given flight level is verysmall (see graphs in Chapter 7.1.b). It is hence always possible to fly at a fixedcost index which results in a negligible speed variation.
However, since use of the cost index as a speed control is not recommended, pilotsshould select the necessary Mach Number via the FCU, in case of ATC speedrequest prior to recovering "managed" speed if constraints are subsequentlyreleased.
45
Figure 31. Potential fuel economy/year ($)10 aircraft fleet (10 hours/day)
(c) For many people, the term ECON Mach (for a flight managed at a given costindex) is synonymous with slower speeds solely for the sake of fueleconomy. This is totally wrong as we know : hourly costs referred to earlier on,when combined with today's low fuel colts, will systematically lead to cost indicesthat are over and above long-range cruise cost indices.
More clarification of this point will be given in Figure 32 below.
Figure 32.

46
7.4 Airbus family Long-Range Cruise (LRC) cost indices
LRC speeds (that give a specific range equating to 99% of Maximum Range Cruise(MRC)) being a function of aircraft gross weight and flight level, the corresponding costindex is also variable as shown in Figure 33.
Figure 33. LRC speeds as a function of aircraft GW and FL
However, assuming that the aircraft should always be flying at about its optimum flightlevel (between OPT FL -2000ft and OPT FL +2000ft), calculations confirmed that thecost index values in the following table should systematically return a Mach Numberclose to long-range cruise Mach and for each aircraft type.
As a summary, it can be recalled that the Optimum Mach Number is a MN whichremains greater than MRC and lower than LRC over the entire range of a typical cruiseoperation in terms of gross weight and altitude. The Optimum Flight Level for thisOptimum MN is the FL which provides the greatest specific range at given grossweight. The optimum FL increases with decreasing gross weights, as illustrated in theFCOM.
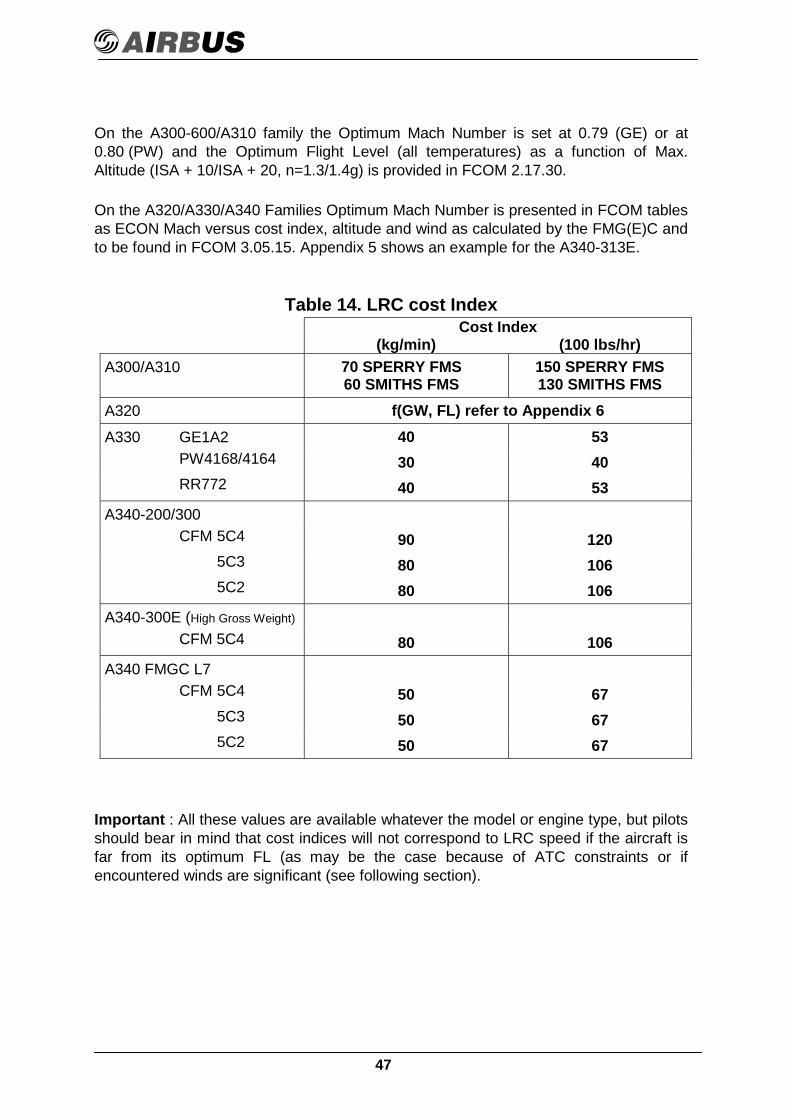
47
On the A300-600/A310 family the Optimum Mach Number is set at 0.79 (GE) or at0.80 (PW) and the Optimum Flight Level (all temperatures) as a function of Max.Altitude (ISA + 10/ISA + 20, n=1.3/1.4g) is provided in FCOM 2.17.30.
On the A320/A330/A340 Families Optimum Mach Number is presented in FCOM tablesas ECON Mach versus cost index, altitude and wind as calculated by the FMG(E)C andto be found in FCOM 3.05.15. Appendix 5 shows an example for the A340-313E.
Table 14. LRC cost IndexCost Index
(kg/min) (100 lbs/hr)A300/A310 70 SPERRY FMS
60 SMITHS FMS150 SPERRY FMS130 SMITHS FMS
A320 f(GW, FL) refer to Appendix 6A330 GE1A2 40 53
PW4168/4164 30 40RR772 40 53
A340-200/300CFM 5C4 90 120
5C3 80 1065C2 80 106
A340-300E (High Gross Weight)
CFM 5C4 80 106A340 FMGC L7
CFM 5C4 50 675C3 50 675C2 50 67
Important : All these values are available whatever the model or engine type, but pilotsshould bear in mind that cost indices will not correspond to LRC speed if the aircraft isfar from its optimum FL (as may be the case because of ATC constraints or ifencountered winds are significant (see following section).
48
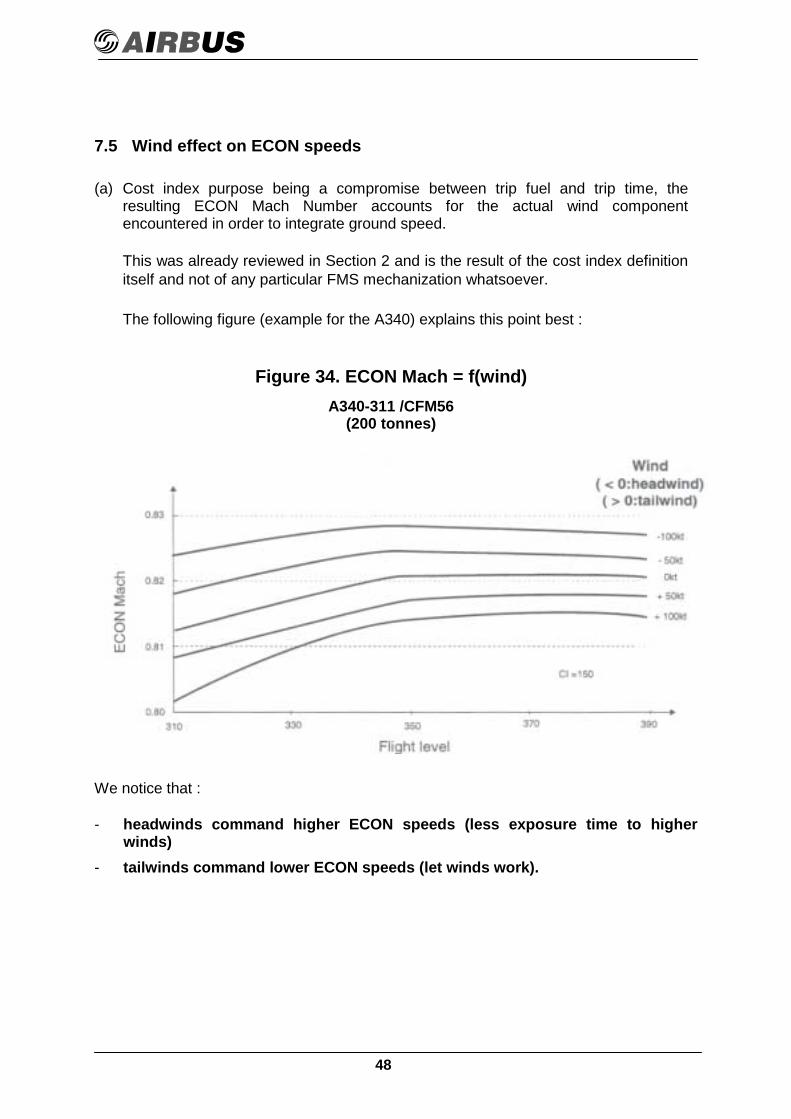
7.5 Wind effect on ECON speeds
(a) Cost index purpose being a compromise between trip fuel and trip time, theresulting ECON Mach Number accounts for the actual wind componentencountered in order to integrate ground speed.
This was already reviewed in Section 2 and is the result of the cost index definitionitself and not of any particular FMS mechanization whatsoever.
The following figure (example for the A340) explains this point best :
Figure 34. ECON Mach = f(wind)A340-311 /CFM56
(200 tonnes)
We notice that :
- headwinds command higher ECON speeds (less exposure time to higherwinds)
- tailwinds command lower ECON speeds (let winds work).

49
Indeed, in the case of headwind, the fuel increment (due to higher speeds) iscompensated for by the reduced trip time in terms of cost and vice versa (see nextsection).
Moreover, the following rule results from the preceding graph :
The ECON Mach wind correction being referred to herebelow is (for all Airbusmodels) of the order of :
+1/2 point of Mach per 50kt headwind-1/2 point of Mach per 50kt tailwind.
Important : in case of "managed" cruise, pilots should pay particular attention to theMach Number in case of strong headwinds, especially with high inserted cost indices,since this could lead to significant cruise speeds.
Whatever the aircraft model and external conditions, the ECON Mach is always limitedby MMO-0.02.
(b) To illustrate this point, let us compare the difference between a flight managed(with ECON Mach wind correction) and a flight selected (without Mach windcorrection) in case of headwind :
A340-311 (6000nm)Headwind : 50kt
TYPE OF CRUISE TRIP TIME TRIP FUEL
Cost index -150Mach 0.82
14 h 2014 h 30
90 500 kg89 500 kg
Indeed, considering a time cost of 25US$/min and a fuel cost of 0.25US$/kg, the fuelcost increment (1000 x 0.167=167$) is compensated for by the time cost gain(10 x 25=250$).
Moreover, this Mach wind correction allows the airline to maintain its schedule in caseof unexpected winds.

50
7.6 Summary
The following figure (specific example for the A310-304) summarizes the influence of allthe preceding parameters on the ECON Mach computation as performed by the FMS.
Figure 35. A310 ECON MachFinal climb, cruise and initial descent Mach for strategic mode

51
8. DESCENT PERFORMANCE VERSUS COST INDEX
8.1 Cost index - descent profile relationships
Let us now look at the influence of the cost index on the descent profiles depicted in thefollowing figure. We can readily appreciate how the FMS computes the Top of Descent(TOD) as a function of the cost index.
Figure 36. Descent profiles
We notice that the higher the cost index :
- the steeper the descent path (the higher the speed) ,- the shorter the descent distance,- the later the top of descent (TOD).
In order to be more accurate, we have to examine the influence of the cost index ondescent for each aircraft type and this is done in the following section.
52
In order to be more accurate, we have to examine the influence of the cost index ondescent for each aircraft type and this is done in the following section.
8.2 Variation of descent parameters with the cost index
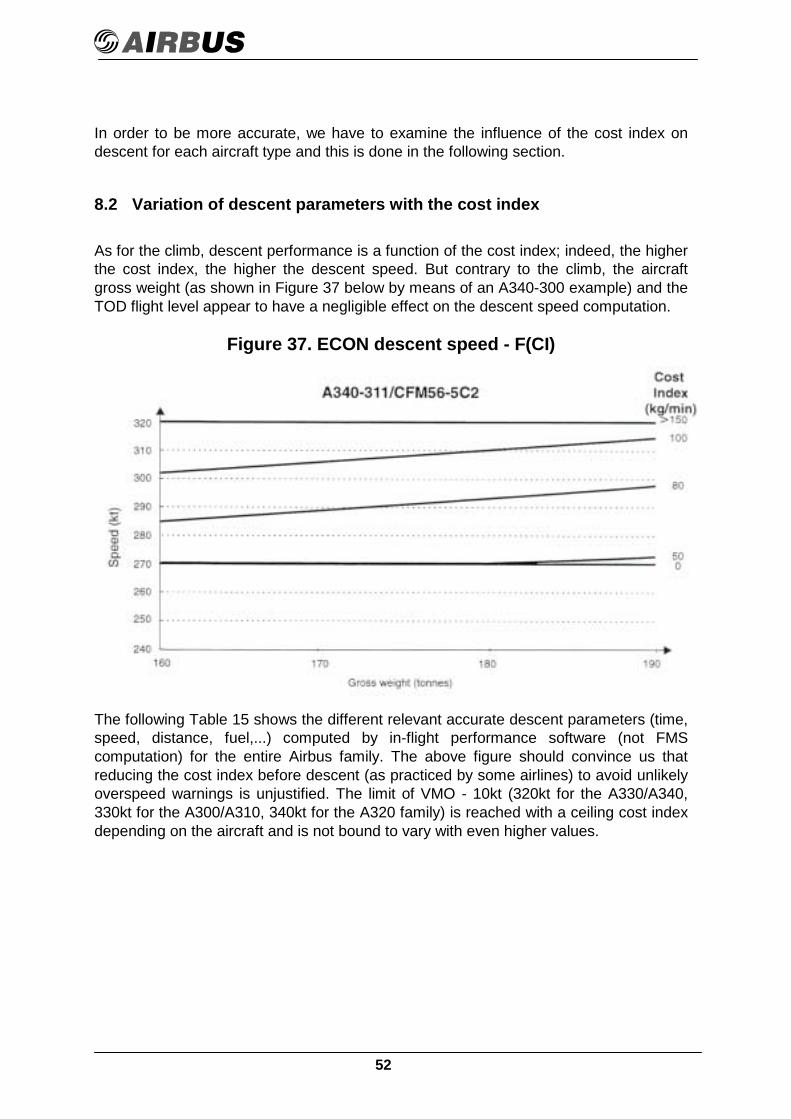
As for the climb, descent performance is a function of the cost index; indeed, the higherthe cost index, the higher the descent speed. But contrary to the climb, the aircraftgross weight (as shown in Figure 37 below by means of an A340-300 example) and theTOD flight level appear to have a negligible effect on the descent speed computation.
Figure 37. ECON descent speed - F(CI)
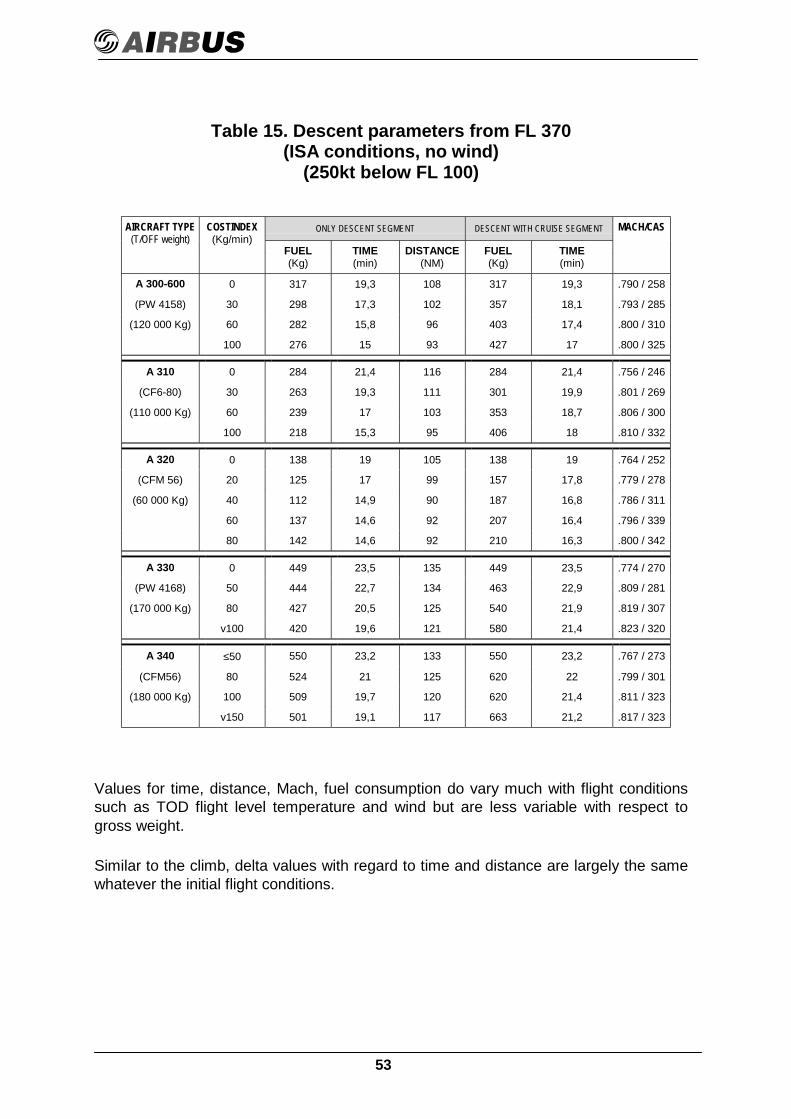
The following Table 15 shows the different relevant accurate descent parameters (time,speed, distance, fuel,...) computed by in-flight performance software (not FMScomputation) for the entire Airbus family. The above figure should convince us thatreducing the cost index before descent (as practiced by some airlines) to avoid unlikelyoverspeed warnings is unjustified. The limit of VMO - 10kt (320kt for the A330/A340,330kt for the A300/A310, 340kt for the A320 family) is reached with a ceiling cost indexdepending on the aircraft and is not bound to vary with even higher values.
53
Table 15. Descent parameters from FL 370(ISA conditions, no wind)
(250kt below FL 100)
ONLY DESCENT SEGMENT DESCENT WITH CRUISE SEGMENTAIRCRAFT TYPE(T/OFF weight)
COSTINDEX(Kg/min)
FUEL(Kg)
TIME(min)
DISTANCE(NM)
FUEL(Kg)
TIME(min)
MACH/CAS
A 300-600 0 317 19,3 108 317 19,3 .790 / 258
(PW 4158) 30 298 17,3 102 357 18,1 .793 / 285
(120 000 Kg) 60 282 15,8 96 403 17,4 .800 / 310
100 276 15 93 427 17 .800 / 325
A 310 0 284 21,4 116 284 21,4 .756 / 246
(CF6-80) 30 263 19,3 111 301 19,9 .801 / 269
(110 000 Kg) 60 239 17 103 353 18,7 .806 / 300
100 218 15,3 95 406 18 .810 / 332
A 320 0 138 19 105 138 19 .764 / 252
(CFM 56) 20 125 17 99 157 17,8 .779 / 278
(60 000 Kg) 40 112 14,9 90 187 16,8 .786 / 311
60 137 14,6 92 207 16,4 .796 / 339
80 142 14,6 92 210 16,3 .800 / 342
A 330 0 449 23,5 135 449 23,5 .774 / 270
(PW 4168) 50 444 22,7 134 463 22,9 .809 / 281
(170 000 Kg) 80 427 20,5 125 540 21,9 .819 / 307
v100 420 19,6 121 580 21,4 .823 / 320
A 340 ≤50 550 23,2 133 550 23,2 .767 / 273
(CFM56) 80 524 21 125 620 22 .799 / 301
(180 000 Kg) 100 509 19,7 120 620 21,4 .811 / 323
v150 501 19,1 117 663 21,2 .817 / 323
Values for time, distance, Mach, fuel consumption do vary much with flight conditionssuch as TOD flight level temperature and wind but are less variable with respect togross weight.
Similar to the climb, delta values with regard to time and distance are largely the samewhatever the initial flight conditions.

54
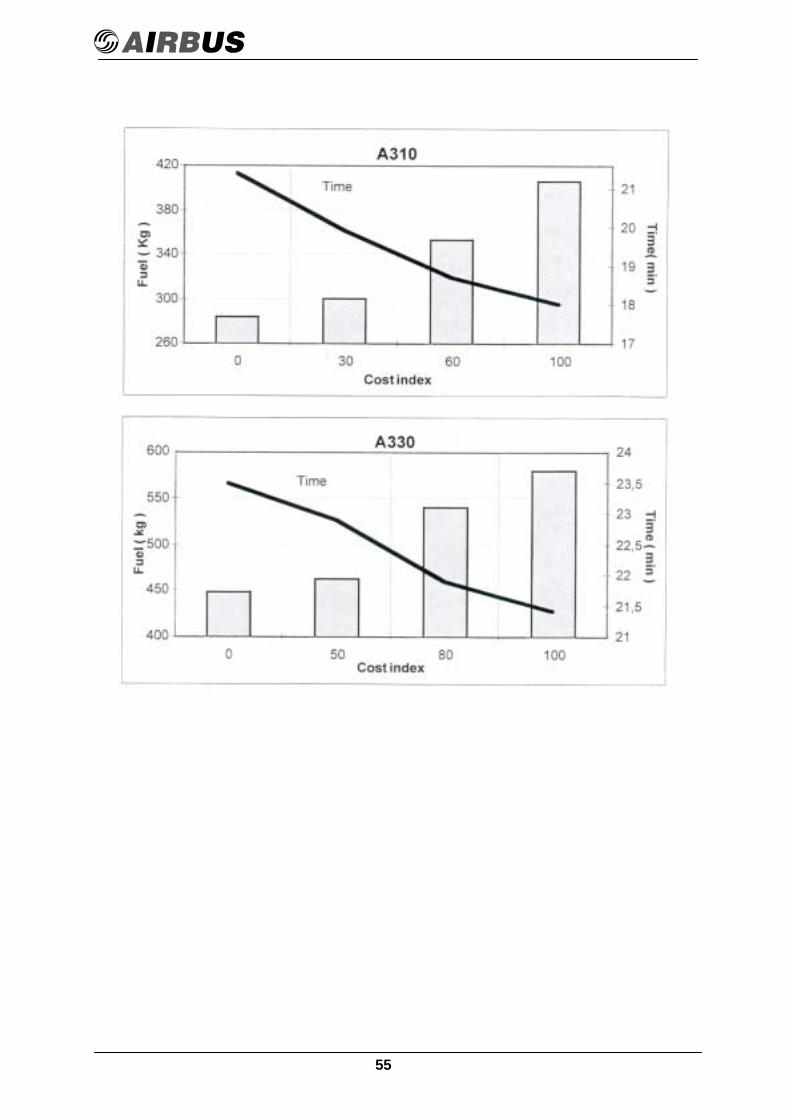
Figure 38. Descent parameters from the same point in cruise(FL 370, ISA conditions, no wind, 250kt from FL 100)
55
56
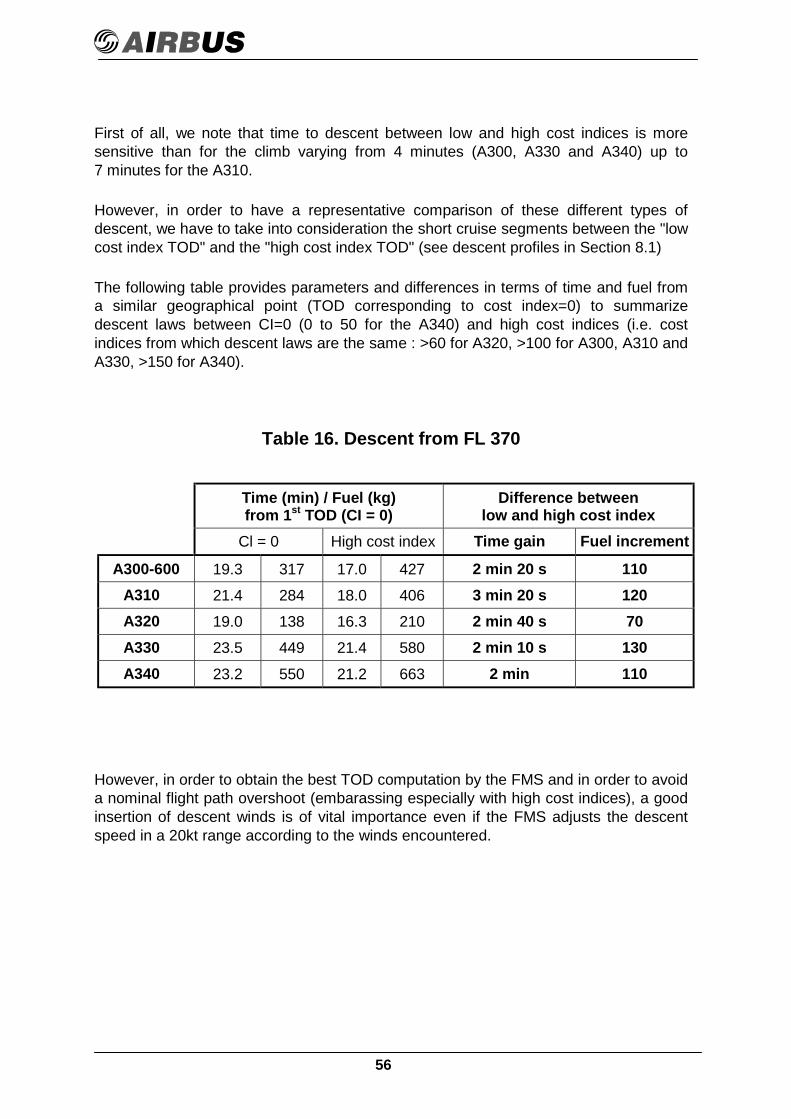
First of all, we note that time to descent between low and high cost indices is moresensitive than for the climb varying from 4 minutes (A300, A330 and A340) up to7 minutes for the A310.
However, in order to have a representative comparison of these different types ofdescent, we have to take into consideration the short cruise segments between the "lowcost index TOD" and the "high cost index TOD" (see descent profiles in Section 8.1)
The following table provides parameters and differences in terms of time and fuel froma similar geographical point (TOD corresponding to cost index=0) to summarizedescent laws between CI=0 (0 to 50 for the A340) and high cost indices (i.e. costindices from which descent laws are the same : >60 for A320, >100 for A300, A310 andA330, >150 for A340).
Table 16. Descent from FL 370
Time (min) / Fuel (kg)from 1st TOD (CI = 0)
Difference betweenlow and high cost index
Cl = 0 High cost index Time gain Fuel increment
A300-600 19.3 317 17.0 427 2 min 20 s 110A310 21.4 284 18.0 406 3 min 20 s 120A320 19.0 138 16.3 210 2 min 40 s 70A330 23.5 449 21.4 580 2 min 10 s 130A340 23.2 550 21.2 663 2 min 110
However, in order to obtain the best TOD computation by the FMS and in order to avoida nominal flight path overshoot (embarassing especially with high cost indices), a goodinsertion of descent winds is of vital importance even if the FMS adjusts the descentspeed in a 20kt range according to the winds encountered.
57
9. PRACTICAL USE OF THE CI - OPERATIONAL RECOMMENDATIONS
9.1 Cost index revisions
Correct use of the cost index requires a dedicated estimation for each route consideringboth time- and fuel-related costs involved on outbound as well as inbound sectors.Periodic revisions by means of monthly reviews should keep track of fluctuations ifthe airline wants to be really cost-conscious.
After analysis, adapted cost index values should be rounded values possiblyaggregated in a small matrix of values corresponding to several routes with similar coststructure or cost combinations (fuel- and time-related). The low, medium, highassortments proposed in Section 3 may be a good start to setting up such a system.
Airbus has proposed already such an approach in the course of many fuel burn auditsand operational liaison visits.
In this context and for consistent fuel predictions, the correct performance factorshould also be inserted in the FMS and in the computerized flight plan (CFP). Thisfactor takes into account specific range deterioration figures of individual aircraft byperiodically running the performance monitoring program or resulting from dedicatedperformance audits.
The importance of using the same performance factor in pre-flight planning (CFP) andin the FMS cannot be over emphasized. In the past updating the FMS PerformanceFactor was restricted to maintenance staff, but now some of our customers haveadapted this policy. Some airlines have defined company policy to allow the crew tocheck and enter the Performance Factor. This factor is communicated to the crew viathe flight planning document for the specific aircraft tail number concerned.
9.2 Changing the cost index at departure / on ground
The cost index can, if necessary, be changed on ground to avoid a delay at arrivalin case of late departure and in order to prevent important cost repercussions such aspassenger dissatisfaction, missed connections, diversions due to curfews, etc.
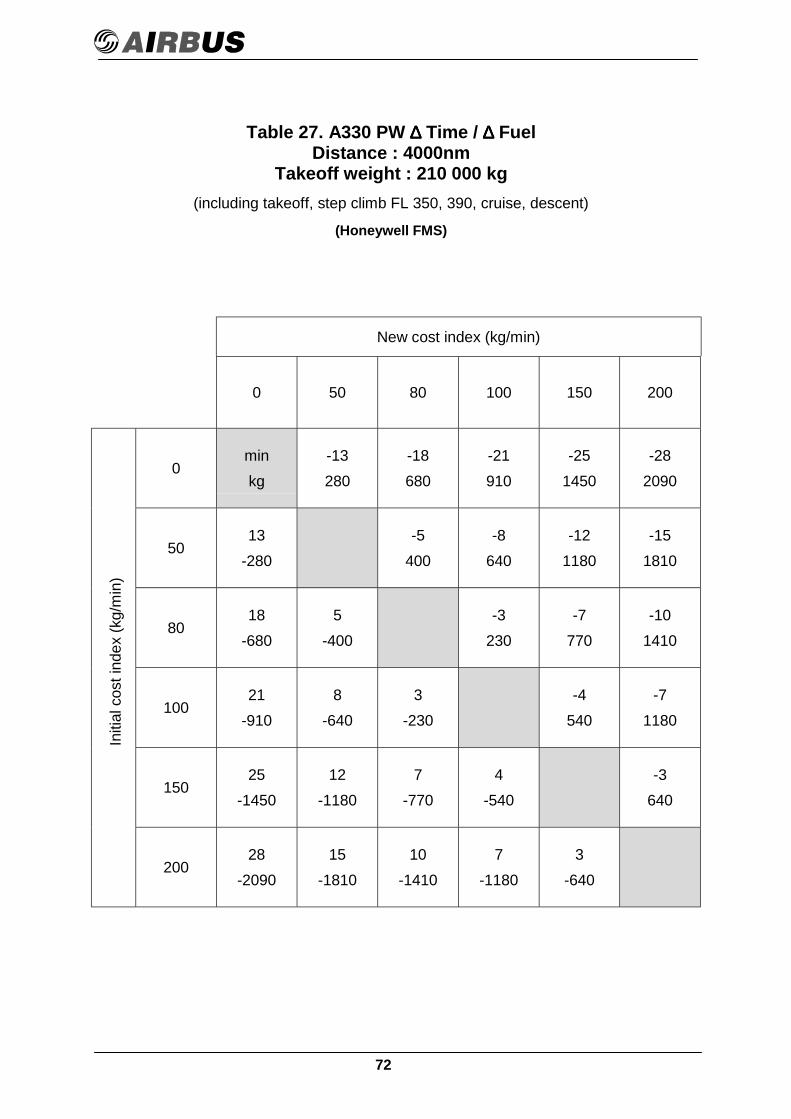
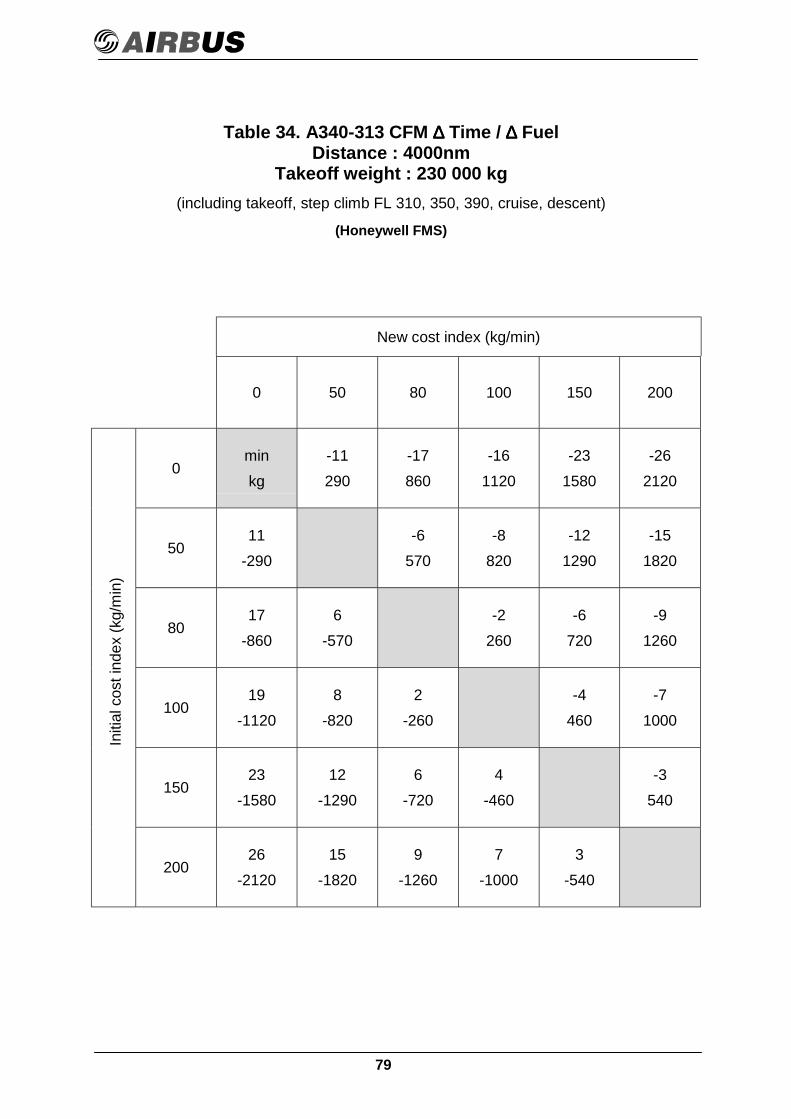
The tables in Appendix 1 respectively provide default to new cost indexrepercussions with regard to ∆∆∆∆ time and ∆∆∆∆ fuel for the A300/A310, A320, A330 andA340 (delta values with regard to time and fuel are largely the same whatever thetemperature and wind conditions). Trading fuel for time as tabulated is what reallymatters here.
58
9.3 Changing the cost index in flight
(a) Changing the cost index in the case of different en-route winds is irrelevant.
Indeed, it is not even necessary to vary cost indices with seasonal wind fluctuations.This is because the FMS integrates ground speed (i.e. wind) when computing ECONMach corresponding to a given cost index. This has already been reviewed inSection 2.
As a reminder of Section 7.5, the Mach correction referred to hereabove, for all Airbusmodels, is of the order of :
Mach + 0.005 MN for 50kt headwindMach - 0.005 MN for 50kt tailwind.
In addition, the wind model accounted for by the FMS in its ECON Mach calculationresults from :
- from current position up to 150nm ahead : actual encountered wind,- further up, a wind evolving linearly towards the wind inserted by the pilot into the
FMS at that flight level.
However, the cost index would have to be changed in flight if the encountered windswere becoming so great that it could result in a missed hub connection upon arrival. Itshould be done after checking the fuel predictions on the secondary flight plan in theFMS with the new cost index value.
By iteration on the A300, A310 and A320, this recommendation could be followed onthe A330 and A340 via the time constraint option.
(b) Changing the cost index in the case of fuel problems should be done asfollows
The objective is to avoid having to make a refueling stop. Select a lower cost index thanthe actual one in case of negative or pessimistic fuel predictions (extra fuel/extra time<0 in the FUEL PRED page in the FMS) due to strong winds encountered or ATCrerouting, restrictions or expected holding at arrival.

59
Important : this should be done first on the secondary flight plan and after checkingfuel predictions before entering the adapted value (found by iteration until obtainingextra time/extra fuel>0 in the FUEL PRED page in the FMS) in the primary flight planto avoid unnecessary thrust variations.
That is why the quickest strategy is to check the fuel predictions first with the LRC costindex (see Section 7.4) and select CI=0 only if there is a fuel concern.
(c) Changing the cost index for speed control should never be done except inthe case of fuel problems (LRC or MRC) as just explained.
(d) For a fuel-critical route, setting a zero cost index may be envisagedexceptionally provided all mandatory route reserves can then be maintained.

60
10. CONCLUSION
The cost index is a simple and effective tool when it is appropriately used by an airline.This means airlines should have a thorough knowledge of costs in order to optimizeoperating economics. This is the single and only purpose of the cost index, keeping inmind that wrong utilization and/or wrong calculation of it leads inevitably to costpenalties. These penalties pertain to overall costs and not just to fuel costs ; apparentoverconsumption caused by the cost index may sometimes be attributed to the need tosave expensive flying time.
Therefore, one should always bear in mind that the cost index trades off both fuel andtime provided they are properly assessed.
All of the above should not hide the fact that aircraft performance is rather variablewhen depending on the cost index : speed and rate of climb, Mach as a function ofgross weight, flight level and cruise winds. Its output performance may also lead toincompatibilities with ATC constraints. The development of FANS (Future AirNavigation System) with CNS - ATM and new FMS avionics should prompt a moreappropriate utilization of the cost index and certainly a more dedicated optimization offlight economics. Lateral track clearances and improved altitude allocation shouldcertainly enable better use to be made of the cost index concept.
Airbus is both willing and able to support airlines by providing direct assistance incosting and operational matters. As it runs dedicated departments for maintenance cost(AI/SE-M2) and for operational performance (AI/ST F), coordinated projects can belaunched with the objective of consulting with customers and establishing cost indexpolicies adapted to specific airline settings (fleet composition, type of network,economics, route and ATC constraints).
To accomplish this, information should be exchanged to enable proper and preciseevaluations to be made based on the best possible assumptions. As said earlier in thisbrochure, much progress could be achieved by having airline accountants involved.
In practice, however, it has been hard for flight operation departments and airlinefinancial analysts to come to synergistic teamwork in this matter. Some airlinemanagements convinced of the potential of airline econometrics - have nonethelesssucceeded in coming to grips with the cost index much to the success of their operatingeconomics, let alone their balance sheets.
61
APPENDIX 1
CHANGING THE COST INDEX AT DEPARTURE/ON GROUND
The following tables show the repercussions with regard to ∆ time and ∆ fuel for theA300/A310, A320, A330 and A340 when changing the cost index at departure/onground.

62
Initi
al c
ost i
ndex
(kg/
min
)Table 17. A300-600 / A310 ∆∆∆∆ Time / ∆∆∆∆ Fuel
Distance : 1000nm(including takeoff, step climb, cruise, descent)
(Honeywell FMS)
New cost index (kg/min)
0 30 60 100 150 200
0minkg
-5100
-6250
-9450
-9550
-10600
205
-100-2
150-4
300-4
400-5
450
406
-2502
-150-2
150-2
250-3
300
609
-4504
-3002
-150-1
100-1
150
809
-5504
-4002
-2501
-100-150
10010
-6005
-4503
-3001
-1501
-50

63
Initi
al c
ost i
ndex
(kg/
min
)Table 18. A300-600 / A310 ∆∆∆∆ Time / ∆∆∆∆ Fuel
Distance : 2000nm(including takeoff, step climb, cruise, descent)
(Honeywell FMS)
New cost index (kg/min)
0 30 60 100 150 200
0minkg
-8200
-13400
-15650
-17850
-171050
308
-200-4
250-7
500-9
700-9
800
6013
-4004
-25-2
250-5
450-5
600
10015
-6507
-5002
-250-2
200-2
350
15017
-8509
-7005
-4502
-2000
100
20017
-10509
-8005
-6002
-3500
-100

64
Initi
al c
ost i
ndex
(kg/
min
)Table 19. A300-600 / A310 ∆∆∆∆ Time / ∆∆∆∆ Fuel
Distance : 3000nm(including takeoff, step climb, cruise, descent)
(Honeywell FMS)
New cost index (kg/min)
0 30 60 100 150 200
0minkg
-11300
-15600
-201000
-231200
-231400
2011
-300-5
300-10600
-131000
-131200
4015
-6005
-300-5
350-8
700-9
900
6020
-100010
-6005
-350-3
300-4
500
8023
-120013
-10008
-7003
-300-1
200
10023
-140013
-12009
-9004
-5001
-200
65
Initi
al c
ost i
ndex
(kg/
min
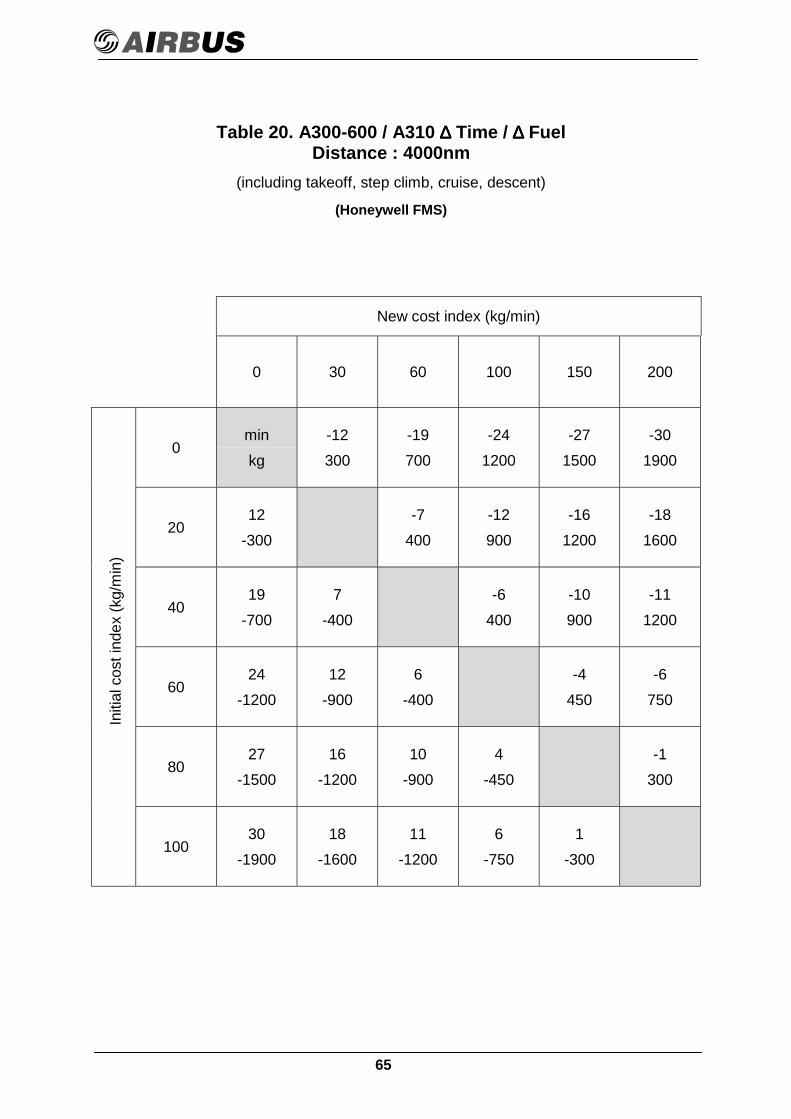
)Table 20. A300-600 / A310 ∆∆∆∆ Time / ∆∆∆∆ Fuel
Distance : 4000nm(including takeoff, step climb, cruise, descent)
(Honeywell FMS)
New cost index (kg/min)
0 30 60 100 150 200
0minkg
-12300
-19700
-241200
-271500
-301900
2012
-300-7
400-12900
-161200
-181600
4019
-7007
-400-6
400-10900
-111200
6024
-120012
-9006
-400-4
450-6
750
8027
-150016
-120010
-9004
-450-1
300
10030
-190018
-160011
-12006
-7501
-300

66
Initi
al c
ost i
ndex
(kg/
min
)Table 21. A319 / A320 / A321 ∆∆∆∆ Time / ∆∆∆∆ Fuel
Distance : 1000nm(including takeoff, step climb FL 350, 390, cruise, descent)
(Honeywell FMS)
New cost index (kg/min)
0 20 40 60 80 100
0minkg
-350
-5150
-7250
-8350
-9400
203
-50-2
100-4
200-5
300-5
350
405
-1502
-100-2
100-3
200-3
250
607
-2504
-2002
-100-1
100-2
150
808
-3505
-3003
-2001
-100-150
1009
-4005
-3503
-2502
-1501
-50
67
Initi
al c
ost i
ndex
(kg/
min
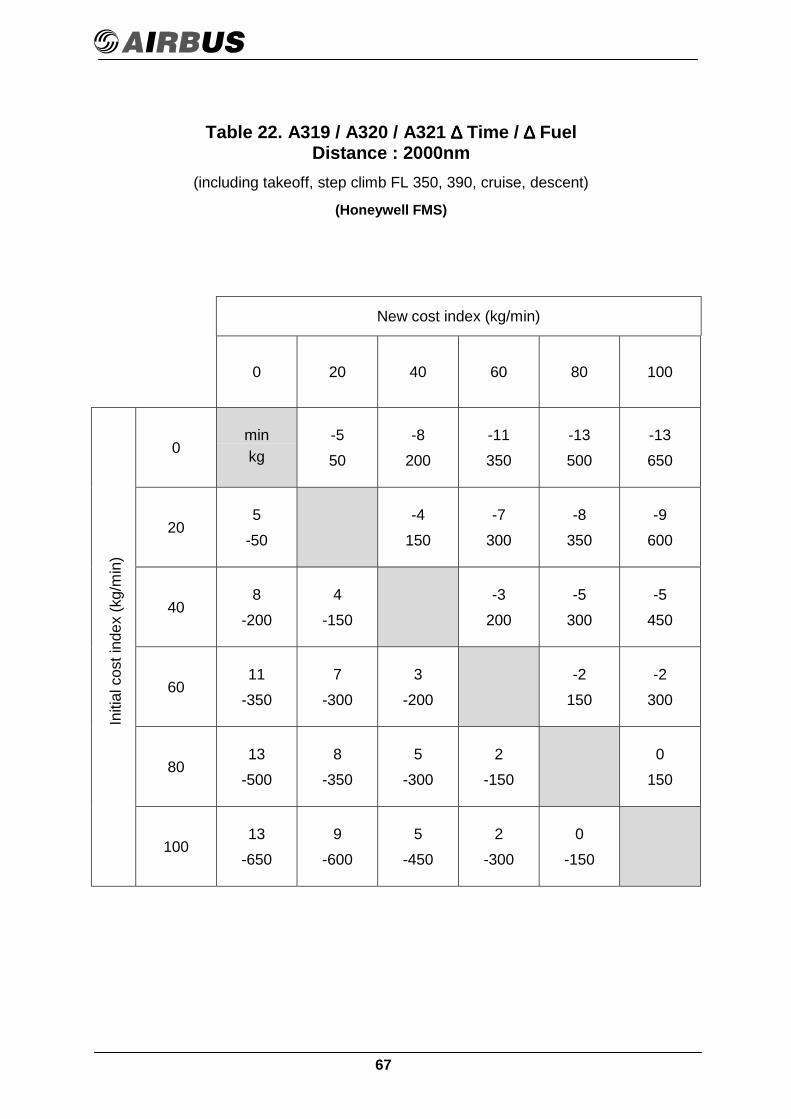
)Table 22. A319 / A320 / A321 ∆∆∆∆ Time / ∆∆∆∆ Fuel
Distance : 2000nm(including takeoff, step climb FL 350, 390, cruise, descent)
(Honeywell FMS)
New cost index (kg/min)
0 20 40 60 80 100
0minkg
-550
-8200
-11350
-13500
-13650
205
-50-4
150-7
300-8
350-9
600
408
-2004
-150-3
200-5
300-5
450
6011
-3507
-3003
-200-2
150-2
300
8013
-5008
-3505
-3002
-1500
150
10013
-6509
-6005
-4502
-3000
-150

68
Initi
al c
ost i
ndex
(kg/
min
)Table 23. A319 / A320 / A321 ∆∆∆∆ Time / ∆∆∆∆ Fuel
Distance : 3000nm(including takeoff, step climb FL 350, 390, cruise, descent)
(Honeywell FMS)
New cost index (kg/min)
0 20 40 60 80 100
0minkg
-7650
-11820
-151040
-171270
-191440
207
-650-5
170-8
390-10620
-12790
4011
-8205
-170-4
220-6
450-8
620
6015
-10408
-3904
-220-2
230-4
400
8017
-127010
-6206
-4602
-230-2
160
10019
-144012
-7908
-6204
-4002
-160
69
Initi
al c
ost i
ndex
(kg/
min
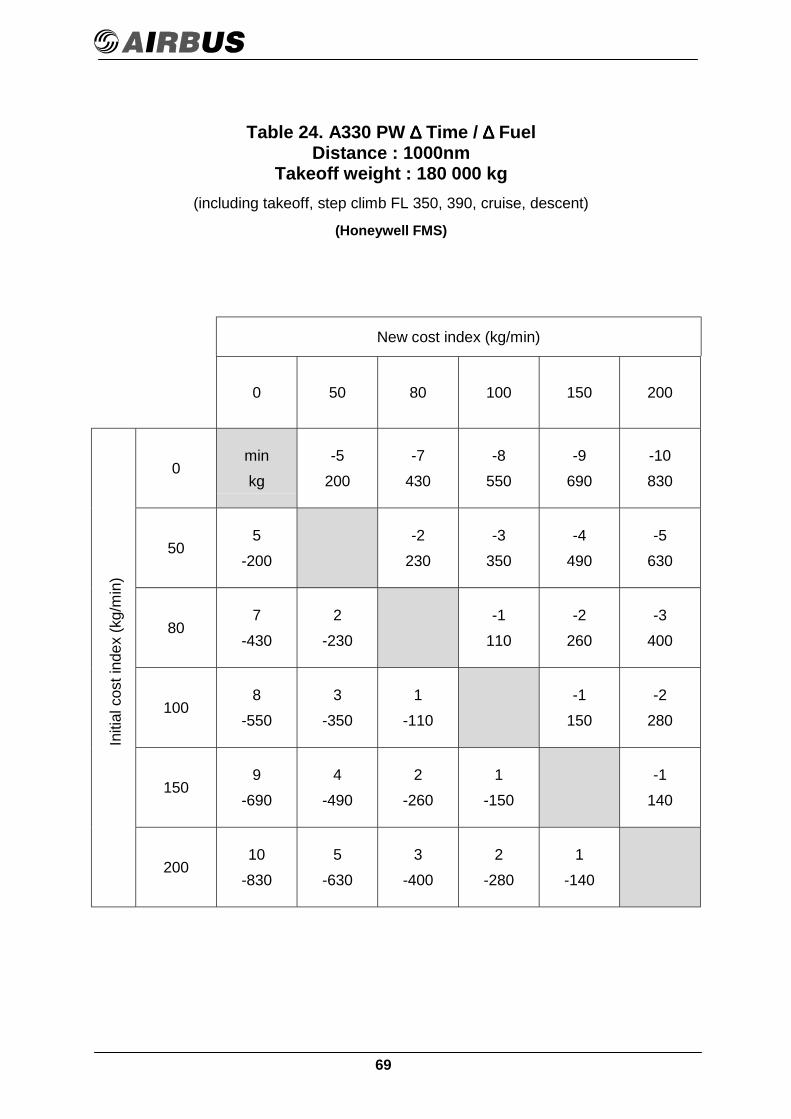
)Table 24. A330 PW ∆∆∆∆ Time / ∆∆∆∆ Fuel
Distance : 1000nmTakeoff weight : 180 000 kg
(including takeoff, step climb FL 350, 390, cruise, descent)
(Honeywell FMS)
New cost index (kg/min)
0 50 80 100 150 200
0minkg
-5200
-7430
-8550
-9690
-10830
505
-200-2
230-3
350-4
490-5
630
807
-4302
-230-1
110-2
260-3
400
1008
-5503
-3501
-110-1
150-2
280
1509
-6904
-4902
-2601
-150-1
140
20010
-8305
-6303
-4002
-2801
-140

70
Initi
al c
ost i
ndex
(kg/
min
)Table 25. A330 PW ∆∆∆∆ Time / ∆∆∆∆ Fuel
Distance : 2000nmTakeoff weight : 190 000 kg
(including takeoff, step climb FL 350, 390, cruise, descent)
(Honeywell FMS)
New cost index (kg/min)
0 50 80 100 150 200
0minkg
-7210
-11500
-12650
-14900
-161150
507
-210-4
280-5
440-7
690-9
940
8011
-5004
-280-1
160-3
410-5
660
10012
-6505
-4401
-160-2
250-4
500
15014
-9007
-6903
-4102
-250-2
250
20016
-11509
-9405
-6604
-5002
-250

71
Initi
al c
ost i
ndex
(kg/
min
)Table 26. A330 PW ∆∆∆∆ Time / ∆∆∆∆ Fuel
Distance : 3000nmTakeoff weight : 200 000 kg
(including takeoff, step climb FL 350, 390, cruise, descent)
(Honeywell FMS)
New cost index (kg/min)
0 50 80 100 150 200
0minkg
-9220
-13550
-15720
-181100
-201750
509
-220-4
330-6
500-9
870-11
1530
8013
-5504
-330-2
170-5
540-7
1200
10015
-7206
-5002
-170-3
380-5
1040
150409
-1100400-870
396-540
394-380
389660
20020
-175011
-15307
-12005
-10402
-660
72
Initi
al c
ost i
ndex
(kg/
min
)Table 27. A330 PW ∆∆∆∆ Time / ∆∆∆∆ Fuel
Distance : 4000nmTakeoff weight : 210 000 kg
(including takeoff, step climb FL 350, 390, cruise, descent)
(Honeywell FMS)
New cost index (kg/min)
0 50 80 100 150 200
0minkg
-13280
-18680
-21910
-251450
-282090
5013
-280-5
400-8
640-12
1180-15
1810
8018
-6805
-400-3
230-7
770-10
1410
10021
-9108
-6403
-230-4
540-7
1180
15025
-145012
-11807
-7704
-540-3
640
20028
-209015
-181010
-14107
-11803
-640

73
Initi
al c
ost i
ndex
(kg/
min
)Table 28. A330 PW ∆∆∆∆ Time / ∆∆∆∆ Fuel
Distance : 5000nmTakeoff weight : 210 000 kg
(including takeoff, step climb FL 350, 390, cruise, descent)
(Honeywell FMS)
New cost index (kg/min)
0 50 80 100 150 200
0minkg
-17600
-241220
-271750
-322980
-353770
5017
-600-7
610-10
1150-15
2380-18
3170
8024
-12207
-610-3
540-8
1770-11
2550
10027
-175010
-11503
-540-5
1230-8
2020
15032
-298015
-23808
-17705
-1230-3
790
20035
-377018
-317011
-25508
-20203
-790

74
Initi
al c
ost i
ndex
(kg/
min
)Table 29. A340-311 CFM ∆∆∆∆ Time / ∆∆∆∆ Fuel
Distance : 3000nmTakeoff weight : 210 000 kg
(including takeoff, step climb FL 350, 390, cruise, descent)
(Honeywell FMS)
New cost index (kg/min)
0 50 80 100 150 200
0minkg
-11140
-17480
-19670
-231110
-261810
5011
-140-6
340-8
540-12970
-151670
8017
-4806
-340-2
200-6
630-9
1330
10019
-6708
-5402
-200-4
430-7
1140
15023
-111012
-9706
-6304
-430-3
700
20026
-181015
-16709
-13307
-11403
-700

75
Initi
al c
ost i
ndex
(kg/
min
)Table 30. A340-311 CFM ∆∆∆∆ Time / ∆∆∆∆ Fuel
Distance : 4000nmTakeoff weight : 230 000 kg
(including takeoff, step climb FL 310, 350, 390, cruise, descent)
(Honeywell FMS)
New cost index (kg/min)
0 50 80 100 150 200
0minkg
-16220
-23820
-261140
-311630
-332230
5016
-220-7
600-10920
-151410
-172000
8023
-8207
-600-3
320-8
810-10
1400
10026
-114010
-9203
-320-5
490-7
1090
15031
-163015
-14108
-8105
-490-2
590
20033
-223017
-200010
-14007
-10902
-590

76
Initi
al c
ost i
ndex
(kg/
min
)Table 31. A340-311 CFM ∆∆∆∆ Time / ∆∆∆∆ Fuel
Distance : 5000nmTakeoff weight : 240 000 kg
(including takeoff, step climb FL 310, 350, 390, cruise, descent)
(Honeywell FMS)
New cost index (kg/min)
0 50 80 100 150 200
0minkg
-20280
-27870
-321160
-361760
-412750
5020
-280-7
590-12880
-161480
-212470
8027
-8707
-590-5
290-9
890-14
1880
10032
-116012
-8805
-290-4
600-9
1590
15036
-176016
-14809
-8904
-600-5
990
20041
-275021
-247014
-18809
-15905
-990

77
Initi
al c
ost i
ndex
(kg/
min
)Table 32. A340-311 CFM ∆∆∆∆ Time / ∆∆∆∆ Fuel
Distance : 6000nmTakeoff weight : 250 000 kg
(including takeoff, step climb FL 310, 350, 390, cruise, descent)
(Honeywell FMS)
New cost index (kg/min)
0 50 80 100 150 200
0minkg
-26390
-34990
-381370
-452190
-503300
5026
-390-8
600-12990
-191810
-242910
8034
-9908
-600-4
390-11
1210-16
2310
10038
-137012
-9904
-390-7
820-12
1930
15045
-219019
-181011
-12107
-820-5
1110
20050
-330024
-291416
-231012
-19305
-1110

78
Initi
al c
ost i
ndex
(kg/
min
)Table 33. A340-313 CFM ∆∆∆∆ Time / ∆∆∆∆ Fuel
Distance : 3000nmTakeoff weight : 210 000 kg
(including takeoff, step climb FL 350, 390, cruise, descent)
(Honeywell FMS)
New cost index (kg/min)
0 50 80 100 150 200
0minkg
-10240
-14570
-16750
-191130
-211670
5010
-240-4
330-6
500-9
890-11
1430
8014
-5704
-330-2
180-5
560-7
1100
10016
-7506
-5002
-180-3
390-5
930
15019
-11309
-8905
-5603
-390-2
540
20021
-167011
-14307
-11005
-9302
-540
79
Initi
al c
ost i
ndex
(kg/
min
)Table 34. A340-313 CFM ∆∆∆∆ Time / ∆∆∆∆ Fuel
Distance : 4000nmTakeoff weight : 230 000 kg
(including takeoff, step climb FL 310, 350, 390, cruise, descent)
(Honeywell FMS)
New cost index (kg/min)
0 50 80 100 150 200
0minkg
-11290
-17860
-161120
-231580
-262120
5011
-290-6
570-8
820-12
1290-15
1820
8017
-8606
-570-2
260-6
720-9
1260
10019
-11208
-8202
-260-4
460-7
1000
15023
-158012
-12906
-7204
-460-3
540
20026
-212015
-18209
-12607
-10003
-540

80
Initi
al c
ost i
ndex
(kg/
min
)Table 35. A340-313 CFM ∆∆∆∆ Time / ∆∆∆∆ Fuel
Distance : 5000nmTakeoff weight : 240 000 kg
(including takeoff, step climb FL 310, 350, 390, cruise, descent)
(Honeywell FMS)
New cost index (kg/min)
0 50 80 100 150 200
0minkg
-14400
-19830
-221110
-261760
-302340
5014
-400-5
430-8
710-12
1360-16
1940
8019
-8305
-430-3
280-7
920-11
1500
10022
-11108
-7103
-280-4
650-8
1230
15026
-176012
-19407
-9204
-650-4
580
20030
-234016
-193611
-15008
-12304
-580

81
Initi
al c
ost i
ndex
(kg/
min
)Table 36. A340-313 CFM ∆∆∆∆ Time / ∆∆∆∆ Fuel
Distance : 6000nmTakeoff weight : 250 000 kg
(including takeoff, step climb FL 310, 350, 390, cruise, descent)
(Honeywell FMS)
New cost index (kg/min)
0 50 80 100 150 200
0minkg
-16460
-221000
-251370
-312050
-362770
5016
-460-6
540-9
910-15
1590-20
2310
8022
-10006
-540-3
370-9
1060-14
1770
10025
-13709
-9103
-370-6
680-11
1400
15031
-205015
-15909
-10606
-680-5
720
20036
-277020
-231014
-177011
-14005
-720

82
Initi
al c
ost i
ndex
(kg/
min
)Table 37. A340-313E CFM ∆∆∆∆ Time / ∆∆∆∆ Fuel
Distance : 3000nmTakeoff weight : 210 000 kg
(including takeoff, step climb FL 350, 390, cruise, descent)
(Honeywell FMS)
New cost index (kg/min)
0 50 80 100 150 200
0minkg
-10540
-12920
-141230
-161640
-151780
5010
-540-2
390-4
690-6
1100-5
1250
8012
-9202
-390-2
300-4
710-3
860
10014
-12304
-6902
-300-2
410-1
560
15016
-16406
-11004
-7102
-410-1
150
20015
-17905
-12503
-8601
-5601
-150

83
Initi
al c
ost i
ndex
(kg/
min
)Table 38. A340-313E CFM ∆∆∆∆ Time / ∆∆∆∆ Fuel
Distance : 4000nmTakeoff weight : 230 000 kg
(including takeoff, step climb FL 310, 350, 390, cruise, descent)
(Honeywell FMS)
New cost index (kg/min)
0 50 80 100 150 200
0minkg
-13810
-151310
-181710
-202240
-202480
5013
-810-2
500-5
900-7
1430-7
1670
8015
-13102
-500-3
400-5
930-5
1170
10018
-17105
-9003
-400-2
530-2
770
15020
-22407
-14305
-9302
-5300
240
20020
-24807
-16705
-11702
-7700
-240

84
Initi
al c
ost i
ndex
(kg/
min
)Table 39. A340-313E CFM ∆∆∆∆ Time / ∆∆∆∆ Fuel
Distance : 5000nmTakeoff weight : 240 000 kg
(including takeoff, step climb FL 310, 350, 390, cruise, descent)
(Honeywell FMS)
New cost index (kg/min)
0 50 80 100 150 200
0minkg
-12970
-171780
-192190
-212820
-203180
5012
-970-5
810-7
1220-9
1850-8
2200
8017
-17805
-810-2
410-4
1040-3
1400
10019
-21907
-12202
-410-2
630-1
990
15021
-28209
-18504
-10402
-630-1
360
20020
-31808
-22003
-14001
-9901
-360

85
Initi
al c
ost i
ndex
(kg/
min
)Table 40. A340-313E CFM ∆∆∆∆ Time / ∆∆∆∆ Fuel
Distance : 6000nmTakeoff weight : 250 000 kg
(including takeoff, step climb FL 310, 350, 390, cruise, descent)
(Honeywell FMS)
New cost index (kg/min)
0 50 80 100 150 200
0minkg
-161100
-201790
-232260
-253000
-253450
5016
-1100-4
690-7
1170-9
1910-9
2360
8020
-17904
-690-3
480-5
1220-5
1670
10023
-22607
-11703
-480-2
740-2
1190
15025
-30009
-19105
-12202
-7400
450
20025
-34509
-23605
-16702
-11900
-450

86
Initi
al c
ost i
ndex
(kg/
min
)Table 41. A340-313E CFM ∆∆∆∆ Time / ∆∆∆∆ Fuel
Distance : 7000nmTakeoff weight : 260 000 kg
(including takeoff, step climb FL 310, 350, 390, cruise, descent)
(Honeywell FMS)
New cost index (kg/min)
0 50 80 100 150 200
0minkg
-151320
-232100
-252590
-293430
-283960
5015
-1320-8
780-10
1270-14
2120-13
2640
8023
-21008
-780-2
490-6
1330-5
1860
10025
-259010
-12702
-490-4
850-3
1370
15029
-343014
-21206
-13304
-850-1
530
20028
-396013
-26405
-18603
-13701
-530

87
Initi
al c
ost i
ndex
(kg/
min
)Table 42. A340-313E CFM ∆∆∆∆ Time / ∆∆∆∆ Fuel
Distance : 8000nmTakeoff weight : 271 000 kg
(including takeoff, step climb FL 310, 350, 390, cruise, descent)
(Honeywell FMS)
New cost index (kg/min)
0 50 80 100 150 200
0minkg
-191550
-252430
-282940
-324140
-354830
5019
-1550-6
880-9
1390-13
2590-16
3280
8025
-24306
-880-3
510-7
1710-10
2400
10028
-29409
-13903
-510-4
1190-7
1880
15032
-414013
-25907
-17104
-1190-3
690
20035
-483016
-328010
-24007
-18803
-690

88
APPENDIX 2
A300-600/A310 DEFAULT COST INDEX OPTION
If the company cost index is not known or if it is preferred to refrain from the calculatedconcept, a default cost index value can easily be assessed to fly in PROFILE(A300-600/A310) at any desired Mach Number compatible with an operational objective(e.g. FCOM Optimum Mach or LRC or any Mach Number).
The cost index should, however, not be manipulated as a speed control tool by varyingthe value on the CDU. Moreover, any overemphasis on the fuel economy side may beaccompanied by costly repercussions on the time-related cost, hence jeopardizing totaltrip cost.
This Appendix proposes a technique for the assessment of a Default Cost Index value,using the graphs published in the FCOM :
- 2.02.19 - page 34 (Sperry - Honeywell)- 2.02.19 - page 32 (Smiths).
Adapting a Default Cost Index can - in many cases where no calculated value isavailable be quite adequately defined for
• the whole flight or for a given flight phase
• for any desired speed :
! given cruise Mach Number or LRC
! given descent IAS (separate graphs).
Step """"
• Determine an average cruise gross weight (e.g. weight at cruise middle point) forthe route, the area of operation or for the entire network.
• Using the CRUISE ALTITUDE CHART in FCOM 2.17.30 (page 20 for A310,page 14 for A300-600), determine the optimum altitude for this gross weight.
Step ####
• Using the average cruise gross weight and corresponding optimum altitude,determined in Step ", enter the FMS graph in 2.02.19, as follows :
– plot the above values in the FL / GROSS WEIGHT lower graph,
– from this point, draw a vertical line.
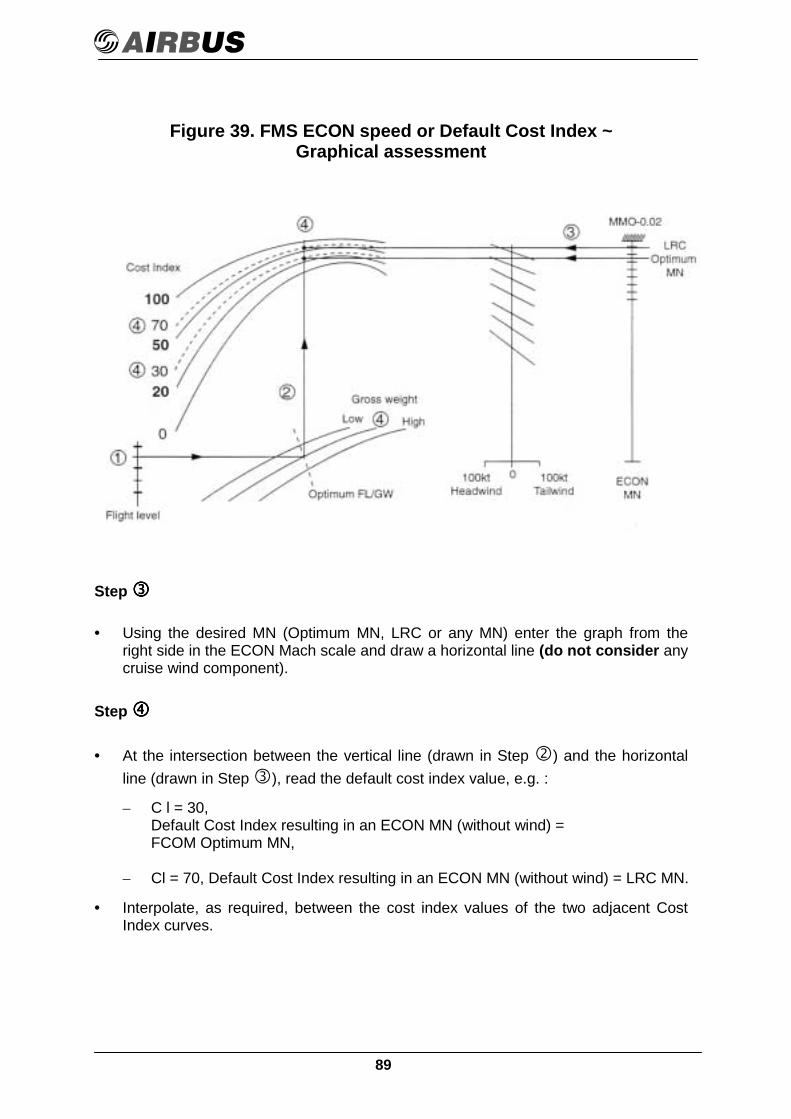
89
Figure 39. FMS ECON speed or Default Cost Index ~Graphical assessment
Step %%%%
• Using the desired MN (Optimum MN, LRC or any MN) enter the graph from theright side in the ECON Mach scale and draw a horizontal line (do not consider anycruise wind component).
Step &&&&
• At the intersection between the vertical line (drawn in Step #) and the horizontalline (drawn in Step %), read the default cost index value, e.g. :
– C l = 30,Default Cost Index resulting in an ECON MN (without wind) =FCOM Optimum MN,
– Cl = 70, Default Cost Index resulting in an ECON MN (without wind) = LRC MN.
• Interpolate, as required, between the cost index values of the two adjacent CostIndex curves.
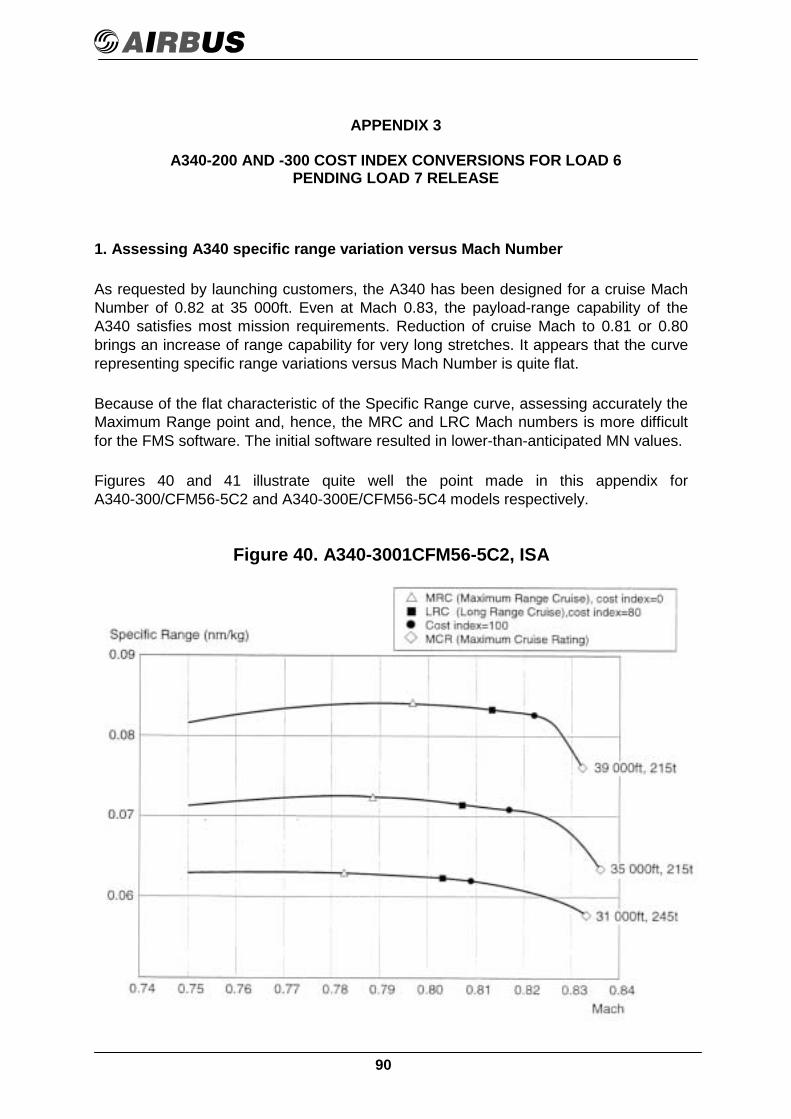
90
APPENDIX 3
A340-200 AND -300 COST INDEX CONVERSIONS FOR LOAD 6PENDING LOAD 7 RELEASE
1. Assessing A340 specific range variation versus Mach Number
As requested by launching customers, the A340 has been designed for a cruise MachNumber of 0.82 at 35 000ft. Even at Mach 0.83, the payload-range capability of theA340 satisfies most mission requirements. Reduction of cruise Mach to 0.81 or 0.80brings an increase of range capability for very long stretches. It appears that the curverepresenting specific range variations versus Mach Number is quite flat.
Because of the flat characteristic of the Specific Range curve, assessing accurately theMaximum Range point and, hence, the MRC and LRC Mach numbers is more difficultfor the FMS software. The initial software resulted in lower-than-anticipated MN values.
Figures 40 and 41 illustrate quite well the point made in this appendix forA340-300/CFM56-5C2 and A340-300E/CFM56-5C4 models respectively.
Figure 40. A340-3001CFM56-5C2, ISA
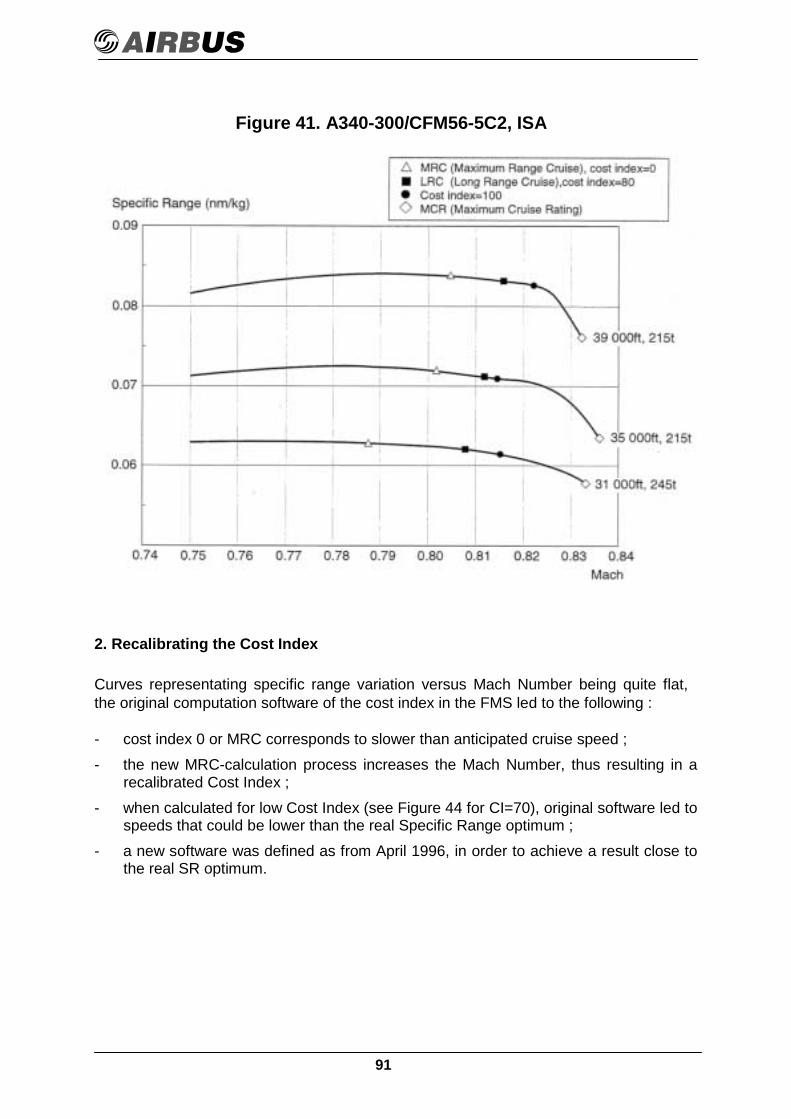
91
Figure 41. A340-300/CFM56-5C2, ISA
2. Recalibrating the Cost Index
Curves representating specific range variation versus Mach Number being quite flat,the original computation software of the cost index in the FMS led to the following :
- cost index 0 or MRC corresponds to slower than anticipated cruise speed ;- the new MRC-calculation process increases the Mach Number, thus resulting in a
recalibrated Cost Index ;- when calculated for low Cost Index (see Figure 44 for CI=70), original software led to
speeds that could be lower than the real Specific Range optimum ;- a new software was defined as from April 1996, in order to achieve a result close to
the real SR optimum.

92
Figure 42. Conversion from CI-airline to CI-FMSA340-200 and 300/CFM56-5C2/C3/C4
In the meantime, airlines were provided with Cost Index corrective charts that were tobe furnished in the form of a temporary revision of the FCOM .
Altogether, improvements are staggered as follows :
• The modified definition of MRC and hence of LRC (1% off) was to be introduced inthe IFP with subsequent distribution to the airlines.
• Customers were provided with a modified table of the Cost Index, converting theold value to a new one, thereby allowing the use of higher Mach Numbers ; Figures42 and 43 represent these correction charts for, respectively, A340-311 and -211(CFM56-5C2) and A340-313 (E) (CFM56-5C4).
Pending Load 7, the corrections of Figures 42 and 43 are necessary. Thereafter theywill be obsolete and use will then be made of the Table 3, in Section 3 of this brochure.

93
Figure 43. Conversion from CI-airline to CI-FMSA340-313/CFM56-5C4 High Cross Weight
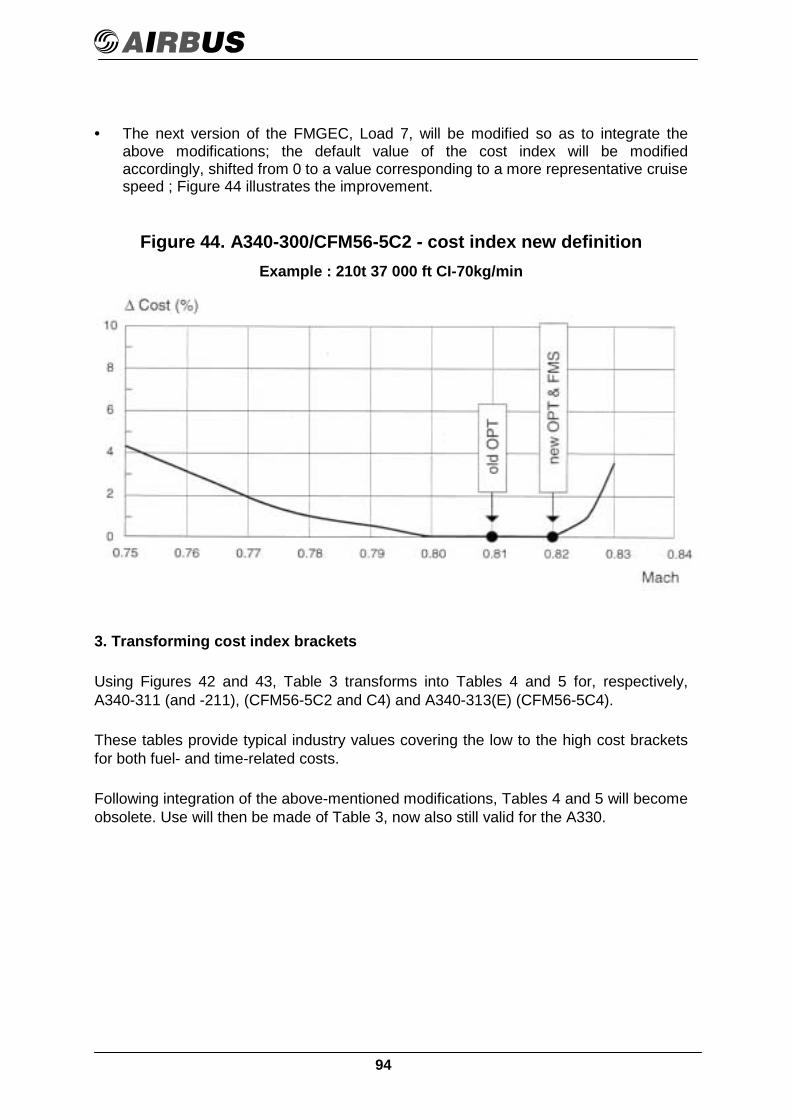
94
• The next version of the FMGEC, Load 7, will be modified so as to integrate theabove modifications; the default value of the cost index will be modifiedaccordingly, shifted from 0 to a value corresponding to a more representative cruisespeed ; Figure 44 illustrates the improvement.
Figure 44. A340-300/CFM56-5C2 - cost index new definitionExample : 210t 37 000 ft CI-70kg/min
3. Transforming cost index brackets
Using Figures 42 and 43, Table 3 transforms into Tables 4 and 5 for, respectively,A340-311 (and -211), (CFM56-5C2 and C4) and A340-313(E) (CFM56-5C4).
These tables provide typical industry values covering the low to the high cost bracketsfor both fuel- and time-related costs.
Following integration of the above-mentioned modifications, Tables 4 and 5 will becomeobsolete. Use will then be made of Table 3, now also still valid for the A330.
95
APPENDIX 4
A340-200 AND -300 CLIMB IAS PRESELECTION PROCEDURES FOR LOAD 6PENDING LOAD 7 RELEASE
The following are the recommended procedures pending the release of FMS Load 7,after which corrected climb speeds will be fully integrated.
1. Aircraft is not in climb phase
• The preselected CLIMB IAS may be entered on the MCDU PERF-CLIMB page onthe PRESEL field. It is displayed in large font.
• The display changes to IAS/MACH and the computed Mach are displayed in smallfont.
2. Aircraft is in climb phase and is in speed manual control
• The selected climb IAS has to be entered on the FCU if it has not been alreadypreselected.
• The MCDU (PERF-CLIMB page) display is a IAS/MACH in accordance with thepreselected IAS entry or with the FCU selection.
• The computed MACH is then displayed in small font.
• Guidance will use the selected IAS and the computed Mach thereafter.
3. Aircraft is in climb phase and in speed auto control
• The PRESEL field of PERF-CLIMB page is blank.
• The selected IAS has to be entered on the FCU and manual mode activated.
• The MCDU (PERF-CLIMB page) display is a IAS/MACH in accordance with theFCU selection.
• The computed MACH is then displayed in small font.
• Guidance will use the selected IAS and the computed Mach thereafter.
Note :
If during climb, a CRZ FL change modifies the climb IAS to introduce (as given by thetables), the new climb IAS has to be entered on the FCU as described in 2. above.
• The following tables are limited by the Max Altitude in ISA condition. However, thespeeds provided are available for any temperature. In ISA deviation conditions,Cruise Altitude has to be limited by the FMGEC MAX Altitude.
• In order to perform minimum distance to climb, green dot should be selectedor an altitude constraint should be inserted on a waypoint in the FMS.
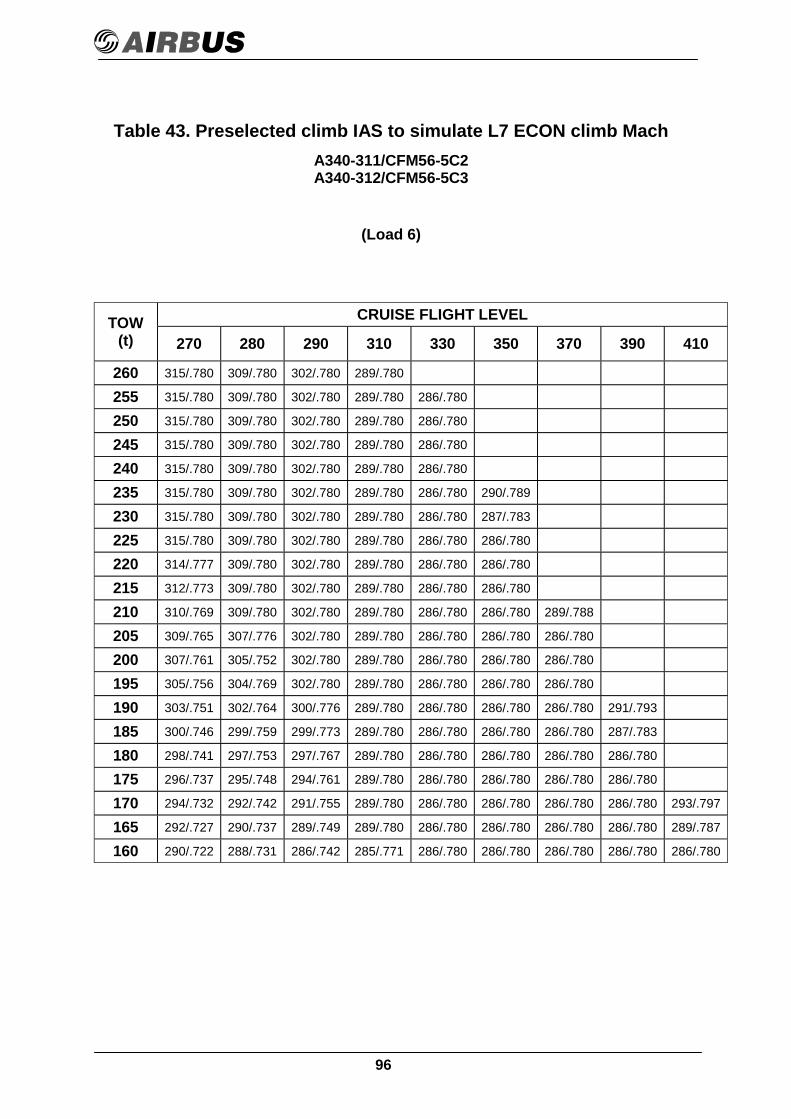
96
Table 43. Preselected climb IAS to simulate L7 ECON climb MachA340-311/CFM56-5C2A340-312/CFM56-5C3
(Load 6)
CRUISE FLIGHT LEVELTOW(t) 270 280 290 310 330 350 370 390 410
260 315/.780 309/.780 302/.780 289/.780
255 315/.780 309/.780 302/.780 289/.780 286/.780
250 315/.780 309/.780 302/.780 289/.780 286/.780
245 315/.780 309/.780 302/.780 289/.780 286/.780
240 315/.780 309/.780 302/.780 289/.780 286/.780
235 315/.780 309/.780 302/.780 289/.780 286/.780 290/.789
230 315/.780 309/.780 302/.780 289/.780 286/.780 287/.783
225 315/.780 309/.780 302/.780 289/.780 286/.780 286/.780
220 314/.777 309/.780 302/.780 289/.780 286/.780 286/.780
215 312/.773 309/.780 302/.780 289/.780 286/.780 286/.780
210 310/.769 309/.780 302/.780 289/.780 286/.780 286/.780 289/.788
205 309/.765 307/.776 302/.780 289/.780 286/.780 286/.780 286/.780
200 307/.761 305/.752 302/.780 289/.780 286/.780 286/.780 286/.780
195 305/.756 304/.769 302/.780 289/.780 286/.780 286/.780 286/.780
190 303/.751 302/.764 300/.776 289/.780 286/.780 286/.780 286/.780 291/.793
185 300/.746 299/.759 299/.773 289/.780 286/.780 286/.780 286/.780 287/.783
180 298/.741 297/.753 297/.767 289/.780 286/.780 286/.780 286/.780 286/.780
175 296/.737 295/.748 294/.761 289/.780 286/.780 286/.780 286/.780 286/.780
170 294/.732 292/.742 291/.755 289/.780 286/.780 286/.780 286/.780 286/.780 293/.797
165 292/.727 290/.737 289/.749 289/.780 286/.780 286/.780 286/.780 286/.780 289/.787
160 290/.722 288/.731 286/.742 285/.771 286/.780 286/.780 286/.780 286/.780 286/.780
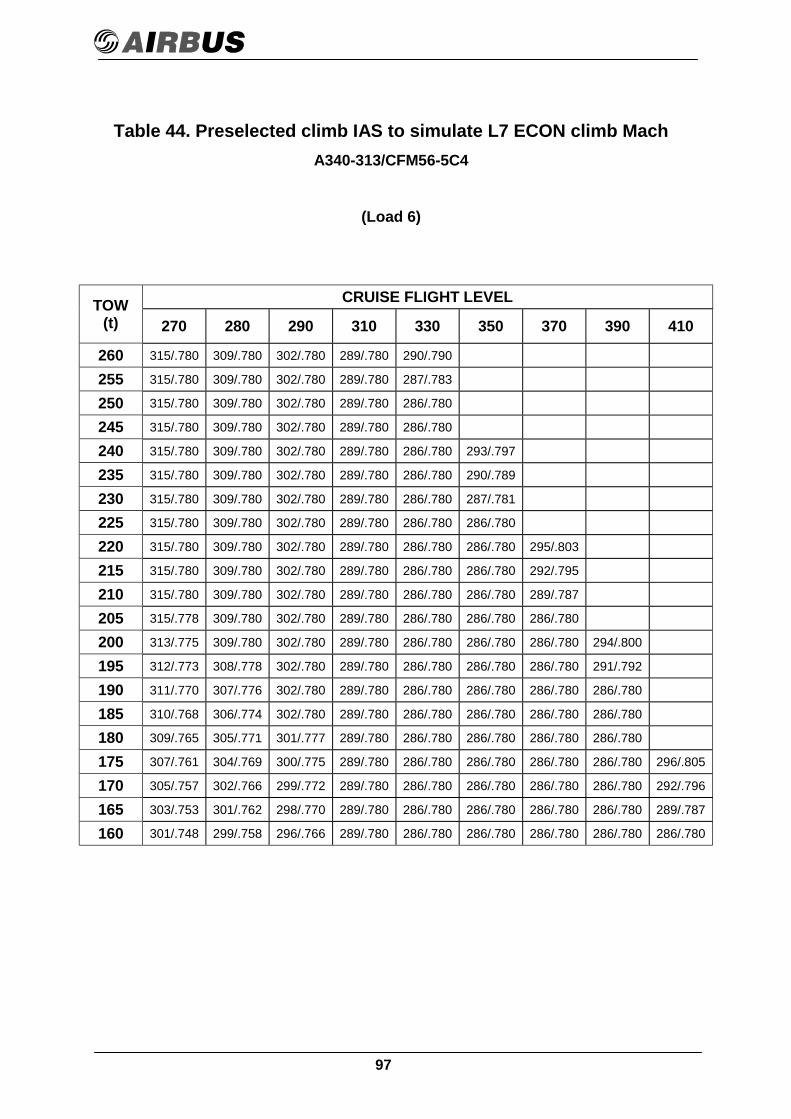
97
Table 44. Preselected climb IAS to simulate L7 ECON climb MachA340-313/CFM56-5C4
(Load 6)
CRUISE FLIGHT LEVELTOW(t) 270 280 290 310 330 350 370 390 410
260 315/.780 309/.780 302/.780 289/.780 290/.790
255 315/.780 309/.780 302/.780 289/.780 287/.783
250 315/.780 309/.780 302/.780 289/.780 286/.780
245 315/.780 309/.780 302/.780 289/.780 286/.780
240 315/.780 309/.780 302/.780 289/.780 286/.780 293/.797
235 315/.780 309/.780 302/.780 289/.780 286/.780 290/.789
230 315/.780 309/.780 302/.780 289/.780 286/.780 287/.781
225 315/.780 309/.780 302/.780 289/.780 286/.780 286/.780
220 315/.780 309/.780 302/.780 289/.780 286/.780 286/.780 295/.803
215 315/.780 309/.780 302/.780 289/.780 286/.780 286/.780 292/.795
210 315/.780 309/.780 302/.780 289/.780 286/.780 286/.780 289/.787
205 315/.778 309/.780 302/.780 289/.780 286/.780 286/.780 286/.780
200 313/.775 309/.780 302/.780 289/.780 286/.780 286/.780 286/.780 294/.800
195 312/.773 308/.778 302/.780 289/.780 286/.780 286/.780 286/.780 291/.792
190 311/.770 307/.776 302/.780 289/.780 286/.780 286/.780 286/.780 286/.780
185 310/.768 306/.774 302/.780 289/.780 286/.780 286/.780 286/.780 286/.780
180 309/.765 305/.771 301/.777 289/.780 286/.780 286/.780 286/.780 286/.780
175 307/.761 304/.769 300/.775 289/.780 286/.780 286/.780 286/.780 286/.780 296/.805
170 305/.757 302/.766 299/.772 289/.780 286/.780 286/.780 286/.780 286/.780 292/.796
165 303/.753 301/.762 298/.770 289/.780 286/.780 286/.780 286/.780 286/.780 289/.787
160 301/.748 299/.758 296/.766 289/.780 286/.780 286/.780 286/.780 286/.780 286/.780
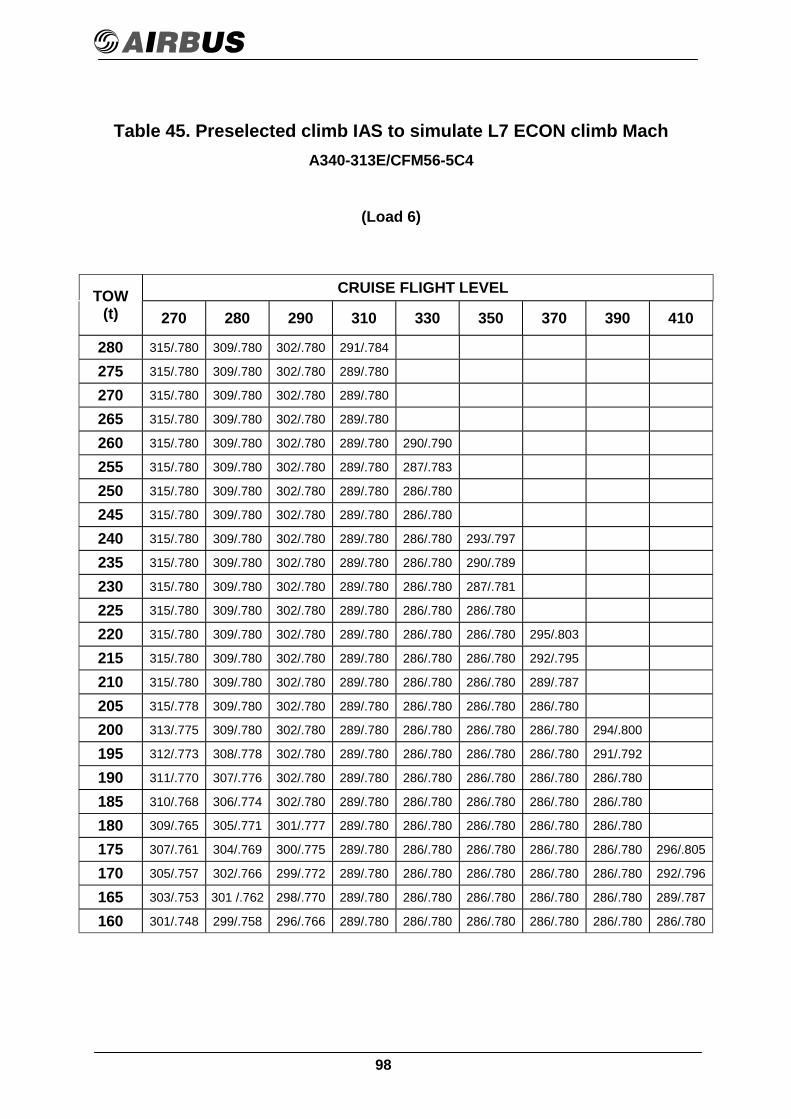
98
Table 45. Preselected climb IAS to simulate L7 ECON climb MachA340-313E/CFM56-5C4
(Load 6)
CRUISE FLIGHT LEVELTOW(t) 270 280 290 310 330 350 370 390 410
280 315/.780 309/.780 302/.780 291/.784
275 315/.780 309/.780 302/.780 289/.780
270 315/.780 309/.780 302/.780 289/.780
265 315/.780 309/.780 302/.780 289/.780
260 315/.780 309/.780 302/.780 289/.780 290/.790
255 315/.780 309/.780 302/.780 289/.780 287/.783
250 315/.780 309/.780 302/.780 289/.780 286/.780
245 315/.780 309/.780 302/.780 289/.780 286/.780
240 315/.780 309/.780 302/.780 289/.780 286/.780 293/.797
235 315/.780 309/.780 302/.780 289/.780 286/.780 290/.789
230 315/.780 309/.780 302/.780 289/.780 286/.780 287/.781
225 315/.780 309/.780 302/.780 289/.780 286/.780 286/.780
220 315/.780 309/.780 302/.780 289/.780 286/.780 286/.780 295/.803
215 315/.780 309/.780 302/.780 289/.780 286/.780 286/.780 292/.795
210 315/.780 309/.780 302/.780 289/.780 286/.780 286/.780 289/.787
205 315/.778 309/.780 302/.780 289/.780 286/.780 286/.780 286/.780
200 313/.775 309/.780 302/.780 289/.780 286/.780 286/.780 286/.780 294/.800
195 312/.773 308/.778 302/.780 289/.780 286/.780 286/.780 286/.780 291/.792
190 311/.770 307/.776 302/.780 289/.780 286/.780 286/.780 286/.780 286/.780
185 310/.768 306/.774 302/.780 289/.780 286/.780 286/.780 286/.780 286/.780
180 309/.765 305/.771 301/.777 289/.780 286/.780 286/.780 286/.780 286/.780
175 307/.761 304/.769 300/.775 289/.780 286/.780 286/.780 286/.780 286/.780 296/.805
170 305/.757 302/.766 299/.772 289/.780 286/.780 286/.780 286/.780 286/.780 292/.796
165 303/.753 301 /.762 298/.770 289/.780 286/.780 286/.780 286/.780 286/.780 289/.787
160 301/.748 299/.758 296/.766 289/.780 286/.780 286/.780 286/.780 286/.780 286/.780
99
APPENDIX 5
A320 / A330 / A340 Families – Optimum Mach Number
The following appendix exemplifies how the Optimum Mach Number is presented inFCOM tables versus cost index (0, 100, 200, 300, 400, 500kg/min) altitude and wind ascalculated by the FMGC. The examples here pertain to the A340-313E and are found inFCOM 3.05.15 pages 1 thru 5.
Cruise tables are established :
- for ISA, ISA + 10, ISA + 15 and ISA + 20- with normal air conditioning and anti-ice off- from FL 290 to FL 410 at M 0.80, 0.82 and 0.84- from FL 100 to FL 410 at long range speed- with a 30% center of gravity below 2500ft and a 37% center of gravity at higher
altitudes.
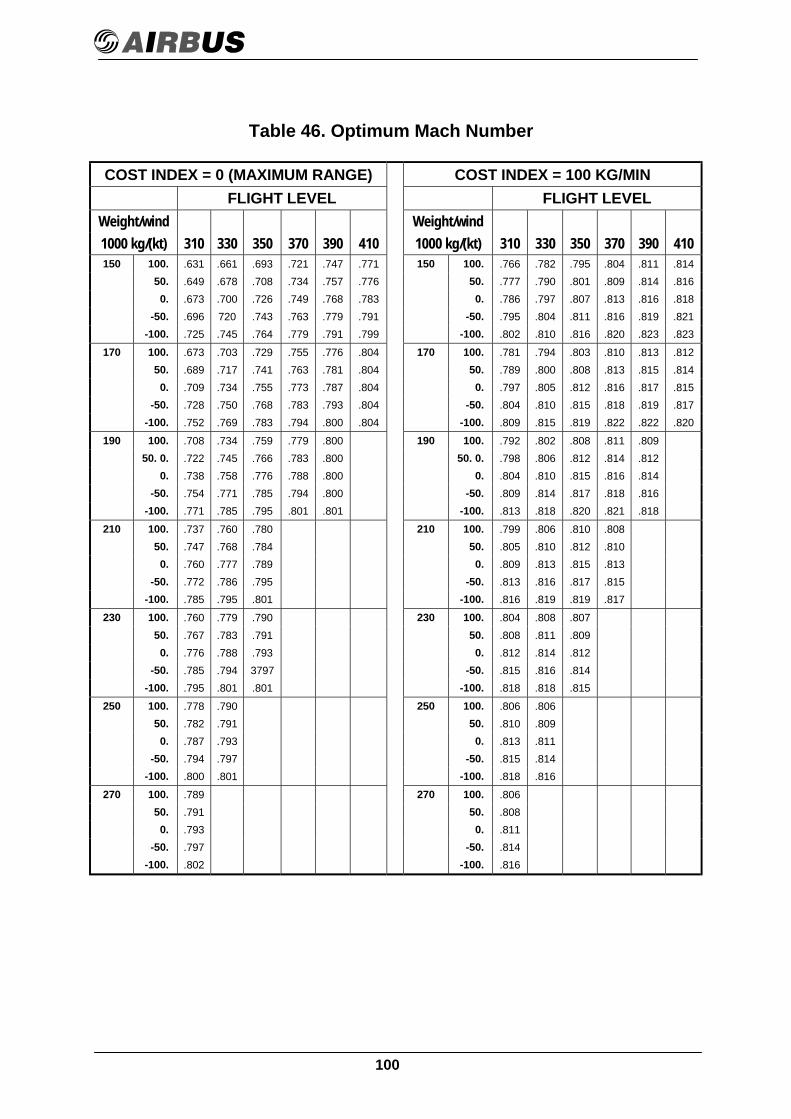
100
Table 46. Optimum Mach Number
COST INDEX = 0 (MAXIMUM RANGE) COST INDEX = 100 KG/MINFLIGHT LEVEL FLIGHT LEVEL
Weight/wind Weight/wind1000 kg/(kt) 310 330 350 370 390 410 1000 kg/(kt) 310 330 350 370 390 410150 100. .631 .661 .693 .721 .747 .771 150 100. .766 .782 .795 .804 .811 .814
50. .649 .678 .708 .734 .757 .776 50. .777 .790 .801 .809 .814 .8160. .673 .700 .726 .749 .768 .783 0. .786 .797 .807 .813 .816 .818
-50. .696 720 .743 .763 .779 .791 -50. .795 .804 .811 .816 .819 .821-100. .725 .745 .764 .779 .791 .799 -100. .802 .810 .816 .820 .823 .823
170 100. .673 .703 .729 .755 .776 .804 170 100. .781 .794 .803 .810 .813 .81250. .689 .717 .741 .763 .781 .804 50. .789 .800 .808 .813 .815 .8140. .709 .734 .755 .773 .787 .804 0. .797 .805 .812 .816 .817 .815
-50. .728 .750 .768 .783 .793 .804 -50. .804 .810 .815 .818 .819 .817-100. .752 .769 .783 .794 .800 .804 -100. .809 .815 .819 .822 .822 .820
190 100. .708 .734 .759 .779 .800 190 100. .792 .802 .808 .811 .80950. 0. .722 .745 .766 .783 .800 50. 0. .798 .806 .812 .814 .812
0. .738 .758 .776 .788 .800 0. .804 .810 .815 .816 .814-50. .754 .771 .785 .794 .800 -50. .809 .814 .817 .818 .816
-100. .771 .785 .795 .801 .801 -100. .813 .818 .820 .821 .818210 100. .737 .760 .780 210 100. .799 .806 .810 .808
50. .747 .768 .784 50. .805 .810 .812 .8100. .760 .777 .789 0. .809 .813 .815 .813
-50. .772 .786 .795 -50. .813 .816 .817 .815-100. .785 .795 .801 -100. .816 .819 .819 .817
230 100. .760 .779 .790 230 100. .804 .808 .80750. .767 .783 .791 50. .808 .811 .8090. .776 .788 .793 0. .812 .814 .812
-50. .785 .794 3797 -50. .815 .816 .814-100. .795 .801 .801 -100. .818 .818 .815
250 100. .778 .790 250 100. .806 .80650. .782 .791 50. .810 .8090. .787 .793 0. .813 .811
-50. .794 .797 -50. .815 .814-100. .800 .801 -100. .818 .816
270 100. .789 270 100. .80650. .791 50. .8080. .793 0. .811
-50. .797 -50. .814-100. .802 -100. .816
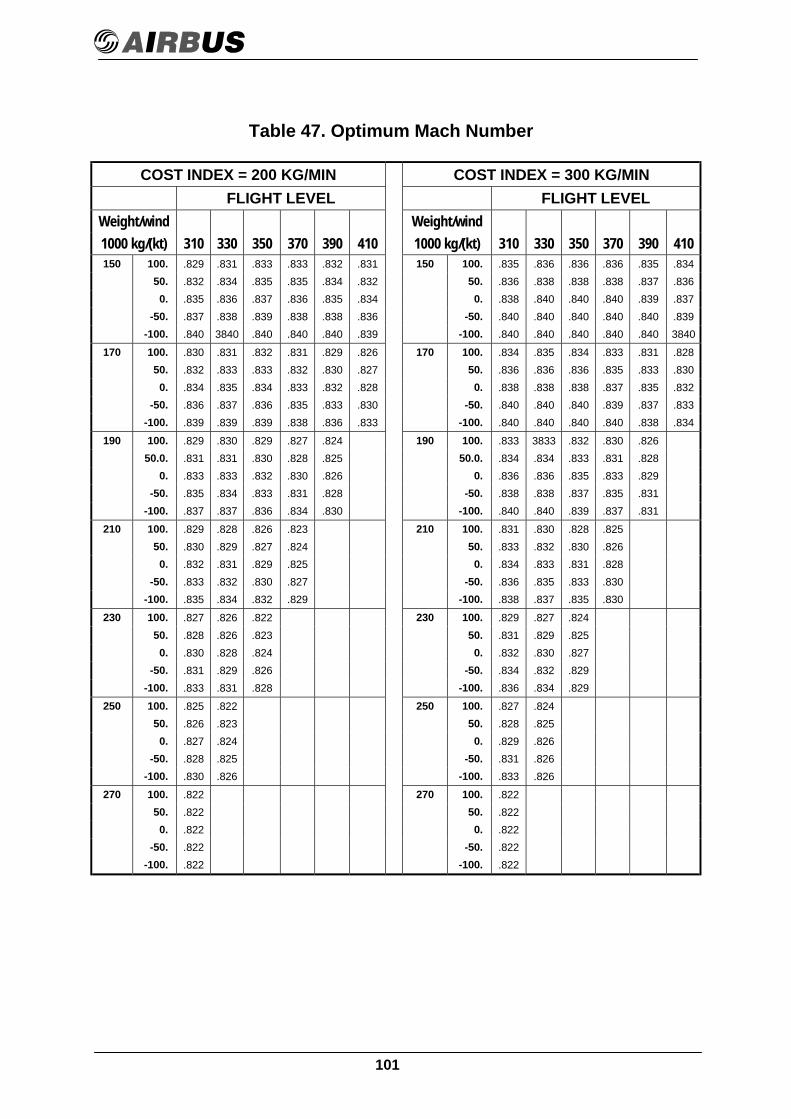
101
Table 47. Optimum Mach Number
COST INDEX = 200 KG/MIN COST INDEX = 300 KG/MINFLIGHT LEVEL FLIGHT LEVEL
Weight/wind Weight/wind1000 kg/(kt) 310 330 350 370 390 410 1000 kg/(kt) 310 330 350 370 390 410150 100. .829 .831 .833 .833 .832 .831 150 100. .835 .836 .836 .836 .835 .834
50. .832 .834 .835 .835 .834 .832 50. .836 .838 .838 .838 .837 .8360. .835 .836 .837 .836 .835 .834 0. .838 .840 .840 .840 .839 .837
-50. .837 .838 .839 .838 .838 .836 -50. .840 .840 .840 .840 .840 .839-100. .840 3840 .840 .840 .840 .839 -100. .840 .840 .840 .840 .840 3840
170 100. .830 .831 .832 .831 .829 .826 170 100. .834 .835 .834 .833 .831 .82850. .832 .833 .833 .832 .830 .827 50. .836 .836 .836 .835 .833 .8300. .834 .835 .834 .833 .832 .828 0. .838 .838 .838 .837 .835 .832
-50. .836 .837 .836 .835 .833 .830 -50. .840 .840 .840 .839 .837 .833-100. .839 .839 .839 .838 .836 .833 -100. .840 .840 .840 .840 .838 .834
190 100. .829 .830 .829 .827 .824 190 100. .833 3833 .832 .830 .82650.0. .831 .831 .830 .828 .825 50.0. .834 .834 .833 .831 .828
0. .833 .833 .832 .830 .826 0. .836 .836 .835 .833 .829-50. .835 .834 .833 .831 .828 -50. .838 .838 .837 .835 .831
-100. .837 .837 .836 .834 .830 -100. .840 .840 .839 .837 .831210 100. .829 .828 .826 .823 210 100. .831 .830 .828 .825
50. .830 .829 .827 .824 50. .833 .832 .830 .8260. .832 .831 .829 .825 0. .834 .833 .831 .828
-50. .833 .832 .830 .827 -50. .836 .835 .833 .830-100. .835 .834 .832 .829 -100. .838 .837 .835 .830
230 100. .827 .826 .822 230 100. .829 .827 .82450. .828 .826 .823 50. .831 .829 .8250. .830 .828 .824 0. .832 .830 .827
-50. .831 .829 .826 -50. .834 .832 .829-100. .833 .831 .828 -100. .836 .834 .829
250 100. .825 .822 250 100. .827 .82450. .826 .823 50. .828 .8250. .827 .824 0. .829 .826
-50. .828 .825 -50. .831 .826-100. .830 .826 -100. .833 .826
270 100. .822 270 100. .82250. .822 50. .8220. .822 0. .822
-50. .822 -50. .822-100. .822 -100. .822
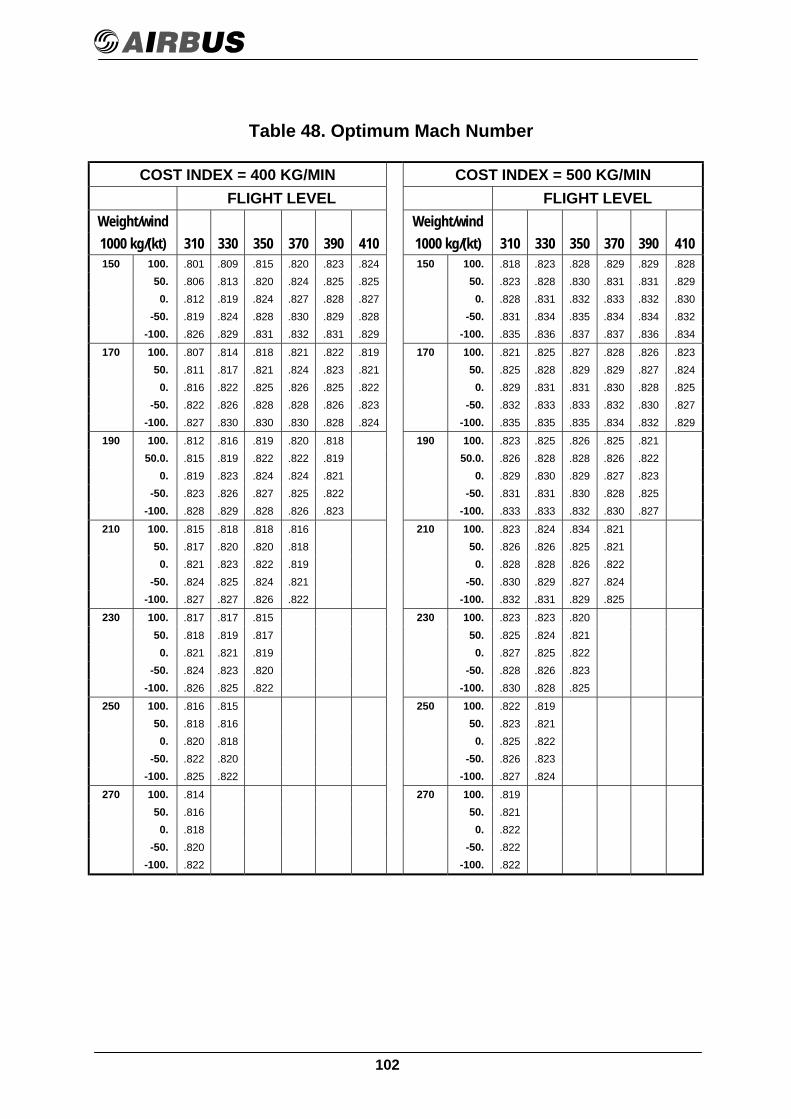
102
Table 48. Optimum Mach Number
COST INDEX = 400 KG/MIN COST INDEX = 500 KG/MINFLIGHT LEVEL FLIGHT LEVEL
Weight/wind Weight/wind1000 kg/(kt) 310 330 350 370 390 410 1000 kg/(kt) 310 330 350 370 390 410150 100. .801 .809 .815 .820 .823 .824 150 100. .818 .823 .828 .829 .829 .828
50. .806 .813 .820 .824 .825 .825 50. .823 .828 .830 .831 .831 .8290. .812 .819 .824 .827 .828 .827 0. .828 .831 .832 .833 .832 .830
-50. .819 .824 .828 .830 .829 .828 -50. .831 .834 .835 .834 .834 .832-100. .826 .829 .831 .832 .831 .829 -100. .835 .836 .837 .837 .836 .834
170 100. .807 .814 .818 .821 .822 .819 170 100. .821 .825 .827 .828 .826 .82350. .811 .817 .821 .824 .823 .821 50. .825 .828 .829 .829 .827 .8240. .816 .822 .825 .826 .825 .822 0. .829 .831 .831 .830 .828 .825
-50. .822 .826 .828 .828 .826 .823 -50. .832 .833 .833 .832 .830 .827-100. .827 .830 .830 .830 .828 .824 -100. .835 .835 .835 .834 .832 .829
190 100. .812 .816 .819 .820 .818 190 100. .823 .825 .826 .825 .82150.0. .815 .819 .822 .822 .819 50.0. .826 .828 .828 .826 .822
0. .819 .823 .824 .824 .821 0. .829 .830 .829 .827 .823-50. .823 .826 .827 .825 .822 -50. .831 .831 .830 .828 .825
-100. .828 .829 .828 .826 .823 -100. .833 .833 .832 .830 .827210 100. .815 .818 .818 .816 210 100. .823 .824 .834 .821
50. .817 .820 .820 .818 50. .826 .826 .825 .8210. .821 .823 .822 .819 0. .828 .828 .826 .822
-50. .824 .825 .824 .821 -50. .830 .829 .827 .824-100. .827 .827 .826 .822 -100. .832 .831 .829 .825
230 100. .817 .817 .815 230 100. .823 .823 .82050. .818 .819 .817 50. .825 .824 .8210. .821 .821 .819 0. .827 .825 .822
-50. .824 .823 .820 -50. .828 .826 .823-100. .826 .825 .822 -100. .830 .828 .825
250 100. .816 .815 250 100. .822 .81950. .818 .816 50. .823 .8210. .820 .818 0. .825 .822
-50. .822 .820 -50. .826 .823-100. .825 .822 -100. .827 .824
270 100. .814 270 100. .81950. .816 50. .8210. .818 0. .822
-50. .820 -50. .822-100. .822 -100. .822
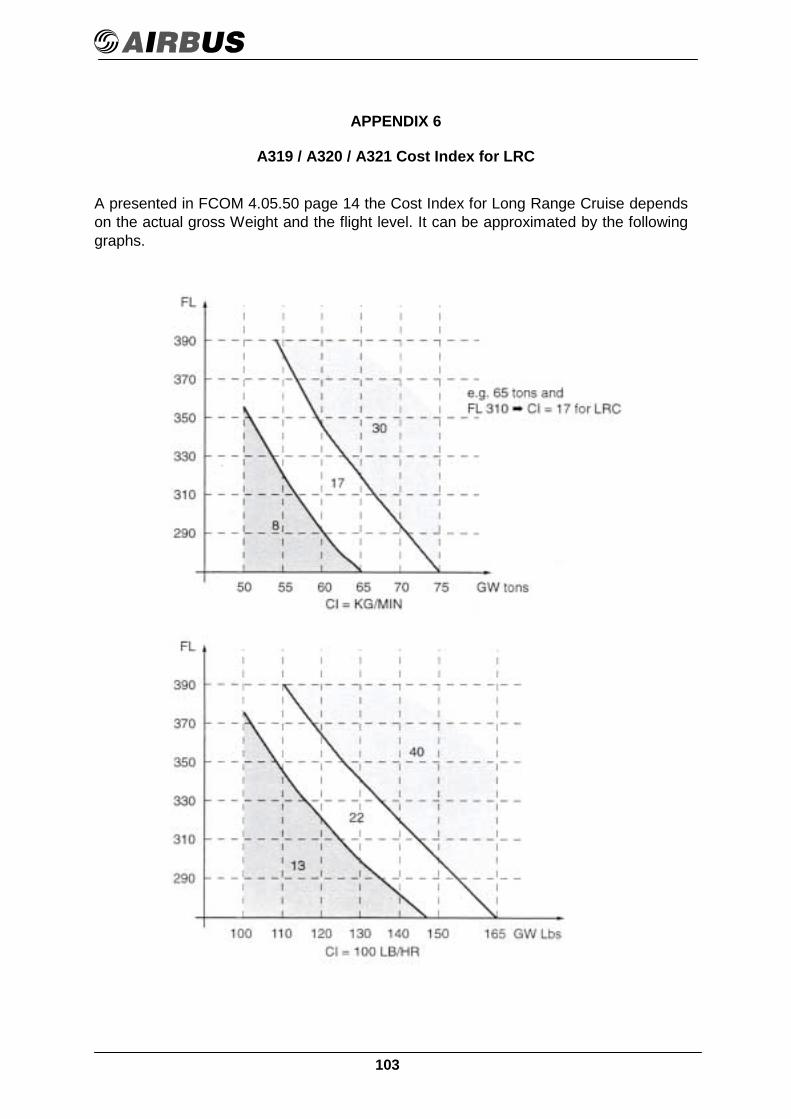
103
APPENDIX 6
A319 / A320 / A321 Cost Index for LRC
A presented in FCOM 4.05.50 page 14 the Cost Index for Long Range Cruise dependson the actual gross Weight and the flight level. It can be approximated by the followinggraphs.

AIRBUS S.A.S.31707 BLAGNAC CEDEX - FRANCE
CONCEPT DESIGN SCM12REFERENCE SCM-A297
AUGUST 2002PRINTED IN FRANCE© AIRBUS S.A.S. 2002
ALL RIGHTS RESERVED
AN EADS JOINT COMPANY WITH BAE SYSTEMS
AIRBUS
The statements made herein do not constitute anoffer. They are based on the assumptions shownand are expressed in good faith. Where thesupporting grounds for these statements are notshown, the Company will be pleased to explainthe basis thereof. This document is the propertyof Airbus and is supplied on the expresscondition that it is to be treated as confidential.No use of reproduction may be made thereofother than that expressely authorised.
getting to grips with the
cost indexIssue II - May 1998
Flight Operations Support & Line Assistance
Flig
ht O
pera
tions
Sup
port
& L
ine
Ass
ista
nce
g
ettin
g to
grip
s w
ith th
e co
st in
dex
Issu
e II
- M
ay 1
998
Related Documents
![Getting to Grips With Aircraft Performance[1]](https://static.cupdf.com/doc/110x72/5527fe374a795967508b45d0/getting-to-grips-with-aircraft-performance1.jpg)